
Longitudinal Relationships between Caloric Expenditure and Gray Matter in the Cardiovascular Health Study
Abstract
Background: Physical activity (PA) can be neuroprotective and reduce the risk for Alzheimer’s disease (AD). In assessing physical activity, caloric expenditure is a proxy marker reflecting the sum total of multiple physical activity types conducted by an individual.
Objective:To assess caloric expenditure, as a proxy marker of PA, as a predictive measure of gray matter (GM) volumes in the normal and cognitively impaired elderly persons.
Methods: All subjects in this study were recruited from the Institutional Review Board approved Cardiovascular Health Study (CHS), a multisite population-based longitudinal study in persons aged 65 and older. We analyzed a sub-sample of CHS participants 876 subjects (mean age 78.3, 57.5% F, 42.5% M) who had i) energy output assessed as kilocalories (kcal) per week using the standardized Minnesota Leisure-Time Activities questionnaire, ii) cognitive assessments for clinical classification of normal cognition, mild cognitive impairment (MCI), and AD, and iii) volumetric MR imaging of the brain. Voxel-based morphometry modeled the relationship between kcal/week and GM volumes while accounting for standard covariates including head size, age, sex, white matter hyperintensity lesions, MCI or AD status, and site. Multiple comparisons were controlled using a False Discovery Rate of 5 percent.
Results: Higher energy output, from a variety of physical activity types, was associated with larger GM volumes in frontal, temporal, and parietal lobes, as well as hippocampus, thalamus, and basal ganglia. High levels of caloric expenditure moderated neurodegeneration-associated volume loss in the precuneus, posterior cingulate, and cerebellar vermis.
Conclusion:Increasing energy output from a variety of physical activities is related to larger gray matter volumes in the elderly, regardless of cognitive status.
INTRODUCTION
The global population is aging. In line with an aging population is a rise in associated chronicdiseases. The number of older persons (aged≥60 years) globally is expected to more than double, from 841 million people in 2013 to more than 2 billion in 2050 [1]. As of 2013, there were an estimated 44.4 million people worldwide with dementia [2]. This number will increase to an estimated 75.6 million in 2030, and 135.5 million in 2050. Unfortunately for those with Alzheimer’s disease (AD), pharmacological agents temporarily treat symptoms without having an effect on the underlying pathophysiology of the disease. Conventional treatments for dementia are limited, therefore innovative treatment and prevention strategies are required.
A growing number of studies have investigated physical activity as a means of reducing risk for cognitive decline and AD. One randomized clinical trial showed that in persons with subjective memory impairment, a 6-month program of home-based physical activity reduced cognitive decline over a subsequent 18-month period [3]. In a separate, prospective cohort study, physical activity was independently linked to reduced risk for AD [4]. Physical activity, however, declines with age, such that 54% of men and 66% of women age 75 and older engage in no leisure-time physical activity [5]. Importantly, this decrease in physical activity occurs when this population is at risk for dementia, namely AD [6].
Several lines of evidence suggest that sedentary behavior may be a risk factor for the development of age-related cognitive impairment. A recent review [7] summarizes evidence to suggest that approximately 13% of AD cases worldwide may be attributable to sedentary behavior. A 25% reduction in sedentary behavior could potentially prevent more than 1 million AD cases globally. From a mechanistic perspective, sedentary behaviors may contribute to risk of AD and dementia by two main factors [7, 8]. First, they are associated with increased cardiovascular and metabolic risk factors, such as diabetes, hypertension, and obesity [9], which are associated with increased risk of dementia [10, 11]. Second, sedentary behaviors appear to have direct effects on neurobiological processes. A recent review [12] outlines evidence to suggest that sedentary behavior may have detrimental effects on the brain via reducing neurogenesis, synaptic plasticity, neurotrophin production, angiogenesis, and by increasing inflammation.
Neuroimaging in humans has also demonstrated the benefits of physical activity on the brain. Higher levels of physical activity reduce brain atrophy [13, 14] and improve cognitive function [15] in cognitively normal elderly individuals. Persons who attain increased brain structure in relation to physical activity are also less likely to develop mild cognitive impairment (MCI) or AD by 2-fold [16, 17]. Additionally, a randomized clinical trial showed that exercise training increases anterior hippocampal volume by 2%, and this volume increase corresponds to higher serum levels of BDNF and improved spatial memory [18], a type of memory that is affected early on by AD. We are aware of one study exploring hippocampal biomarkers (blood flow) in sedentary older adults [19]. This data suggest that the relationship between cerebral blood flow and sedentary time is different in APOE ɛ4 carriers and noncarriers and that sedentary time may act as a behavioral risk factor for cerebral blood flow dysregulation in those at genetic risk for developing AD.
While these studies collectively suggest the importance of physical activity in promoting brain health and reducing risk for AD, several important questions remain, namely: i) what is the effect of physical activity on gray matter (GM) volumes in the elderly, and ii) what is the threshold of energy expenditure needed to increase volume of brain structures relevant for cognition, such as the hippocampus? Moreover, iii) how does an increase in physical activity over time change brain structure, and iv) how is pre-existing AD pathology moderated by an increase in physical activity? The purpose of this study was to investigatethese questions using neuroimaging data from a multi-site community cohort.
SUBJECTS AND METHODS
Participants
The CHS-CS is derived from the larger multi-site Cardiovascular Health Study, a population-based longitudinal study of coronary heart disease and stroke in persons aged 65 and older [20]. CHS recruitment was based on the Medicare eligibility lists in: Forsyth County, North Carolina; Sacramento County, California; Washington County, Maryland; and Pittsburgh, Pennsylvania. The CHS enrolled 5201 participants in 1989-90 and an additional 687 African American participants in 1992-93. The selection for enrollment into the CHS was not based on cognitive status. The Institutional Review Board at each site approved the study methods, and all participants gave written informed consent. Each year, the participants completed the Modified Mini-Mental State Examination (3MSE) [21], the Digit Symbol Substitution Test (DSST) [22], the Benton Visual Retention Test (BVRT) [23, 24], and the modified version of the Center for Epidemiology Studies Depression Scale (CES-D) [25].
The CHS memory study
In 1991/1992, 3608 of the CHS participants underwent a magnetic resonance image (MRI) of the brain. In 1998-99, the CHS rescanned all available, living participants and completed neurobehavioral evaluations on them (N = 2101) (See [26] for details). Information on participants’ cognition was obtained from their proxies using the Informant Questionnaire for Cognitive Decline in the Elderly (IQ CODE) [27] and the dementia questionnaire (DQ) [28]. Complete neurological and neuropsychological evaluations were conducted in “high risk” participants, subjects who had at least one of the following characteristics: 1) 3MSE score < 80, 2) a change in 3MSE > 5 points from baseline to last contact, 3) IQ-CODE score≥3.2, 4) living in a nursing home, 5) incident strokes, 6) dementia diagnosis in medical records, 7) telephone Interview for Cognitive Status (TICS) score < 28 [29], or 8) were African-American. High-risk subjects were examined in three sites (Hagerstown, Sacramento, and Winston-Salem); the Pittsburgh site examined all participants. The results were adjudicated for presence of any disorder that could affect cognition.
Diagnostic classification
In 1998/99, an Adjudication Committee comprised of experts in dementia diagnosis classified participants as having normal cognition, MCI [30], or a dementia syndrome including subtypes. The Adjudication Committee had access to the historical CHS cognitive test scores, primarily the 3MSE (and subscales), BVRT, and the DSST, as well as: CES-D scores, vision and hearing testing, history of alcohol intake, activities of daily living questionnaire, IQ-CODE, DQ, vital status, date of death, history of hospitalizations, treatments and drugs to treat dementia, results of the current neuropsychological assessment, initial and follow-up MRI scans, neurological examination, and the Neuropsychiatric Inventory [31].
Due to the late inclusion of the Spoiled Gradient Recall (SPGR) sequence into the scanning protocol, not all participants had high-resolution anatomical imaging. Additionally, not all subjects had all variable information on physical activity and other variables used in our investigation. Thus, the present study includes only the data from the 876 CHS-CS participants who were cognitively evaluated in 1998/99, had an SPGR scan whose MRI data met quality control standards and for whom all other variables such as physical activity were available for analysis. Subject demographics are presented in Table 1.
Physical activity assessments
Physical activity in the CHS was evaluated with the standardized and validated Minnesota Leisure-Time Activities questionnaire to calculate kilocalories per week [32–35]. This metric was generated by frequency and duration of time spent in 15 different leisure-time activities over the previous two weeks. These activities consist of swimming, hiking, aerobics, jogging, tennis, racquetball, walking, gardening, mowing, raking, golfing, bicycling, dancing, calisthenics, and riding an exercise cycle. In the CHS, kilocalorie data based upon the questionnaire was calculated at baseline in 1989/1998 and at the time MRI scans were analyzed in this study [32, 36]. For our investigation, kilocalories were binned into quartiles.
Structural MR imaging
MRI scanning was completed at each of the foursites using 1.5 Tesla scanners, as detailed elsewhere [37, 38]. Briefly, the scanning protocol used in 1991/94 and 1998/99 included a sagittal T1-weighted localizer sequence, axial T1-weighted spin-density and T2-weighted images. Axial images were 5 mm thick without interslice gaps [37]. At all sites, a 3-D volumetric T1 weighted SPGR sequence was obtained in 1998/99, covering the whole brain (TE/TR = 5/25, flip angle = 40, NEX = 1, slice thickness = 1.5 mm/0 mm interslice gap), with an in-plane acquisition matrix of 256×256×124 image elements, 250×250 mm field of view and an in-plane voxel size of 0.98 mm3.
Neuroradiologists at a central reading center, who were blinded to the clinical characteristics of the CHS participants, identified infarcts on T2-weighted images (defined as any area of abnormal signal change of 3 mm or greater in diameter [39, 40]). They also estimated white matter, ventricular, and sulcal integrity using a 10-point standardized CHS visual grading system, ranging from 0 (normal) to 9 (mostly abnormal). White matter grades (WMGs) were based on the total extent of subcortical and periventricular hyperintensities on either axial T2 weighted or spin-density images, and a WMG of 3 was used to classify small vessel ischemic disease. The scale has been validated against white matter hyperintensity volume normalized for total cerebral parenchyma (See Appendix in [41]).
Imaging data analysis
Our voxel-based morphometry (VBM) pipeline is described more extensively in prior work [16, 42].To improve scan quality, we reduced 3-D non-linear noise with the Smallest Univalue Assimilating Nucleus from the FMRI Software Library (FSL) [43]. Images were then stripped of the skull and scalp with The Brain Extraction Tool from FSL to help improve the accuracy of brain tissue segmentation [43]. We used VBM2 (http://dbm.neuro.uni-jena.de/vbm/) in the Statistical Parametric Mapping (SPM2) software package, running in MATLAB version 7.4 (The MathWorks, Natick, MA, USA). We normalized all images using a 12-parameter affine transformation and non-linear registration with 16 non-linear iterations to the custom Pittsburgh Elderly Template (419 brains: Mean age 69; 205 men, 214 women [44]). Images were then visually inspected to ensure that no major registration errors had occurred and none were identified.
All images were normalized and modulated tovolumetric units by multiplying all the post-normalization/segmentation values by the inverse of the Jacobian determinant of their spatial transformation matrix. This step corrected for any changes in the size of the individual voxels during the normalization. Each image was then segmented into GM, white matter, and cerebrospinal fluid, including a hidden Markov random field threshold of 0.3 to remove isolated voxels of one tissue type that are unlikely to reside in that particular area. Total intracranial volume, including subarachnoid space, was computed by summing GM, white matter, and cerebrospinal fluid volumes.
All images were smoothed using a 3-D Gaussian kernel (10 mm at full width at half maximum) to reduce the effects of registration errors and to render the data amenable to parametric statistical analysis. In the final step, all scans were masked to exclude non-gray matter voxels from the statistical search space.
Voxel-based statistical modeling
Model 1: The main effect of physical activity on GM volume
A voxel-level, whole brain multiple regression model was constructed in SPM2 to first examine the relationship between physical activity and GMvolume. The kilocalories measurement was coded by quartiles. The covariates in this and in all other models were total intracranial volume, age, sex, WMG, body mass index, MCI or AD status, and indicator variables designating the “site” of the scan to account for center-to-center variation. A False Discovery Rate (FDR) threshold (p < 0.05) was applied to account for multiple comparisons [45] for all models. No extent thresholds were applied as to identify subtle as well as large areas of main effects.
Model 2: The main effect of high magnitude physical activity on GM volume
In this model, we examined the main effect of the top quartile of physical activity on GM volume to determine if a threshold effect for physical activity could be established. The quartiles of physical activity were recoded into a binary status variable as follows: Those subjects in the top quartile of physical activity based upon the kilocalories were designated as “1”; all other quartiles received a “0” classification. Separate interaction analysis models between the top quartile metric, education and race were performed to ensure that the main effect of high magnitude physical activity did not change as a function of these variables.
Model 3: The main effect of change in physical activity on GM volume
This model investigated potential relationships between longitudinal changes in physical activity and GM volume. Kilocalories from CHS study baseline were subtracted from those calculated at time of brain MRI. The subsequent number was binned into quartiles and modeled in VBM.
Model 4: Moderation of physical activity by cognitive diagnosis on GM volume
We modeled the interaction between the top physical activity quartile of kilocalorie measurements at the time of MRI (e.g., the independent variable in Model 2) and cognitive diagnosis in SPM2, to determine if the atrophic effects of neurodegeneration on GM volume are moderated by high magnitude physical activity [46]. We multiplied the two binary variables by each other to produce an interaction term representing persons with MCI or AD who were also in the top quartile of physical activity at time of scan. This interaction term was coded as a contrast vector weight of +1 in SPM to determine whether such persons have larger GM volumes.
The results of the analyses were projected onto the standard single subject Montreal Neurological Institute (MNI) template [47] for display purposes. When projecting onto cardinal sections, we expressed our results as partial correlations (i.e., rp images) to obtain a better visual representation of the effect size [48].
Conversion to MCI or AD
Using the Volumes tool of SPM, we computed eigenvariates from Models 1–3 to quantify the main effect of physical activity in brain areas at risk for neurodegeneration on a region-by-region level. Because of their exquisite vulnerability to AD pathology, we focused specifically on the hippocampus and precuneus and binned the main effect of physical activity on these regions into quartiles. We then used these variables as predictor variables in logistic regression models to determine if the neuroprotective benefits of physical activity reduced risk for conversion to MCI or AD 5 years after scan. Because such longitudinal cognitive data exists only in the Pittsburgh branch of the CHS [30, 49], we restricted our analysis to the 326 subjects with this information. Covariates in this analysis were age, gender, education, race, WMG, MRI infarcts, and APOE4 status.
RESULTS
Table 1 shows the demographic information of the subjects involved in this study, grouped by study site.
Model 1: Main effect of physical activity on GM Volume
The main effect of high magnitude physical activity on total gray matter volume did not vary as a function of race, t(862) = 0.12, p = 0.91, with covariates being age, gender, head size, education, cognitive diagnosis, site, obesity, and WMG. The main effect of physical activity also did not vary as a function of education in a multiple regression model with identical covariates, t(862) = 0.26, p = 0.79.
Figure 1A displays the main effect of physical activity as quantified by kilocalories per week on gray matter volume, projected onto the standard single subject MNI template. The hotter colors reflect areas of the brain that are larger in gray matter volume as a function of greater physical activity in increasing kcal per week. Areas of the brain that benefit from increased levels of physical activity are the bilateral frontal, temporal, and parietal lobes. Figure 1B shows orthogonal slices onto which the same main effects are overlaid. Hotter colors denote a stronger effect and the cross hairs highlight the main effect of physical activity in the right hippocampus, with images in neurological convention with right-sided findings located on the right side of the image.
Model 2: Main effect of high magnitude physical activity on gray matter volume
Figure 2 shows the main effect of the top quartile of physical activity as assessed by the top quartile of kcal measurements. The crosshairs point to a cluster of voxels denoting higher gray matter volumes in the top quartile group in the left precuneus, extending into the left lingual gyrus. A smaller cluster is seen in the same regions on the right lingual gyrus and precuneus.
Model 3: The main effect of change in physical activity on GM volume
The results of this model regressed the change in kilocalories obtained at the time of scan and study baseline against gray matter volume at a voxel by voxel level. Figure 3 displays these results. Areas that demonstrated more gray matter volume with increased physical activity over time include the left inferior orbital frontal cortex (–29, 25, –23) and left precuneus (–13, –63, 71).
Model 4: Moderation of physical activity by cognitive diagnosis on GM volume
The results of this model are displayed in Fig. 4. This graphic shows the interaction overlayed onto the left hippocampus (crosshairs) and cerebellar vermis (arrow).
Reduced cognitive decline
Three clusters were isolated from the VBM analysis in the precuneus (–11, –53, 23), the hippocampus (–15, –39, –5) and the orbital frontal cortex (–29, 23, –27) and inputted into logistic regression models as described in the methods section. The Odds Ratios for reduction of cognitive decline for these regions were statistically significant for the precuneus (O.R. = 2.1, p = 0.02) and the orbital frontal cortex (O.R. = 2.2, p = 0.03) and trended toward significant for the hippocampus (O.R. = 2, p = 0.05).
DISCUSSION
Physical activity is hypothesized to be a preventive measure for multiple diseases, including those of the brain [15, 50, 51]. This study further investigates the impact of physical activity, measured by energy expenditure, on GM volumes, volumes of specific brain structures involved in cognition, and moderation of pre-existing AD pathology. We found that the bilateral frontal, temporal, and parietal lobes associates with higher physical activity. With an increase in physical activity over time, the left inferior orbital frontal cortex and left precuneus also associate with larger GM volumes. High magnitude physical activity, as measured by the top quartile group in our study, was also found to associate with in higher bilateral GM volumes in the precuneus extending into the lingual gyrus, with greater volume on left in these structures. Additionally, we found that left hippocampal and cerebellar vermis GM volumes vary as a function of AD or MCI in the top quartile group.
Our findings of exercise-influenced GM volume increases are supported by other studies that utilized MRI to demonstrate: i) a linear correlation between high fitness levels and large hippocampal volumes in elderly participants [16, 52], ii) the association of high levels of physical activity in predicting large volumes of frontal, occipital, and entorhinal regions [16], iii) an association between large hippocampal volumes and a reduced risk of developing AD [16], and iv) a correlation between increased hippocampal volume and improvement in short-term memory test scores [53]. Animal studies also support our findings, where models for causal inference showed exercise has been found to increase the incorporation of new neurons into the hippocampus [54].
Previous studies have demonstrated the association of physical exercise with improved cognitive function [55–57]. Most notably, physical activity is associated with a reduced risk of dementia and delayed clinical expression of AD. For instance, in a prospective cohort study of cognitively normal individuals age 65 years or older, the incident rate of dementia was higher for participants who exercised less than 3 times a week over approximately 6 years [55]. Similarly, even low-intensity activities, such as walking, have been linked to better cognitive status. A study revealed that men who walked short distances, in comparison to males who walked longer distances, had an increased risk and incidence of AD [58]. Moreover, understanding that it is energy expenditure which is primarily associated with exercise-induced brain changes adds substantial value to existing epidemiologic studies that address the role of increased physical activity in delaying the clinical manifestation of AD.
The strengths of our study include: i) the use of energy output as a function of kilocalories burned as a predictor of GM volumes, which allows for quantification of physical exercise, ii) a large sample size, iii) longitudinal follow-up over an extended time-span, iv) an expert team used for clinical assessment of subjects, which enables comprehensive evaluation of patients and increased diagnostic accuracy, and v) the use of eigenvariates to improve the representation of the impact of physical activity on brain regions affected by cognitive decline.
We acknowledge that our study results must be evaluated in the context of some limitations. It is possible that reduced amounts of active leisure-time activities are a reflection of an overall decline in health associated with preclinical dementia. Furthermore, it is possible that greater physical activity is a function of larger brain size. Moreover, our study depended on a self-reported tool for assessment of physical activities, which can potentially influence the validity and reliability of the acquired recall data. The evaluation tool only provided information on the frequency and duration of activities. In the future, it will be important to utilize a more objective measure of quantifying physical activity that also takes the level exercise intensity into account (e.g., accelerometers, GPS trackers, pedometers, heat sensors, moisture sensors, and continuous heart rate monitors). Another area for further investigation is the similarities and differences of various physical activity types on the brain (e.g., strength versus aerobic versus mind-body). This is an area for further investigation. A recent review by Voelcker-Rehage and Niemann [59, 60] compares the clinical effect of ‘metabolic exercise’ (i.e., cardiovascular and resistance training) and coordinative PA (i.e., motor fitness, coordination, and flexibility) on cognitive function and markers of neuroplasticity. The authors present evidence arguing pure metabolic PA has greater effects on brain volume and functional activity, particularly in the prefrontal and hippocampal areas, as compared to stretching, toning, or relaxation interventions (for primary evidence, see [18, 61, 62]);they contribute this effect to differing metabolic demands [59].
With the elderly population growing rapidly, a better understanding of preventive measures for maintaining cognitive function is crucial. Studies such as this one suggest that simply caloric expenditure, regardless of type or duration of exercise, may alone moderate neurodegeneration and even increase GM volume in structures of the brain central to cognitive functioning. Future studies examining the preservation of brain matter as a function of physical activity will help elucidate whether the association between caloric expenditure and GM volume is a direct or indirect relationship. Such knowledge can give individuals the tools to better impact their brain health throughout the aging process.
ACKNOWLEDGMENTS
The research reported in this publication was supported in part by funds from contract numbers N01-HC-80007, N01-HC-85079 through N01-HC-85086, N01-HC-35129, N01 HC-15103, N01 HC-55222, N01-HC-75150, N01-HC-45133, grant number U01 HL080295 from the National Heart, Lung, and Blood Institute, with additional contribution from the National Institute of Neurological Disorders and Stroke. Additional funds were provided by the National Institute on Aging to O.L.L. (AG020098), L.H.K. (AG15928), P.T. (EB008281) and the University of Pittsburgh (AG05133), and by subcontract (N01-HC-055222) to J.T.B. A full list of principal CHS investigators and institutions can be found at http://www.chs-nhlbi.org/pi.htm.
Authors’ disclosures available online (http://www.j-alz.com/manuscript-disclosures/16-0057r1).
REFERENCES
[1] | United Nations ((2013) ) World Population Ageing 2013, Population Division, Department of Economic and Social Affairs, Volume: ST/ESA/SER.A/348. http://www.un.org/esa/population/publications/worldageing19502050/, Accessed 16 June 2014. |
[2] | Alzheimer’s Disease, International ((2013) ) World Alzheimer Report: Journal of Caring: An Analysis of Long-Term Care for Dementia. Alzheimer’s Disease International, London. http://www.alz.co.uk/research/world-report-2013, Accessed 16 June 2014.. |
[3] | Lautenschlager NT , Cox KL , Flicker L , Foster JK , Bockxmeer FM , Xiao J , Greenop KR , Almeida OP ((2008) ) Effect of physical activity on cognitive function in older adults at risk for Azheimer disease. JAMA 300: , 1027–1037. |
[4] | Scarmeas N , Zarahn E , Anderson KE , Habeck CG , Hilton J , Flynn J , Marder KS , Bell KL , Sackeim HA , Van Heertum RL , Moeller JR , Stern Y ((2003) ) Association of life activities with cerebral blood flow in Alzheimer disease. Arch Neurol 60: , 359–365. |
[5] | Steffen LM , Arnett DK , Blackburn H , Shah G , Armstrong C , Luepker RV , Jacobs DR Jr ((2006) ) Population trends in leisure-time physical activity: Minnesota Heart Survey, 1980-2000. Med Sci Sports Exerc 38: , 1716–1723. |
[6] | Evans DA , Funkenstein HH , Albert MS ((1989) ) Prevalence of Alzheimer’s disease in a community population of older persons: Higher than previously reported. JAMA 262: , 2551–2556. |
[7] | Barnes DE , Yaffe K ((2011) ) The projected effect of risk factor reduction on Alzheimer’s disease prevalence. Lancet Neurol 10: , 819–828. |
[8] | Barnes DE , Whitmer RA , Yaffe K ((2007) ) Physical activity and dementia: The need for prevention trials. Exerc Sport Sci Rev 35: , 24–29. |
[9] | de Rezende LF , Rey-Lopez JP , Matsudo VK , do Carmo Luiz O ((2014) ) Sedentary behavior and health outcomes among older adults: A systematic review. BMC Public Health 14: , 333. |
[10] | Profenno LA , Porsteinsson AP , Faraone SV ((2010) ) Meta-analysis of Alzheimer’s disease risk with obesity, diabetes, and related disorders. Biol Psychiatry 67: , 505–512. |
[11] | Kennelly SP , Lawlor BA , Kenny RA ((2009) ) Blood pressure and the risk for dementia: A double edged sword. Ageing Res Rev 8: , 61–70. |
[12] | Voss MW , Carr LJ , Clark R , Weng T ((2014) ) Revenge of the “sit” II: Does lifestyle impact neuronal and cognitive health through distinct mechanisms associated with sedentary behavior and physical activity?. Ment Health Phys Act 7: , 9–24. |
[13] | Colcombe SJ , Erickson KI , Raz N , Webb AG , Cohen NJ , McAuley E , Kramer AF ((2003) ) Aerobic fitness reduces brain tissue loss in aging humans. J Gerontol A Biol Sci Med Sci 58: , 176–180. |
[14] | Colcombe SJ , Erickson KI , Scalf PE , Kim JS , Prakash R , McAuley E , Elavsky S , Marquez DX , Hu L , Kramer AF ((2006) ) Aerobic exercise training increases brain volume in aging humans. J Gerontol A Biol Sci Med Sci 61: , 1166–1170. |
[15] | Kramer AF , Erickson KI ((2007) ) Capitalizing on cortical plasticity: Influence of physical activity on cognition and brain function. Trends Cogn Sci 11: , 342–348. |
[16] | Erickson KI , Raji CA , Lopez OL , Becker JT , Rosano C , Newman AB , Gach HM , Thompson PM , Ho AJ , Kuller LH ((2010) ) Physical activity predicts gray matter volume in late adulthood: The Cardiovascular Health Study. Neurology 75: , 1415–1422. |
[17] | Barnes DE , Yaffe K ((2011) ) The projected effect of risk factor reduction on Alzheimer’s disease prevalence. Lancet Neurol 10: , 819–828. |
[18] | Erickson KI , Voss MW , Prakash RS , Basak C , Szabo A , Chaddock L , Kim JS , Heo S , Alves H , White SM , Wojcicki TR , Mailey E , Vieira VJ , Martin SA , Pence BD , Woods JA , McAuley E , Kramer AF ((2011) ) Exercise training increases size of hippocampus and improves memory. Proc Natl Acad Sci U S A 108: , 3017–3022. |
[19] | Zlatar ZZ , Wierenga CE , Bangen KJ , Liu TT , Jak AJ ((2014) ) Increased hippocampal blood flow in sedentary older adults at genetic risk for Alzheimer’s disease. J Alzheimers Dis 41: , 809–817. |
[20] | Fried LP , Borhani NO , Enright P , Furberg CD , Gardin JM , Kronmal RA , Kuller LH , Manolio TA , Mittelmark MB , Newman A , O’Leary DH , Psaty B , Rautaharju P , Tracy RP , Weiler PG ((1991) ) The Cardiovascular Health Study: Design and Rationale. Ann Epidemiol 1: , 263–276. |
[21] | Teng EL , Chui HC ((1987) ) The modified Mini-Mental State (3MS) examination. J Clin Psychiatry 48: , 314–318. |
[22] | Wechsler D ((1981) ) Wechsler Adult Intelligence Scale-Revised, The Psychological Corporation, New York. |
[23] | Benton AL ((1967) ) The visual retention test as a constructional praxis task. Confin Neurol 29: , 1–16. |
[24] | Benton AL ((1972) ) Abbreviated versions of the Visual Retention Test. J Psychol 80: , 189–192. |
[25] | Andresen EM , Malmgren JA , Carter WB , Patrick DL ((1994) ) Screening for depression in well older adults: Evaluation of a short form of the CES-D (Center for Epidemiologic Studies Depression Scale). Am J Prev Med 10: , 77–84. |
[26] | Kuller LH , Lopez OL , Newman A , Beauchamp NJ , Burke G , Dulberg C , Fitzpatrick A , Fried L , Haan MN ((2003) ) Risk factors for dementia in the cardiovascular health cognition study. Neuroepidemiology 22: , 13–22. |
[27] | Jorm AF , Jacomb PA ((1989) ) The informant questionnaire on cognitive decline in the elderly (IQCODE): Socio-demographic correlates, reliability, validity and some norms. Psychol Med 19: , 1015–1022. |
[28] | Kawas C , Segal J , Stewart WF , Corrada M , Thal LJ ((1994) ) A validation study of the dementia questionnaire. Arch Neurol 51: , 901–906. |
[29] | Gallo JJ , Breitner JCS ((1995) ) Alzheimer’s disease in the NAS-NRC Registry of ageing twin veterans, IV. Performance characteristics of a two-stage telephone screening procedure for Alzheimer’s dementia. Psychol Med 25: , 1211–1219. |
[30] | Lopez OL , Jagust WJ , DeKosky ST , Becker JT , Fitzpatrick A , Dulberg C , Breitner J , Lyketsos C , Jones B , Kawas C , Carlson MC , Kuller LH ((2003) ) Prevalence and classification of mild cognitive impairment in the Cardiovascular Health Study Cognition Study Part 1. Arch Neurol 60: , 1385–1389. |
[31] | Cummings JL , Mega M , Gray K , Rosenberg-Thompson S , Carusi DA , Gornbein J ((1994) ) The neuropsychiatric inventory: Comprehensive assessment of psychopathology in dementia. Neurology 44: , 2308–2314. |
[32] | Geffken DF , Cushman M , Burke GL , Polak JF , Sakkinen PA , Tracy RP ((2001) ) Association between physical activity and markers of inflammation in a healthy elderly population. Am J Epidemiol 153: , 242–250. |
[33] | Folsom AR , Jacobs DR Jr , Caspersen CJ , Gomez-Marin O , Knudsen J ((1986) ) Test-retest reliability of the Minnesota Leisure Time Physical Activity Questionnaire. J Chronic Dis 39: , 505–511. |
[34] | Richardson MT , Leon AS , Jacobs DR Jr , Ainsworth BE , Serfass R ((1994) ) Comprehensive evaluation of the Minnesota Leisure Time Physical Activity Questionnaire. J Clin Epidemiol 47: , 271–281. |
[35] | Taylor HL , Jacobs DR Jr , Schucker B , Knudsen J , Leon AS , Debacker G ((1978) ) A questionnaire for the assessment of leisure time physical activities. J Chronic Dis 31: , 741–755. |
[36] | Siscovick DS , Fried L , Mittelmark M , Rutan G , Bild D , O’Leary DH ((1997) ) Exercise intensity and subclinical cardiovascular disease in the elderly. The Cardiovascular Health Study. Am J Epidemiol 145: , 977–986. |
[37] | Bryan RN , Manolio TA , Scertz LD , Jungreis C , Poirier VC , Elster AD , Kronmal RA ((1994) ) A method for using MR to evaluate the effects of cardiovascular disease on the brain: The cardiovascular health study. Am J Neuroradiol 15: , 1625–1633 |
[38] | Manolio TA , Burke GL , O’Leary DH , Evans G , Beauchamp N , Knepper L , Ward B ((1999) ) Relationships of cerebral MRI findings to ultrasonographic carotid atherosclerosis in older adults: The Cardiovascular Health Study. CHS Collaborative Research Group. Arterioscler Thromb Vasc Biol 19: , 356–365. |
[39] | Bryan RN , Wells SW , Miller TJ , Elster AD , Jungreis CA , Poirier VC , Lind BK , Manolio TA ((1997) ) Infarctlike lesions in the brain: Prevalence and anatomic characteristics at MR imaging of the elderly - data from the Cardiovascular Health Study. Radiology 202: , 47–54. |
[40] | Yue NC , Arnold AM , Longstreth WT , Elster AD , Jungreis CA , O’Leary DH , Poirier VC , Bryan RN ((1997) ) Sulcal, ventricular, and white matter changes at MR imaging in the aging brain: Data from the Cardiovascular Health Study. Radiology 202: , 33–39. |
[41] | Kuller LH , Longstreth WT , Arnold AM , Bernick C , Bryan N , Beauchamp NJ ((2004) ) White matter hyperintensity on cranial magnetic resonance imaging. Stroke 35: , 1821–1825. |
[42] | Raji CA , Lopez OL , Kuller LH , Carmichael OT , Becker JT ((2009) ) Age, Alzheimer disease, and brain structure. Neurology 73: , 1899–1905. |
[43] | Smith SM , Jenkinson M , Woolrich MW , Beckmann CF , Behrens TE , Johansen-Berg H , Bannister PR , De Luca M , Drobnjak I , Flitney DE , Niazy RK , Saunders J , Vickers J , Zhang Y , De Stefano N , Brady JM , Matthews PM ((2004) ) Advances in functional and structural MR image analysis and implementation as FSL. Neuroimage 23: (Suppl 1), S208–S219. |
[44] | Spears JR , Greer PJ , Ziolko SK , Aizenstein HJ , Carmichael O , Becker JT , Meltzer CC ((2005) ) Evaluation of an age-specific neurological template. Presented at the Annual Meeting of the Organization of Human Brain Mapping. Toronto Ontario, Canada; June (2005) . |
[45] | Genovese CR , Lazar NA , Nichols TE ((2002) ) Thresholding of statistical maps in functional neuroimaging using the false discovery rate. Neuroimage 15: , 870–878. |
[46] | Baron RM , Kenny DA ((1986) ) The Moderator-mediator variable distinction in social psychological research: Conceptual, strategic, and statistical considerations. J Pers Soc Psychol 51: , 1173–1182. |
[47] | Holmes CJ , Hoge R , Collins L , Woods R , Toga AW , Evans AC ((1998) ) Enhancement of MR images using registration for signal averaging. J Comput Assist Tomogr 22: , 324–333. |
[48] | Cohen J ((1988) ) Statistical Power Analysis for the Behavioral Sciences, 2nd Ed., Lawrene Erlbaum Associates, Hillsdale, NJ. |
[49] | Lopez OL , Kuller LH , Fitzpatrick A , Ives D , Becker JT , Beauchamp N ((2003) ) Evaluations of dementia in the cardiovascular health cognition study. Neuroepidemiology 22: , 1–12. |
[50] | Hillman CH , Erickson KI , Kramer AF ((2008) ) Be smart, exercise your heart: Exercise effects on brain and cognition. Nat Rev Neurosci 9: , 58–65. |
[51] | Erickson KI , Kramer AF ((2009) ) Aerobic exercise effects on cognitive and neural plasticity in older adults. Br J Sports Med 43: , 22–24. |
[52] | Erickson KI , Prakash RS , Voss MW , Chaddock L , Hu L , Morris KS , White SM , Wójcicki TR , McAuley E , Kramer AF ((2009) ) Aerobic fitness is associated with hippocampal volume in elderly humans. Hippocampus 19: , 1030–1039. |
[53] | Pajonk F , Wobrock T , Gruber O , Scherk H, Berner D, Kaizl I, Kierer A, Müller S, Oest M, Meyer T, Backens M, Schneider-Axmann T, Thornton AE, Honer WG, Falkai P ((2010) ) Hippocampal plasticity in response to exercise in schizophrenia. Arch Gen Psychiatry 67: , 133–143. |
[54] | Lazarov O , Mattson MP , Peterson DA , Pimplikar SW , van Praag H ((2010) ) When neurogenesis encounters aging and disease. Trends Neurosci 33: , 569–579. |
[55] | Larson EB , Wang L , Bowen JD , McCormick WC , Teri L , Crane P , Kukull W ((2006) ) Exercise is associated with reduced risk for incident dementia among persons 65 years of age and older. Ann Intern Med 144: , 73–81. |
[56] | Laurin D , Verreault R , Lindsay J , MacPherson K , Rockwood K ((2001) ) Physical activity and risk of cognitive impairment and dementia in elderly persons. Arch Neurol 58: , 498–504. |
[57] | Rovio S , Kåreholt I , Helkala E-L , Viitanen M , Winblad B , Tuomilehto J , Soininen H , Nissinen A , Kivipelto M ((2005) ) Leisure-time physical activity at midlife and the risk of dementia and Alzheimer’s disease. Lancet Neurol 4: , 705–711. |
[58] | Abbott RD , White LR , Ross G , Masaki KH , Curb J , Petrovitch H ((2004) ) WAlking and dementia in physically capable elderly men. JAMA 292: , 1447–1453. |
[59] | Voelcker-Rehage C , Niemann C ((2013) ) Structural and functional brain changes related to different types of physical activity across the life span. Neurosci Biobehav Rev 37: (9 Pt B), 2268–2295. |
[60] | Erickson KI , Gildengers AG , Butters MA ((2013) ) Physical activity and brain plasticity in late adulthood. Dialogues Clin Neurosci 15: , 99–108. |
[61] | Ruscheweyh R , Willemer C , Kruger K , Duning T , Warnecke T , Sommer J , Volker K , Ho HV , Mooren F , Knecht S , Floel A ((2011) ) Physical activity and memory functions: An interventional study. Neurobiol Aging 32: , 1304–1319. |
[62] | Voelcker-Rehage C , Godde B , Staudinger UM ((2011) ) Cardiovascular and coordination training differentially improve cognitive performance and neural processing in older adults. Front Hum Neurosci 5: , 26. |
Figures and Tables
Fig.1
A) Main effect of increasing caloric expenditure on gray matter structure in the CHS. Red and yellow colors reflect larger gray matter volumes in the frontal, temporal, and parietal lobes with FDR <0.05. B) The main effects from panel A overlayed onto orhtogonal slices. Hotter colors denote a stronger effect and the cross hairs highlight the main effect of physical activity in the right hippocampus.
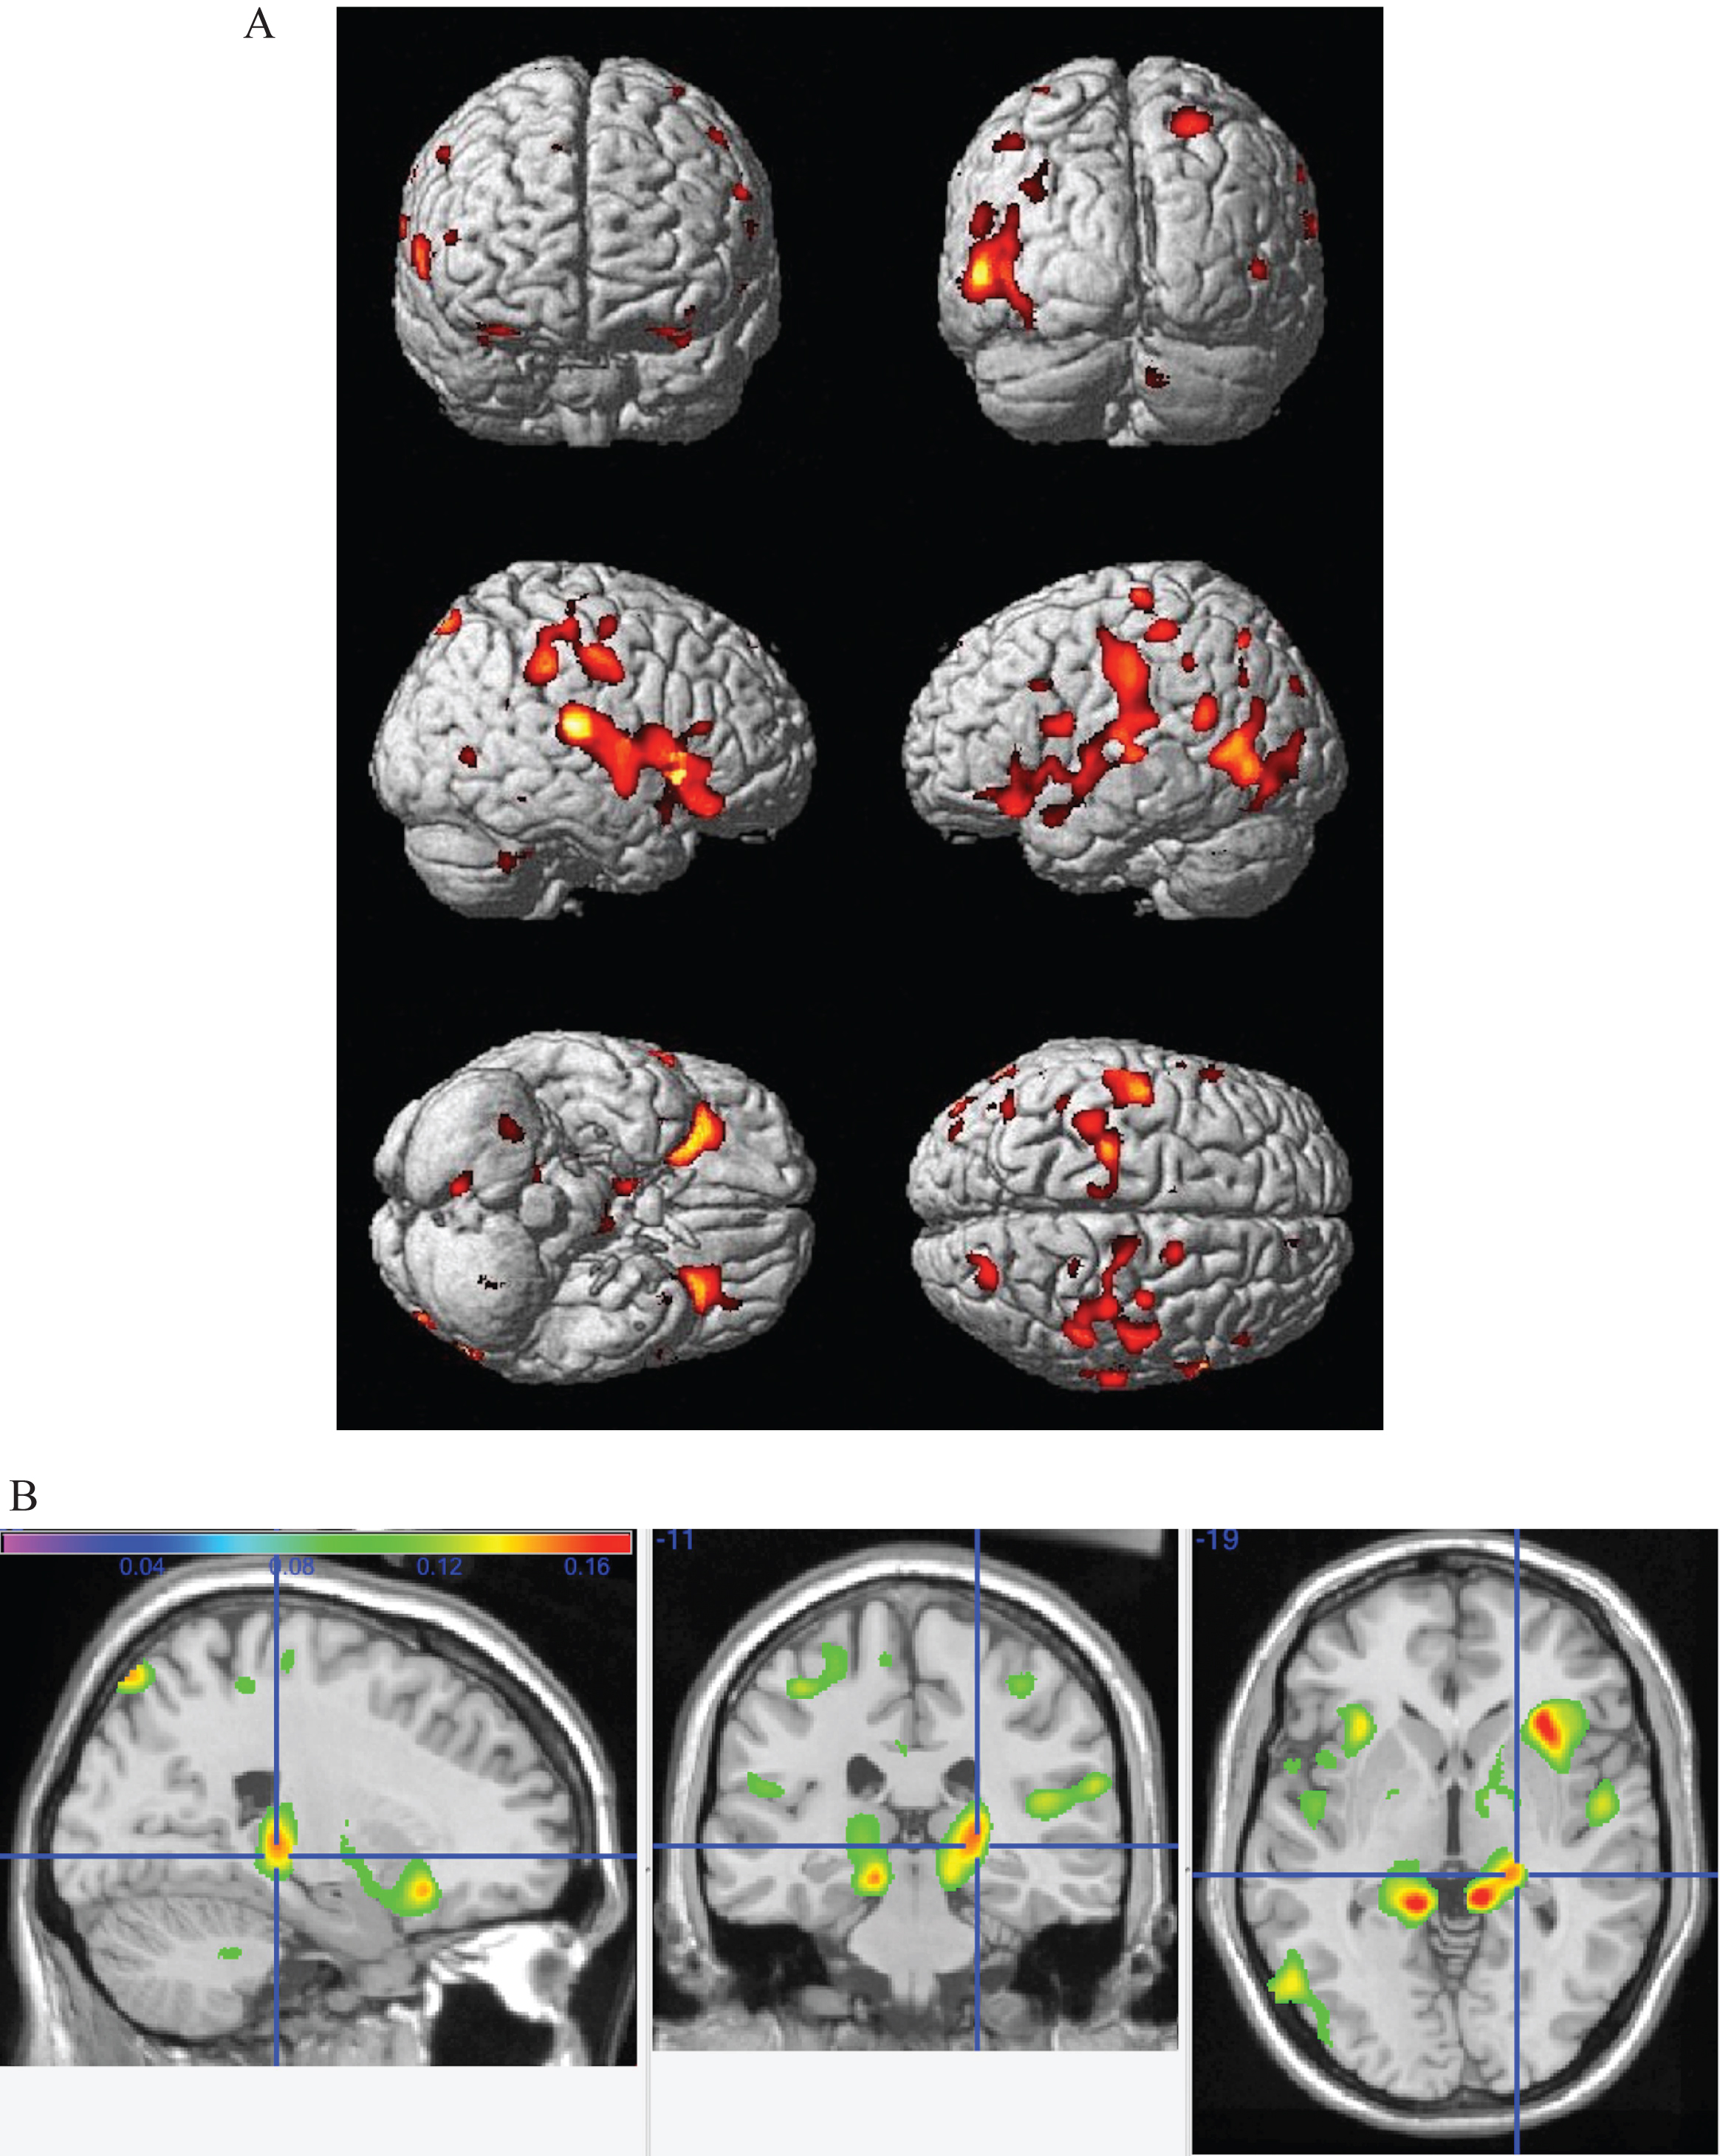
Fig.2
Main effect of the top quartile of physical activity as assessed by the top quartile of kcal measurements. The crosshairs point to a cluster of voxels denoting higher gray matter volumes in the top quartile group in the left precuneus, extending into the left lingual gyrus.A smaller cluster is seen in the same regions on the right lingual gyrus and precuneus.
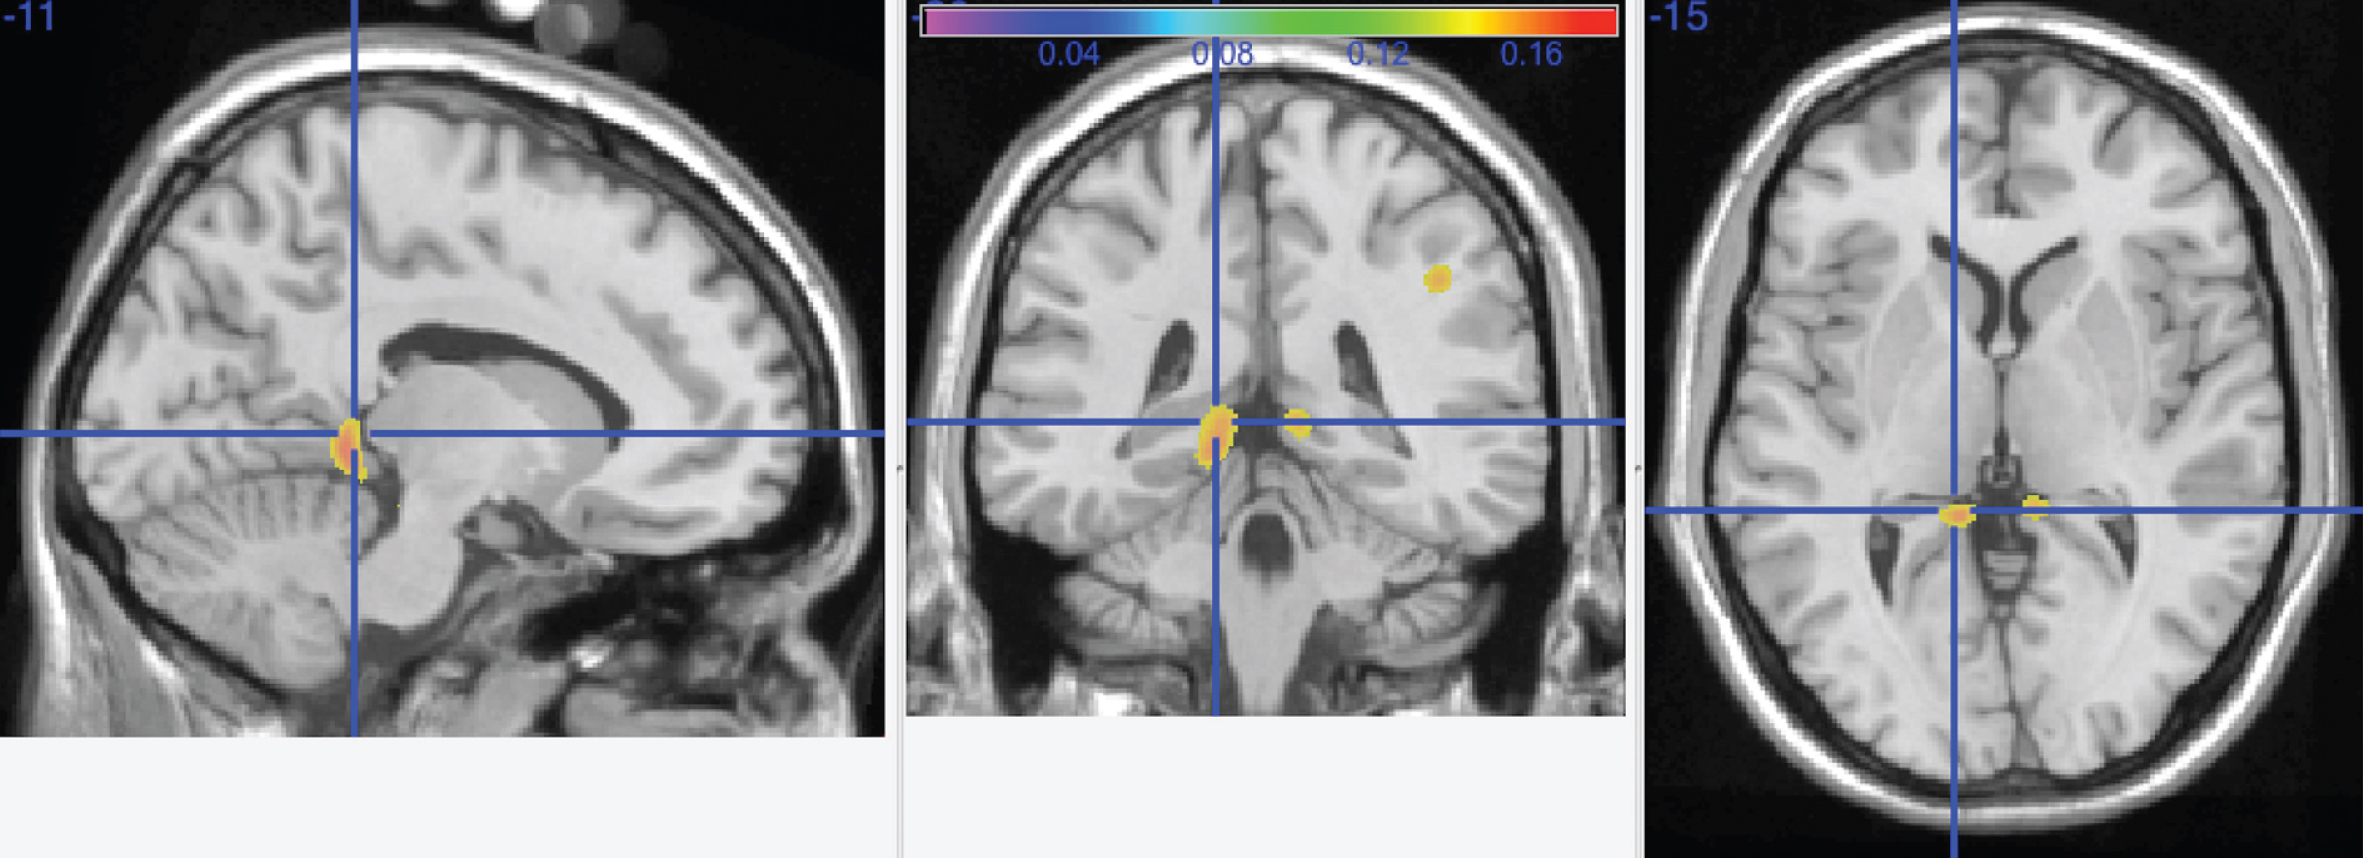
Fig.3
Main effect of change in physical activity over time on gray matter structure. Areas that demonstrated more gray matter volume with increased physical activity over time include the left inferior orbital frontal cortex (–29, 25, –23) and left precuneus (–13, –63, 71).
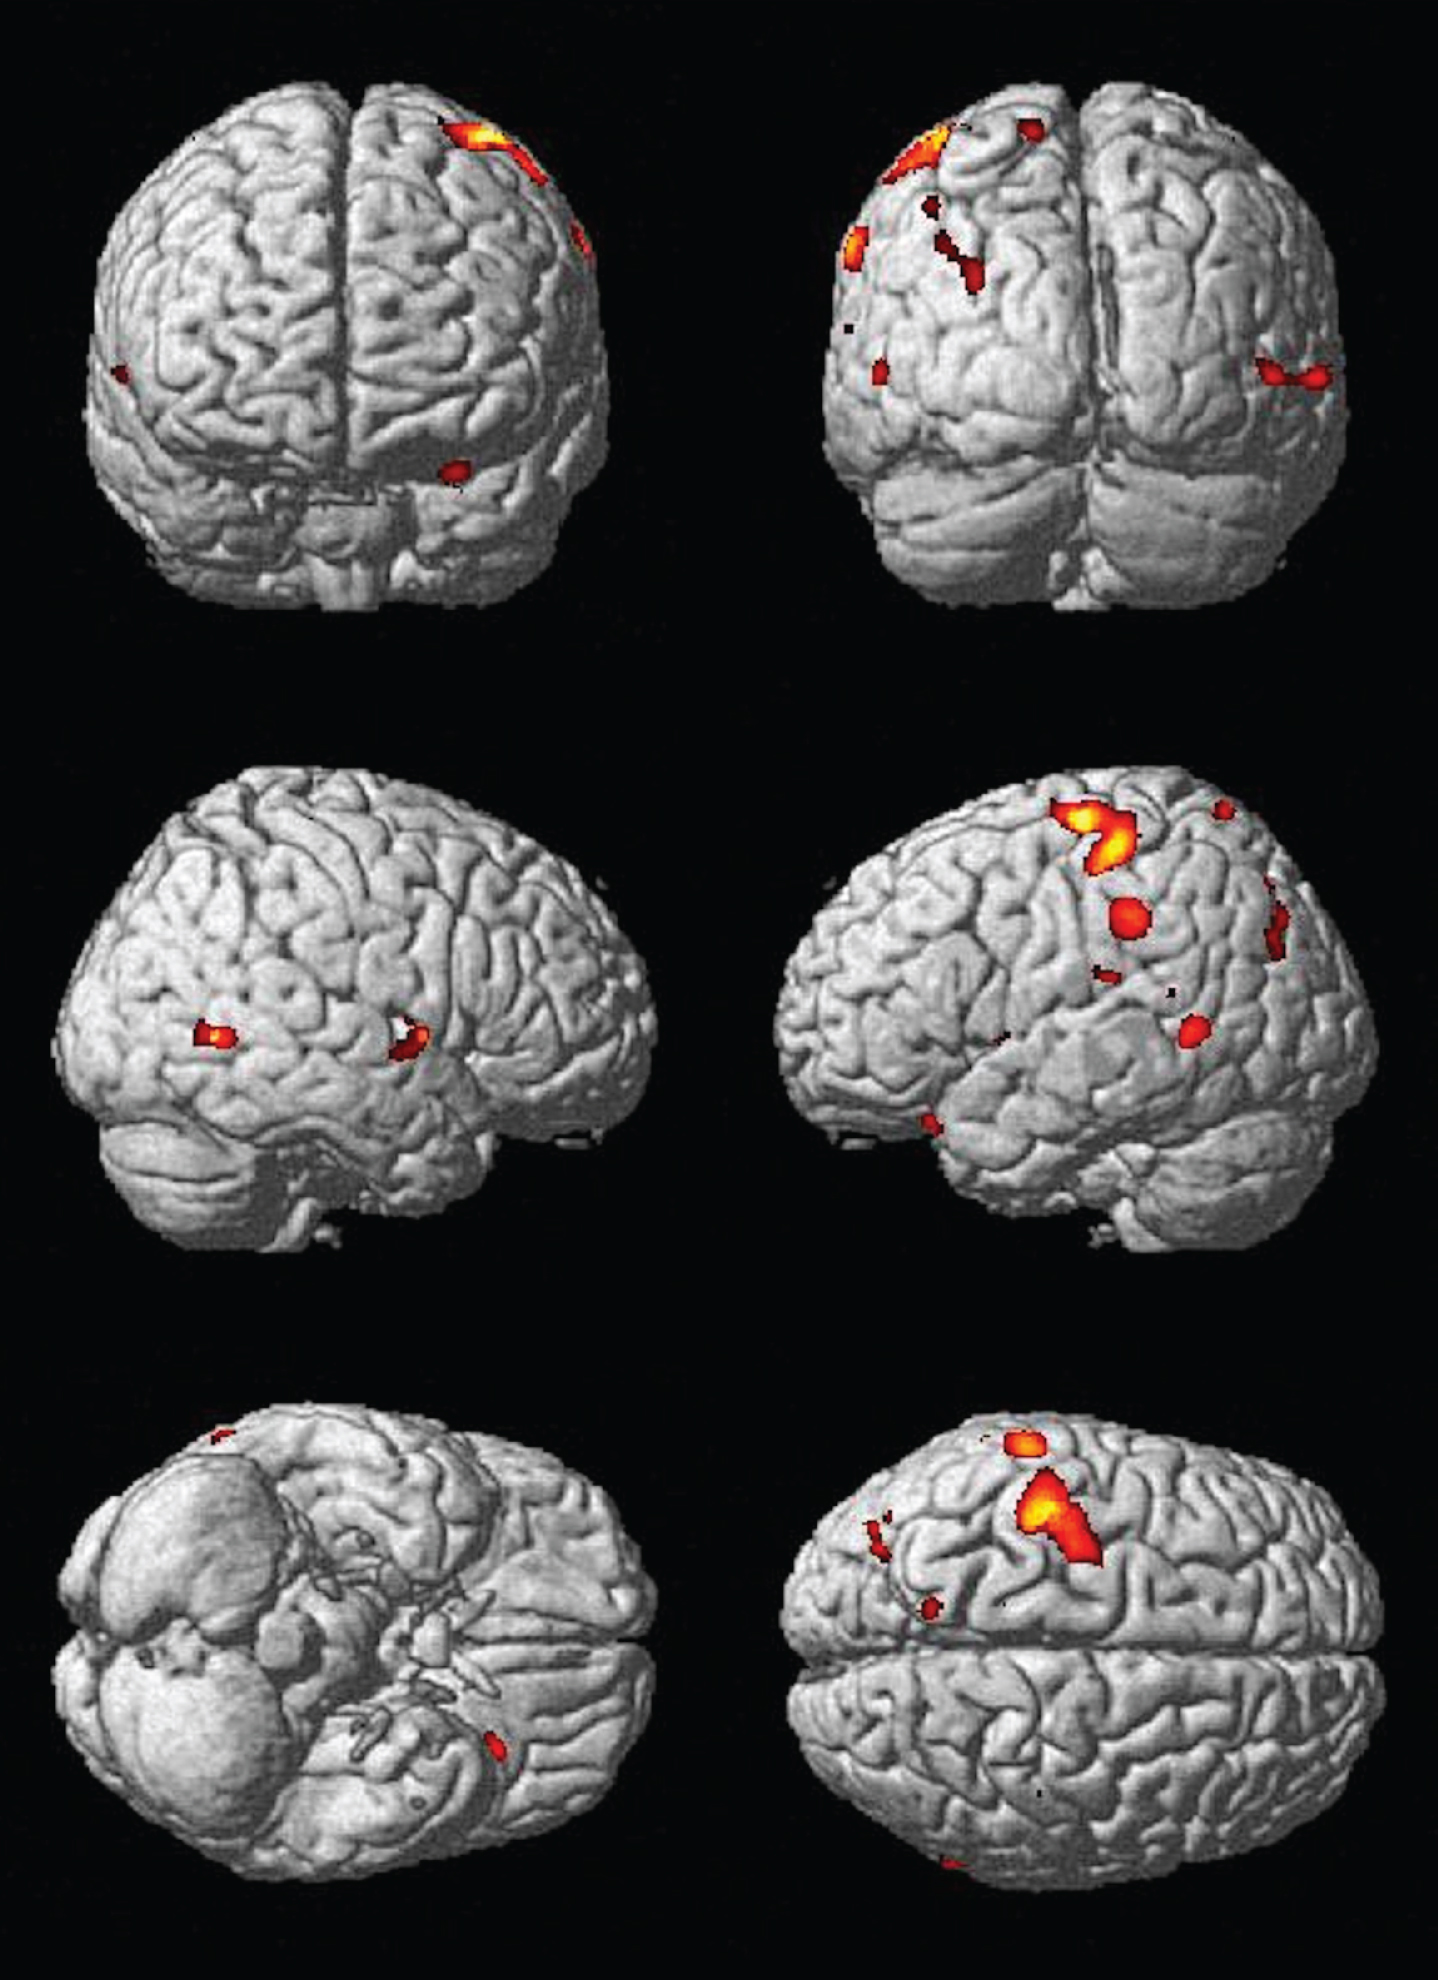
Fig.4
This graphic shows the interaction between increasing caloric expenditure and cognitive impairment (MCI or AD) overlayed onto the left hippocampus (crosshairs) and cerebellar vermis.
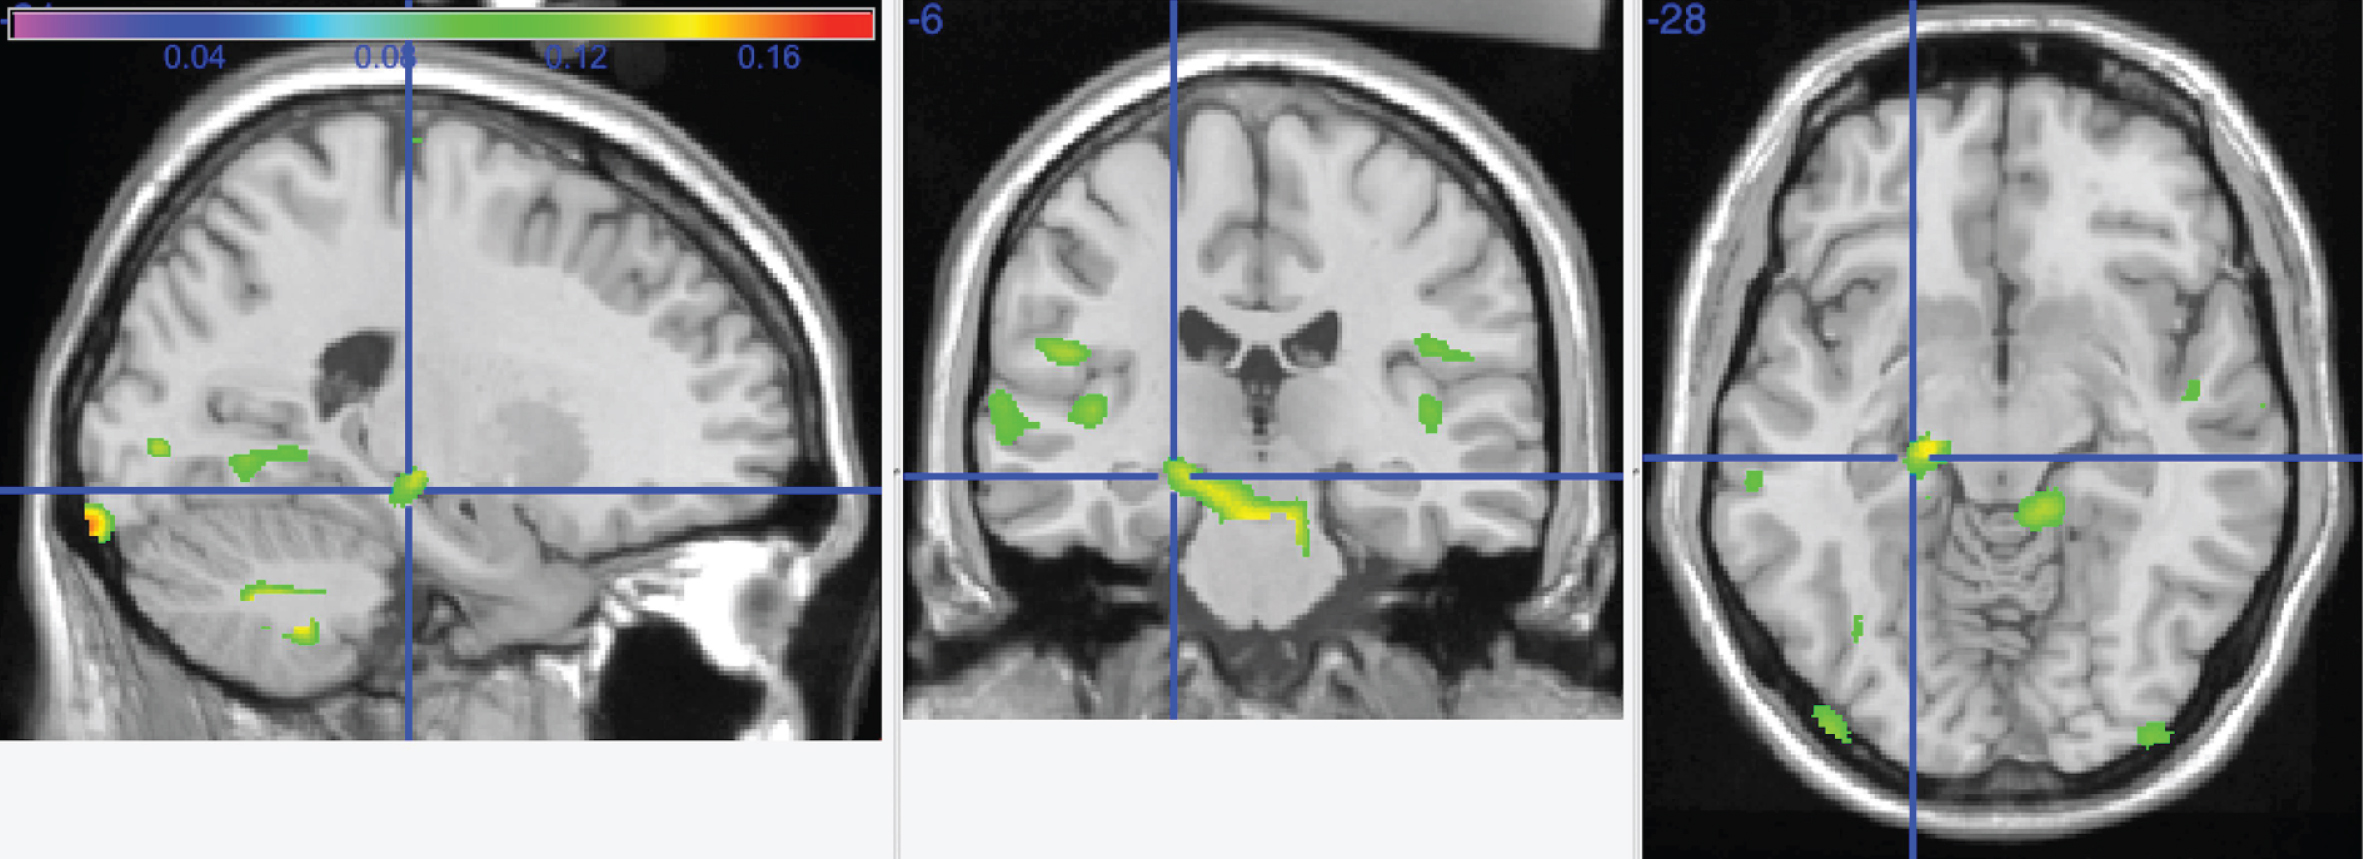
Table 1
Characteristics of study participants in 1998/99 by site
| Winston-Salem | Sacramento | Hagerstown | Pittsburgh | Total Sample | |
| Number scanned | 376 | 506 | 342 | 449 | 1673 |
| Number analyzed | 2 | 280 | 184 | 410 | 876 |
| Age1 | 80.0 (4.1) | 78.6 (4.0) | 78.2 (4.0) | 77.9 (3.6) | 78.3 (3.9) |
| Education (% (N) High School) | 75 (12) | 47 (127) | 70 (113) | 43 (128) | 49 (362) |
| Sex (% (N) Male) | 100 (2) | 43 (120) | 44 (81) | 41 (169) | 42 (372) |
| Race (% (N) White) | 100 (2) | 92 (259) | 99 (183) | 80 (326) | 88 (770) |
| 3MSE1 | 90.7 (7.1) | 95.1 (3.9) | 94.8 (4.2) | 94.9 (4.3) | 94.9 (4.25) |
| Number of Infarcts1 | 0.38 (0.72) | 0.55 (1.0) | 0.41 (0.82) | 0.41 (0.83) | 0.46 (0.91) |
| Sulcal Grade (0 to 9, worst) | 4.31 (1.2) | 3.78 (1.4) | 3.88 (1.7) | 3.92 (1.6) | 3.87 (1.5) |
| Ventricular Grade (0 to 9, worst) | 3.81 (.83) | 3.67 (1.3) | 3.44 (1.3) | 3.49 (1.3) | 3.55 (1.3) |
| White Matter Grade (0 to 9, worst) | 3.06 (2.0) | 2.75 (1.6) | 2.18 (1.5) | 2.30 (1.4) | 2.45 (1.5) |
| Infarcts (% (N) Present) | 50 (1) | 33 (92) | 29 (54) | 30 (123) | 31 (270) |
| Ventricular Grade (% (N)>5) | 6 (1) | 7 (18) | 6 (10) | 7 (21) | 7 (50) |
| White Matter Grade (% (N)>3) | 38 (6) | 35 (91) | 31 (50) | 16 (48) | 21 (161) |
| AD or MCI (%, N) | 100 (2) | 17 (49) | 18 (34) | 31 (128) | 24 (213) |
1Mean±standard deviation.

