
A Phase II Study of Fornix Deep Brain Stimulation in Mild Alzheimer’s Disease
Abstract
Background: Deep brain stimulation (DBS) is used to modulate the activity of dysfunctional brain circuits. The safety and efficacy of DBS in dementia is unknown.
Objective: To assess DBS of memory circuits as a treatment for patients with mild Alzheimer’s disease (AD).
Methods: We evaluated active “on” versus sham “off” bilateral DBS directed at the fornix-a major fiber bundle in the brain’s memory circuit-in a randomized, double-blind trial (ClinicalTrials.gov NCT01608061) in 42 patients with mild AD. We measured cognitive function and cerebral glucose metabolism up to 12 months post-implantation.
Results: Surgery and electrical stimulation were safe and well tolerated. There were no significant differences in the primary cognitive outcomes (ADAS-Cog 13, CDR-SB) in the “on” versus “off” stimulation group at 12 months for the whole cohort. Patients receiving stimulation showed increased metabolism at 6 months but this was not significant at 12 months. On post-hoc analysis, there was a significant interaction between age and treatment outcome: in contrast to patients <65 years old (n = 12) whose results trended toward being worse with DBS ON versus OFF, in patients≥65 (n = 30) DBS-f ON treatment was associated with a trend toward both benefit on clinical outcomes and a greater increase in cerebral glucose metabolism.
Conclusion: DBS for AD was safe and associated with increased cerebral glucose metabolism. There were no differences in cognitive outcomes for participants as a whole, but participants aged≥65 years may have derived benefit while there was possible worsening in patients below age 65 years with stimulation.
INTRODUCTION
It is increasingly recognized that the pathological processes involved in Alzheimer’s disease (AD) causes focal synaptic dysfunction that disrupts connected brain regions to produce widespread disturbances in the function of circuits and networks involved in cognition [1]. This is supported by striking regional deficits in cerebral glucose metabolism and aberrations in structural and functional brain connectivity that are characteristic of AD and that worsen over its course [2–4]. These disruptions in brain networks are implicated in the pathogenesis of cognitive impairment [5]. We propose an intervention to treat brain circuit dysfunction in AD, as an alternative to recent treatment strategies, including reducing brain amyloid. As deep brain stimulation (DBS) has been used to modulate the activity of motor circuits in over 100,000 patients with Parkinson’s disease [6]. it may be possible to use this same approach to modulate the activity of dysfunctional neural circuits in AD. The hypothesis is that, just as DBS for the neurodegenerative disorder Parkinson’s disease alleviates symptoms by modulating pathological network activity, that DBS might similarly prove a clinically beneficial therapy for AD.
We previously applied DBS to influence the activity of dysfunctional brain networks in AD in a Phase I trial [7]. In that study (n = 6), DBS was applied to stimulate the fornix (DBS-f), a fiber bundle carrying approximately 1.2 million axons [8], that constitutes the major projection linking various nodes within the circuit of Papez. DBS-f was found to drive brain electrical activity throughout this circuit and to increase glucose metabolism in temporal and parietal areas after 12 months [7], in contrast to the progressive decrease in metabolism expected in AD [2]. While the mechanisms underlying these DBS-f effects are unknown, experiments in laboratory animals using stimulation of the fornix, or other structures along the Papez circuit, suggest that DBS may have neurotrophic effects including increasing delivery of endogenous trophic factors, facilitating expression of synaptic proteins [9], and driving hippocampal neurogenesis [10]. Interestingly, electrical stimulation of this circuit in rodents [11, 12] and in patients with epilepsy [13, 14] improved several aspects of memory function.
We designed a multi-center, double-blind, randomized, controlled Phase II trial to evaluate the safety of DBS-f in patients with mild AD with the secondary outcomes of assessing change in clinical and functional imaging outcomes, and identifying characteristics of responders. To isolate the impact of continuous brain stimulation, and because surgical trials are subject to “placebo” effects, we included a sham stimulation control arm. The sham patients had DBS-f electrodes implanted but received no stimulation for 12 months, after which they crossed over to active stimulation. Based on observations in the Phase I study that patients with the best-preserved cognition and brain circuits were better responders, we targeted patients with mild AD [7, 15].
MATERIALS AND METHODS
Study design and oversight
The design of the randomized controlled ADvance study has been detailed previously [16]. ADvance was conducted at 7 clinical sites in the United States and Canada with independent research ethics board approval at each site. All procedures involving experiments on human subjects were carried out in accord with the Helsinki Declaration of 1975. All participants signed informed consent in person, with the participation of a surrogate consenter.
Potential participants identified by sites were assessed by an Eligibility Review Committee (ERC) of neurosurgeons, neurologists, and psychiatrists to (1) confirm diagnosis, (2) verify enrollment criteria were met, and (3) document clear progression of symptoms over the prior 12 months to maximize likelihood that the sham group would show clinical progression over the trial year. The trial was overseen by the Food and Drug Administration, Health Canada, and registered with http://www.clinicaltrials.gov (NCT01608061).
Patients
Men and women aged 45–85 years with probable AD dementia according to NIA/Alzheimer Association criteria were enrolled [17]. Patients had mild dementia with global Clinical Dementia Rating Sum of Boxes (CDR-SB) of 0.5 or 1 and Alzheimer’s Disease Assessment Scale-13 (ADAS-Cog 13) scores of 12–24 inclusive at both screen and baseline (minimum score≥4 on item 1). All had a caregiver or informant who could reliably report on daily activities and functioning. All were taking a stable cholinesterase inhibitor medication dose (donepezil, galantamine, or rivastigmine) for at least 2 months prior to study initiation. Exclusion criteria included: Neuropsychiatric Inventory (NPI) total score≥10 or≥4 in any NPI domain-except apathy-indicative of clinically significant neuropsychiatric symptoms; and Modified Hachinski ischemia ratings > 4 at screening. We excluded individuals at risk for suicide or with psychiatric disorders other than dementia. Subjects had to be free of contraindications for surgery or exclusions for magnetic resonance (MR) imaging (pacemakers, metal implanted in the body) or positron emission tomography (PET) scanning (insulin-dependent diabetes).
Surgery and stimulation
The surgical technique is very similar to that used for DBS of Parkinson’s disease but with a different anatomical target (bilateral fornix). Patients underwent placement of Medtronic 3387 DBS electrodes under local anesthesia as previously described [18]. The procedure involved placement of a Leksell stereotactic frame and an MRI acquisition. Bilateral burr hole openings were made 2 cm from the midline at the level of the coronal suture. The electrodes were inserted to lie 2 mm anterior and tangential to the columns of the fornix with the distal contacts just proximal to the mammillary bodies. Intraoperative stimulation confirmed functioning of the electrodes with placement near the hypothalamus. Stimulation at high voltages at the deepest, most posterior contacts elicited autonomic phenomena including changes in heart rate, blood pressure, or sweating in all patients. In a small number of patients, stimulation voltages of 7 or higher from the higher contacts elicited dé jà vu phenomena including vivid autobiographical memories as previously described [7]. No stimulation-induced effects were seen at 3.5 volts in any patient. Once the electrodes were in place, a dual channel pulse generator (Activa PC, Medtronic) was implanted in the subcutaneous area below the clavicle and connected to the brain electrodes using an extension tunneled between the head and chest.
Stimulation programming, randomization, and masking
Two weeks after surgery, all patients had test stimulation at each of the 8 electrode contacts (4 on each side) and were randomized and then programmed to either active or sham stimulation at the end of the visit by the single un-blinded programmer. Continuous stimulation was delivered at 130 Hz, between 3.0 to 3.5 Volts, with a pulse width of 90 microseconds to the top, or second from top, of the 4 electrode contacts. At this setting, similar to what is done in Parkinson’s disease, the patients and physicians did not report any acute effects and could not ascertain whether the stimulation was on or off, thus preserving the masked nature of treatment assignment. Patients received continuous stimulation at the chosen setting for 12 months without adjustment.
Safety outcomes
We assessed both acute (surgery through 30 days) and long-term (30 days to 12 months post-op) safety by monitoring serious and non-serious adverse events (SAE/AEs). The former were defined as leading to prolongation of hospital stay, new hospital admission, disability, or death. Acute cognitive effects were assessed by comparing scores on the ADAS-Cog-13 between baseline and 1 month post-op. Safety data were reviewed and adjudicated in real time by a masked internal Clinical Events Committee (CEC) and at 6-month intervals by an unmasked external Data Safety Monitoring Board (DSMB). To monitor for adverse psychiatric outcomes previously observed with DBS at every follow-up visit we conducted a psychiatric examination and assessed the Columbia Suicide Severity Rating Scale, and the Young Mania Scale.
Clinical outcomes
The primary clinical outcomes were the ADAS-Cog 13 and CDR-SB at 6 and 12 months. Secondary outcomes at 6 and 12 months included the California Verbal Learning Test-Second Edition (CVLT-II), the Alzheimer’s Disease Cooperative Study Activities of Daily Living scale (ACDS-ADL), and the NPI.
Imaging outcomes
Patients underwent 1.5T MR scans at baseline and 12 months and [18F]-2-deoxy-2-fluoro-D-glucose PET (FDG-PET) at baseline and at 1, 6, and 12 months after surgery with the stimulators maintained ‘on’ in the active group and ‘off’ in the sham group during the PET scans [7]. The imaging core at Johns Hopkins was responsible for (1) establishing the PET and MR protocols based on the Alzheimer’s disease Neuroimaging Initiative (ADNI) protocols [19–21], (2) organizing the data from the 7 sites, (3) quality control of PET and MR images, and (4) analysis of PET data (using ADNI pre-processing methods).
The PET scans were performed on a PET/CT scanner at each site. After a 5 mCi ± 10% radiotracer injection and a 30-min uptake interval (eyes open, ears unoccluded), a CT transmission scan was acquired followed by a static emission scan beginning 40 min post-injection (20-min acquisition, the last 10 min used for quantification). A standardized uptake value (SUV) was calculated on a voxel-wise basis using the following formula: (radioactivity concentration in each voxel)/(decay corrected injected dose/body weight). The pre-processing and statistical analyses of the PET SUV images were done with Statistical Parametric Mapping, version eight (SPM8, Institute of Neurology, London). A region of interest (ROI) analysis was performed. The analysis involved placement and editing of ROIs defined on a template (Automated Anatomical Labeling atlas), superimposed on each subjects’ pre-operative T1 MR scan and copying of the ROIs onto the SUV PET scans that were spatially normalized and co-registered to the MRI in SPM8. [22]. Pre-specified ROIs were chosen as outcome measures based on regions affected in mild AD (temporal and parietal association cortices and hippocampus), as well as sensory and motor cortical regions relatively spared in mild AD that showed increased glucose metabolism after 12 months of DBS-f in the pilot study (pre and post central gyrus, occipital cortex and cerebellum).
Analyses
The study was exploratory in nature and not powered to detect a statistically significant difference between treatment arms. All analyses followed intention-to-treat (ITT) principles. Descriptive statistics compared treatment groups on baseline variables. Between-group comparisons for change from baseline were made using t-tests and 2-sided p-values at each time point. For safety end points, counts and rates along with corresponding two-sided 95% confidence intervals are presented. All analyses were performed with the use of SAS software, version 9.3.
RESULTS
Baseline patient characteristics are in Table 1. The randomization led to groups well matched for key demographic and clinical variables. The first patient was implanted in May of 2012 and the last in April of 2014. As previously reported [16], 85 patients were consented with 42 implanted and assigned to either active (n = 21) or sham (n = 21) stimulation. Both quantitative ROI analysis (data not shown) and visual inspection of the pre-operative PET scans showed that all patients demonstrated the characteristic metabolic pattern associated with AD (reductions in temporal and parietal association cortices).
Safety outcomes
All observed adverse effects by category and treatment assignment are in Table 2. Detailed surgical safety results have been described previously [20]. The surgery was well tolerated with patients discharged 1–3 days post-op. There were no neurological surgical adverse effects. There were a total of four acute serious device- or procedure-related safety events in three patients for a rate of 7.1% of events/patient (95% CI 1.5–19.5). One event involved IPG infection, one involved moving a DBS lead to the optimal position as defined by imaging, and the others both involved post-op nausea (2 episodes in one subject). The mean ADAS-Cog-13 scores for the active or sham groups at 1 month after surgery were 28.0 (7.7) and 28.9 (7.4) almost identical to baseline indicative of no cognitive adverse effects of the procedure.
There were three long-term serious therapy-related events (depression, suicidal ideation, and worsening confusion) in a single patient in the “off” arm with no events in the “on” arm. One patient in the “off” condition developed regional asymptomatic encephalomalacia observed 113 days post-procedure as previously reported [22]. Both acute and long-term safety endpoints indicate the surgical procedure, programming, and stimulation were well tolerated. The independent DSMB concluded the adverse event safety profile was as expected and had no concerns during ongoing monitoring.
Clinical outcomes
For the group as a whole, the ADAS-Cog 13 and CDR-SB change scores for the “on” stimulation and “off” stimulation groups were similar over 12 months with both groups showing comparable declines (Fig. 1a, b). Outcomes on secondary clinical measures (CVLT-II, ADCS-ADL, and NPI) were also similar across treatment arms (data not shown).
PET imaging outcomes (Table 3; Fig. 2)
The “off” group demonstrated relatively small decreases in all regions (–1 to –5%) at 12 months. In contrast, the “on” group demonstrated increased metabolism, consistent with the pilot study (range 7–13%). The significant increases in glucose metabolism in several brain regions (pre-central gyrus, post-central gyrus, temporal association cortex, hippocampus, parietal association cortex, occipital cortex (cuneus), and cerebellar hemispheres) in the ON versus OFF group at 6 months were not sustained at the 12-month analysis. Decreases at 6 months in the “off” group were greater than the decreases at 12 months. The greater decrease in metabolism in the “off” group at 6 versus 12 months reflects different patients (1 “off” and 2 “on” patients are missing 6 month scans). The results for the same “off” patients at 6 and 12 months show the same degree of decrease in metabolism at both time points within the magnitude of decrease expected in the course of AD. The regional changes in metabolism in the ROI analysis were consistent with voxel-wise analyses (SPM8; data not shown).
Subgroup analysis
In a post-hoc multivariate regression analysis, with a stepwise selection procedure, age was associated with clinical outcomes (beta = –0.41; SE 0.18; p = 0.028). Patients aged≥65 (n = 30) “on” (n = 15) versus “off” (n = 15), were well balanced on the demographic and clinical variables shown in Table 1, as were patients younger than 65 “on” (n = 6) versus “off” (n = 6) (data not shown). The relatively smaller cohort of younger patients (<65) in the study declined more on both primary clinical outcomes whether or not they received stimulation, with younger patients “on” declining faster than those “off” (Fig. 1c, d). After one year, patients less than 65 years of age “off” stimulation increased their ADAS-cog-13 points by 8.3 ± 4.5 points while in those receiving stimulation, the score increased by 18.7 ± 4.1 (Fig. 1c), a difference of 10.3 ± 6.1 (p-value 0.12). In addition, the 6 patients less than 65 years of age in the “on” group showed deterioration as measured by the CDR-SB scores with a value at 12 months of 4.0 ± 07 versus 0.5 ± 0.5 in the 6 patients in the “off” group (Fig. 1d), a difference of 3.5 ± 0.7 (p-value < 0.001).
In contrast, older patients in the “on” group declined less than patients “off” on both ADAS-Cog 13 and CDR-SB (Fig. 1e, f). The difference in ADAS-Cog-13 scores worsening in in patients aged≥65 receiving stimulation versus no stimulation was 4.5 ± 2.0 points at 9 months and 4.1 ± 2.6 at 12 months (Fig. 1e). Similar clinical benefit of the “on” versus “off” stimulation group was observed in the CDR-SB change scores in patients over 65 years old (1.1 ± 0.7 points at 9 months; 1.4 ± 1.0 points at 12 months; Fig, 1f).
With regard to PET data, the <65 group in general showed decreased metabolism both “on” and “off”, while the≥65 group showed increased metabolism “on” stimulation that was greater in magnitude than that observed in the entire group at 6 and 12 months (range 14–20%; Table 4).
While the young and old patients did not differ in baseline cognitive variables, a post-hoc comparison of pre-operative PET scans revealed significantly lower metabolism in the young compared to the old patients in temporal and parietal areas (middle temporal gyrus, inferior parietal lobule, precuneus; –6 to –11% decrease; p < 0.05).
DISCUSSION
In a 12-month sham-controlled trial of deep brain stimulation of the fornix for AD, both neurosurgery and 12 months of continuous stimulation appeared to be safe and well tolerated. DBS had a clear neurobiological effect by increasing metabolism during stimulation in brain regions affected by AD, in contrast to the progressive decline in metabolism in AD [2]. There was no evidence of an overall clinical benefit in the first twelve months of stimulation, possibly because of the inclusion of patients under 65. Below we highlight several important issues in the use of DBS-f to treat AD.
Stimulation dosage
The choice of stimulation parameters was empirical but somewhat arbitrary. We chose parameters commonly used for DBS at other brain targets and we aligned them with our experience in patients with Parkinson’s disease and tremor. We do not know, however, whether the chosen stimulation dose was optimal, and we lacked a clinical outcome for adjusting stimulation parameters, such as reduction of tremor in DBS for Parkinson’s disease. Furthermore, in experimental animals, increasing current delivery to this circuit beyond what is optimal can interfere with memory function [23]. However, in dystonia and obsessive-compulsive disorder, DBS delivered at higher current density settings, just under the window for side effects, has proven empirically to be the optimal approach. In ADvance, the absence of benefit may be related to insufficient dosing, or to applying the dose at a suboptimal location along the DBS lead. The possibility of adjusting stimulation by modifying key parameters (frequency, pulse width, and voltage), changing location of stimulation, applying intermittent or cycling stimulation, or introducing stimulation holidays to recapture a waning effect need to be examined. Until we identify a reliable short-term biological signal that predicts long term, sustained benefit (a clinical, electrophysiological, or imaging measure), choosing the parameters of electrical stimulation for AD patients will remain challenging.
Cerebral glucose metabolism
While as expected patients receiving sham stimulation showed a decline in metabolism, patients receiving stimulation showed increases in regions affected in AD (temporal and parietal regions) as well as regions that are relatively spared (sensory and motor cortex, and cerebellum). The greatest increases in glucose metabolism with DBS on were seen within 6 months and appeared unsustained at 12 months. With the caveat that the patients numbers are small and that there are some missing time point data, the findings suggest that as the illness progresses, the brain’s ability to maintain glucose metabolism may diminish despite circuit modulation by DBS. The effect of stimulation on metabolism was greater in patients≥65 compared to those <65. The regional increases in metabolism are consistent with the notion that DBS-f activates axons of the fornix, drives neural activity trans-synaptically, and modulates the dysfunctional brain networks in AD.
Effect of age
Cognitive worsening was noted in all age groups, however, younger patients (<65 years) receiving stimulation showed the greatest decline. Younger patients (n = 12) may have worsened more with DBS-f “on” whereas in older patients (n = 30) comparison of trajectories on ADAS-Cog-13 and CDR-SB suggested growing separation, suggesting a possible benefit in this subgroup. Younger patients, constituting approximately 4% of all AD patients [24], were overrepresented in ADvance (12/42 or 29%). These observed differences in outcome as a function of age are not well understood, but may be related to greater brain atrophy and metabolic deficits [24–26] or a more malignant course [27] in younger AD patients. One explanation is that younger patients had more severe brain pathology than older patients despite being clinically comparable, such that DBS-f could no longer be of benefit. Another explanation could be that a greater proportion of the younger patients may not have had AD brain pathology. However, all patients demonstrated a typical AD metabolic pattern in the pre-operative PET scans. Finally, the difference in response could have been driven by different genetic and clinical phenotypes that were less responsive to neural network modulation.
Conclusion
DBS-f appears to be safe in patients with mild AD. Direct continuous stimulation of the fornix has potentially important neurobiological effects modulating the activity of brain networks that are dysfunctional in AD as reflected in the increased glucose metabolism observed at 6 months albeit not at 12 months, in contrast to the natural history of AD. Further there may be slowing of cognitive decline over one year in patients 65 years of age and older. Taken together, these findings are consistent with the pilot study and support the continued evaluation of DBS-f in older AD patients and inform the sample size calculation for a phase III clinical trial. Further investigation of DBS-f might include the development of approaches for dose titration to maximize its benefit, better understanding of neurobiological mechanisms involved in its effects, and the evaluation of long-term effects.
Clinical Trial Sites
Banner Alzheimer’s Institute, Phoenix: Anna Burke, MD, Geriatric Psychiatrist, Dementia Specialist; Francisco A. Ponce, MD, Associate Professor of Neurosurgery, Director Barrow Center for Neuromodulation.
Banner Sun Health Research Institute, Sun City: Marwan Sabbagh, MD, Director, Banner Sun Health Research Institute; Francisco A. Ponce, MD, Associate Professor of Neurosurgery, Director Barrow Center for Neuromodulation.
Brown University, Rhode Island Hospital, Butler Hospital: Stephen Salloway, MD/MS Professor of Neurology, Director of Neurology and Memory and Aging Program; Rees Cosgrove, MD/PhD, Chair of Neurosurgery; Wael Asaad, MD/PhD, Assistant Professor of Neurosurgery.
Johns Hopkins University School of Medicine, Baltimore MD: Paul Rosenberg, MD, Associate Professor, Associate Director, Memory and Alzheimer’s Treatment Center; William S. Anderson, MD, PhD, Associate Professor of Neurosurgery, Zoltan Mari, M. D, Associate Professor of Neurology, Ned Sacktor, MD, Professor of Neurology.
University of Florida – Gainesville: Michael S. Okun, MD, Professor of Neurology, Co-Director of the Center for Movement Disorders and Neurorestoration; Kelly D. Foote, MD, Professor of Neurosurgery, Co-Director for Center for Movement Disorders and Neurorestoration.
University of Pennsylvania: David A. Wolk, MD, Associate Professor of Neurology, Assistant Director Penn Memory Center; Gordon Baltuch, MD/PhD, Professor of Neurosurgery, Director Center for Functional and Neurorestorative Neurosurgery.
University of Toronto/Toronto Western Hospital: Andres M. Lozano, MD, PhD, FRCSC, FRSC, Professor of Neurosurgery, Tasker Chair of Functional Neurosurgery; David F. Tang-Wai, MDCM FRCPC, Associate Professor of Neurology; Mary Pat McAndrews, PhD, Associate Professor of Psychology; Peter Giacobbe, MD, Assistant Professor of Psychiatry.
The study was conceived, designed and conducted by the investigators. The funding sources (National Institutes of Health, Federal Economic Development Agency for Southern Ontario, Functional Neuromodulation) helped in the collection, verification and storage of the data but not in data interpretation or writing the manuscript. The corresponding authors had full access to all the data in the study and had final responsibility for the decision to submit for publication.
Authors’ disclosures available online (http://j-alz.com/manuscript-disclosures/16-0017r3).
ACKNOWLEDGMENTS
This research is supported by the National Institute on Aging (R01AG042165), Federal Economic Development Agency for Southern Ontario and Functional Neuromodulation Ltd., the sponsor of the ADvance study. The ADvance Study team includes:
Functional Neuromodulation: Todd Langevin, Lisa Fosdick, Kristen Drake, Donald E. Reymers, Robyn Moxon, Dan O’Connell, Vince Owens, Cara Pendergrass, Susan Klees, Steven D. Targum, and the seven participating clinical trial sites:
Chair’s Office at Johns Hopkins University and University of Toronto: Constantine G. Lyketsos, MD, MHS, Co-PI, Elizabeth Plank Althouse Professor and Chair of Psychiatry and Behavioral Sciences at Johns Hopkins Bayview; Andres M. Lozano, MD, PhD, FRCSC, FRSC, Co-PI, Professor, and Chair of Neurosurgery, Tasker Chair of Functional Neurosurgery; Gwenn Smith, PhD, Imaging Core Director, Richman Family Professor of Psychiatry and Behavioral Sciences, Johns Hopkins University; Cynthia Munro, PhD, Neuropsychologist, Associate Professor of Psychiatry and Behavioral Sciences, Johns Hopkins University; Esther Oh, MD, Medical Monitor, Assistant Professor of Geriatric Medicine, Johns Hopkins University; Jeannie Sheppard Leoutsakos, PhD, Data Core Leader, Assistant Professor of Psychiatry and Behavioral Sciences, Johns Hopkins University.
REFERENCES
[1] | Palop JJ , Mucke L ((2010) ) Amyloid-beta-induced neuronal dysfunction in Alzheimer’s disease: From synapses toward neural networks. Nat Neurosci 13: , 812–818. |
[2] | Smith GS , de Leon MJ , George AE , Kluger A , Volkow ND , McRae T , Golomb J , Ferris SH , Reisberg B , Ciaravino J , La Regina ME ((1992) ) Topography of cross-sectional and longitudinal glucose metabolic deficits in Alzheimer’s disease. Pathophysiologic implications. Arch Neurol 49: , 1142–1150. |
[3] | Zhou J , Seeley WW ((2014) ) Network dysfunction in Alzheimer’s disease and frontotemporal dementia: Implications for psychiatry. Biol Psychiatry 75: , 565–573. |
[4] | Jacobs HI , Radua J , Luckmann HC , Sack AT ((2013) ) Meta-analysis of functional network alterations in Alzheimer’s disease: Toward a network biomarker. Neurosci Biobehav Rev 37: , 753–765. |
[5] | Kapogiannis D , Mattson MP ((2011) ) Disrupted energy metabolism and neuronal circuit dysfunction in cognitive impairment and Alzheimer’s disease. Lancet Neurol 10: , 187–198. |
[6] | Lozano AM , Lipsman N ((2013) ) Probing and regulating dysfunctional circuits using deep brain stimulation. Neuron 77: , 406–424. |
[7] | Laxton AW , Tang-Wai DF , McAndrews MP , Zumsteg D , Wennberg R , Keren R , Wherrett J , Naglie G , Hamani C , Smith GS , Lozano AM ((2010) ) A phase I trial of deep brain stimulation of memory circuits in Alzheimer’s disease. Ann Neurol 68: , 521–534. |
[8] | Powell TPS GR , Cowan WM ((1957) ) A quantitative study of the fornix-mammillothalamic system. J Anat 91: , 419–432. |
[9] | Gondard E , Chau HN , Mann A , Tierney TS , Hamani C , Kalia SK , Lozano AM ((2015) ) Rapid modulation of protein expression in the rat hippocampus following deep brain stimulation of the fornix. Brain Stimul 8: , 1058–1064. |
[10] | Toda H , Hamani C , Fawcett AP , Hutchison WD , Lozano AM ((2008) ) The regulation of adult rodent hippocampal neurogenesis by deep brain stimulation. J Neurosurg 108: , 132–138. |
[11] | Stone SS , Teixeira CM , Devito LM , Zaslavsky K , Josselyn SA , Lozano AM , Frankland PW ((2011) ) Stimulation of entorhinal cortex promotes adult neurogenesis and facilitates spatial memory. J Neurosci 31: , 13469–13484. |
[12] | Hao S , Tang B , Wu Z , Ure K , Sun Y , Tao H , Gao Y , Patel AJ , Curry DJ , Samaco RC , Zoghbi HY , Tang J ((2015) ) Forniceal deep brain stimulation rescues hippocampal memory in Rett syndrome mice. Nature 526: , 430–434. |
[13] | Suthana N , Haneef Z , Stern J , Mukamel R , Behnke E , Knowlton B , Fried I ((2012) ) Memory enhancement and deep-brain stimulation of the entorhinal area. N Engl J Med 366: , 502–510. |
[14] | Miller JP , Sweet JA , Bailey CM , Munyon CN , Luders HO , Fastenau PS ((2015) ) Visual-spatial memory may be enhanced with theta burst deep brain stimulation of the fornix: A preliminary investigation with four cases. Brain 138: , 1833–1842. |
[15] | Smith GS , Laxton AW , Tang-Wai DF , McAndrews MP , Diaconescu AO , Workman CI , Lozano AM ((2012) ) Increased cerebral metabolism after 1 year of deep brain stimulation in Alzheimer disease. Arch Neurol 69: , 1141–1148. |
[16] | Holroyd KB , Fosdick L , Smith GS , Leoutsakos JM , Munro CA , Oh ES , Drake KE , Rosenberg PB , Anderson WS , Salloway S , Pendergrass JC , Burke AD , Wolk DA , Tang-Wai DF , Ponce FA , Asaad WF , Sabbagh MN , Okun MS , Baltuch G , Foote KD , Targum SD , Lozano AM , Lyketsos CG ((2015) ) Deep brain stimulation targeting the fornix for mild Alzheimer dementia: Design of the ADvance randomized controlled trial. Open Access J Clin Trials 7: , 63–76. |
[17] | Jack CR Jr , Albert MS , Knopman DS , McKhann GM , Sperling RA , Carrillo MC , Thies B , Phelps CH ((2011) ) Introduction to the recommendations from the National Institute on Aging-Alzheimer’s Association workgroups on diagnostic guidelines for Alzheimer’s disease. Alzheimers Dement 7: , 257–262. |
[18] | Ponce FA , Asaad W , Foote KD , Anderson WS , Cosgrove R , Baltuch GH , Beasley KD , Reymers DE , Oh ES , Targum SD , Smith G , Lyketsos CG , Lozano AM ((2015) ) 130 Bilateral fornix deep brain stimulation for Alzheimer disease: Surgical safety in the ADvance Trial. Neurosurgery 62: (Suppl 1), 207. |
[19] | Jack CR Jr , Bernstein MA , Fox NC , Thompson P , Alexander G , Harvey D , Borowski B , Britson PJ , J , Ward LW , Dale C , Felmlee AM , Gunter JP , Hill JL , Killiany DL , Schuff R , Fox-Bosetti N , Lin S , Studholme C , DeCarli C , Krueger CS , Ward G , Metzger HA , Scott GJ , Mallozzi KT , Blezek R , Levy D , Debbins J , Fleisher JP , Albert AS , Green M , Bartzokis R , Glover G , Mugler G , Weiner J , MW ((2008) ) The Alzheimer’s Disease Neuroimaging Initiative (ADNI): MRI methods. J Magn Reson Imaging 27: , 685–691. |
[20] | Jack CR Jr , Bernstein MA , Borowski BJ , Gunter JL , Fox NC , Thompson PM , Schuff N , Krueger G , Killiany RJ , Decarli CS , Dale AM , Carmichael OW , Tosun D , Weiner MW , Alzheimer’s Disease Neuroimaging, Initiative ((2010) ) Update on the magnetic resonance imaging core of the Alzheimer’s disease neuroimaging initiative. Alzheimers Dement 6: , 212–220. |
[21] | Jagust WJ , Bandy D , Chen K , Foster NL , Landau SM , Mathis CA , Price JC , Reiman EM , Skovronsky D , Koeppe RA , Alzheimer’s Disease Neuroimaging, Initiative ((2010) ) The Alzheimer’s Disease Neuroimaging Initiative positron emission tomography core. Alzheimers Dement 6: , 221–229. |
[22] | McMullen DP , Rosenberg P , Cheng J , Smith GS , Lyketsos C , Anderson WS ((2016) ) Bilateral cortical encephalomalacia in a patient implanted with bilateral deep brain stimulation for Alzheimer’s disease: Case report. Alzheimer Dis Assoc Disord 30: , 70–72. |
[23] | Hamani C , Dubiela FP , Soares JC , Shin D , Bittencourt S , Covolan L , Carlen PL , Laxton AW , Hodaie M , Stone SS , Ha Y , Hutchison WD , Lozano AM , Mello LE , Oliveira MG ((2010) ) Anterior thalamus deep brain stimulation at high current impairs memory in rats. Exp Neurol 225: , 154–162. |
[24] | Hebert LE , Weuve J , Scherr PA , Evans DA ((2013) ) Alzheimer disease in the United States (2010-2050) estimated using the 2010 census. Neurology 80: , 1778–1783. |
[25] | Migliaccio R , Agosta F , Possin KL , Canu E , Filippi M , Rabinovici GD , Rosen HJ , Miller BL , Gorno-Tempini ML ((2015) ) Mapping the Progression of atrophy in early- and late-onset Alzheimer’s disease. J Alzheimers Dis 46: , 351–364. |
[26] | Kim EJ , Cho SS , Jeong Y , Park KC , Kang SJ , Kang E , Kim SE , Lee KH , Na DL ((2005) ) Glucose metabolism in early onset versus late onset Alzheimer’s disease: An SPM analysis of 120 patients. Brain 128: , 1790–1801. |
[27] | Schneider LS , Kennedy RE , Wang G , Cutter GR ((2015) ) Differences in Alzheimer disease clinical trial outcomes based on age of the participants. Neurology 84: , 1121–1127. |
Figures and Tables
Fig.1
Change in ADAS-Cog 13 and CDR by treatment groups (all subjects) and effect of patient age on clinical outcome. A decreased score (down on the y axis) indicates improvement while an increased score (up on the y axis) indicates worsening. a) Change in ADAS-Cog13 over 12 months by treatment group in all subjects (n = 42). b) Change in CDR-SB over 12 months by treatment group in all subjects (n = 42). c) Change in ADAS-Cog13 over 12 months by treatment group in patients <65 (n = 12). d) Change in CDR-SB over 12 months by treatment group in patients <65 (n = 12). e) Change in ADAS-Cog13 over 12 months by treatment group in patients≥65 (n = 30). f) Change in CDR-SB over 12 months by treatment group in patients≥65 (n = 30). Values shown on graphs are mean ± standard error.
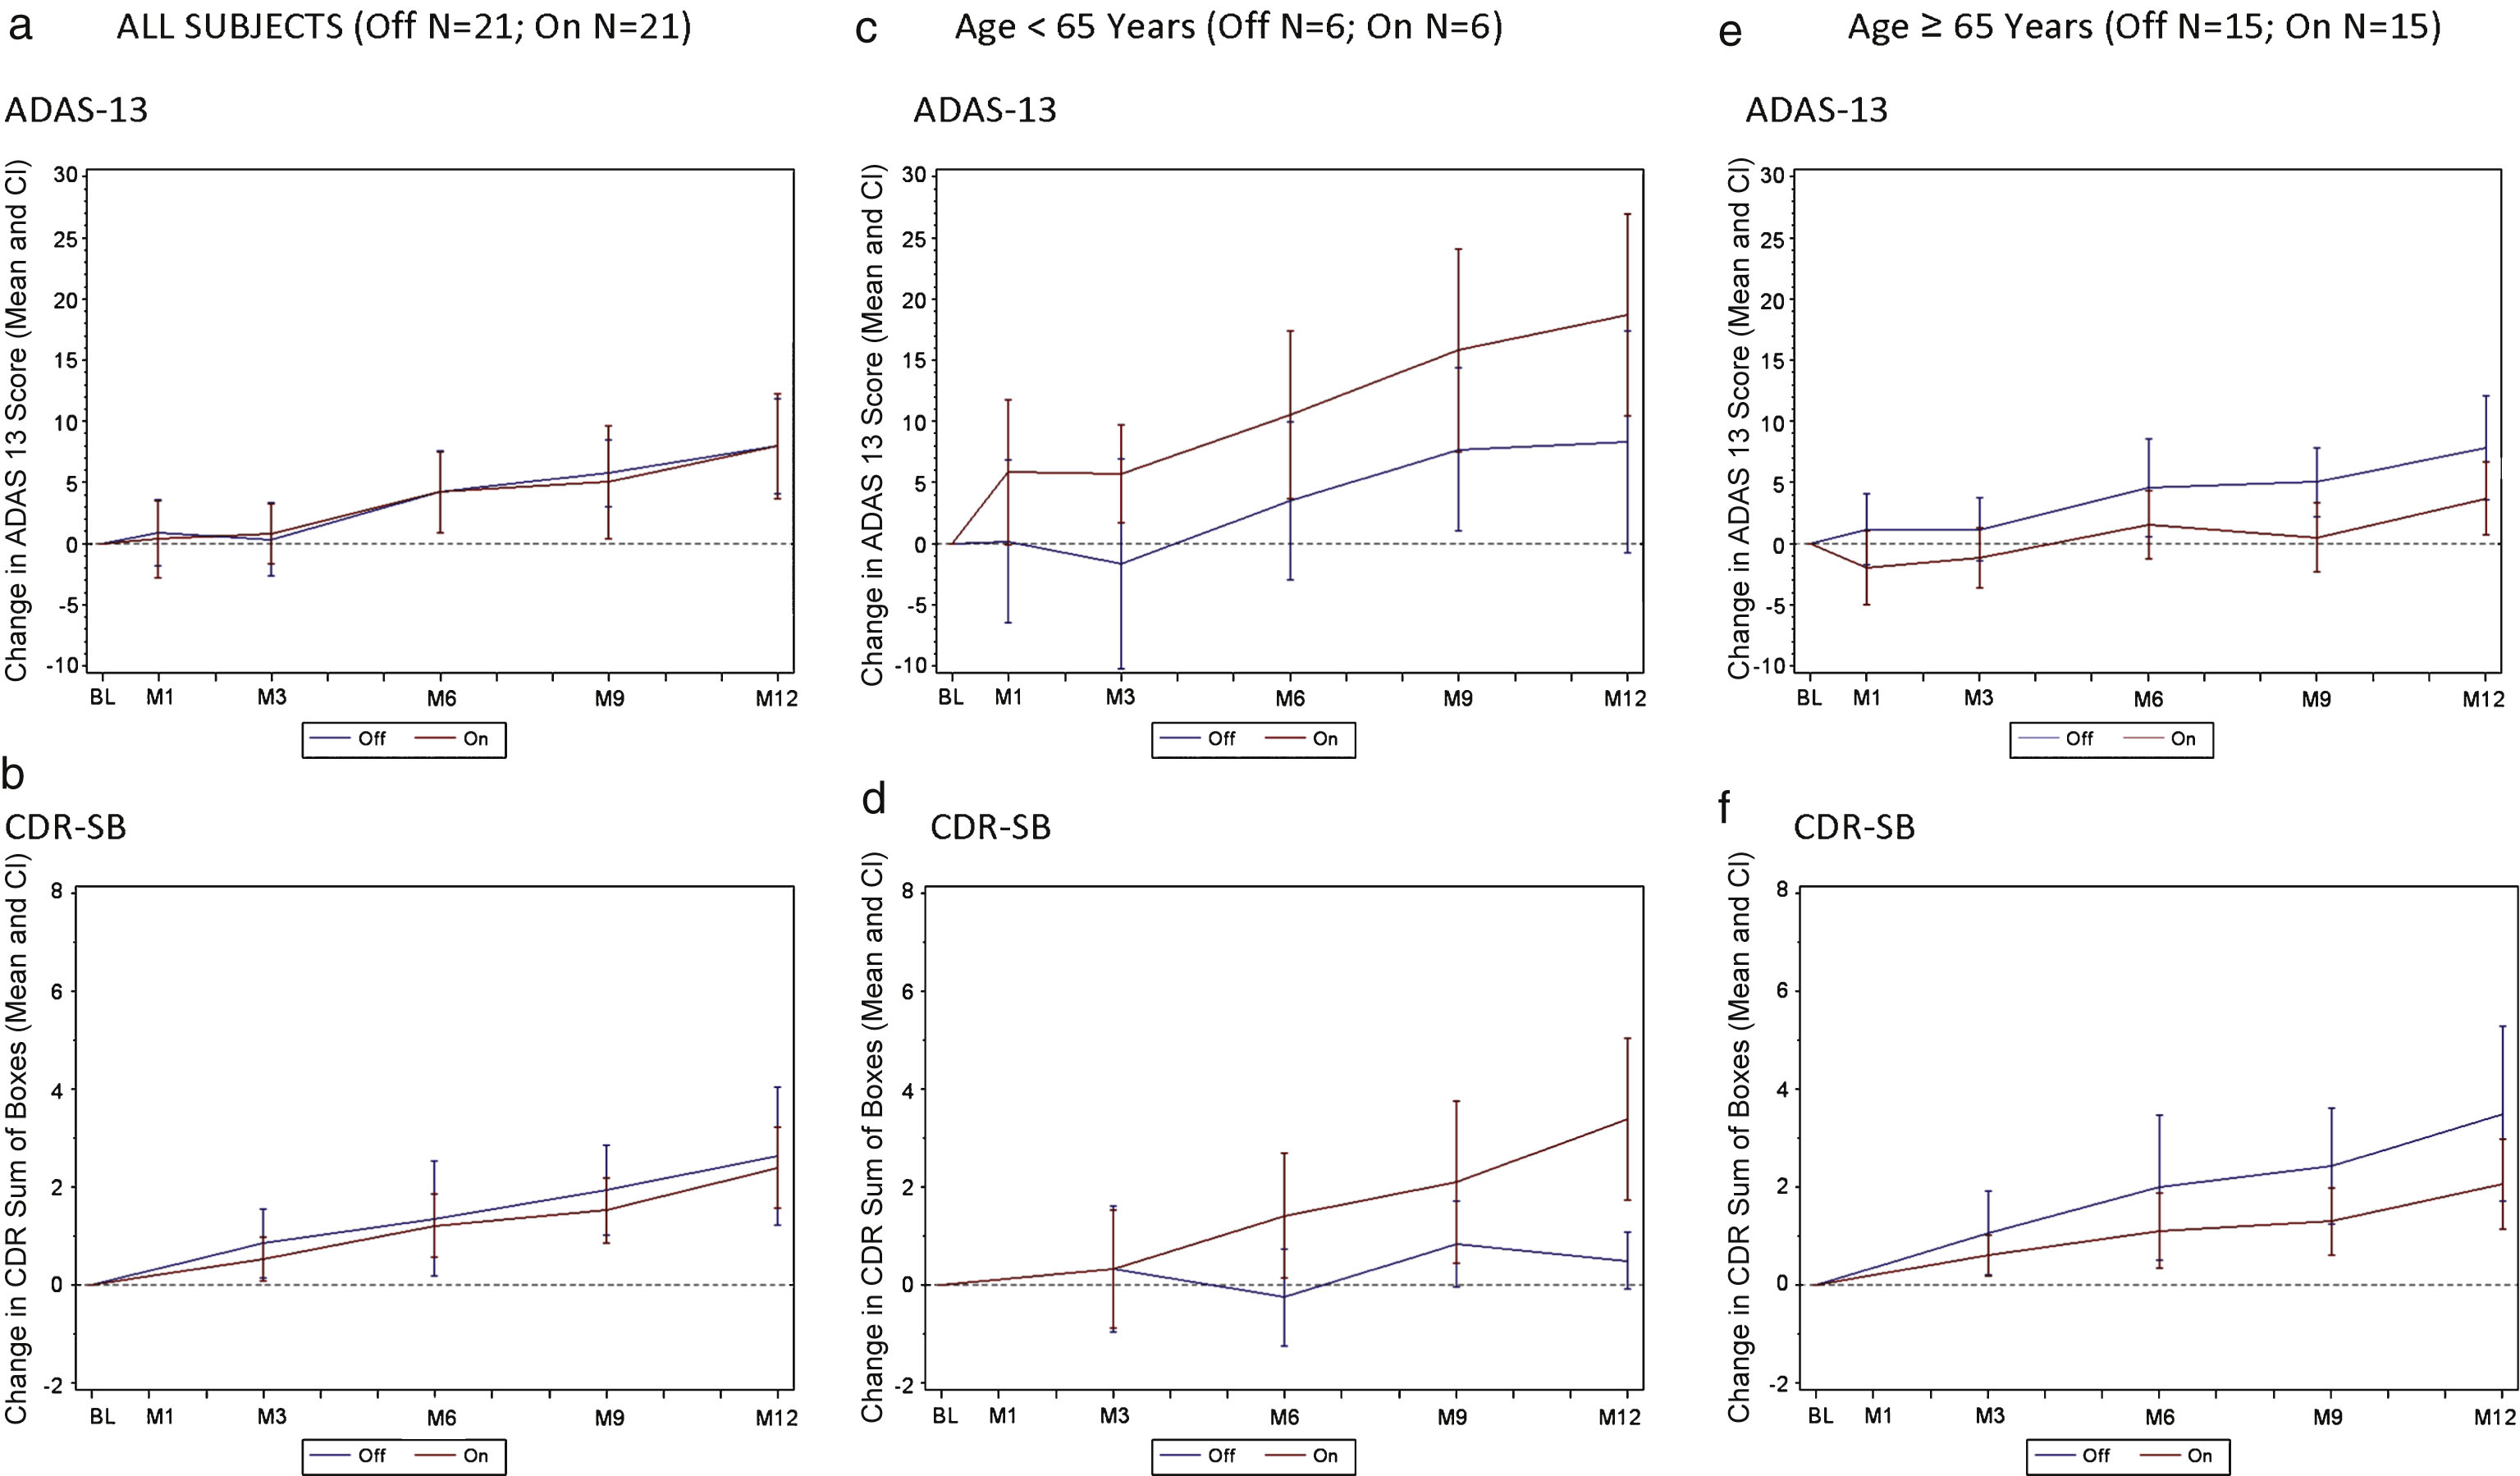
Fig.2
PET Cerebral glucose metabolism images by treatment groups. Summed Axial Images of standardized update values (SUV). BL, baseline, 6 months or 12 months after continuous bilateral deep brain stimulation (DBS) of the fornix. Representative axial sections show that patients in the “Off” group had stable or declining cortical glucose metabolism over time. In patients assigned to “On,” there were increases in brain metabolism at 6 months, particularly in the temporal and parietal regions, that were sustained at 12 months. The color scale indicates SUVs, with red showing highest, yellow and green intermediate and blue lowest. The patients remained on the same medications from baseline to 12 months while receiving DBS.
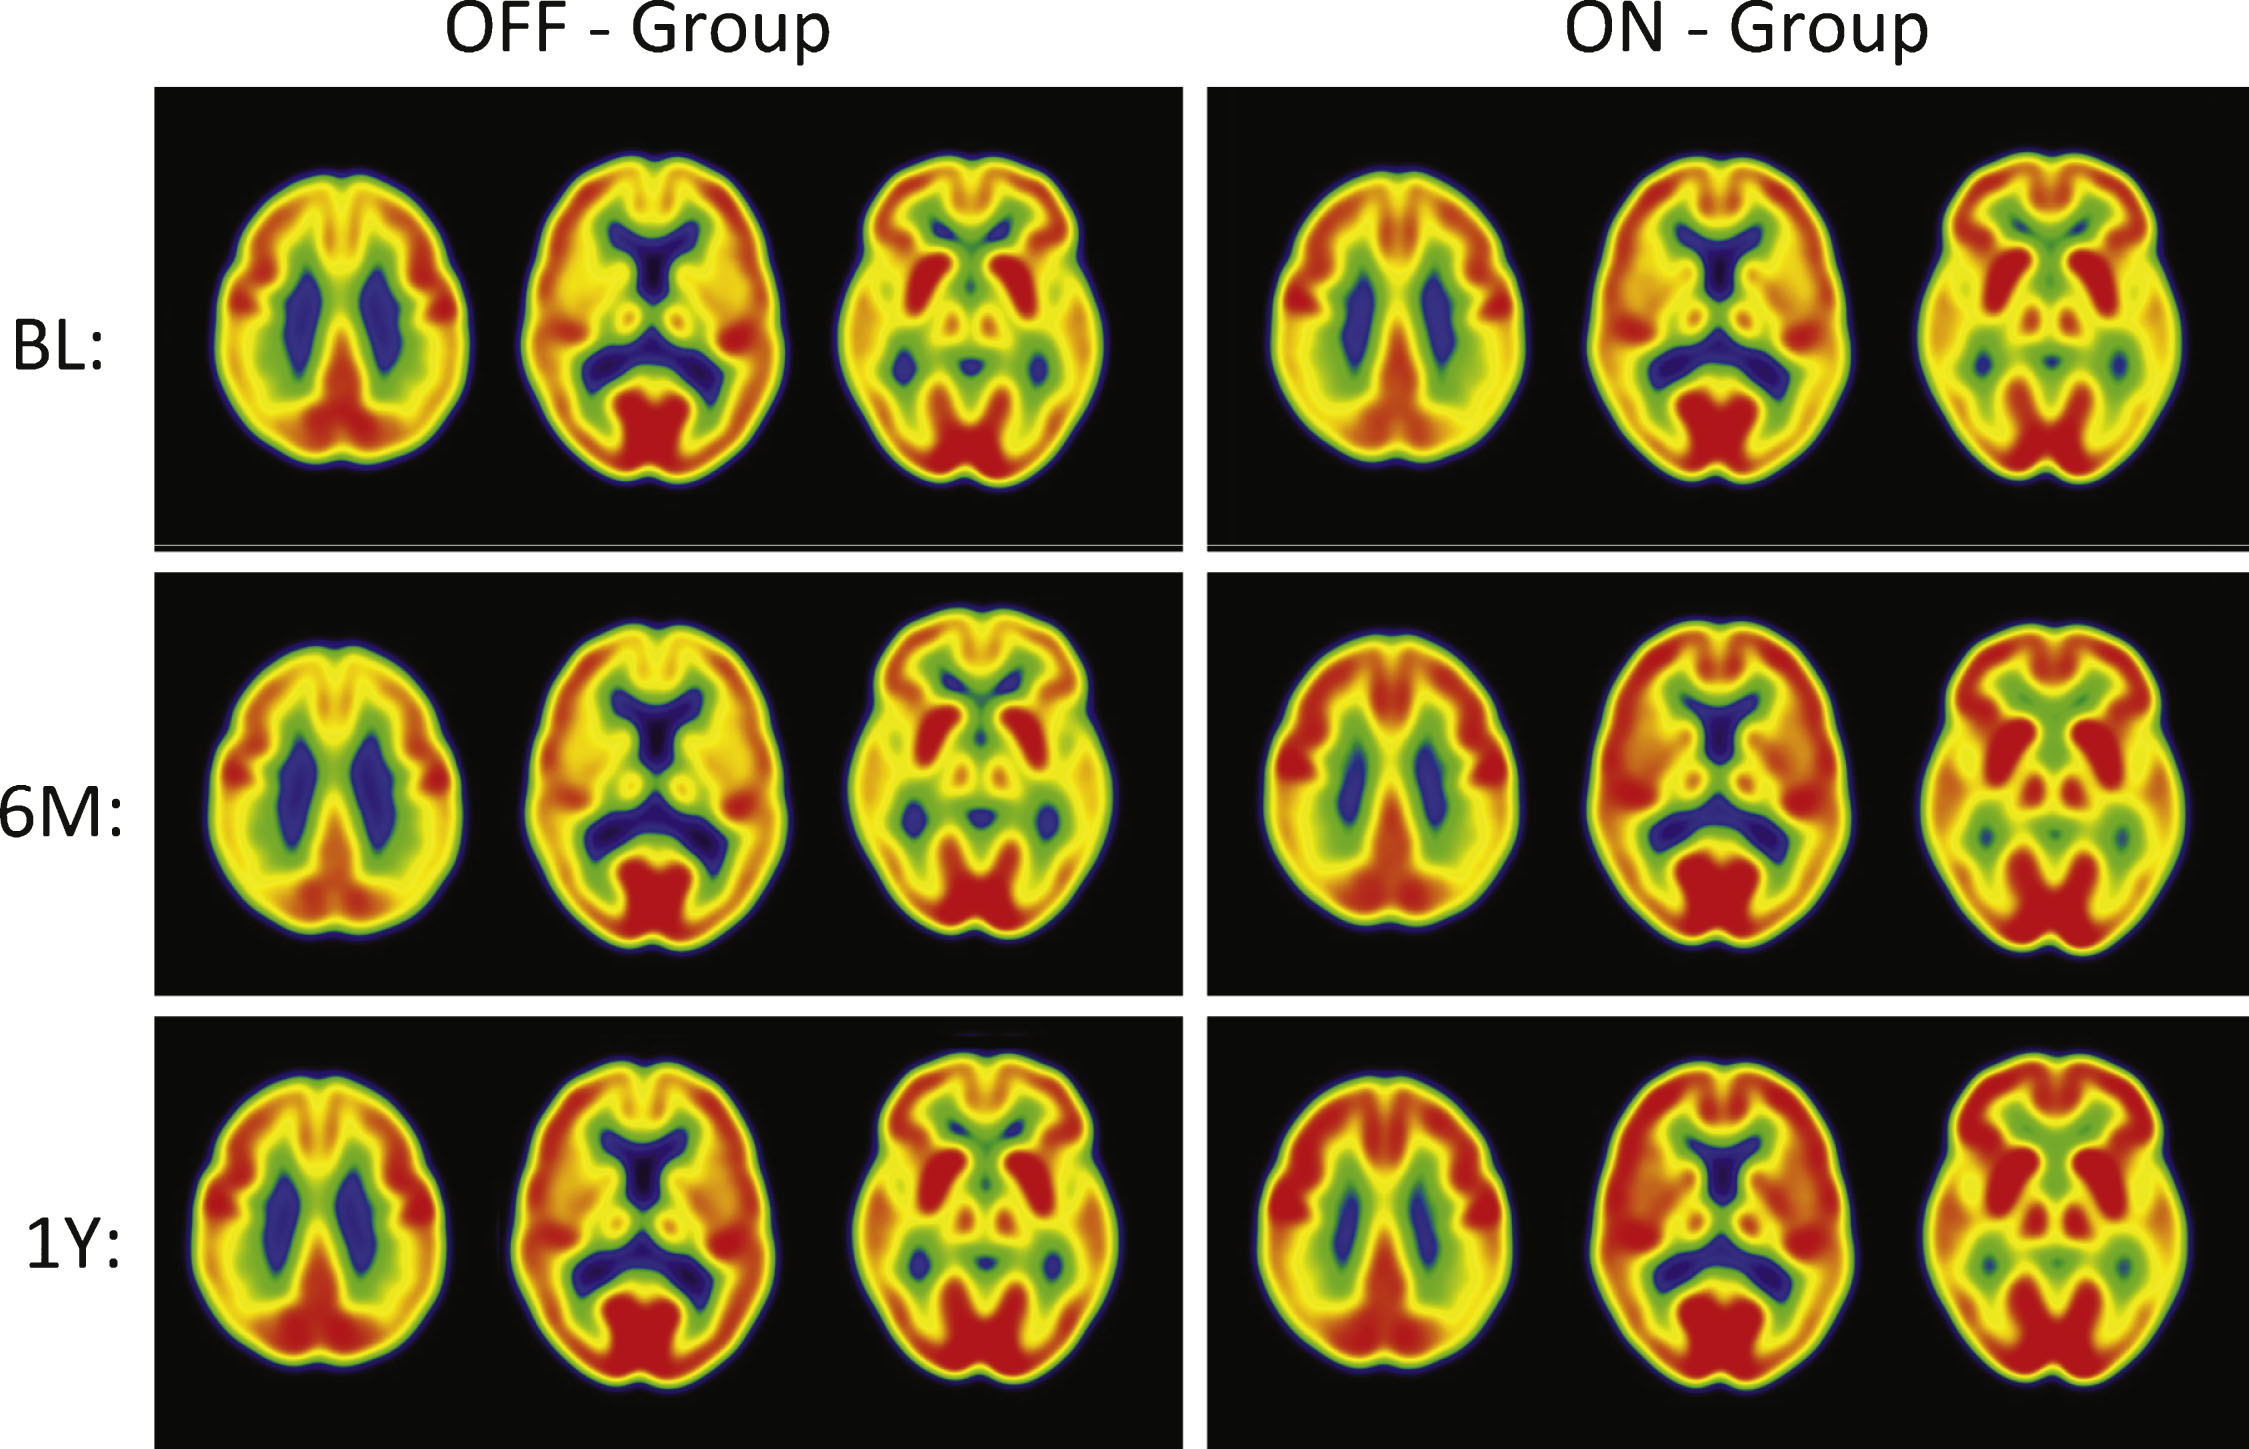
Table 1
Baseline characteristics of study participants randomized to stimulation on or off
| Patient Characteristic | Off Stimulation Group | On Stimulation Group |
| Male gender | 57% (12/21) | 52% (11/21) |
| Age (years) | ||
| Mean ± SD1 (n) | 67.8 ± 8.1 (21) | 68.5 ± 7.7 (21) |
| (min, max) | [71.3] (48.0, 78.0) | [68.1] (51.1, 79.7) |
| Time since diagnosis (years) | ||
| Mean ± SD (n) | 2.2 ± 1.7 (21) | 2.5 ± 1.8 (21) |
| [Median] (min, max) | [1.5] (0.0, 5.9) | [2.0] (0.2, 5.9) |
| ADAS-cog-13 | ||
| Mean ± SD (n) | 27.1 ± 3.8 (21) | 28.6 ± 3.9 (21) |
| [Median] (min, max) | [27.0] (20.0, 34.0) | [29.0] (22.0, 36.0) |
| CDR total score | ||
| 0.5 | 71% (15/21) | 62% (13/21) |
| 1 | 29% (6/21) | 38% (8/21) |
| CDR sum of boxes | ||
| Mean ± SD (n) | 3.6 ± 1.5 (21) | 4.0 ± 1.5 (21) |
| [Median] (min, max) | [3.5] (1.5, 8.0) | [4.0] (1.0, 7.0) |
1standard deviation.
Table 2
Summary of adverse events by category and treatment group as adjudicated by the ADvance study’s CEC
| Event Category | Adverse Events | Serious Adverse Events | ||
| Off Stimulation | On Stimulation | Off Stimulation | On Stimulation | |
| (n = 21) | (n = 21) | (n = 21) | (n = 21) | |
| Surgical | 21 (14%) | 31 (26%) | 3 (33%) | 4 (44%) |
| Programming | 9 (6%) | 0 (0%) | 0 (0%) | 0 (0%) |
| Psychiatric | 40 (28%) | 27 (23%) | 3 (33%) | 0 (0%) |
| General Medical | 75 (52%) | 59 (50%) | 3 (33%) | 5 (56%) |
| Event Subcategory | ||||
| Auditory/Ocular/Oral (HEENT) | 0 | 4 | 0 | 0 |
| Cardiovascular | 8 | 6 | 0 | 1 |
| Constitutional | 2 | 3 | 0 | 1 |
| Dermatological | 9 | 3 | 0 | 0 |
| Endocrine/Metabolic (Lab abnormalities) | 4 | 1 | 0 | 0 |
| Gastrointestinal | 9 | 12 | 0 | 1 |
| Genitourinary | 4 | 4 | 0 | 0 |
| Hematology/Oncology | 2 | 0 | 0 | 0 |
| Infectious disease | 5 | 6 | 1 | 0 |
| Neurological | 23 | 12 | 2 | 2 |
| Ortho/Musculoskeletal | 9 | 6 | 0 | 0 |
| Pulmonary/Upper Respiratory | 0 | 2 | 0 | 0 |
| Total | 145 | 117 | 9 | 9 |
Table 3
Change in cerebral glucose metabolism regions of interest by treatment group after 6 or 12 months of DBS-f in pre-selected groups
| Baseline | Month 6 | Month 12 | ||||||
| Region | OFF1 | ON | OFF % Change2 | ON % Change | p-value3 | OFF % Change | ON % Change | p-value |
| Pre-Central Gyrus | 6.2 ± 2.2 | 5.7 ± 1.9 | –10.3 ± 5.7 | 13.3 ± 9.0 | 0.03 | –2.3 ± 6.8 | 12.0 ± 10.0 | 0.24 |
| Post-Central Gyrus | 6.1 ± 2.1 | 5.7 ± 1.9 | –9.4 ± 5.7 | 14.8 ± 8.8 | 0.03 | –1.2 ± 6.8 | 13.4 ± 9.9 | 0.23 |
| Temporal Association Cortex | 5.5 ± 2.0 | 5.0 ± 1.7 | –12.0 ± 5.4 | 10.8 ± 9.0 | 0.03 | –5.0 ± 6.4 | 7.2 ± 9.5 | 0.29 |
| Hippocampus | 4.1 ± 1.3 | 4.0 ± 1.4 | –11.5 ± 5.4 | 12.0 ± 9.1 | 0.03 | –3.6 ± 6.5 | 9.9 ± 9.2 | 0.23 |
| Parietal Association Cortex | 5.9 ± 2.2 | 5.4 ± 1.8 | –10.9 ± 5.6 | 12.7 ± 8.8 | 0.03 | –3.4 ± 6.6 | 10.4 ± 9.7 | 0.24 |
| Occipital Cortex (Cuneus) | 6.9 ± 2.5 | 6.1 ± 2.2 | –10.6 ± 5.7 | 13.3 ± 9.4 | 0.03 | –3.2 ± 7.0 | 9.6 ± 10.0 | 0.30 |
| Cerebellar Hemispheres | 5.7 ± 1.9 | 5.4 ± 1.9 | –10.1 ± 5.5 | 13.1 ± 9.4 | 0.04 | –1.2 ± 6.6 | 12.7 ± 9.7 | 0.24 |
1Mean ± standard deviation. 2Mean % difference ± standard error. 3p-value of difference in % change between Off and On groups.
Table 4
Changes in cerebral glucose metabolism after 6 and 12 months of DBS-f in pre-selected regions of interest by age and by treatment group
| Age < 65 years | Age≥65 years | ||||||||||
| OFF | ON | OFF | ON | ||||||||
| Region | Visit | n | Mean ± SD | n | Mean ± SD | p-value | n | Mean ± SD | n | Mean ± SD | p-value |
| (SE Change) | (SE Change) | (SE Change) | (SE Change) | ||||||||
| Pre-Central Gyrus | Baseline | 6 | 6.57 ± 1.55 | 6 | 6.61 ± 0.76 | 0.95 | 15 | 6.11 ± 2.50 | 15 | 5.36 ± 2.17 | 0.39 |
| % Change 6 | 6 | –2.20 ± 6.26 | 6 | –0.97 ± 9.18 | 0.91 | 14 | –13.70 ± 7.62 | 13 | 19.87 ± 12.20 | 0.55 | |
| % Change 12 | 6 | –1.21 ± 12.47 | 6 | –4.70 ± 6.86 | 0.81 | 15 | –2.74 ± 8.34 | 14 | 19.10 ± 13.69 | 0.18 | |
| Post-Central Gyrus | Baseline | 6 | 6.48 ± 1.08 | 6 | 6.82 ± 0.67 | 0.52 | 15 | 6.00 ± 2.44 | 15 | 5.31 ± 2.14 | 0.42 |
| % Change 6 | 6 | –0.84 ± 6.90 | 6 | 1.55 ± 8.92 | 0.84 | 14 | –13.05 ± 7.58 | 13 | 20.91 ± 12.07 | 0.02 | |
| % Change 12 | 6 | 0.07 ± 12.56 | 6 | –2.53 ± 6.81 | 0.86 | 15 | –1.69 ± 8.41 | 14 | 20.29 ± 13.58 | 0.67 | |
| Temporal Association Cortex | Baseline | 6 | 5.79 ± 1.30 | 6 | 5.69 ± 0.69 | 0.88 | 15 | 5.44 ± 2.19 | 15 | 4.67 ± 1.87 | 0.31 |
| % Change 6 | 6 | –3.00 ± 6.92 | 6 | –4.30 ± 8.76 | 0.91 | 14 | –15.87 ± 6.96 | 13 | 17.78 ± 12.27 | 0.02 | |
| % Change 12 | 6 | –2.95 ± 12.58 | 6 | –8.68 ± 7.00 | 0.70 | 15 | –5.77 ± 7.65 | 14 | 14.07 ± 13.01 | 0.19 | |
| Hippocampus | Baseline | 6 | 4.66 ± 0.74 | 6 | 4.85 ± 0.45 | 0.61 | 15 | 3.94 ± 1.49 | 15 | 3.67 ± 1.50 | 0.63 |
| % Change 6 | 6 | –2.22 ± 7.56 | 6 | –2.61 ± 8.18 | 0.97 | 14 | –15.46 ± 6.88 | 13 | 18.74 ± 12.46 | 0.02 | |
| % Change 12 | 6 | –0.28 ± 13.26 | 6 | –5.58 ± 6.25 | 0.72 | 15 | –4.88 ± 7.71 | 14 | 16.57 ± 12.57 | 0.15 | |
| Parietal Association Cortex | Baseline | 6 | 5.96 ± 1.57 | 6 | 6.12 ± 0.64 | 0.83 | 15 | 5.84 ± 2.42 | 15 | 5.07 ± 2.06 | 0.36 |
| % Change 6 | 6 | –2.18 ± 6.86 | 6 | –1.17 ± 9.14 | 0.93 | 14 | –13.70 ± 7.62 | 13 | 19.87 ± 12.20 | 0.02 | |
| % Change 12 | 6 | –1.96 ± 11.93 | 6 | –5.93 ± 7.20 | 0.78 | 15 | –3.95 ± 8.18 | 14 | 17.45 ± 13.24 | 0.17 | |
| Occipital (Cuneus) | Baseline | 6 | 6.94 ± 1.76 | 6 | 7.11 ± 1.23 | 0.85 | 15 | 6.92 ± 2.84 | 15 | 5.63 ± 2.39 | 0.19 |
| % Change 6 | 6 | –1.39 ± 7.47 | 6 | –1.46 ± 9.28 | 1.00 | 14 | –14.54 ± 7.46 | 13 | 20.18 ± 12.76 | 0.02 | |
| % Change 12 | 6 | –0.08 ± 11.95 | 6 | –8.37 ± 7.05 | 0.56 | 15 | –4.43 ± 8.73 | 14 | 17.31 ± 13.59 | 0.18 | |
| Cerebellar Hemispheres | Baseline | 6 | 5.90 ± 0.52 | 6 | 6.29 ± 0.80 | 0.34 | 15 | 5.69 ± 2.22 | 15 | 5.09 ± 2.12 | 0.46 |
| % Change 6 | 6 | –1.34 ± 6.95 | 6 | –0.54 ± 9.20 | 0.95 | 14 | –13.86 ± 7.20 | 13 | 19.36 ± 12.95 | 0.03 | |
| % Change 12 | 6 | 1.72 ± 13.15 | 6 | –2.75 ± 6.82 | 0.77 | 15 | –2.34 ± 7.84 | 14 | 19.31 ± 13.40 | 0.17 | |


