
Describing the Sequence of Cognitive Decline in Alzheimer’s Disease Patients: Results from an Observational Study
Abstract
Background: Improved understanding of the pattern of cognitive decline in Alzheimer’s disease (AD) would be useful to assist primary care physicians in explaining AD progression to patients and caregivers.
Objective: To identify the sequence in which cognitive abilities decline in community-dwelling patients with AD.
Methods: Baseline data were analyzed from 1,495 patients diagnosed with probable AD and a Mini-Mental State Examination (MMSE) score ≤ 26 enrolled in the 18-month observational GERAS study. Proportional odds logistic regression models were applied to model MMSE subscores (orientation, registration, attention and concentration, recall, language, and drawing) and the corresponding subscores of the cognitive subscale of the Alzheimer’s Disease Assessment Scale (ADAS-cog), using MMSE total score as the index of disease progression. Probabilities of impairment start and full impairment were estimated at each MMSE total score level.
Results: From the estimated probabilities for each MMSE subscore as a function of the MMSE total score, the first aspect of cognition to start being impaired was recall, followed by orientation in time, attention and concentration, orientation in place, language, drawing, and registration. For full impairment in subscores, the sequence was recall, drawing, attention and concentration, orientation in time, orientation in place, registration, and language. The sequence of cognitive decline for the corresponding ADAS-cog subscores was remarkably consistent with this pattern.
Conclusion: The sequence of cognitive decline in AD can be visualized in an animation using probability estimates for key aspects of cognition. This might be useful for clinicians to set expectations on disease progression for patients and caregivers.
INTRODUCTION
Alzheimer’s disease (AD) is a progressive neurodegenerative disease characterized by cognitive decline, behavioral and psychological symptoms, and impaired activities of daily living. Patients with AD are faced with the inevitable decline from mild to moderate and, eventually, to severe stages of the disease. To help patients and their families understand the prognosis of AD and plan for the future, clinicians need to be able to communicate a realistic outline of the progression expected. This requires an improved understanding of the sequence of cognitive decline in AD, which is associated with and tends to precede functional decline [1, 2]. Greater understanding of cognitive decline could also be used to improve the design of clinical trials, especially those investigating the effects of drugs aimed at disease modification, and in economic modeling.
AD is predominantly a disorder affecting memory in the early stages but other aspects of cognition (language, attention, executive function, and praxis) are also affected during the progression of the disease. The main aspects of cognition affected in AD can be assessed using rating scales, such as the Mini-Mental State Examination (MMSE) [3], and the cognitive subscale of the Alzheimer’s Disease Assessment Scale (ADAS-cog) [4]. The MMSE has, to date, been the most widely used tool to assess cognitive function in both routine clinical practice and research settings. It is reported as an MMSE total score, which correlates with disease progression [5–8]. However, it can be difficult for clinicians and patients/caregivers to understand what a decline in MMSE total score means in terms of impairment and practical management issues [9]. The subscores for the different cognitive components of MMSE may provide useful information on AD progression, including the sequence in which individual aspects of cognition begin to decline and the order in which full impairment can be expected for each aspect.
Previous studies of AD progression have investigated the temporal course of cognitive decline by examining longitudinal changes in the MMSE total score or ADAS-cog total score [10–14]. Although these studies have provided valuable information, there are several reasons why it is difficult to use cognitive change scores over time for characterizing or predicting AD progression. First, AD typically progresses slowly, although some rapidly progressive forms have been identified [15]. This slow progression means that expensive long-term studies are needed to accurately describe the whole time course of cognitive decline. Second, although a decline in cognitive function is inevitable for patients with AD, the rate of cognitive decline for each patient is unknown and some longitudinal studies have indicated that it can be non-linear and highly variable [10, 11, 14, 16, 17]. This can make it difficult to design studies that take place over a sufficient time period to represent the full course of decline in a broad patient population with different rates of decline. Also, the severity of cognitive impairment can be influenced by patient factors including age, education, sex, and place of residence (e.g., living at home alone or with family or in a nursing home) [18].
Determining the sequence in which cognitive abilities are lost will improve our understanding of AD progression. In this post-hoc analysis of data from the GERAS observational study [19], we have assessed cognitive decline in AD patients using the MMSE total score as the index of disease progression. This removes the reliance on changes over time, and instead assesses what happens at each MMSE score ranging from 26 to 0.
The objective of our analysis was to determine the sequence of cognitive decline in patients with AD using the subscores of MMSE and ADAS-cog from the GERAS baseline dataset (note: ADAS-cog was available only for patients with MMSE ≥ 14). We then developed an animation that could be used to explain AD progression to patients and their caregivers.
METHODS
GERAS study design and participants
GERAS was an 18-month, multicenter, observational study conducted in France, Germany, and the UK, to assess the direct and indirect costs (calculated using country-specific valuations) associated with AD for community-dwelling patients and their caregivers. The study design and baseline patient characteristics have been reported in detail [19]. Briefly, study enrollment occurred between October 2010 and September 2011. Patients and caregivers were evaluated at baseline and underwent up to three more visits at 6-month intervals as part of routine care. Only patient data obtained at the baseline visit were used in this analysis. Sensitivity analyses were also performed based on including data from all visits and to examine any influence of age, sex, and years of education on the results.
The study centers were mostly specialist secondary care clinics (“memory clinics”). Patients enrolled in the study were community-dwellers aged ≥ 55 years with probable AD (National Institute of Neurological and Communicative Disorders and Stroke and Alzheimer’s Disease and Related Disorders Association [NINCDS-ADRDA] criteria [20]), an MMSE score of ≤ 26, and who presented within the normal course of care. Patients were also required to have an informal caregiver who was willing to participate in the study and to undertake responsibility for the patient for at least 6 months of the year. All patients (or their legal representative) and caregivers were required to provide written informed consent before entering the study, which was approved by ethical review boards in each country according to country-specific regulations.
Patient cognitive function was assessed using the MMSE and ADAS-cog [4], although ADAS-cog was only assessed in patients with MMSE ≥ 14 in accordance with the study protocol and the results of previous research [21]. Other patient information collected at baseline included sociodemographics, comorbidities (depression, epilepsy, stroke, ischemic cardiac disease, hypertension, diabetes mellitus, hypercholesterolemia, cancer, urinary tract disorder, and obstructive pulmonary disease; recorded as yes/no), medications, health-related quality of life (evaluated using the EuroQol-5 Dimensions [EQ-5D] questionnaire [22]), functional ability (assessed using the Alzheimer’s Disease Co-operative Study Activities of Daily Living Inventory [ADCS-ADL] [23]), and behavioral and psychological symptoms of dementia (assessed using the Neuropsychiatric Inventory [NPI] [24]).
As reported previously [19], the study aimed to recruit equal numbers of patients in each of three disease severity groups based on MMSE criteria: Mild AD (MMSE 21–26 points); moderate AD (MMSE 15–20 points); moderately severe/severe (MS/S) AD (MMSE <15 points) to cover the full spectrum of AD severity.
Cognitive function assessment
MMSE
The MMSE is a brief test consisting of 30 items that require only 5–10 min to administer and has a total score that ranges from normal (30) to severe impairment (0) [3]. The questions are grouped into seven categories, with each subscore representing a specific aspect of cognition: Orientation in time (score range 0–5); orientation in place (score range 0–5); registration (score range 0–3); attention and concentration (either counting or spelling backwards, score range 0–5); recall (score range 0–3); language (score range 0–8); and drawing (score range 0–1).
ADAS-cog
ADAS-cog is widely used to measure cognitive performance in clinical trials [25] and measures multiple cognitive domains, including memory, orientation, visuospatial ability, language, and praxis. However, it is more time-consuming than the MMSE and, although the overall performance of ADAS-cog is satisfactory, many components may underestimate differences in cognitive performance in mild and moderate AD [26]. The original 11-item ADAS-cog subscale developed by Rosen et al. [4] has a total score range of 0–70, with a lower score indicating better cognitive performance, and consists of the following components: Word recall task (score range 0–10); naming objects and fingers (score range 0–5); following commands (score range 0–5); constructional praxis (score range 0–5); ideational praxis (score range 0–5); orientation (score range 0–8); word recognition task (score range 0–12); spoken language ability (score range 0–5); comprehension of spoken language (score range 0–5); word finding difficulty (score range 0–5); and recall of test instructions (score range 0–5). Additional items were added by Mohs et al. [21] to give the ADAS-cog 14 scale with a total score ranging from 0–90; the additional items were delayed word recall (score range 0–10), number cancellation test (score range 0–5), and the maze completion test of executive function (score range 0–5).
In the GERAS study, ADAS-cog was only applied to patients with an MMSE score ≥ 14 points. In this analysis, we present results only for the selected subscales of ADAS-cog 14 that were considered to correspond with the seven MMSE subscales (Table 1).
Proportional Odds Model (POM)
Using data obtained at the baseline visit for the total GERAS cohort, proportional odds models (POM) for ordered categorical data [27] were used to model each MMSE subscore and each ADAS-cog subscore with the MMSE total score as the explanatory variable. This method uses a logistic link function to model cumulative probabilities of each MMSE subscore. Each model produced probability estimates with 95% confidence intervals (CI) for each subscore level and possible total score. Figure 1 illustrates how the POM models probabilities for impairment start through to full impairment for a subscale with a score range of 0–3, such as the MMSE recall subscale. The probability curves are constrained to be ordered by subscore level and parallel.
The seven MMSE subscores have different score ranges. Only one curve was generated for the MMSE drawing subscore because it has a score range of 0–1. Figure 1 also shows how the probability of no, some, and full impairment of an MMSE subscore at each MMSE total score can be visualized as a colored bar chart, from which an animation was developed (Supplementary Video).
Two POM curves were generated for each subscore (except MMSE drawing subscore) showing the probability of impairment start and of full impairment. As an example of the probability estimates, 95% CI, and empirical frequencies obtained, Fig. 2 shows the results obtained for one of the MMSE subscores, in this case the orientation in place subscore, which has a score range 0–5: The curve on the right shows the probability (and 95% CI) of a 1-point decrease from the maximum score (i.e., patient starts being impaired), and the curve on the left shows the probability (and 95% CI) that the subscore is <1 (i.e., patient is fully impaired). These curves do not represent a change over time, but describe the most likely status for this subscore at each level of MMSE total score as measured at the baseline visit. As MMSE total score correlates with the patient’s disease progression over time [5], we used cross-sectional data for MMSE total score as a surrogate for progressed time on the disease scale to identify the sequence in which cognitive abilities decline.
The sequence of decline across the MMSE (and ADAS-cog) subscores was determined by visual inspection of the curves or by considering a probability of 0.5 (or 50%) to be the cut-off point and determining the order in which the probability curves for impairment start and full impairment cross this cut-off point.
All statistical analyses were performed using R 2.15.1, package VGAM (0.9–0).
RESULTS
Table 2 presents the demographic and clinical characteristics at baseline of the 1,495 patients eligible for analysis in the total cohort and by disease severity group. The total study population had an average age of 77.6 years, was 54.8% female, the average time since AD diagnosis was 2.2 years, mean (SD) MMSE total score was 17.4 (6.34), and the mean ADAS-cog score was 35.1 (9.95).
The probability estimates for impairment start and full impairment for each MMSE subscore as a function of the MMSE total score are shown in Fig. 3. The first aspect of cognition to start being impaired was recall, followed by orientation in time, attention and concentration, orientation in place, language, drawing, and registration. The sequence for probability of full impairment for the MMSE subscores was: Recall, drawing, attention and concentration, orientation in time, orientation in place, registration, and language.
Figure 4 shows the probability estimates for impairment start and full impairment for those ADAS-cog subscores that correspond with an MMSE subscore. The first aspect of cognition to start failingwas word recall (word recall task and delayed word recall), followed by orientation, number cancellation, constructional praxis, executive function, and language. The sequence for probability of full impairment was delayed word recall, number cancellation, executive function, orientation, word recall task, constructional praxis, and language. Supplementary Figure 1 shows the probability of impairment start and full impairment for all ADAS-cog subscores.
Table 3 summarizes the sequence of cognitive decline for the MMSE and ADAS-cog subscores according to AD severity (as defined in this study by MMSE total scores) and shows that the sequence of cognitive decline was similar for both scales. For example, recall (MMSE subscore) and delayed word recall (ADAS-cog subscore) both reached full impairment in mild AD, while orientation in time (MMSE subscore) and orientation (ADAS-cog subscore) both reached full impairment in MS/S AD.
Sensitivity analyses examined whether the use of the data from all visits or whether the factors age, sex, or years of education affected the results. Although a slight shift in the POM curves was observed, the overall sequences of decline were unchanged (data on file).
To make the results more meaningful for patients, we translated the headings for the seven MMSE subscores into layman’s terms: recall was replaced with “difficulty acquiring new information”; orientation in time was replaced with “gets confused about the day of the week”; orientation in place was replaced with “forget where you are and how you got there”; registration was replaced with “forget things which have just been said”; drawing was replaced with “problems assembling objects together, completing a jigsaw”; language was replaced with “trouble finding the right words”; and attention and concentration was replaced with “trouble maintaining attention and concentration”. These terms were used in the preliminary explanation of the animation (see Supplementary Video) which shows the probability of no impairment (green), some impairment (yellow), and full impairment (red) as the total MMSE score counts down from 26–0 to represent disease progression. Figure 5 shows three stills from the animation at MMSE total scores of 26, 20, and 5 to illustrate what physicians can show to patients and caregivers to explain the likely sequence of cognitive decline.
DISCUSSION
The purpose of this analysis of the baseline data from the GERAS study was to describe the sequence of cognitive decline in AD patients using the specific subscores of MMSE and ADAS-cog in relation to the MMSE total score, which was used as the index of disease progression. The results show that there appears to be a consistent pattern of cognitive decline across the MMSE and ADAS-cog scales, such that word recall and orientation are the first aspects to start declining in the early stages of the disease, followed by attention and concentration, language, constructional praxis, and executive function in the mild and moderate AD stages and, finally, registration (immediate memory), which becomes fully impaired at the more severe stage of the disease. As seen in Table 3, the probability of full impairment reaches 50% for word recall (recall in MMSE and delayed word recall in ADAS-cog) at the mild AD stage, whereas most other aspects of cognition do not reach this probability threshold until patients have progressed to the MS/S stage of dementia due to AD.
Based on our findings, we developed a simple animation that can be used to explain the likely sequence of progression for the different aspects of cognition in patients with AD to patients and caregivers. Clinicians could use this animation to provide patients and caregivers with examples of what to expect in terms of cognitive decline and then discuss the potential practical repercussions of this disease progression. By raising such awareness, families can put appropriate plans into place to cope with the disease as it progresses. Moreover, there may be an impact on clinical research, improving the focus on specific cognitive domains that are affected early in the disease process and finding treatments targeted towards helping subjects with early signs and symptoms of cognitive problems.
In general, our results are consistent with clinical experience and support and extend previous research on the evolution of cognitive decline over time from longitudinal studies [14, 17, 28, 29]. We show that the first MMSE subscores to start declining are word recall and orientation in time and place. These findings indicate that memory starts to decline before attention and executive function, which is consistent with reports that memory complaints are often the first signs of cognitive decline noticed by patients and caregivers and one of the first clinical symptoms in patients with typical AD [30, 31], which we could assume is the more represented AD phenotype in the GERAS study population.
Previous prospective studies of AD progression have focused on the magnitude and rate of cognitive decline over time using total scores from cognitive scales [10, 14, 17]. Only a few studies have examined individual cognitive domains [32–34], and this is the first time proportional odds modeling has been used to visualize the sequence of cognitive decline in AD patients, especially the distinction between start of impairment and full impairment.
A recent longitudinal study in patients with mild cognitive impairment who progressed to AD showed that different cognitive domains have different patterns of decline, with immediate recall declining more gradually than delayed recall in the pre-dementia phase [35]. In our analyses, the MMSE registration task was the last to show impairment start, in contrast with the ADAS-cog word recall task which was one of the first to start failing. This discrepancy could reflect a different sensitivity of the two scales in identifying the gradual impairment of immediate recall. This could be explained by the different scoring ranges of the two tasks: MMSE registration consists of recall of three words, score range 0–3, whereas the ADAS-cog word recall task averages the number of non-recalled words in three trials to recall 10 words, score range 0–10. It is, therefore, easier to show an initial impairment with the ADAS-cog word recall task than with the MMSE registration task, given the greater demand of the task and the scoring.
Our results support and extend those of an early study in 86 patients by Ashford et al. [36], who used item characteristic curve analysis to examine the pattern of loss of individual MMSE items (rate and severity) using the MMSE total score as an indicator of AD severity and disease progression. Ashford et al. [36] found that MMSE items reflecting recent memory were lost at MMSE total scores >20, while orientation in time and place became impaired at MMSE total scores >10 and <20, and the naming and repetition of simple words/objects was lost at a later stage (MMSE total score or 10 or less).
Language impairment occurs early in AD and language function deteriorates as the disease progresses [37, 38]. An important finding of our study is that although language starts to be impaired at a relatively early stage in the disease process (i.e., the probability of impairment start reaches 50% for the MMSE language subscore at an MMSE total score representing mild AD), and includes problems such as difficulty finding the right words, it appears to decline slowly as the disease progresses such that there is a low probability of full impairment of language even at very severe stages of the disease. Although this finding may reflect the large score range for the MMSE language subscore (0–8), such that detection of impairment start is quite subtle, it also supports previous reports that language impairment in early AD involves difficulties with word finding, naming, and word comprehension [38]. The MMSE language subscore assesses different aspects of language (e.g., naming, comprehension, repetition) that are not likely to be impaired at the same time. The ADAS-cog language subscore we analyzed was spoken language ability, which is a global assessment of speech quality (scored 0–5) and started to be impaired in moderate AD (see Table 3). In moderate and severe stages of AD, there is profound loss of verbal fluency and widespread language failure, and language may be restricted to a few simple phrases or words at the very severe stage [38]. However, language function occupies a widespread network with the capacity for reorganization, and there may be physiological compensation to the altered connectivity in the early stages of AD [37]. This form of cognitive reserve may explain why we observed resilience to full impairment of language even at the very severe stage of AD.
For each cognitive function, the probability of impairment varies between patients. This can be seen from the slope of the curves of the proportional odds estimates of the probability of impairment (Figs. 3 and 4): The shallower the slope, the more between-patient variation there is. For example, in Fig. 3, the 20% earliest patients to start being impaired on the MMSE language subscore had a baseline MMSE total score above 26, while the 20% latest patients to start being impaired on language had a baseline MMSE total score less than 18, whereas for the drawing subscore, the 20% earliest and 20% latest patients to start being impaired have an MMSE total score above 24 and less than 12, respectively.
The drawing subscore of MMSE (based on the ability to copy two interlocking pentagons) reflects general visuomotor function and was one of the last aspects of cognition to start failing: In the moderate stage of AD (MMSE total score 15–20), Fig. 3 indicates the probability of no impairment was between 40% and 65%. However, as drawing is only a 1-point item (no or full impairment), it was also the second MMSE subscore to reach full impairment. The corresponding ADAS-cog subscore was constructional praxis, which started to decline at the mild AD stage (MMSE total score 25) but the probability of full impairment did not reach 50% until the very severe stage of AD (MMSE total score 2). Some previous studies have indicated that visuomotor control is impaired in the early stages of AD such that patients show a decline in their ability to process and integrate visual information to produce motor responses [39, 40]. Visuomotor impairment may affect the ability of patients to perform daily activities, so is an important feature of AD to assess.
Attention, as measured by the MMSE attention and concentration subscore or the ADAS-cog number cancellation item, started to be impaired in patients in the early stage of the disease (i.e., with a high MMSE total score). This is consistent with previous reports that attention is the first non-memory domain affected in AD, before deficits in language and visuospatial function, and plays a role in difficulties with daily living [41]. Executive function was assessed in ADAS-cog using a maze test and involves a wide range of cognitive tasks including foresight, planning, reasoning, problem solving, and freedom from distraction [21]. As seen in Table 3, the estimated probability for impairment start in the maze test reached 50% among patients with moderate AD (MMSE total score 17) and full impairment for patients with MS/S AD (MMSE total score 8) suggesting that impairment in executive function declines as the disease progresses over quite a narrow range of MMSE scores. The maze test is a simpler test than number cancellation, which may explain why it becomes impaired at a later stage of AD. A recent meta-analysis found a consistent moderate association between executive function and activities of daily living in patients diagnosed with AD [42]. Thus, people with AD with executive dysfunction are likely to have difficulties with everyday functioning, especially instrumental ADL such as shopping, preparing meals, handling finances, managing medication, and driving [43, 44]. Treatments that target attention and executive function may help to maintain patient independence and decrease caregiver burden [44].
The sequence of cognitive decline in patients with AD may be influenced by several factors. Comorbidities, such as depression, may impact on cognitive performance [45]. Sociodemographic variables such as age, sex, educational level, race/ethnicity, social class, and place of residence have been shown to be related to the MMSE score [5, 18], but there are conflicting reports and possible interactions between the different variables. Roselli et al. [46] found that male sex, vascular risk factors (hypertension, type 2 diabetes), and more years of education were associated with a faster cognitive decline in AD patients, while Musicco et al. [47] found that older age, lower education, and type 2 diabetes were associated with a slower progression of cognitive decline. Psychosis has also been associated with a more rapid cognitive decline [48]. Our sensitivity analyses of the effects of age, sex, and years of education found that, although there were small shifts in the POM curves, these effects did not alter our overall conclusions about the sequences of decline.
The strengths of our study include the large sample of community-dwelling patients with a wide range of AD severity assessed in the naturalistic setting, using standardized instruments for assessing cognition. Care was taken to include approximately one-third of the patients in each of the mild, moderate and MS/S stages of AD. This allowed for improved estimates of probabilities of decline across the full spectrum of MMSE total scores. The use of total MMSE score as a surrogate for disease progression allowed our alternative analysis of cognitive decline based on different MMSE scores. A sensitivity analysis found that the results generated using baseline data only were consistent with what would be observed using data from all visits in the GERAS study. This approach has an advantage over using longitudinal data, which would require a very long follow-up period to follow a similar range of scores. Patients in longitudinal studies of AD have high rates of discontinuation, which may be affected by AD severity at baseline [49]—patients with more severe AD are more likely to withdraw early from a longitudinal study, reducing the amount of information that can be obtained for more severe AD. Among patients participating in a longitudinal study there will be differences in the time since AD diagnosis and severity at baseline, such that they are not all at the same point on the disease scale; their rates of decline will also differ.
Some limitations should be considered when interpreting the present results. First, although the sequence of cognitive decline has been identified in this AD population, the exact timeframe and rate of decline is unknown. Although our cross-sectional analysis has the advantages mentioned previously, it does not allow the type of evaluation of the AD disease course that may be performed using longitudinal studies. As we used MMSE total score as the index of disease progression, our inferences cannot be accurately converted to calendar time. Moreover, the rate of decline may differ for each aspect of cognition. For example, in a retrospective study of cognitive changes in Chinese patients with AD, Zhao et al. [29] found that attention, executive function, and visuospatial function declined more rapidly than memory and language. The lag time between start of and full impairment in our analysis may provide a way to compare rates of progression between MMSE subscores with similar ranges.
Second, the use of MMSE as both variable of interest and outcome is worthy of note. While the MMSE total score was used as an indication of disease progression, MMSE subscores were the outcomes of interest, measuring the different aspects of cognition. This approach provides a convenient framework for a description of the sequence of cognitive decline as disease progresses but has some limitations. Statistically, there will be a correlation between the covariate (MMSE total score) and outcome (MMSE subscore), but this is a common situation which justifies covariates adjustments in statistical modeling. Moreover, we found similar results when using ADAS-cog subscores as the outcomes of interest.
Third, the results are for the GERAS study sample (UK, Germany, France), which was recruited from memory clinics. Thus, the findings should be replicated in more general AD patient populations. Moreover, the patients included in the study had a clinical diagnosis of probable AD and it is possiblethat some patients may not have AD. Data from our analyses cannot be generalized to patients with early-onset AD as evidence indicates that such patients have a more rapid rate of cognitive decline [50]. The sequence of cognitive decline may also differ for patients with early-onset AD: Smits et al. [51] found that memory function was relatively well preserved in the early stages of the disease, while visuospatial functioning, executive functioning, and attention was worse in moderate AD, compared with late-onset AD patients. The sequence of cognitive decline may also differ for 6–14% of patients with non-amnestic or atypical forms of AD [31], characterized by early, predominant, and progressive impairment in visuoperceptive and visuospatial function (posterior variant of AD), language (logopenic variant of AD), or behavior (frontal variant of AD), with relative preservation of memory [31, 52, 53].
Fourth, all patients in the GERAS study were required to have an informal caregiver who was willing to participate in the study and to undertake responsibility for the patient for at least 6 months of the year. This potentially introduces selection bias and may influence the external validity of the study.
Fifth, the different ranges of the MMSE subscores (0–8, 0–5, 0–3, 0–1) may complicate the interpretation of the results. Also, both the MMSE and ADAS-cog have been considered relatively insensitive because of ceiling and floor effects, which may limit their usefulness to detect change [24, 54–56]. As already discussed, the discrepancy in the sequence of decline between the MMSE registration task and ADAS-cog word recall task may be explained by differences in the scoring range and sensitivity of the tests. Other detailed and sensitive tests of specific cognitive domains may give a different sequence of cognitive decline. MMSE scores may be influenced by several factors including patient age, education, and cultural background [5]. Although we performed several sensitivity analyses, which supported the robustness of our conclusions, it is possible that variables not adjusted for may have affected the results. Also, we did not perform adjusted analyses for the ADAS-cog subscores as the sensitivity analyses for the MMSE subscores indicated that they did not alter the sequence of cognitive decline in the overall study population. In the present study, ADAS-cog was not measured in patients with MS/S AD (MMSE <15), so the probability estimates for the ADAS-cog subscores are based on a smaller sample of patients (n = 1,026).
Sixth, our analysis aimed to describe the sequence of cognitive decline in the overall study population, regardless of whether patients were taking AD medication or not (as seen in Table 2, only 14% of patients were not on AD medication at the baseline assessment). Although treatment may affect the level of cognition or speed of progression of symptoms, it may not affect the actual sequence of cognitive decline. This interesting relationship between treatment and cognitive decline (disease progression) will be considered in future analyses of longitudinal data from the GERAS study.
Finally, it is now widely accepted that cognitive decline can occur months or even years before a clinical diagnosis of AD is made [30]. This study does not include cognitive decline during this prodromal phase as patients with an MMSE score >26 were not included in the study. However, an advantage of using the MMSE total score as the index of disease progression is that it does not matter how long a patient has had cognitive impairment for this analysis.
Conclusions
Our results show a clear sequence of cognitive decline in community-dwelling patients diagnosed with AD. We used the MMSE total score as an index of disease progression and linked it to probabilities of impairment in individual cognitive domains to determine the sequence of cognitive decline in patients with AD. Awareness of the sequence of cognitive decline could be used by clinicians to guide treatment decisions and help patients and caregivers understand the prognosis and plan for the future. We have developed a simple animation to show the sequence of decline in cognitive functions that could be used to raise awareness of patients/caregivers of what to expect regarding cognitive symptoms.
ACKNOWLEDGMENTS
The study was sponsored by Eli Lilly and Company. The authors would like to thank Deirdre Elmhirst and Claire Lavin (Rx Communications, Mold, UK) for medical writing assistance with the preparation of this article, funded by Eli Lilly and Company.
Carsten Henneges, Catherine Reed, Yun-Fei Chen, and Grazia Dell’Agnello are employees of Eli Lilly and Company, and also hold some Lilly shares. Jeremie Lebrec is a full-time contractor with Eli Lilly and Company.
All patients (or their legal representative) and caregivers provided written informed consent before entering the study, which was approved by ethical review boards in each country according to country-specific regulations. This study was conducted in accordance with the ethical principles that have their origin in the Declaration of Helsinki and that were consistent with good clinical practices and applicable laws and regulations of the countries where the study was conducted.
Authors’ disclosures available online (http://j-alz.com/manuscript-disclosures/15-0852r1).
Appendices
The supplementary material is available in the electronic version of this article: http://dx.doi.org/10.3233/JAD-150852.
REFERENCES
[1] | Liu-Seifert H , Siemers E , Sundell K , Price K , Han B , Selzler K , Aisen P , Cummings J , Raskin J , Mohs R ((2015) ) Cognitive and functional decline and their relationship in patients with mild Alzheimer’s dementia. J Alzheimers Dis 43: , 949–955. |
[2] | Zahodne LB , Manly JJ , MacKay-Brandt A , Stern Y ((2013) ) Cognitive declines precede and predict functional declines in aging and Alzheimer’s disease. PLoS One 8: , e73645. |
[3] | Folstein MF , Folstein SE , McHugh PR ((1975) ) Mini-mental state. A practical method for grading the cognitive state of patients for the clinician. J Psychiatr Res 12: , 189–198. |
[4] | Rosen WG , Mohs RC , Davis KL ((1984) ) A new rating scale for Alzheimer’s disease. Am J Psychiatry 141: , 1356–1364. |
[5] | Tombaugh TN , McIntyre NJ ((1992) ) The mini-mental state examination: A comprehensive review. J Am Geriatr Soc 40: , 922–935. |
[6] | Ritchie CW , Terrera GM , Quinn TJ ((2015) ) Dementia trials and dementia tribulations: Methodological and analytical challenges in dementia research. Alzheimers Res Ther 7: , 31. |
[7] | Atchison TB , Massman PJ , Doody RS ((2007) ) Baseline cognitive function predicts rate of decline in basic-core abilities of individuals with dementia of the Alzheimer’s type. Arch Clin Neuropsychol 22: , 99–107. |
[8] | Leoutsakos JM , Forrester SN , Corcoran CD , Norton MC , Rabins PV , Steinberg MI , Tschanz JT , Lyketsos CG ((2015) ) Latent classes of course in Alzheimer’s disease and predictors: The Cache County Dementia Progression Study. Int J Geriatr Psychiatry 30: , 824–832. |
[9] | Gelb DJ ((2000) ) Measurement of progression in Alzheimer’s disease: A clinician’s perspective. Statist Med 19: , 1393–1400. |
[10] | Cortes F , Nourhashemi F , Guerin O , Cantet C , Gillette-Guyonnet S , Andrieu S , Ousset P-J , Vellas B , REAL-FR Group ((2008) ) Prognosis of Alzheimer’s disease today: A two-year prospective study in 686 patients from the REL-FR study. Alzheimers Dement 4: , 22–29. |
[11] | Wilson RS , Segawa E , Boyle PA , Anagnos SE , Hizel LP , Bennett DA ((2012) ) The natural history of cognitive decline in Alzheimer’s disease. Psychol Aging 27: , 1008–1017. |
[12] | Ito K , Ahadieh S , Corrigan B , Fench J , Fullerton T , Tensfeldt T ; Alzheimer’s Disease Working Group ((2010) ) Disease progression meta-analysis model in Alzheimer’s disease. Alzheimers Dement 6: , 39–53. |
[13] | Samanti MN , Farnum M , Lobanov V , Yang E , Raghavan N , DiBernado A , Narayan V ; the Alzheimer’s Disease Neuroimaging Initiative ((2012) ) An improved model for disease progression in patients from the Alzheimer’s Disease Neuroimaging Initiative. J Clin Pharmacol 52: , 629–644. |
[14] | Vellas B , Hausener L , Frolich L , Cantet C , Gardette V , Reynish E , Gillette S , Agilera-Morales E , Auriacombe S , Boada M , Bullock R , Byrne J , Camus V , Cherubini A , Eriksdotter-Jonhagen M , Frisoni GB , Hasselbalch S , Jones RW , Martinez-Lage P , Rikkert MO , Tsolaki M , Ousset P-J , Pasquier F , Ribera-Casado J-M , Rigaud AS , Robert P , Rodriguez G , Salmon E , Salva A , Scheltens P , Schneider A , Sinclair A , Spiru L , Touchon J , Zekry D , Winblad B , Andrieu S ((2012) ) Progression of Alzheimer disease in Europe: Data from the European ICTUS study. Curr Alzheimer Res 9: , 902–912. |
[15] | Schmidt C , Wolff M , Bartlau T , Korth C , Zerr I ((2011) ) Rapidly progressive Alzheimer Disease. Arch Neurol 68: , 1124–1130. |
[16] | Vellas B , Andrieu S , Cantet C , Dartigues JF , Gauthier S ((2007) ) Long-term changes in ADAS-cog: What is clinically relevant for disease modifying trials in Alzheimer? J Nutr Health Aging 11: , 338–341. |
[17] | Gillette-Guyonnet S , Andrieu S , Nourhashemi F , Gardette V , Coley N , Cantet C , Gauthier S , Ousset P-J , Vellas B ; REAL.FR study group ((2011) ) Long-term progression of Alzheimer’s disease in patients under antidementia drugs. Alzheimers Dement 7: , 579–592. |
[18] | Pradier C , Sakarovitch C , Le Duff F , Layese R , Metelkina A , Anthony S , Tifratena K , Robert P ((2014) ) The mini-mental state examination at the time of Alzheimer’s disease and related disorders diagnosis, according to age, education, gender and place of residence: A cross-sectional study among the French National Alzheimer Database. PLoS One 9: , e103630. |
[19] | Wimo A , Reed CC , Dodel R , Belger M , Jones RW , Happich M , Argimon JM , Bruno G , Novick D , Vellas B , Haro JM ((2013) ) The GERAS study: A prospective observational study of costs and resource use in Alzheimer’s disease of community dwellers in three European countries–study design and baseline findings. J Alzheimers Dis 36: , 385–399. |
[20] | McKhann G , Drachman D , Folstein M , Katzman R , Price D , Stadlan EM ((1984) ) Clinical diagnosis of Alzheimer’s disease: Report of the NINCDS-ADRDA Work Group under the auspices of Department of Health and Human Services Task Force on Alzheimer’s Disease. Neurology 34: , 939–944. |
[21] | Mohs RC , Knopman D , Petersen RC , Ferris SH , Ernesto C , Grundman M , Sano M , Bieliauskas L , Geldmacher D , Clark C , Thal LJ ((1997) ) Development of cognitive instruments for use in clinical trials of antidementia drugs: Additions to the Alzheimer’s Disease Assessment Scale that broadens its scope. The Alzheimer’s Disease Cooperative Study. Alzheimer Dis Assoc Disord 11: (Suppl 2), S13–S21. |
[22] | Kind P ((1996) ) The EuroQol instrument: An index of health-related quality of life. In: Quality of Life and Pharmacoeconomics in Clinical Trials, Spilker B , ed. Philadelphia, Lippincott-Raven, pp. 191–201. |
[23] | Galasko D , Bennett D , Sano M , Ernesto C , Thomas R , Grundman M , Ferris S ((1997) ) An inventory to assess activities of daily living for clinical trials in Alzheimer’s disease. The Alzheimer’s Disease Cooperative Study. Alzheimer Dis Assoc Disord 11: (Suppl 2), S33–S39. |
[24] | Cummings JL , Mega M , Gray K , Rosenberg-Thompson S , Carusi DA , Gornbein J ((1994) ) The neuropsychiatric inventory: Comprehensive assessment of psychopathology in dementia. Neurology 44: , 2306–2314. |
[25] | Robert P , Ferris S , Gauthier S , Ihl R , Winblad B , Tennigkeit F ((2010) ) Review of Alzheimer’s disease scale: Is there a need for a new multi-domain scale for therapy evaluation in medical practice? Alzheimers Res Ther 2: , 24. |
[26] | Cano SJ , Posner HB , Moline ML , Hurt SW , Swartz J , Hsu T , Hobart JC ((2010) ) The ADAS-cog in Alzheimer’s disease clinical trials: Psychometric evaluation of the sum and its parts. J Neurol Neurosurg Psychiatry 81: , 1363–1368. |
[27] | Agresti A ((2002) ) Categorical Data Analysis, 2nd Edition (Wiley Series in Probability Statistics), John Wiley & Sons Inc., New York. |
[28] | Bilgel M , An Y , Lang A , Prince J , Ferrucci L , Jedynak B , Resnick SM ((2014) ) Trajectories of Alzheimer disease-related cognitive measures in a longitudinal sample. Alzheimer Dement 10: , 735–742. |
[29] | Zhao Q , Zhou B , Ding D , Teramukai S , Guo Q , Fukushinma M , Hong Z ((2014) ) Cognitive decline in patients with Alzheimer’s disease and its related factors in a memory clinic setting, Shanghai, China. PLoS One 9: , e95755. |
[30] | Albert MS ((2011) ) Changes in cognition. Neurobiol Aging 32: , S58–S63. |
[31] | Dubois B , Feldman HH , Jacova C , Hampel H , Molineuva JL , Blennow K , DeKosky ST , Gauthier S , Selkoe D , Bateman R , Cappa S , Crutch S , Engelborghs S , Frisoni GB , Fox NC , Galasko D , Habert MO , Jicha GA , Nordberg A , Pasquier F , Rabinovici G , Robert P , Rowe C , Salloway S , Sarazin M , Epelbaum S , de Souza LC , Vellas B , Visser PJ , Schneider L , Stern Y , Scheltens P , Cummings JL ((2014) ) Advancing research diagnostic criteria for Alzheimer’s disease: The IWG-2 criteria. Lancet Neurol 13: , 614–629. |
[32] | Persson CM , Wallin AK , Levander S , Minthon L ((2009) ) Changes in cognitive domains during three years in patients with Alzheimer’s disease treated with donepezil. BMC Neurol 10: , 7. |
[33] | Small BJ , Viitanen M , Backman L ((1997) ) Mini-mental state examination scores as predictors of Alzheimer’s disease: Incidence data from the Kungsholmen project, Stockholm. J Gerontol 52: , 299–304. |
[34] | Sevigny JJ , Peng Y , Liu L , Lines CR ((2010) ) Item analysis of ADAS-cog: Effect of baseline cognitive impairment in a clinical AD trial. Am J Alzheimers Dis Other Demen 25: , 119–124. |
[35] | Cloutier S , Chertkow H , Kergoat M-J , Gauthier S , Belleville S ((2015) ) Patterns of cognitive decline prior to dementia in persons with mild cognitive impairment. J Alzheimers Dis 47: , 901–913. |
[36] | Ashford JW , Kolm P , Colliver JA , Bekian C , Hsu L-N ((1989) ) Alzheimer patient evaluation and the mini-mental state: Item characteristic curve analysis. J Gerontol 44: , 139–146. |
[37] | Verma M , Howard RJ ((2012) ) Semantic memory and language dysfunction in early Alzheimer’s disease: A review. Int J Geriatr Psychiatry 27: , 1209–1217 . |
[38] | Ferris SH , Farlow M ((2013) ) Language impairment in Alzheimer’s disease and benefits of acetylcholinesterase inhibitors. Clin Interv Aging 8: , 1007–1014. |
[39] | Tippett WJ , Krajewski A , Sergio LE ((2007) ) Visuomotor integration is compromised in Alzheimer’s disease patients reaching for remembered targets. Eur Neurol 58: , 1–11. |
[40] | Verheij S , Muilwijk D , Pel JJ , van der Cammen TJ , Mattace-Raso FU , van der Steen J ((2012) ) Visuomotor impairment in early-stage Alzheimer’s disease: Changes in relative timing of eye and hand movements. J Alzheimers Dis 30: , 131–143. |
[41] | Bracco L , Bessi V , Padiglioni S , Marini S , Pepeu G ((2014) ) Do cholinesterase inhibitors act primarily on attention deficit? A naturalistic study in Alzheimer’s disease patients. J Alzheimers Dis 40: , 737–742. |
[42] | Martyr A , Clare L ((2012) ) Executive function and activities of daily living in Alzheimer’s disease: A correlational meta-analysis. Dement Geriatr Cogn Disord 33: , 189–203. |
[43] | Farias ST , Cahn-Weiner DA , Harvey DJ , Reed BR , Mungas D , Kramer JH , Chui H ((2009) ) Longitudinal changes in memory and executive functioning are associated with longitudinal change in instrumental activities of daily living in older adults. Clin Neurophyschol 23: , 446–461. |
[44] | Marshall G , Rentz DM , Frey MT , Locascio JJ , Johnson KA , Sperling RA ; Alzheimer’s Disease Neuroimaging Initiative ((2011) ) Executive function and instrumental activities of daily living in MCI and AD. Alzheimers Dement 7: , 300–308. |
[45] | Bom de Araujo N , Moraes HS , Silveira H , Arcoverde C , Vasques PE , Barca ML , Knapskog A-B , Engedal K , Coutinho ESF , Deslandes AC , Laks J ((2014) ) Impaired cognition in depression and Alzheimer (AD): A gradient from depression to depression in AD. Arq Neuropsiquiatr 72: , 671–679. |
[46] | Roselli F , Tartaglione B , Federico F , Lepore V , Defazio G , Livrea P ((2009) ) Rate of MMSE score change in Alzheimer’s disease: Influence of education and vascular risk factors. Clin Neurol Neurosurg 111: , 327–330. |
[47] | Musicco M , Palmer K , Salamone G , Lupo F , Perri R , Mosti S , Spalletta G , di Iulio F , Pettenati C , Cravello L , Caltagirone ((2009) ) Predictors of progression of cognitive decline in Alzheimer’s disease: Role of vascular and sociodemographic factors. J Neurol 256: , 1288–1295. |
[48] | Wilkosz PA , Seltman HJ , Devlin B , Weamer EA , Lopez OL , DeKosky ST , Sweet RA ((2010) ) Trajectories of cognitive decline in Alzheimer’s disease. Int Psychogeriatr 22: , 281–290. |
[49] | Coley N , Gardette V , Cantet C , Gillette-Guyonnet S , Nourhashemi F , Vellas B , Andrieu S ((2011) ) How should we deal with missing data in clinical trials involving Alzheimer’s disease patients? Curr Alzheimer Res 8: , 421–433. |
[50] | Panegyres PK , Chen H-Y ((2013) ) Differences between early and late onset Alzheimer’s disease. Am J Neurodegener Dis 2: , 300–306. |
[51] | Smits LL , Pijnenburg YA , Koedam EL , van der Vlies AE , Reuling IE , Koene T , Teunissen CE , Scheletens P , van der Flier WM ((2012) ) Early onset Alzheimer’s disease is associated with a distinct neuropsychological profile. J Alzheimers Dis 30: , 101–108. |
[52] | Galton CJ , Patterson K , Xuereb JH , Hodges JR ((2000) ) Atypical and typical presentations of Alzheimer’s disease: A clinical, neuropsychological, neuroimaging and pathological study of 13 cases. Brain 123: , 484–498. |
[53] | Snowden JS , Stopford CL , Julien CL , Thompson JC , Davidson Y , Gibbons L , Pritchard A , Lendon CL , Richardson AM , Varma A , Neary D , Mann DM ((2007) ) Cognitive phenotypes in Alzheimer’s disease and genetic risk. Cortex 43: , 835–845. |
[54] | Schmitt FA , Wichems CH ((2006) ) A systematic review of assessment and treatment of moderate to severe Alzheimer’s disease. Prim Care Companion J Clin Psychiatry 8: , 158–169. |
[55] | Wesnes KA ((2008) ) Assessing change in cognitive function in dementia: The relative utilities of the Alzheimer’s Disease Assessment Scale –cognitive subscale and the Cognitive Drug Research system. Neurodegenerative Dis 5: , 261–263. |
[56] | Benge JF , Balsis S , Geraci L , Massman PJ , Doody RS ((2009) ) How well do the ADAS-cog and its subscales measure cognitive dysfunction in Alzheimer’s disease? Dement Geriatr Cogn Disord 28: , 63–69. |
Figures and Tables
Fig.1
Proportional Odds Model (POM) illustration for an MMSE subscore ranging from 0 (complete impairment) to 3 (no impairment). To understand the POM, consider an MMSE subscore ranging from 0 to 3. A logistic regression could be used to estimate the probability of the subscore being = 0 across the different MMSE total score values (leftmost sigmoid curve). Another logistic regression model might be set up to estimate the probabilities for a subscore being ≤ 1 (middle curve). Finally, a logistic regression model may estimate the probability of impairment start (rightmost curve). The POM simultaneously fits those three logistic curves respecting their natural order and can thus be seen as a sandwich of logistic regression models. These probabilities at each MMSE total score can be visualized as colored bar charts for development of an animation that follows the sequence of what happens for each subscore starting at MMSE total score = 26 and counting down to MMSE total score = 0. The example in the figure shows the probability of no, some, and full impairment at MMSE total score = 15.
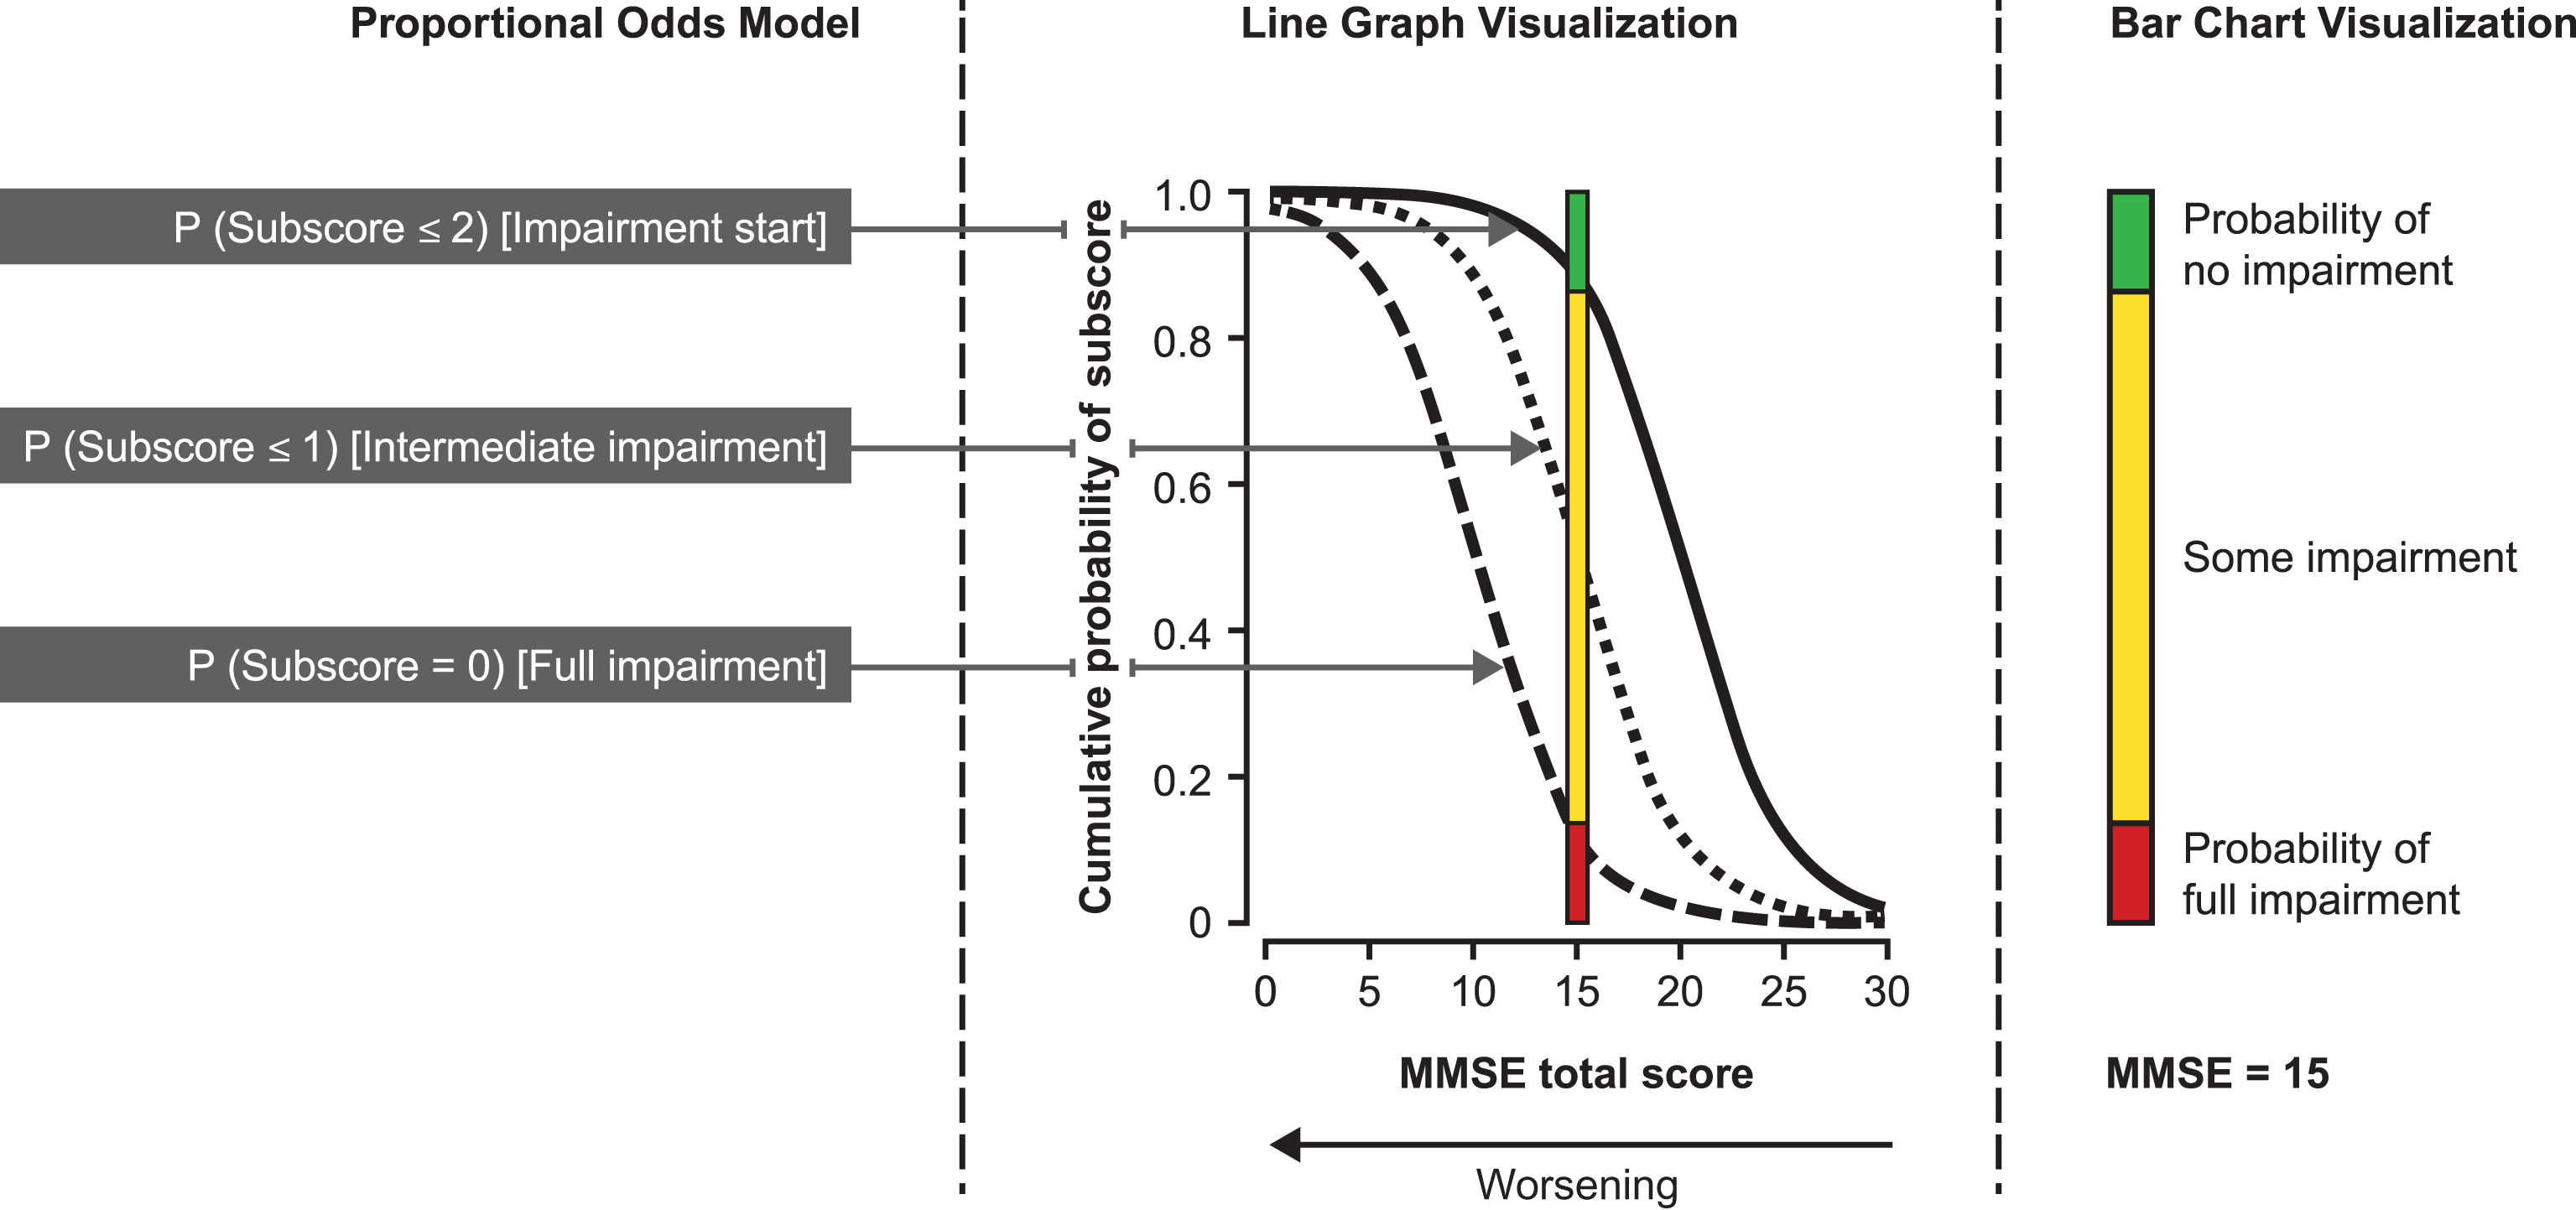
Fig.2
Proportional odds estimates (and 95% confidence intervals) of impairment start and full impairment for the MMSE subscore of orientation in place as a function of the MMSE total score (n = 1,495). To aid understanding of Figs 3 and 4, this figure gives an example of the data obtained from the POM for one of the MMSE subscores (orientation in place), including the estimated probabilities, 95% CI and empirical frequencies. The right curve is the probability that the subscore is a 1-point decrease from the maximum score (i.e., start of impairment for the patient). The left curve is the probability the subscore is <1 (i.e., patient is fully impaired). To avoid making Fig. 3 and Fig. 4 too complex, they do not include the 95% CI or empirical frequencies.
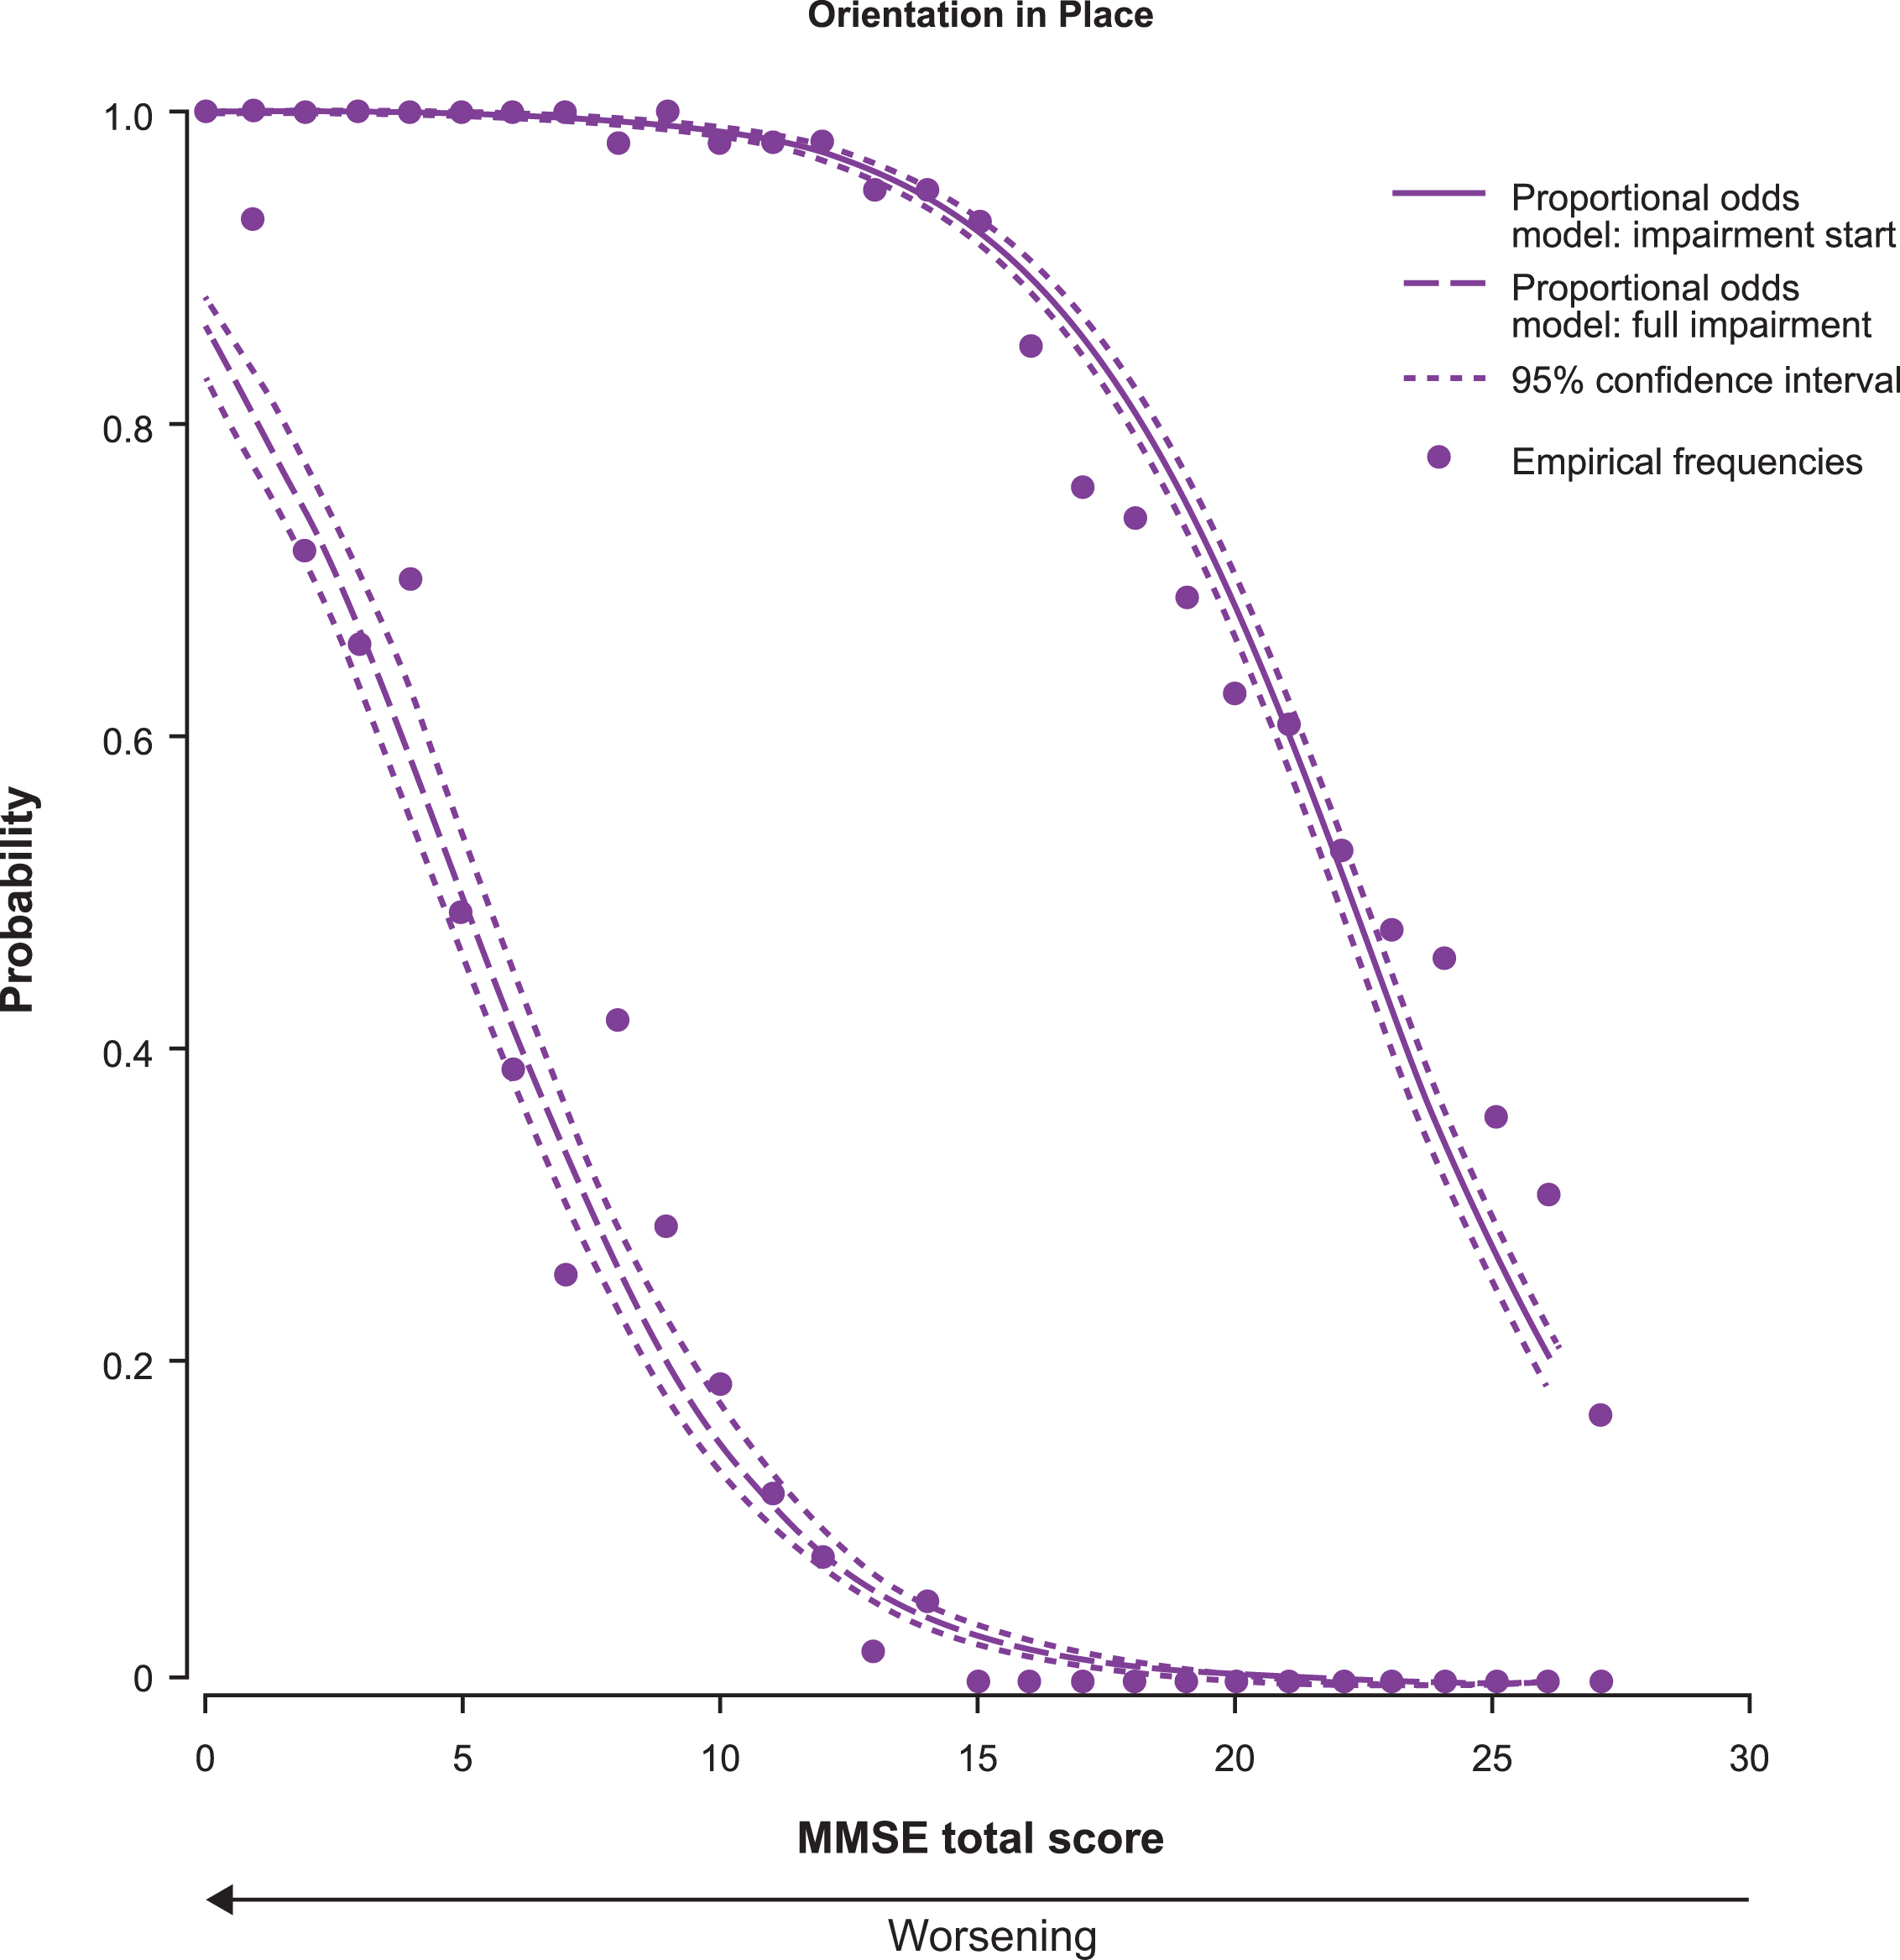
Fig.3
Proportional odds estimates of the probability of impairment start (solid line) and full impairment (dashed line) for each MMSE subscore as a function of the MMSE total score (n = 1,495). There is only one curve for the MMSE drawing subscore because it has a score range of 0–1. Thus, the line represents both impairment start and full impairment.
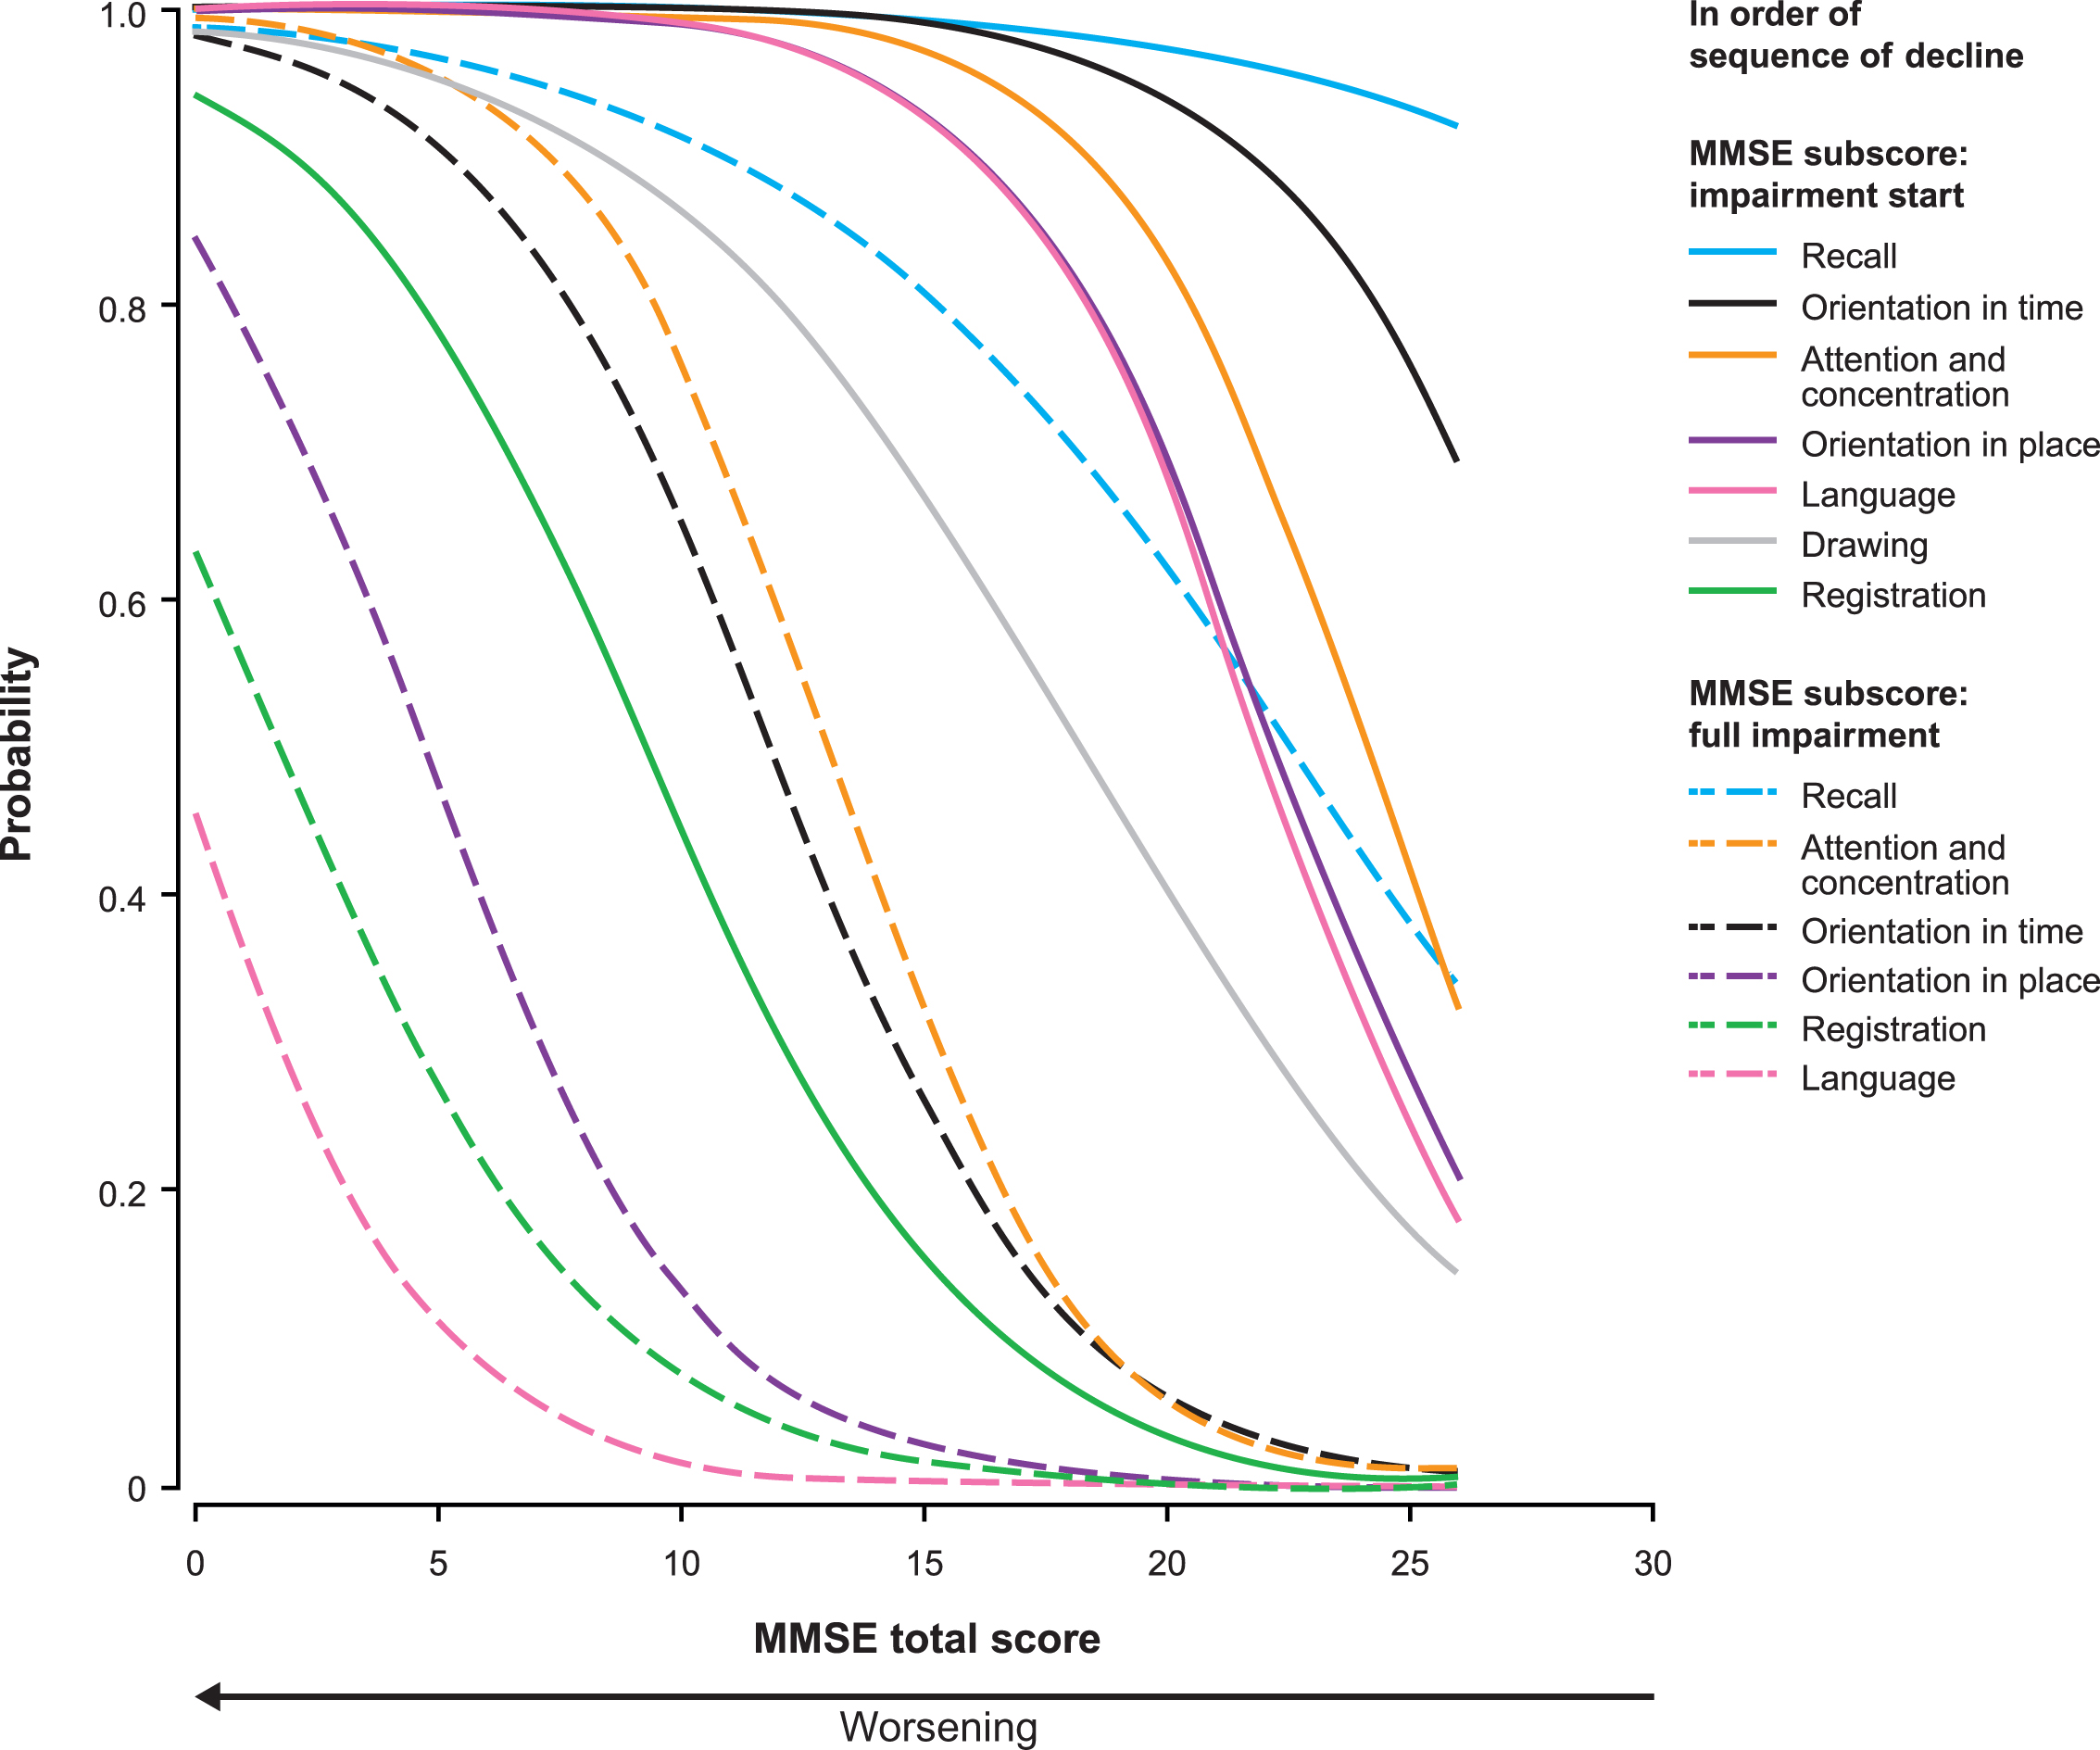
Fig.4
Probability of impairment start and full impairment for the ADAS-cog subscores as estimated by the proportional odds model with MMSE total score as the dependent variable. ADAS-cog scores were available for 1,026 patients with mild or moderate AD (MMSE score ≥ 14); data missing for 12 patients.
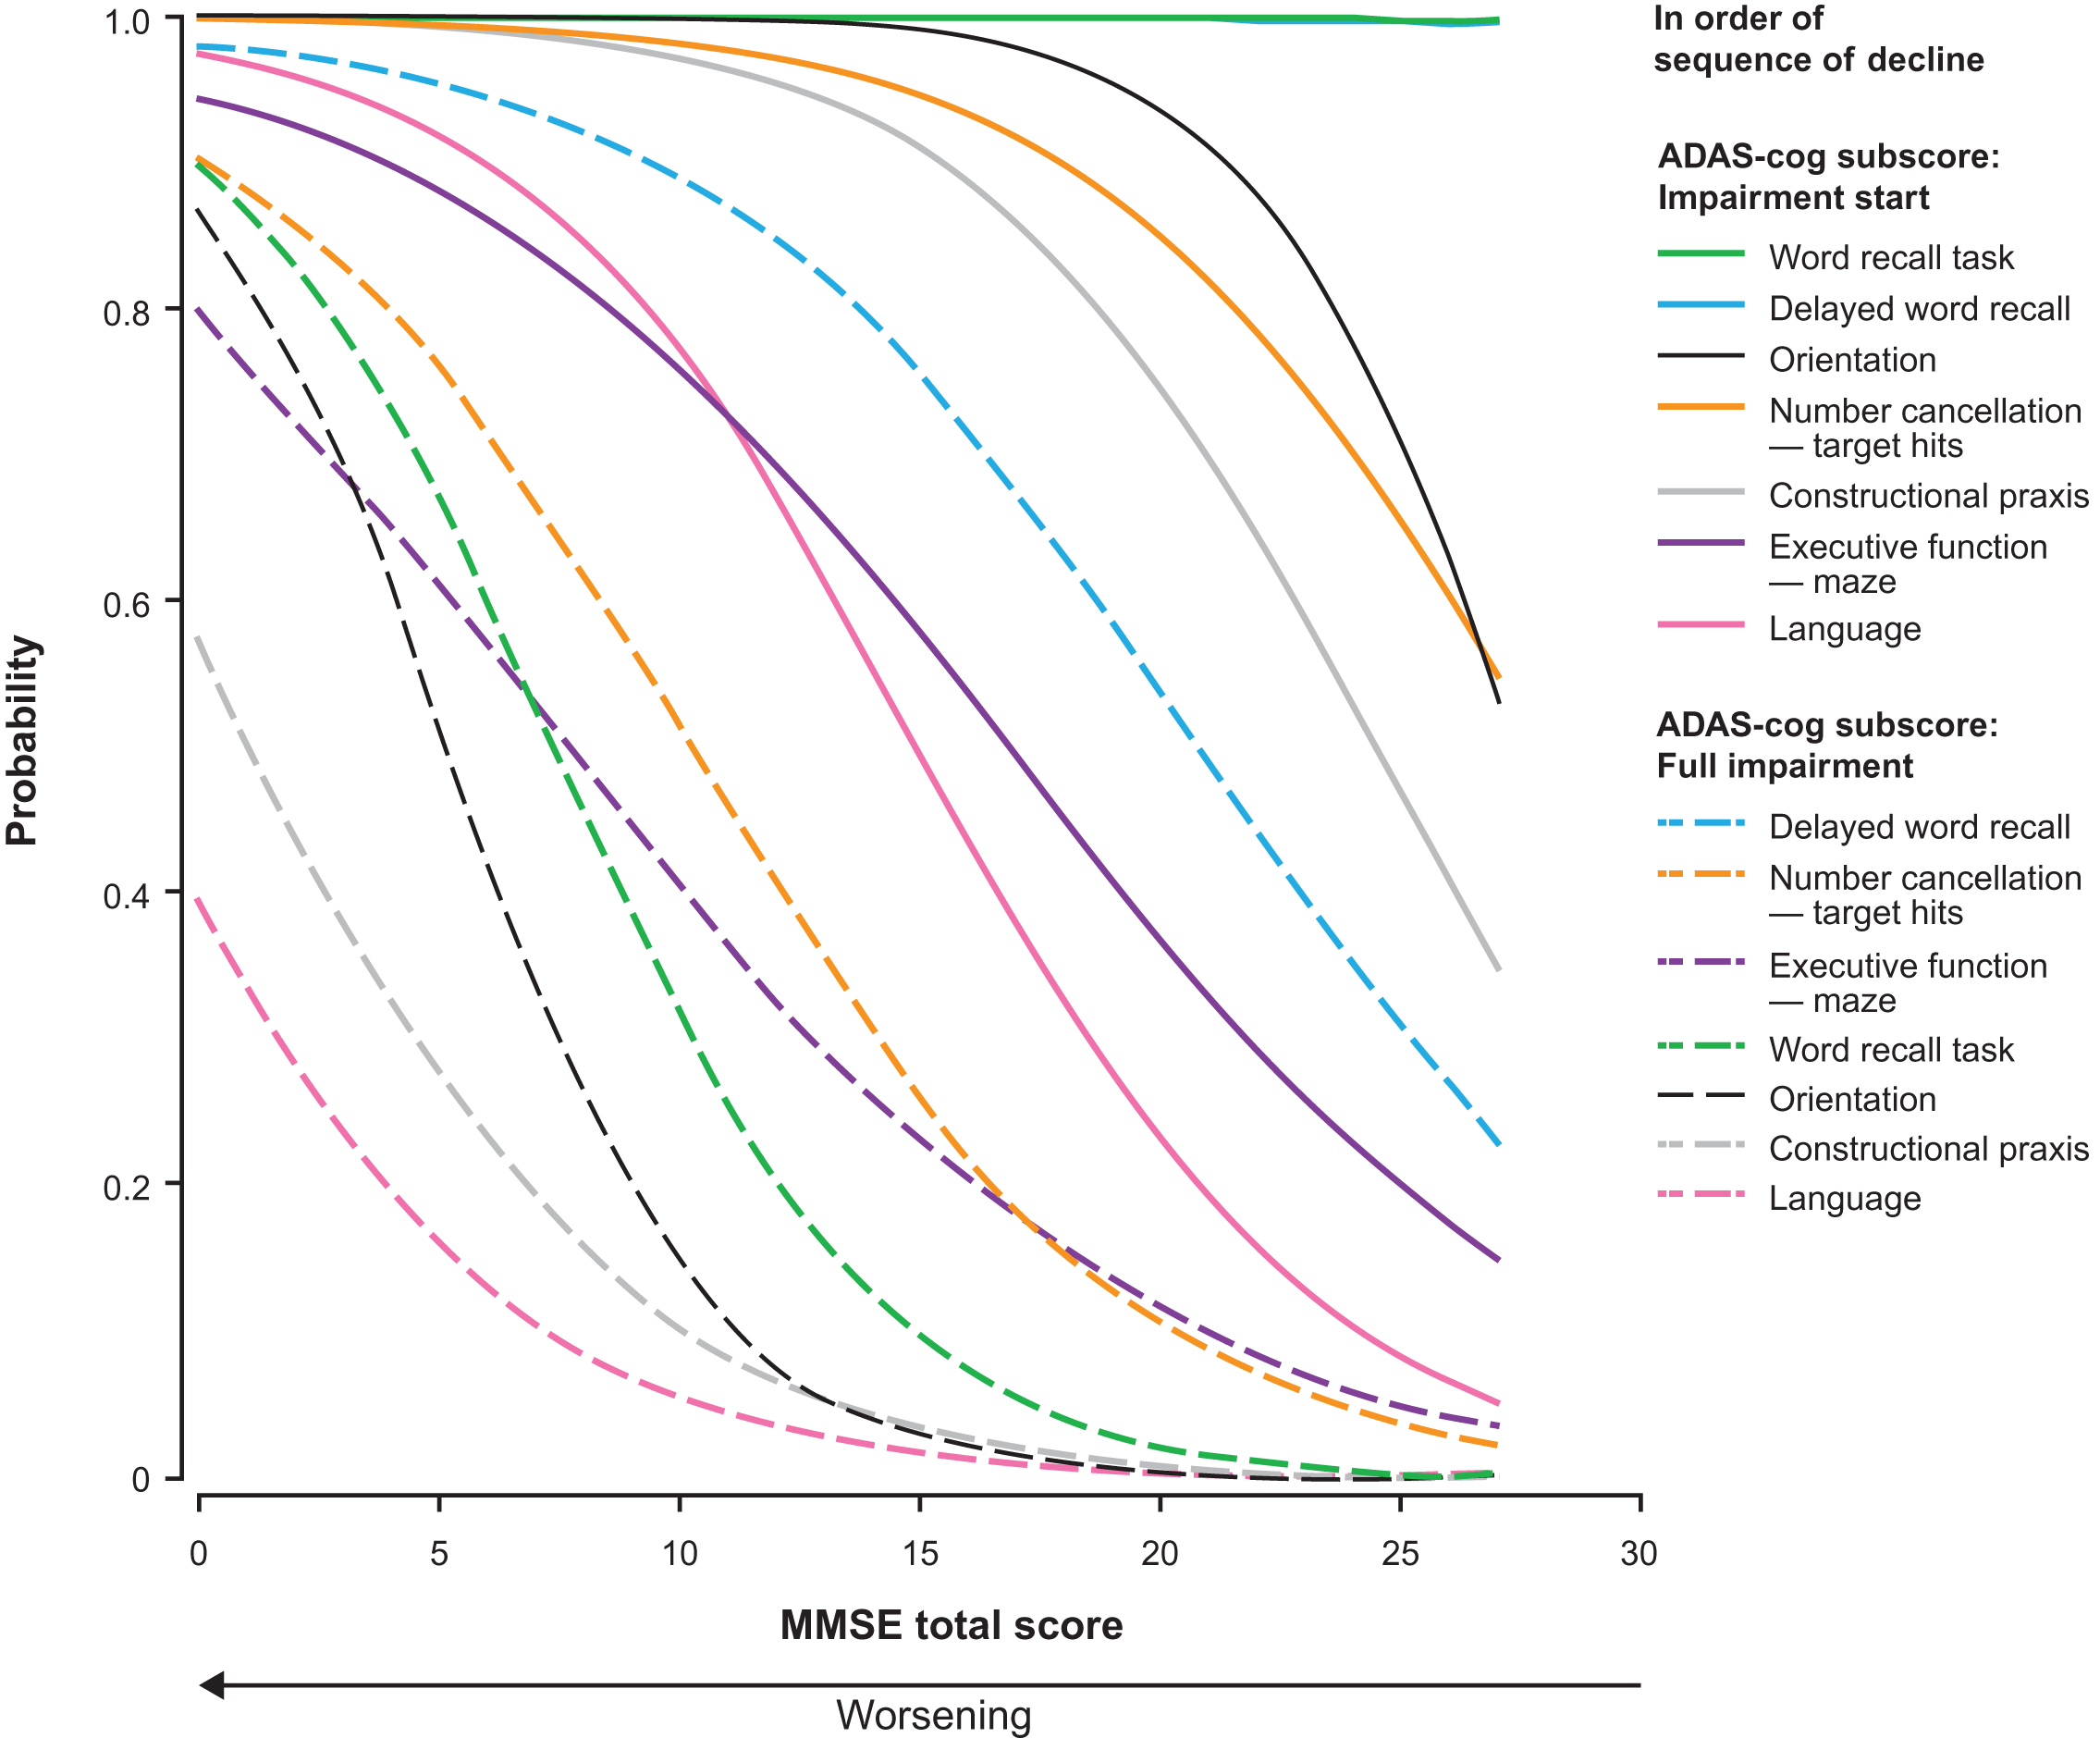
Fig.5
Sample stills from the animation developed from the bar chart visualization of the sequence of cognitive decline showing the probability of impairment at MMSE total scores of 26, 20, and 5. The symptom icons are seen to drop down from top to bottom asthe disease progresses. They are placed in the middle of the yellow bar, where they represent the likelihood of having some impairment. The full animation counts down each level of MMSE total score from 26 to 0, as shown in the Supplementary Video.
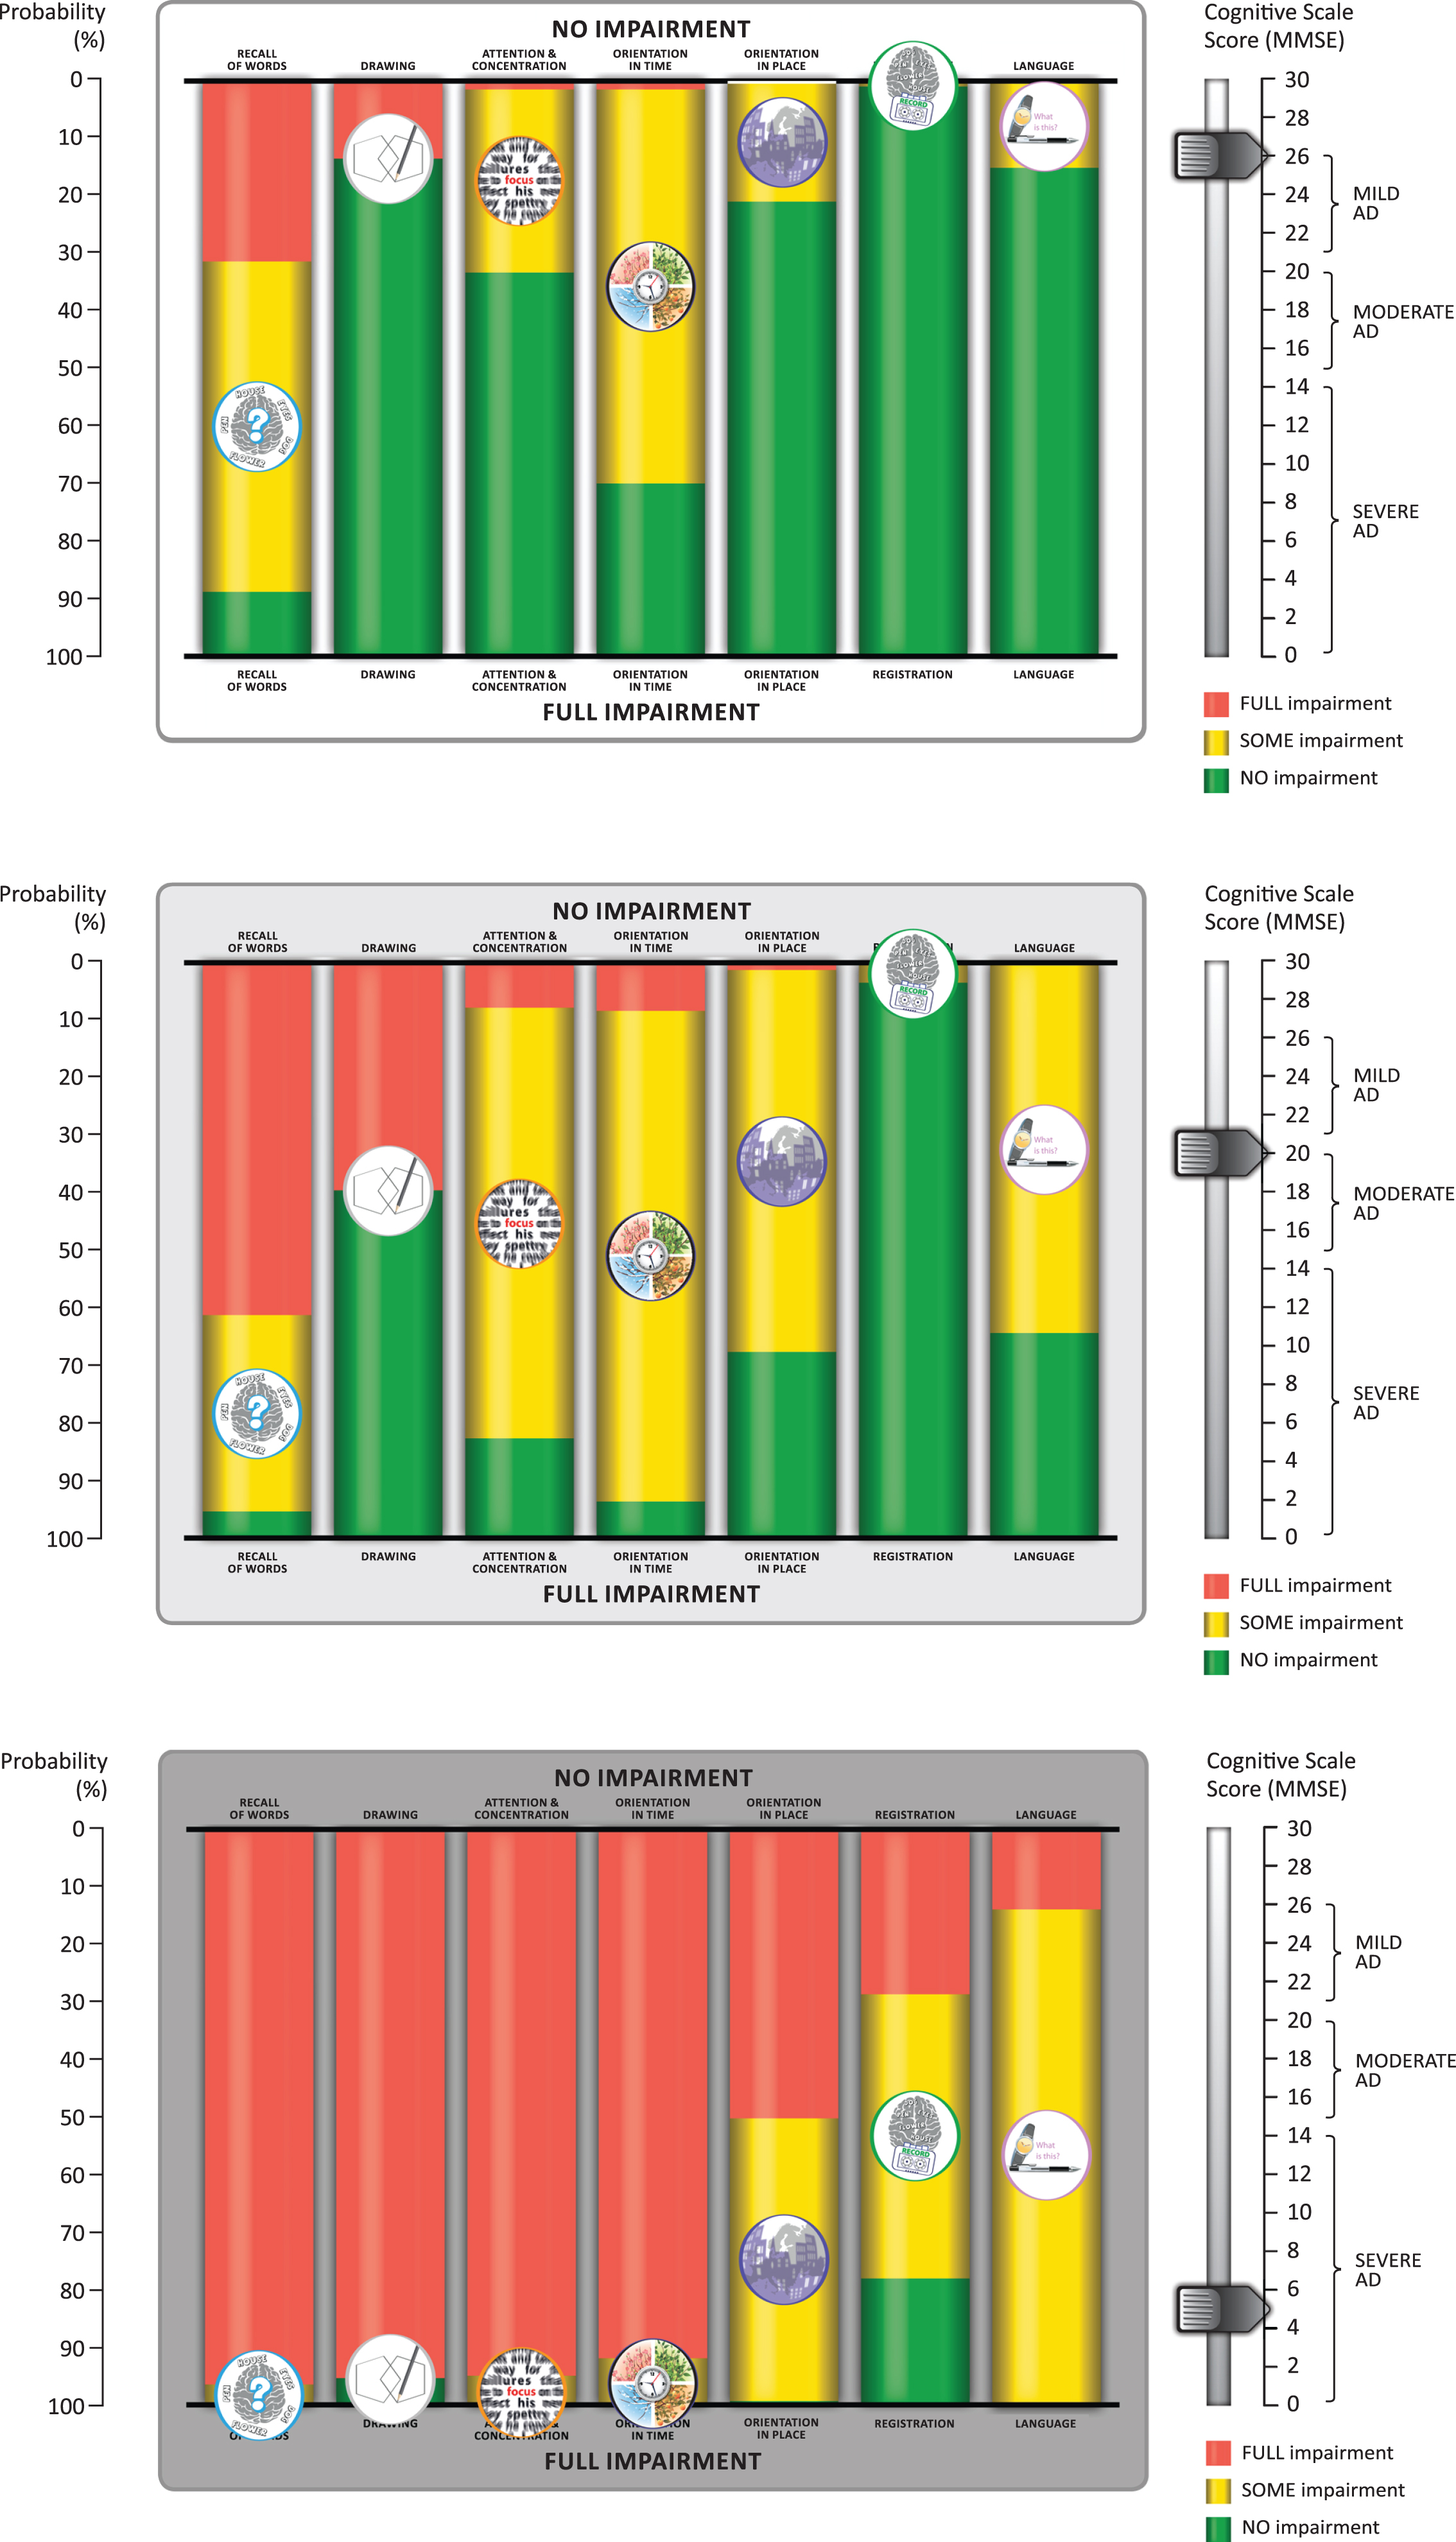
Table 1
Correspondence of MMSE and ADAS-cog subscores
| MMSE subscore (line color in POM curves) | Layman’s term for MMSE subscore | ADAS-cog 14 subscore (line color in POM curves) |
| Registrationa (green) | Forget things which have just been said | Word recall task (green) |
| Recall (cyan) | Difficulty acquiring new information | Delayed word recall (cyan) |
| Attention and concentration (orange) | Trouble maintaining attention and concentration | Number cancellation – target hits (orange) |
| Executive function – Maze test (gold) | ||
| Orientation in time (black) | Gets confused about the day of the week | Orientation (black) |
| Orientation in place (purple) | Forget where you are and how you got there | |
| Language (pink) | Trouble finding the right words | Languageb (pink) |
| Drawingc (gray) | Problems assembling objects together, completing a jigsaw | Constructional praxis (gray) |
aTests immediate memory; bSpoken language ability; cTests constructional praxis. MMSE, Mini-Mental State Examination; POM, Proportional Odds Model; ADAS-cog, cognitive subscale of the Alzheimer’s Disease Assessment Scale.
Table 2
Patient demographic and clinical characteristics at baseline for total cohort and by disease severity
| Characteristica | Mild ADb | Moderate ADc | MS/S ADd | p-valuee | Total cohort | |
| N = 566 | N = 472 | N = 457 | N = 1,495 | |||
| Sex, n (%) female | 271 (47.9) | 269 (57.0) | 279 (61.1) | <0.001 | 819 (54.8) | |
| Age, years | 77.3 (6.94) | 77.8 (7.99) | 77.6 (8.12) | ns | 77.6 (7.65) | |
| Marital status, n (%) | ns | |||||
| Married/cohabiting | 423 (74.7) | 321 (68.2) | 332 (72.6) | 1076 (72.0) | ||
| Widowed | 121 (21.4) | 132 (28.0) | 108 (23.6) | 361 (24.2) | ||
| Divorced/separated | 14 (2.5) | 11 (2.3) | 11 (2.4) | 36 (2.4) | ||
| Never married | 8 (1.4) | 7 (1.5) | 6 (1.3) | 21 (1.4) | ||
| Living location, n (%) | ns | |||||
| Urban | 437 (77.2) | 362 (76.9) | 332 (72.6) | 1131 (75.7) | ||
| Rural | 129 (22.8) | 109 (23.1) | 125 (27.4) | 363 (24.3) | ||
| Living in own home, n (%) | 553 (97.9) | 448 (94.9) | 427 (93.8) | 0.015 | 1428 (95.7) | |
| Living alone in own home, n (%) | 103 (18.6) | 102 (22.8) | 48 (11.2) | <0.001 | 253 (17.7) | |
| Years of education | 11.1 (3.32) | 10.1 (2.94) | 10.0 (3.02) | <0.001 | 10.4 (3.15) | |
| Time since AD diagnosis, years | 1.7 (2.00) | 2.1 (2.04) | 3.1 (2.40) | <0.001 | 2.2 (2.23) | |
| Patients with comorbiditiesf, n (%) | 426 (75.3) | 345 (73.1) | 330 (72.2) | ns | 1101 (73.6) | |
| Number of comorbidities | 1.5 (1.20) | 1.4 (1.22) | 1.4 (1.26) | ns | 1.4 (1.22) | |
| Experienced a fall in last 3 months, n (%) | 60 (10.6) | 60 (12.7) | 76 (16.7) | 0.009 | 196 (13.1) | |
| AD medication use, n (%) | <0.001 | |||||
| No AD medication | 87 (15.4) | 65 (13.8) | 60 (13.2) | 212 (14.2) | ||
| AChEI only | 413 (73.0) | 322 (68.2) | 242 (53.1) | 977 (65.4) | ||
| Mementine only | 40 (7.1) | 43 (9.1) | 69 (15.1) | 152 (10.2) | ||
| AChEI+Memantine | 26 (4.6) | 42 (8.9) | 85 (18.6) | 153 (10.2) | ||
| MMSE total score (range 0–30) | 23.3 (1.62) | 17.9 (1.67) | 9.5 (4.28) | <0.001 | 17.4 (6.34) | |
| ADAS-cog 14 total score (range 0–90)g | 30.4 (7.84) | 40.7 (9.25) | NA | <0.001 | 35.1 (9.95) | |
| ADCS-ADL score (range 0–78) | 58.4 (14.15) | 48.3 (15.35) | 29.9 (17.23) | <0.001 | 46.5 (19.47) | |
| NPI 12 scoreh | 10.2 (10.74) | 14.3 (12.62) | 22.0 (19.44) | <0.001 | 15.1 (15.27) | |
| EQ-5D health index score (proxyh)i | 0.71 (0.24) | 0.64 (0.27) | 0.51 (0.34) | <0.001 | 0.63 (0.30) | |
| EQ-5D VAS (proxyh) | 66.0 (18.46) | 64.4 (19.40) | 58.7 (22.85) | <0.001 | 63.3 (20.41) |
aData presented as mean (SD) unless indicated otherwise. Percentages reported are for patients with data available for each specific variable. Amounts of missing data were: Marital status (n = 1), living location (n = 1), living accommodation (n = 3), living alone in own home (n = 67), experienced a fall (n = 2), ADAS-cog 14 (n = 12), ADCS-ADL (n = 8), NPI-12 (n = 5), EQ-5D (n = 15). bMild Alzheimer’s disease (AD) = Mini-Mental State Examination (MMSE) 21–26 points. cModerate AD = MMSE 15–20 points. dModerately severe/severe (MS/S) AD = MMSE<15 points. ep-values are for the comparison between AD severity groups with adjustments for country effects (ANOVA for continuous variables and Cochran-Mantel-Haenszel test for categorical variables). fComorbidities considered were depression, epilepsy, stroke, ischemic cardiac disease, hypertension, diabetes mellitus, hypercholesterolemia, cancer, urinary tract disorder and obstructive pulmonary disease; recorded as yes/no. gADAS-cog (Alzheimer’s Disease Assessment Scale) was not measured in patients with MS/S AD (MMSE <15 points). ADAS-cog 14 total score was available for 1,026 patients. hAssessed by caregivers. iUK population based. AChEI, acetylcholinesterase inhibitor; ADCS-ADL, Alzheimer’s Disease Co-operative Study Activities of Daily Living Inventory; EQ-5D, EuroQol-5 Dimensions; NA, not assessed; NPI, Neuropsychiatric Inventory; ns, not significant (p < 0.05); VAS, visual analog scale.
Table 3
Sequence of cognitive decline for MMSE and ADAS-cog subscores by range of MMSE total score
| AD Severity | Range of MMSE | MMSE subscore | ADAS-cog subscorea | ||
| total score | Impairment start | Full impairment | Impairment start | Full impairment | |
| Normal or very | 30–27b | Recall; | Word recall task; | ||
| mild cognitive decline | Orientation in time | Delayed word recall; | |||
| Orientation; | |||||
| Number cancellation (target hits) | |||||
| Mild AD | 26–21 | Attention &Concentration (24); | Recall (22) | Constructional praxis (25) | Delayed word recall (21) |
| Orientation in place (22); | |||||
| Language (22) | |||||
| Moderate AD | 20–15 | Drawing (18)c | Drawing (18)c | Executive function (maze) (17); | |
| Language (15) | |||||
| MS/S AD | 14–11 | Attention &Concentration (13); | Number cancellation (target hits) (11) | ||
| Orientation in time (11) | |||||
| 10–6 | Registration (9) | Executive function (maze) (8); | |||
| Word recall task (8); Orientation (6) | |||||
| 5–0 | Orientation in place (4); | Constructional praxis (2) | |||
| Registration (1); | [Language]d | ||||
| [Language]d | |||||
Subscores are displayed in the AD severity group where the estimated probability of start/full impairment reaches 50%. For each subscore, the number in brackets is the MMSE total score when the subscore ≥ 50%. MMSE scores were available for 1,495 patients and ADAS-cog scores for 1,026 patients. aResults presented only for ADAS-cog subscores that correspond to the MMSE subscores. bPatients with MMSE >26 were not included in the study. The subscores listed in the shaded area have impairment start outside the observed data range but, based on the model data, impairment start will be at an MMSE total score >26. cDrawing subscore has a score range 0–1 (i.e., either no impairment or full impairment). dThe Language subscores given in square brackets did not cross 50% probability. AD, Alzheimer’s disease; MMSE, Mini-Mental State Examination; ADAS-cog, cognitive subscale of the Alzheimer’s Disease Assessment Scale; MS/S, moderately severe/severe.

