Apolipoprotein E4 Elicits Lysosomal Cathepsin D Release, Decreased Thioredoxin-1 Levels, and Apoptosis
Abstract
The major genetic risk factor for Alzheimer’s disease (AD), apolipoprotein E4 (ApoE4), has been suggested to have detrimental effects on neurons, including direct toxicity via apoptosis. Thioredoxin-1 (Trx1) is an endogenous antioxidant protein important for redox regulation and participates in the regulation of apoptosis through the inhibition of apoptosis signal-regulating kinase-1 (Ask-1). In this study, we have investigated the effects of ApoE on Trx1 in the brain. Our results showed that the protein levels of Trx1 were reduced in the hippocampus of ApoE4 targeted replacement (TR) mice compared to ApoE3 TR mice. The reduction was also seen in vitro after treatment of both human primary cortical neurons and neuroblastoma cells with human recombinant ApoE4 (rApoE4). Furthermore, ApoE4 caused a disruption of lysosomal integrity and a shift in the localization of Cathepsin D, an enzyme known to degrade Trx1. ApoE4 treatment induced in addition apoptosis through translocation of Death-domain associated protein-6 (Daxx) from the nucleus to the cytosol, suggesting an activation of the Ask-1 pathway. This toxicity was prevented by overexpression of Trx1 and other endogenous Ask-1 inhibitors. Our data suggests that down-regulation of Trx1 is involved in the toxicity caused by ApoE4. An activated ASK-1 pathway might indeed make cells more vulnerable to other insults such as amyloid-β, which could partially explain the mechanism behind the strongest genetic risk factor for AD.
INTRODUCTION
Apolipoprotein E (ApoE) is a protein involved in the transport and homeostasis of cholesterol and other lipids, and is mainly expressed in the liver and the central nervous system (CNS). The human ApoE gene has three major allelic variants: ɛ2, ɛ3, and ɛ4 [1]. The ɛ4 allele (ApoE4) is the strongest genetic risk factor for Alzheimer’s disease (AD) and other neurodegenerative disorders, while the ɛ2 allele is considered to be protective. Individuals with one copy of the ɛ4 allele have approximately three times the risk of getting the disease, while homozygotes carry 12 times the risk [2]. ApoE4 also decreases the mean age of AD onset from 84 years of age in non-ɛ4 carriers to 68 years of age for ɛ4 homozygotes [3].
AD is the most common form of dementia and affects cognition, memory and behavior. However, the underlying pathogenic mechanisms— including how ApoE4 contributes to a greater risk of developing AD— have not been fully elucidated. Some evidence suggests that ApoE is involved in the aggregation or clearance of the amyloid-β peptide (Aβ) [4, 5], a molecule strongly related to AD pathology [6], whereas others have shown a negative effect of ApoE4 on lipid metabolism and synaptic plasticity [7, 8]. In addition, several studies suggest that ApoE4 has direct detrimental effects, either by inducing apoptosis or by mediating the toxic effects of Aβ [9, 10].
Increased oxidative stress in the brain is an important feature of AD and is one of the earliest events in the pathology [11]. ApoE4 has been associated with oxidative stress, and patients with AD who are ApoE4 carriers have increased oxidative stress and reduced antioxidant activity in the hippocampus compared to non-ApoE4 carriers [12]. Studies by us and others have previously shown that the level of the antioxidant enzyme Thioredoxin-1 (Trx1) is reduced in AD brains [13, 14]. Trx1 is a redox sensitive antioxidant protein that has an anti-apoptotic function by inhibition of apoptosis signal-regulating kinase-1 (Ask-1) [15]. We also demonstrated that Aβ causes oxidation of Trx1 and nuclear export of Death-domain associated protein-6 (Daxx), an event occurring downstream of Ask-1 activation. Here, we investigated the effects of human ApoE isoforms on Trx1 using human ApoE targeted replacement (ApoE TR) mice and in vitro models. We used a human neuroblastoma cell line (SH-SY5Y), and our key-findings were confirmed in human primary cortical neurons. We report that the presence of ApoE4 results in reduced Trx1 levels in neurons by a mechanism including alteration of lysosomal integrity and leakage of the lysosomal protease Cathepsin D. The implications of these findings for the roles of ApoE4 and Trx1 in AD are discussed.
MATERIALS AND METHODS
Mice brain tissue
Brain tissue material was obtained from female ApoE TR mice, as previously described [16]. The mice purchased from Taconic Farms (USA) were on a C57BL/6J background and expressed human ApoE3 or ApoE4 under the control of the endogenous murine ApoE regulatory sequences. Mice were housed in groups of 6 under controlled conditions (12 h light and dark lighting cycles, 65% humidity and a temperature of 22±2°C) and fed a standard diet. The animals had free access to food and water. All animal work was performed at the Department of Pharmacy and Biotechnologies, University of Bologna, Italy. All procedures were approved by the local ethical committee (Veterinary Service of the University of Bologna) and in accordance with the European Community Council Directive of November 24, 1986 (86/609/EEC). Mice were sacrificed by cervical dislocation and brains were dissected. The hippocampi were removed, snap-frozen in liquid nitrogen and stored at –80°C before further analysis. For protein analysis, the tissue was homogenized in ice-cold lysis buffer containing: 50 mM Tris-HCl pH 7.5/150 mM NaCl/1% Triton X-100/2 mM EDTA/2 mM EGTA/protease inhibitor cocktail (1:100) and phosphatase inhibitor cocktail (1:100) (Sigma-Aldrich, Saint Louis, MO, USA). Homogenates were kept on ice for 30–60 min followed by centrifugation, 13,600×g for 10 min at 4°C. Protein concentration was determined using BCA protein assay kit (Thermo Scientific, Rockford, IL, USA).
Human primary cultures
Embryonic human cortical tissue (6–11 weeks post-conception) was dissected after elective routine first trimester abortions from healthy pregnant women without any known AD pathology. Written informed consent was obtained from each pregnant woman. The collection was approved by the Regional Ethical Review Board (Stockholm), in compliance with Swedish law. Neuronal cultures were grown in Neurobasal medium with supplement of L-glutamine (0.5 mM) and B27 (2%). For ICC analysis, cells were seeded separately on cover slips (20,000 cells/cm2), pre-coated with poly-D-lysine (Sigma-Aldrich) in phosphate buffered saline (PBS). For western blot analysis, approximately 100,000 cells were seeded in 6-well plates. Cells were cultured for 10 days before treatment.
Cell line culture, treatment, and lysis
Neuroblastoma cells (SH-SY5Y) were purchased from the American Type Culture Collection (ATCC) (Borås, Sweden) and cultured in MEM supplemented with Glutamax and 10% fetal bovine serum (Life Technologies, Paisley, UK). Cells were incubated at 37°C in the presence of 5% CO2. When treated, the cells (SH-SY5Y or primary neurons) were washed once in PBS (Life Technologies, Paisley, UK) buffer before addition of 100 nM rApoE (ReliaTech, Wolfenbüttel, Germany) diluted in medium (MEM or Neurobasal) without serum. When using Pepstatin A (Sigma-Aldrich), the final concentration was 10 μg/ml and was added to the cells together with rApoE. Untreated cells were used as control. For collection, the cells were first washed in cold PBS, scraped down with a cell scraper, and centrifuged for 5 min at 5000×g. The pellet was then lysed in homogenization buffer (see above). Lysate was kept on ice for 20 min before centrifugation, 14,000×g for 15 min at 4°C, and the supernatants were stored for further analysis. Protein concentration was determined using BCA protein assay kit.
Preparation of cell media for immunoblotting
SH-SY5Y cells were grown in 6-well plates and treated with rApoE as described above. The medium was collected and centrifuged at 5000×g for 5 min to pellet floating cells and debris. Next, 300 μl of the cell medium were concentrated in a speed-vac centrifuge down to a volume of approximately 35 μl. The samples were then mixed with loading buffer and analyzed with immunoblotting as described below. Due to the low levels of Trx1 in the cell medium, the sensitivity of the CCD camera was increased to detect signal.
Immunoblotting
For mouse brain homogenates and cell lysates, equal protein amount for each sample (30 μg) was mixed with loading buffer containing: 250 mM Tris-HCl pH 6.8/10 % SDS/25 % glycerol/0.04% bromophenol blue (Sigma-Aldrich). Samples were then separated with SDS-PAGE and transferred to a polyvinylidene fluoride (PVDF) membrane (Millipore, Billerica, MA, USA). Next, the membrane was blocked in 5% skim milk in TBS-Tween (TBS-T) (1 h) before incubation with primary antibody at 4°C overnight. The antibodies used were: Trx1-06 (1:1000, IMCO, Solna Sweden), Trx1-03 (1:1000, IMCO), Actin (1:1000, Sigma-Aldrich), GAPDH (1D4) (1:1000, Enzo Life Sciences, Farmingdale, NY, USA), Daxx (1:1000, MBL Int Corp, Woburn, MA, USA), Cathepsin D (1:1000, Millipore, Temecula, CA, USA), Lamin A (1:1000, Cell Signaling, Danvers, MA, USA), and Caspase 3 (1:1000, Cell Signaling, Danvers, MA, USA). The day after, membranes were washed 3×10 min in TBS-T followed by 1-h incubation with horseradish peroxidase conjugated secondary antibodies (GE Healthcare, Little Chalfont, UK) diluted 1:1000 in TBS-T. Next, membranes were washed 3×10 min in TBS-T and incubated for 3 min with ECL western blotting substrate (Thermo Scientific). The chemiluminescence signal was detected and quantified using a CCD camera (LAS-3000, Fujifilm).
Real-time PCR (rtPCR)
To extract mRNA, cells were collected using a cell scraper and centrifuged at 5,000×g for 5 min. The pellet was then lysed and RNA extracted using RNeasy mini kit (QIAGEN, Hilden, Germany). For tissue, the mRNA was extracted using RNeasy Lipid Tissue Mini Kit (QIAGEN). Both extractions were performed according to the manufacturer’s protocol. Approximately 20 mg of each sample were used. To obtain the cDNA, High Capacity cDNA Reverse Transcription kit (Life Technologies, Foster City, CA, USA) was used. Real-time PCR analysis of target genes was performed as previously described [17] using TaqMan® Gene Expression Assays (Life Technologies, Warrington, UK). The assays for analyzing Trx1 were: Hs01555212_g1 (Trx1 human) and Mm00726847_s1 (Trx1 Mouse). GAPDH was used as the endogenous control for mice samples and RPLP0 was used as control for cell samples. The results were analyzed using the comparative 2–ΔΔC method [18].
Immunocytochemistry (ICC)
Cells were cultured and treated in 24-well plates on glass coverslips. For subcellular localization of Daxx, cells were washed in cold PBS and then fixed in ice cold methanol (Sigma-Aldrich) for 15 min. Blocking was done in 10% BSA in TBS-Tween (TBS-T) for 30 min before incubation with primary antibody (Daxx, MBL Int Corp, 1:100, 3% BSA in TBS-T) for 1 h at room temperature. For analysis of Lamp-2 and Cathepsin D, cells were washed in cold PBS before fixation and permeabilization in ice cold methanol for 5 min. Cells were then blocked in 1% BSA in TBS-T for 30 min and incubated overnight with primary antibody (Lamp-2, 1:100 Southern Biotech, Birmingham, AL USA; Cathepsin D, 1:200, Millipore, Temecula, CA, USA) in blocking buffer. As a negative control, the primary antibody was omitted. After primary antibody incubation, all staining procedures followed the same protocol. Cells were washed three times for 10 min in PBS and incubated with secondary antibodies (Alexa Fluor (488 and/or 546) IgG 1:1000, Life Technologies, Eugene, OR, USA) and DAPI (1:1000, Sigma-Aldrich) for 30 min at room temperature. After secondary antibody application, cells were washed again 3 times in PBS before the mounting medium application (ProLong Gold Antifade Reagent, Eugene, OR, USA). Imaging was performed with confocal microscopy using Zeiss (LSM 510 META) confocal laser scanning system.
Nuclear fractionation
The nuclear and cytoplasmic extraction reagents kit NE-PER (Pierce, Rockford, IL, USA) was used to isolate the nuclear and cytosolic fractions of cells. The procedure was performed according to the manufacturer’s protocol. Protease inhibitor cocktail (Sigma-Aldrich) was added freshly at a dilution of 1:500 to all samples. To check the purity of the fractions, immunoblotting with antibody against the nuclear marker Lamin-A was performed.
Cell viability and apoptosis measurements
To analyze the level of apoptosis we measured mono- and oligonucleosomes using an ELISAPLUS kit (Roche Diagnostics Scandinavia AB, Bromma, Sweden) according to manufacturer’s protocol. To determine cell viability, we performed an MTT assay by measuring the formation of formazan from added tetrazolium salt. Cells were cultured in 24-well plates and treated with 100 nM rApoE peptide at the indicated time points. Cells were then washed once in PBS before phenol-red free medium containing 0.3 mg/ml 3-(4,5-Dimethylthiazol-2-yl)-2,5-diphenyltetrazolium bromide (MTT) (Sigma-Aldrich) and 1% Glutamax (Life Technologies) were added. After incubation at 37°C for 1.5 h, the MTT solution was removed and 400 μl DMSO (Sigma-Aldrich) added to dissolve the formazan crystals. After incubation with gentle shaking at room temperature, absorbance was measured in triplicate (100 μl each) in a 96 well plate at 540 nm using a plate reader spectrophotometer (TECAN Safire II). Results were expressed as the percentage of the values obtained for the corresponding untreated controls.
Redox state assessment
To study the redox state of Trx1, cells were treated with ApoE as mentioned above and analysed as previously described [13] using AMS gel shift assay. As a positive control, cells were treated with Aβ42 (10 μM) for 24 h.
Catalase activity analysis
First, cells were cultured in 6 cm2 polystyrene plates and treated with 100 nM ApoE peptide for the indicated time points. Next, cells were washed in ice-cold PBS and collected as described above. The supernatant was discarded and the pellets were re-suspended in 50 mM K3PO4 pH 7.0, 1 mM EDTA (Sigma-Aldrich) buffer followed by sonication. The cell lysates were then centrifuged at 14,000×g for 15 min at 4°C, and supernatants were used for analysis. The assay measures the conversion of methanol and hydrogen peroxide into formaldehyde in order to determine the activity of catalase. A chromagen (Purpald) (Sigma-Aldrich) that reacts with aldehydes was used to visualize the formation of formaldehyde. Absorbance was measured at 550 nm in a plate reader spectrophotometer (TECAN Safire II). Analysis was performed in 96-well plates using formaldehyde as standard (0–75 mM).
Determination of glutathione levels
To measure the levels of glutathione, a GSH/GSSG Radio Detection Assay kit (Abcam, Cambridge Science Park, UK) was used according to the manufacturer’s protocol. The kit uses a non-fluorescent dye that becomes strongly fluorescent when it binds to reduced glutathione (GSH). A GSSG probe was used in order to determine the GSSG levels. Fluorescence was measured in multi-well plate reader (TECAN Safire II) by exciting samples at 490 nm and detecting at an emission wavelength of 520 nm.
DNA constructs and transfections
SH-SY5Y were cultured in 24-well plates and transfected with plasmids expressing Trx1, Grx-1, or Parkin. DJ-1 overexpressing neuroblastoma cells (BE(2)-M17) were kindly provided by Dr. Cookson at the laboratory of Neurogenetics at the National Institute on Aging. Lipofectaminetrademark 2000 (Invitrogen, Carlsbad, CA, USA) was used for transfection according to manufacturer’s protocol (previously described [13, 19, 20]).
Acridin orange (AO) staining
Cells were cultured in a μ-Slide 8 well for live imaging (LRI) and treated with ApoE for 1 h. After 30 min of incubation with ApoE, AO Staining solution (P.A.R.I.S Anticorps, Compiègne, France) was added directly to the cells to a final concentration of 1:200. Imaging was performed on the live cells with red (640 nm) and green (525 nm) channels simultaneously, using a Zeiss (LSM 510 META) confocal laser scanning system.
Subcellular fractionation
Cells were cultured in 10 cm plates, washed and lysis buffer containing 250 mM sucrose/20 mM HEPES pH 7.4/10 mM KCl/1.5 mM MgCl2/1 mM EDTA/1 mM EGTA/1 mM DTT/Protease inhibitor cocktail 1:500 (Sigma-Aldrich) was added. Cells were collected using a cell scraper and then passed through a needle (27G) ten times. The lysates were then left on ice for 20 min and centrifuged at 600×g for 10 min at 4°C to remove nuclei and unbroken cells. The supernatant was then centrifuged again at 100,000×g for 3 h at 4°C. The pellet containing the microsomal fraction was solubilized in a denaturing buffer containing 50 mM Tris-HCl pH 8.3/5 mM EDTA/0.05 % SDS/6 M Urea and the supernatant was precipitated using trichloroacetic acid (TCA) (Sigma-Aldrich). TCA was added to a final concentration of 20 % and incubated on ice for 45 min. Next, the samples were centrifuged at 14,000 rpm for 5 min and washed in cold acetone. Centrifugation and washing was repeated once. Finally, the acetone was removed and the pellet was re-suspended in denaturing buffer.
Statistical analysis
Mann-Whitney U-test or one-way ANOVA followed by Fischer’s PLSD post hoc test were used for analysis of differences. A value of p < 0.05 was considered statistically significant.
RESULTS
ApoE4 compromises Trx1 levels both in vivo and in vitro
Western blot analysis of hippocampal tissue from ApoE TR mice revealed that Trx1 levels were reduced in ApoE4 mice compared to the ApoE3 group (Fig. 1A). Next we examined the effect of exogenous ApoE on Trx1 in vitro by treating neuroblastoma cells (SH-SY5Y) with a physiological concentration of human recombinant ApoE (rApoE) (100 nM). Our results show that, compared to rApoE3-treated and controls, rApoE4 caused a significant decrease of Trx1 levels after 5 h treatment in SH-SY5Y cells. However, after 1 h and 24 h treatment no significant differences were observed between groups (Supplementary Figure 1A, and 1B, respectively). The rApoE4-induced decrease of Trx1 was confirmed in 5 h treated human primary cortical neurons (Fig. 1C). In addition, the amount of Trx1 in the cell medium was decreased after 5 h treatment of SH-SY5Y cells with rApoE4, compared to control and rApoE3-treated cells (Fig. 1D).
Analysis using RT-PCR revealed a significant increase of the levels of Trx1 mRNA in the hippocampus of ApoE4 TR mice compared to the ApoE3 group (Fig. 1E). This was also observed in vitro after rApoE treatment in SH-SY5Y cells (100 nM; 24 h) (Fig. 1F)
ApoE4 treatment induces Daxx translocation and initiates apoptosis
Trx1 is involved in the regulation of apoptosis via direct inhibition of Ask-1 [15]. Activation of Ask-1 leads to translocation of the downstream protein Daxx from the nucleus to the cytoplasm via activation of c-Jun N-terminal kinase-1 (JNK-1) [21]. We previously showed that Aβ42 causes oxidation of Trx1 and subsequent translocation of Daxx [13, 22]. To investigate whether the ApoE4-induced down-regulation of Trx1 levels had a similar consequence, we analyzed the effects of ApoE isoform treatments (5 and 24 h) on the nuclear export of Daxx in SH-SY5Y cells by subcellular fractionation of cell lysates in cytosolic and nuclear fractions and by immunocytochemistry (ICC). After 5 h (Fig. 2A) the levels of Daxx were found to be decreased in the nuclear fraction of rApoE4 treated cells, suggesting nuclear export of the protein. Purity of the fractions was assessed by re-blotting with the nuclear specific protein Lamin A antibody. Increased levels of Daxx staining were evident in the cytosol after 24 h rApoE4 treatment using ICC analysis (Fig. 2B). In human primary cortical neurons, we could not detect stronger staining of the Daxx protein in the cytosol after rApoE4 treatment. However, we did observe a weaker staining of Daxx in the nucleus (Fig. 2C), which suggests a Daxx cytosolic translocation in agreement with the results seen using SH-SY5Y cells. Translocated Daxx is degraded by the proteasome [23]. Thus, the discrepancy between models could be due to differences in the rate of Daxx degradation after translocation to the cytosol. Cytoplasmic Daxx activates Ask-1 in a positive feedback loop to initiate apoptosis [24]. To test whether the observed translocation of Daxx in rApoE4 treated cells also leads to increased apoptosis, we measured the formation of apoptotic mono- and oligonucleosomes by ELISA in SH-SY5Y cells exposed to rApoE (100 nM) for 24 h. As seen in Fig. 2D, apoptotic markers were significantly increased in cells treated with rApoE4 compared to rApoE3, both after 5 and 24 h treatments. In addition, we analyzed the levels of cleaved Caspase 3 to further assess activation of apoptosis (Fig. 2E), and found a significant increase in cells treated for 24 h with 100 nM rApoE4.
Overexpression of Trx1, Grx1, and DJ-1 protects cells against ApoE4 toxicity
We also analyzed the effects of ApoE4 on cell viability using a 3-(4,5-dimethyl-2-thiazolyl)-2,5-diphenyl-2H-tetrazolium bromide (MTT) assay. As seen in Fig. 3, rApoE4 treatment decreased cell viability to approximately 60 % in SH-SY5Y cells (Fig. 3A) and to 77 % in BE(2)-M17 cells (Fig. 3B), compared to controls; rApoE3 treatment in contrast had no significant effect. The difference in MTT reduction between the rApoE3- and rApoE4-treated cells was statistically significant. rApoE4 effects on cell viability were counteracted by overexpressing Trx1, and unexpectedly, the treatment caused an increase in cell viability compared to non-treated cells. The overexpression of Grx1 or DJ-1, two other enzymes with redox function that can inhibit Ask-1 mediated apoptosis [25, 26], also protected against rApoE4 toxicity. Conversely, when treating cells that overexpress Parkin, a protein with no known inhibitory effect on Ask-1 activation, we did not observe any protection.
Minor effects on antioxidant systems by ApoE4 treatment
We previously reported that Aβ42 treatment of neuroblastoma cells leads to a fast and transient oxidation of Trx1 [13]. Since the presence of ApoE4 has been related to increased oxidative stress, we explored the effects of ApoE4 (100 nM) on Trx1 redox state using a 4-acetamido-40-maleimidyl-stilbene-2,20-disulfonate (AMS) shift assay as previously described [13]. As seen in Fig. 4A, 1 h and 5 h treatments with rApoE4 induced minor increases of the most oxidized Trx1 species compared to rApoE3 treated and untreated cells. In contrast, Aβ42 (10 μM) exposure resulted in a massive oxidation of Trx1, as previously reported. After 24 h treatment, no observable differences were detected. Next, we examined the effect of ApoE isoforms on two other antioxidant actors: catalase and glutathione. As seen in Fig. 4B, rApoE4 induced a small but not statistically significant decrease in the levels of reduced glutathione (GSH) after 24 h treatment. No change was observed in GSSG levels (Fig. 4C) or the GSH/GSSG ratio (Fig. 4D) at this time point. In addition, no changes in catalase activity were detected after exposure to rApoE isoforms (Fig. 4E).
ApoE4 causes lysosomal leakage and translocation of Cathepsin D
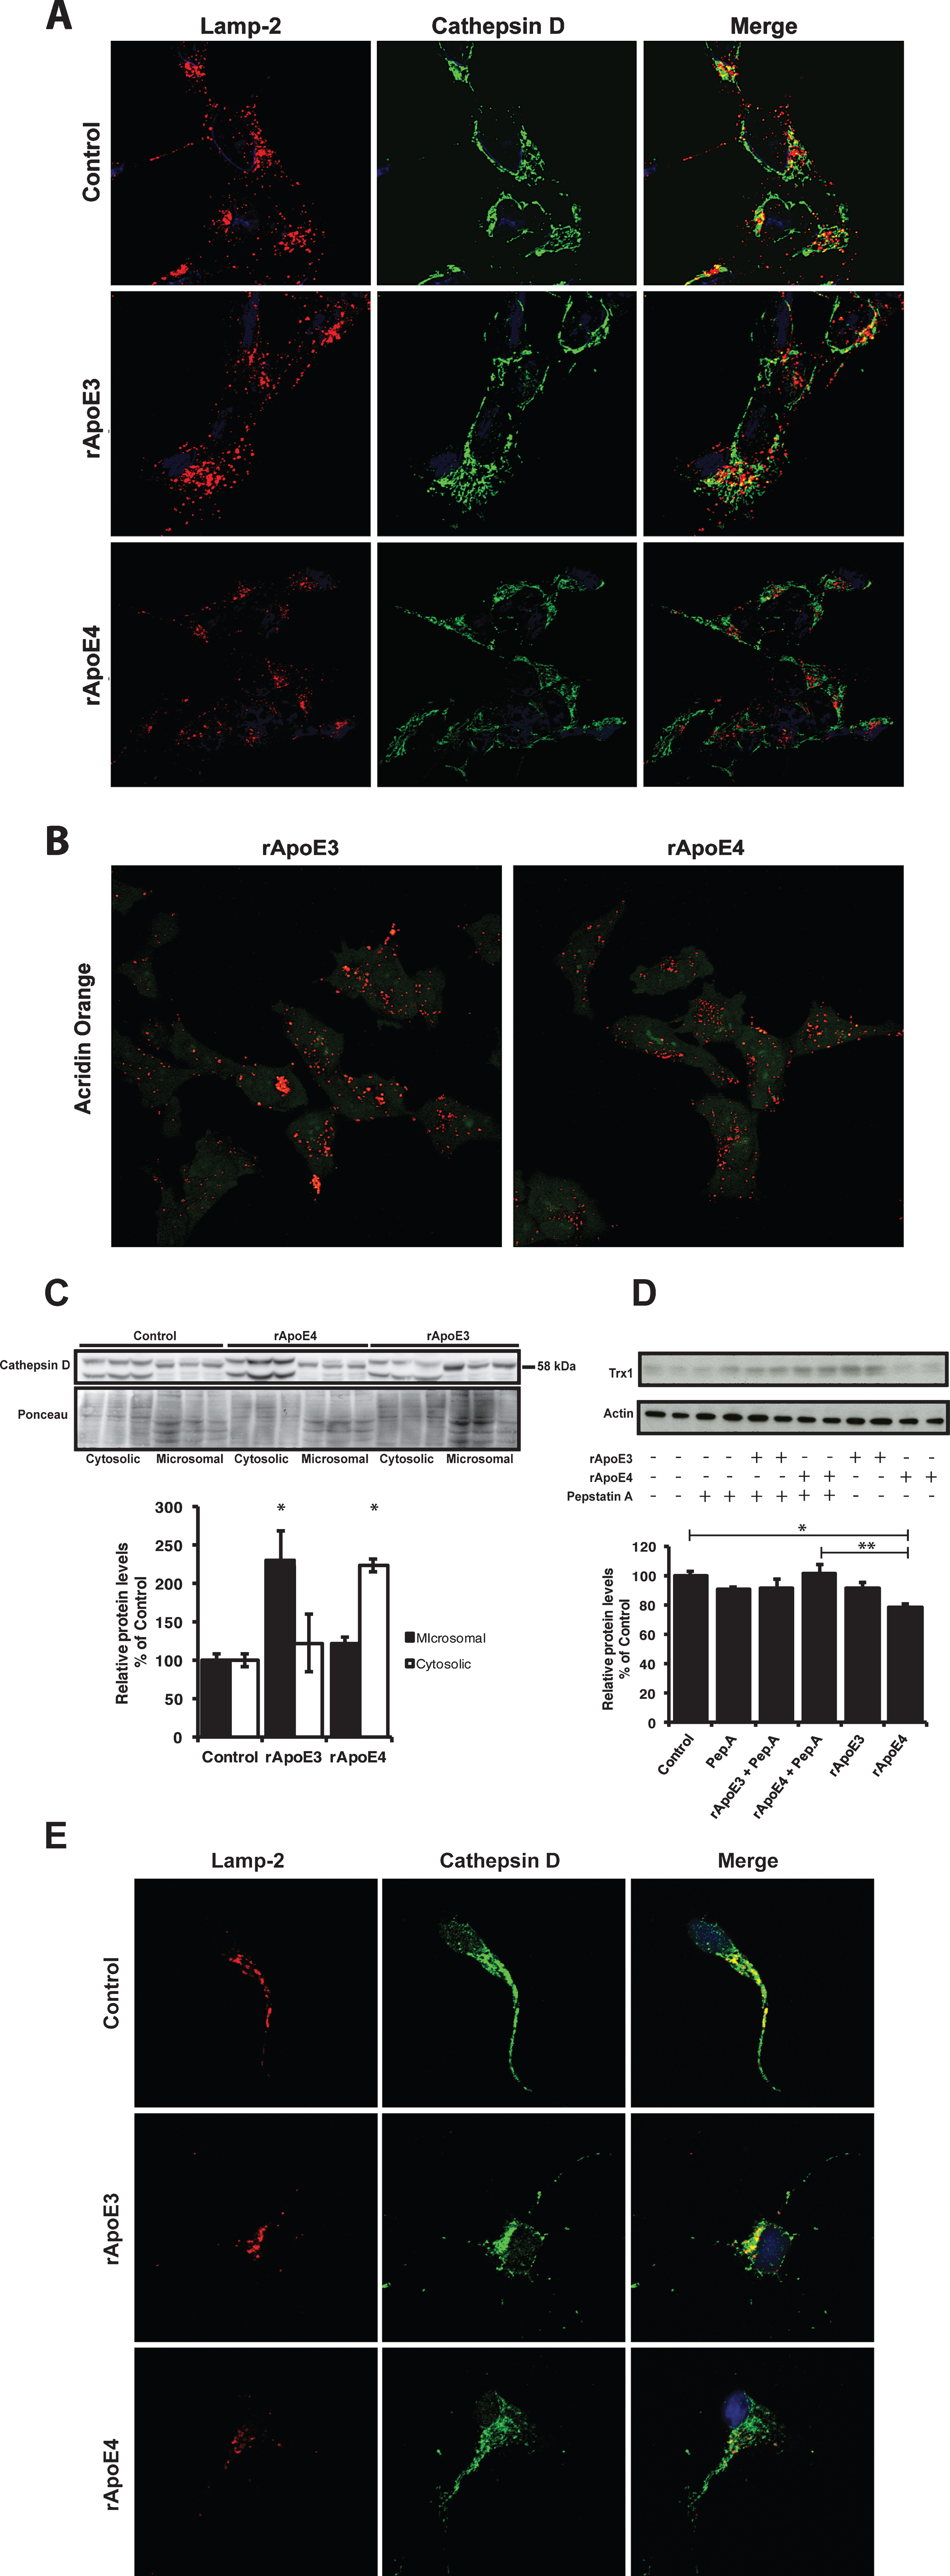
Thioredoxin-1 is known to be degraded by the aspartic protease Cathepsin D [27]. Cathepsin D normally resides within lysosomes and late endosomes but can translocate to the cytoplasm under stress conditions, where it initiates apoptosis [28]. On the other hand, ApoE can be endocytosed into neurons via a Rab5 mediated pathway and further trafficked to late endosomes and lysosomes [29]. Previous studies have shown that presence of ApoE4 increases lysosomal leakage and apoptosis induced by Aβ peptides [10]. With these facts in mind, we wished to test the effects of rApoE4 on lysosomal integrity. SH-SY5Y cells were treated with rApoE (100 nM) for 5 h and then analyzed with ICC using antibodies for Cathepsin D and the lysosome-associated membrane protein-2 (Lamp-2). As seen in Fig. 5A, Lamp-2 immunoreactivity showed a vesicular pattern in control (untreated) cells, consistent with lysosomal morphology and localization. The staining of Cathepsin D showed partial co-localization with Lamp-2. This pattern was not changed by treatment with rApoE3. However, treatment with rApoE4 resulted in decreased staining of both Lamp-2 and Cathepsin D with more diffuse patterns. In addition, rApoE4 exposure resulted in reduced co-localization between Cathepsin D and Lamp-2 compared to rApoE3-treated and control cells (Fig. 5A). We further tested if the integrity of lysosomes in these cells is affected by the rApoE isoforms by incubating cells with acridin orange (AO) solution for 30 min after rApoEs treatment (100 nM). AO added to cells can accumulate in the lysosomes— where it becomes protonated and emits red light after excitation with blue light. AO remaining outside of the lysosomes, on the other hand, emits green light instead and this difference can be used as an indicator of lysosomal integrity [30]. As seen in Fig. 5B, treatment with rApoE isoforms resulted in a changed pattern of red/green staining, showing less retention in lysosomal structures (red) and more binding to double-stranded DNA (green).
Analysis of microsomal and cytosolic fractions revealed that Cathepsin D levels were increased in the cytosolic fraction of rApoE4-treated cells compared to rApoE3- and non-treated cells (Fig. 5C). In rApoE3 treated cells, the levels of Cathepsin D were instead increased in the microsomal fraction compared to rApoE4 treated and control cells. Immunoblotting with an antibody against GAPDH was used as cytosolic marker to check the purity of the fractions (Supplementary Figure 1B). The appearance of bands migrating differently between the two fractions is likely due to altered glycosylation patterns, since the targeting of Cathepsin D to lysosomes is mediated by glycosylation at certain residues (reviewed in [31]).
To assess whether the rApoE4 induced translocation of Cathepsin D was linked to the decrease in Trx1 levels, we co-treated SH-SY5Y cells for 5 h with 100 nM rApoE and 10 μg/ml Pepstatin A, a specific inhibitor of Cathepsin D. Through this experiment, we found that Pepstatin A inhibited the reduction in Trx1 levels caused by rApoE4 alone (Fig. 5D). Figure 5E shows ICC analysis of human cortical primary neurons treated with rApoE for 1 h. Cells were stained with antibodies against Cathepsin D and Lamp-2. As seen in Fig. 5E, and in agreement with the results found with SH-SY5Y cells (Fig. 5A), rApoE4-treated neurons showed reduced co-localization between Lamp-2 and Cathepsin D suggesting lower levels of Capthesin D in the lysosomes.
DISCUSSION
Oxidative stress is a part of normal aging but is exacerbated in brains of AD patients. This feature is thought to be one of the earliest events in the progression of the disease [11], and it has been speculated that one difference between AD and normal aging could be a reduced ability to protect neurons against increased production of reactive oxygen species (ROS) [32]. Several reports have shown how the antioxidant defense in general or Trx1 specifically is affected in brains of AD patients and in patients with amnestic mild cognitive impairment (MCI)/prodromal AD [36]. The correlation between ApoE4 and increased risk for developing AD has been known for more than twenty years, but the mechanisms behind it are not fully understood. Numerous reports have shown that ApoE4 is associated with decreased antioxidant activity in AD [12, 37, 38]. We show that Trx1 levels are reduced in hippocampus of 6 months old ApoE4 TR mice compared to ApoE3 mice. Several studies report that young ApoE4 TR mice show impairments in spatial cognitive ability that can be aggravated in combination with other risk factors for AD [16, 39]. In contrast to the decreased Trx1 protein levels, ApoE4 TR mice showed an increased gene expression of Trx1 in the brain, which was also seen for rApoE4 treated cells. It is known that Trx1 expression is increased during oxidative stress conditions [40] via nuclear factor-like 2 (Nrf2) binding to the antioxidant response element (ARE) of the Trx1 promotor [41]. However, when analyzing GSH and GSSG levels, we found that treatment with ApoE4 (100 nM) in vitro only caused small but not statistically significant decrease in GSH levels after 24 h. However, this effect was not strong enough to affect the redox status of Trx1 or catalase activity. We suggest ApoE4 exposure leads to increased Trx1 mRNA expression as a compensatory mechanism to the decrease in Trx1 protein levels or as a response to a very mild increase of oxidative stress. In support of this idea, brains samples from ApoE4 carriers were previously shown to have decreased antioxidant enzyme activity and increased levels of oxidative stress markers [12].
Our in vivo results suggest the existence of fast turnover of Trx1 in brains carrying apoE4. We show that exposure to physiological concentrations of ApoE4 (100 nM) lead to a transient decrease in Trx1 protein levels in SH-SY5Y cells, without significant effects on Trx1 gene expression. A decrease in Trx1 levels after rApoE4 treatment was also observed in human primary cortical neurons. As Trx1 is also secreted extracellularly, we analyzed levels of Trx1 in the cell medium of treated SH-SY5Y cells. Levels in the medium were generally low compared to lysate but the result show that the Trx1 levels in the media were not increased after 5 h ApoE4 treatment but rather decreased compared to control and rApoE3 treated cells. This suggests that the reduction in intracellular Trx1 levels is due to degradation. Very little is known about how Trx1 is degraded. Haendeler et al. reported that Cathepsin D degrades Trx1, and this may contribute to Cathepsin D-mediated apoptosis [27]. Cathepsin D shows highest activity at the low pH present within lysosomes, but can also be active at a higher pH and in the cytosol [42, 43]. Lipid receptors on the cell surface are able to bind ApoE, and can internalize ligands that may be degraded in the lysosomes (reviewed in [44]). Secreted ApoE is taken up into cells through interaction with members of the low-density lipoprotein (LDL) receptor family [45, 46]. The lipidation state of ApoE plays an important role for receptor preference; in fact, lipid-free ApoE has been shown to favor low-density lipoprotein receptor-related protein (LRP) over the LDL receptor [47]. Moreover, lipid binding is not required for ApoE interaction with the very low-density lipoprotein (VLDL) receptor or for internalization into the cell [46]. DeKroon et al., reported that ApoE is endocytosed via a Rab5a-regulated vesicle-mediated pathway in neurons, and internal trafficking of ApoE showed isoform-specific differences [29].
ApoE4 has been shown to co-localize with Cathepsin D to a larger extent than ApoE3 was [29]. In addition, when Neuro-2a cells are treated with Aβ, lysosomal leakage is more largely induced when cells are transfected with ApoE4 compared to ApoE3 [10]. Indeed, under low pH conditions, ApoE4 was previously shown to destabilize membranes [48] by the formation of a stable molten globule structure [49]. In agreement with this, our in vitro studies revealed that lipid-free ApoE4 disrupts lysosomal integrity, as shown by AO staining, and elevated Cathepsin D localization in the cytosol. The increased levels of Cathepsin D in microsomal fractions of rApoE3 treated cells without any change in the cytosolic fraction suggests that Cathepsin D accumulates within these structures. Furthermore, we also demonstrated in vitro that inhibition of Cathepsin D prevented the decrease in Trx1 levels caused by rApoE4. This suggests that Cathepsin D degrades Trx1 after leakage from the lysosomes. Interestingly, altered subcellular localization of Cathepsin D followed by reduced levels of Trx1 was previously reported in two chronic myelogenous leukemia cell lines after chloroquine-induced disruption of autophagy [71].
Lysosomal leakage and cytosolic translocation of Cathepsin D have been shown to activate several apoptotic machineries, such as caspases, inducing the release of cytochrome c and the cleavage of BH3 interacting-domain death agonist (Bid) [50, 51]. Several reports have shown that ApoE is toxic for cultured neurons, with ApoE4 being more toxic than ApoE3 [9, 52]. This isoform-specific difference has also been observed in ApoE-transfected cell lines [53]. Furthermore, ApoE4-induced cell death was shown to have apoptotic features mediated through the LRP [54]. Some of the mechanisms proposed for ApoE4 toxicity involve mitochondrial dysfunction, impairment of calcium homeostasis [55, 56] and activation of caspase 3 [57].
Numerous studies have demonstrated how oxidation or down-regulation of Trx1 levels results in Ask-1 initiated apoptosis [58, 59]. We previously demonstrated that Aβ treatment in SH-SY5Y cells caused a strong oxidation of Trx1 and nuclear export of the Daxx protein, an event triggered by Ask-1 activation [13]. Here, we found that ApoE4 does not cause major changes in Trx1 redox status; rather, we observed that ApoE4 decreases Trx1 levels, induces Daxx translocation to the cytosol, and increases apoptosis. Thus, our results suggest that both Aβ and ApoE4 are neurotoxic in vitro by similar mechanisms.
In support of this idea, we showed that overexpression of Trx1 was able to protect against ApoE4 neurotoxicity, as it also protects against Aβ [13]. It is worth noting that ApoE4 treatment caused an increase in MTT signal, and thus probably in cell proliferation in Trx1 overexpressing cells. ApoE has been reported to be required for proliferation in certain cancer cell lines [60, 61], and the presence of ApoE4 and de-regulation of Trx1 has previously been linked to different types of cancers [62, 63]. These results support the notion that ApoE4, in conjunction with Trx1, could be important for cell proliferation and cancer development. Protection against ApoE4 neurotoxicity was also achieved by overexpressing Grx1 or DJ-1, two other redox molecules and Ask-1 cascade inhibitors [15, 25, 64]. DJ-1 is a protein with antioxidant and neuroprotective functions, and an autosomal recessive mutation in the DJ-1 gene leads to early-onset Parkinson’s disease (PD) [65]. Furthermore, Grx1 is also a redox sensitive protein that has been shown to be protective in experimental models of PD and has been found to be increased in healthy neurons of AD patients [13, 66, 67]. Trx1, Grx1 and DJ-1 have been shown to have overlapping functions as antioxidants and anti-apoptotic actors. Complementary actions between Trx1 and Grx1 have been described before in E coli [68] and DJ-1 prevented Daxx translocation and cytotoxicity in Neuro-2a cells caused by knockdown of Grx1 [64]. Moreover, DJ-1 can prevent the dissociation of Trx1 from Ask-1 in response to oxidative stress [69] and induce expression of Trx1 [70].
In summary, we report that the presence of ApoE4 results in reduced Trx1 levels and activation of apoptosis. These effects are likely mediated by impaired lysosomal integrity, resulting in Cathepsin D translocation to the cytosol and increased Trx1 degradation. Furthermore, the Trx1 levels were decreased in a primary endothelial cell model of stress-induced senescence. This was accompanied by increased Cathepsin D activity. However, the levels of Trx1 were restored when cells were treated with pepstatin A [72]. Interestingly, a polymorphism in the Cathepsin D gene has been associated with increased risk for AD, especially in ApoE4 carriers [73]. Furthermore, studies on human brain tissue showed accumulated Cathepsin D [74] and decreased Trx1 levels in neurons of AD patients [13, 14]. The novel mechanistic relationship reported here between ApoE4, Cathepsin D, Trx1, and apoptosis might likely help explain why ApoE4 confers an increased risk for AD.
ACKNOWLEDGMENTS
This study was supported by the Alzheimer association (USA), AFA Soria (Spain) and by Swedish foundations: Swedish Brain Power, Margaretha af Ugglas stiftelsen, Alzheimerfonden, Demensförbundet, Stiftelsen för Gamla Tjänarinnor, Gun och Bertil Stohnes Stiftelse, Karolinska Institutet fund for geriatric research, Stiftelsen Sigurd och Elsa Goljes Minne and Center for Innovative Medicine (CIMED) grants.
Authors’ disclosures available online (http://j-alz.com/manuscript-disclosures/150738r3).
Appendices
The supplementary material is available in the electronic version of this article: http://dx.doi.org/10.3233/JAD-150738.
REFERENCES
[1] | Cedazo-Minguez A ((2007) ) Apolipoprotein E and Alzheimer’s disease: Molecular mechanisms and therapeutic opportunities. J Cell Mol Med 11: , 1227–1238. |
[2] | Farrer LA , Cupples LA , Haines JL , Hyman B , Kukull WA , Mayeux R , Myers RH , Pericak-Vance MA , Risch N , van Duijn CM ((1997) ) Effects of age, sex, and ethnicity on the association between apolipoprotein E genotype and Alzheimer disease. A meta-analysis. APOE and Alzheimer Disease Meta Analysis Consortium. JAMA 278: , 1349–1356. |
[3] | Corder EH , Saunders AM , Strittmatter WJ , Schmechel DE , Gaskell PC , Small GW , Roses AD , Haines JL , Pericak-Vance MA ((1993) ) Gene dose of apolipoprotein E type 4 allele and the risk of Alzheimer’s disease in late onset families. Science 261: , 921–923. |
[4] | Ma J , Yee A , Brewer HB Jr , Das S , Potter H ((1994) ) Amyloid-associated proteins alpha 1-antichymotrypsin and apolipoprotein E promote assembly of Alzheimer beta-protein into filaments. Nature 372: , 92–94. |
[5] | Deane R , Sagare A , Hamm K , Parisi M , Lane S , Finn MB , Holtzman DM , Zlokovic BV ((2008) ) ApoE isoform-specific disruption of amyloid beta peptide clearance from mouse brain. J Clin Invest 118: , 4002–4013. |
[6] | Hardy JA , Higgins GA ((1992) ) Alzheimer’s disease: The amyloid cascade hypothesis. Science 256: , 184–185. |
[7] | Hamanaka H , Katoh-Fukui Y , Suzuki K , Kobayashi M , Suzuki R , Motegi Y , Nakahara Y , Takeshita A , Kawai M , Ishiguro K , Yokoyama M , Fujita SC ((2000) ) Altered cholesterol metabolism in human apolipoprotein E4 knock-in mice. Hum Mol Genet 9: , 353–361. |
[8] | Chen Y , Durakoglugil MS , Xian X , Herz J ((2010) ) ApoE4 reduces glutamate receptor function and synaptic plasticity by selectively impairing ApoE receptor recycling. Proc Natl Acad Sci U S A 107: , 12011–12016. |
[9] | Cedazo-Minguez A , Huttinger M , Cowburn RF ((2001) ) Beta-VLDL protects against A beta(1-42) and apoE toxicity in human SH-SY5Y neuroblastoma cells. Neuroreport 12: , 201–206. |
[10] | Ji ZS , Miranda RD , Newhouse YM , Weisgraber KH , Huang Y , Mahley RW ((2002) ) Apolipoprotein E4 potentiates amyloid beta peptide-induced lysosomal leakage and apoptosis in neuronal cells. J Biol Chem 277: , 21821–21828. |
[11] | Nunomura A , Perry G , Aliev G , Hirai K , Takeda A , Balraj EK , Jones PK , Ghanbari H , Wataya T , Shimohama S , Chiba S , Atwood CS , Petersen RB , Smith MA ((2001) ) Oxidative damage is the earliest event in Alzheimer disease. J Neuropathol Exp Neurol 60: , 759–767. |
[12] | Ramassamy C , Averill D , Beffert U , Theroux L , Lussier-Cacan S , Cohn JS , Christen Y , Schoofs A , Davignon J , Poirier J ((2000) ) Oxidative insults are associated with apolipoprotein E genotype in Alzheimer’s disease brain. Neurobiol Dis 7: , 23–37. |
[13] | Akterin S , Cowburn RF , Miranda-Vizuete A , Jimenez A , Bogdanovic N , Winblad B , Cedazo-Minguez A ((2006) ) Involvement of glutaredoxin-1 and thioredoxin-1 in beta-amyloid toxicity and Alzheimer’s disease. Cell Death Differ 13: , 1454–1465. |
[14] | Lovell MA , Xie C , Gabbita SP , Markesbery WR ((2000) ) Decreased thioredoxin and increased thioredoxin reductase levels in Alzheimer’s disease brain. Free Radic Biol Med 28: , 418–427. |
[15] | Saitoh M , Nishitoh H , Fujii M , Takeda K , Tobiume K , Sawada Y , Kawabata M , Miyazono K , Ichijo H ((1998) ) Mammalian thioredoxin is a direct inhibitor of apoptosis signal-regulating kinase (ASK) 1. EMBO J 17: , 2596–2606. |
[16] | Maioli S , Puerta E , Merino-Serrais P , Fusari L , Gil-Bea F , Rimondini R , Cedazo-Minguez A ((2012) ) Combination of apolipoprotein E4 and high carbohydrate diet reduces hippocampal BDNF and arc levels and impairs memory in young mice. J Alzheimers Dis 32: , 341–355. |
[17] | Mateos L , Ismail MA , Gil-Bea FJ , Schule R , Schols L , Heverin M , Folkesson R , Bjorkhem I , Cedazo-Minguez A ((2011) ) Side chain-oxidized oxysterols regulate the brain renin-angiotensin system through a liver X receptor-dependent mechanism. J Biol Chem 286: , 25574–25585. |
[18] | Livak KJ , Schmittgen TD ((2001) ) Analysis of relative gene expression data using real-time quantitative PCR and the 2(-Delta Delta C(T)) Method. Methods 25: , 402–408. |
[19] | Miller DW , Ahmad R , Hague S , Baptista MJ , Canet-Aviles R , McLendon C , Carter DM , Zhu PP , Stadler J , Chandran J , Klinefelter GR , Blackstone C , Cookson MR ((2003) ) L166P mutant DJ-1, causative for recessive Parkinson’s disease, is degraded through the ubiquitin-proteasome system. J Biol Chem 278: , 36588–36595. |
[20] | Dehvari N , Sandebring A , Flores-Morales A , Mateos L , Chuan YC , Goldberg MS , Cookson MR , Cowburn RF , Cedazo-Minguez A ((2009) ) Parkin-mediated ubiquitination regulates phospholipase C-gamma1. J Cell Mol Med 13: , 3061–3068. |
[21] | Song JJ , Lee YJ ((2003) ) Role of the ASK1-SEK1-JNK1-HIPK1 signal in Daxx trafficking and ASK1 oligomerization. J Biol Chem 278: , 47245–47252. |
[22] | Mateos L , Persson T , Katoozi S , Gil-Bea FJ , Cedazo-Minguez A ((2012) ) Estrogen protects against amyloid-beta toxicity by estrogen receptor alpha-mediated inhibition of Daxx translocation. Neurosci Lett 506: , 245–250. |
[23] | Kitamura T , Fukuyo Y , Inoue M , Horikoshi NT , Shindoh M , Rogers BE , Usheva A , Horikoshi N ((2009) ) Mutant p53 disrupts the stress MAPK activation circuit induced by ASK1-dependent stabilization of Daxx. Cancer Res 69: , 7681–7688. |
[24] | Chang HY , Nishitoh H , Yang X , Ichijo H , Baltimore D ((1998) ) Activation of apoptosis signal-regulating kinase 1 (ASK1) by the adapter protein Daxx. Science 281: , 1860–1863. |
[25] | Song JJ , Rhee JG , Suntharalingam M , Walsh SA , Spitz DR , Lee YJ ((2002) ) Role of glutaredoxin in metabolic oxidative stress. Glutaredoxin as a sensor of oxidative stress mediated by H2O2. J Biol Chem 277: , 46566–46575. |
[26] | Junn E , Taniguchi H , Jeong BS , Zhao X , Ichijo H , Mouradian MM ((2005) ) Interaction of DJ-1 with Daxx inhibits apoptosis signal-regulating kinase 1 activity and cell death. Proc Natl Acad Sci U S A 102: , 9691–9696. |
[27] | Haendeler J , Popp R , Goy C , Tischler V , Zeiher AM , Dimmeler S ((2005) ) Cathepsin D and H2O2 stimulate degradation of thioredoxin-1: Implication for endothelial cell apoptosis. J Biol Chem 280: , 42945–42951. |
[28] | Kagedal K , Johansson U , Ollinger K ((2001) ) The lysosomal protease cathepsin D mediates apoptosis induced by oxidative stress. FASEB J 15: , 1592–1594. |
[29] | DeKroon RM , Armati PJ ((2001) ) The endosomal trafficking of apolipoprotein E3 and E4 in cultured human brain neurons and astrocytes. Neurobiol Dis 8: , 78–89. |
[30] | Boya P , Kroemer G ((2008) ) Lysosomal membrane permeabilization in cell death. Oncogene 27: , 6434–6451. |
[31] | Pohl S , Marschner K , Storch S , Braulke T ((2009) ) Glycosylation- and phosphorylation-dependent intracellular transport of lysosomal hydrolases. Biol Chem 390: , 521–527. |
[32] | Padurariu M , Ciobica A , Lefter R , Serban IL , Stefanescu C , Chirita R ((2013) ) The oxidative stress hypothesis in Alzheimer’s disease. Psychiatr Danub 25: , 401–409. |
[33] | Benzi G , Moretti A ((1995) ) Age- and peroxidative stress-related modifications of the cerebral enzymatic activities linked to mitochondria and the glutathione system. Free Radic Biol Med 19: , 77–101. |
[34] | Lovell MA , Ehmann WD , Butler SM , Markesbery WR ((1995) ) Elevated thiobarbituric acid-reactive substances and antioxidant enzyme activity in the brain in Alzheimer’s disease. Neurology 45: , 1594–1601. |
[35] | Marcus DL , Thomas C , Rodriguez C , Simberkoff K , Tsai JS , Strafaci JA , Freedman ML ((1998) ) Increased peroxidation and reduced antioxidant enzyme activity in Alzheimer’s disease. Exp Neurol 150: , 40–44. |
[36] | Di Domenico F , Sultana R , Tiu GF , Scheff NN , Perluigi M , Cini C , Butterfield DA ((2010) ) Protein levels of heat shock proteins 27, 32, 60, 70, 90 and thioredoxin-1 in amnestic mild cognitive impairment: An investigation on the role of cellular stress response in the progression of Alzheimer disease. Brain Res 1333: , 72–81. |
[37] | Tamaoka A , Miyatake F , Matsuno S , Ishii K , Nagase S , Sahara N , Ono S , Mori H , Wakabayashi K , Tsuji S , Takahashi H , Shoji S ((2000) ) Apolipoprotein E allele-dependent antioxidant activity in brains with Alzheimer’s disease. Neurology 54: , 2319–2321. |
[38] | Kharrazi H , Vaisi-Raygani A , Rahimi Z , Tavilani H , Aminian M , Pourmotabbed T ((2008) ) Association between enzymatic and non-enzymatic antioxidant defense mechanism with apolipoprotein E genotypes in Alzheimer disease. Clin Biochem 41: , 932–936. |
[39] | Grootendorst J , Bour A , Vogel E , Kelche C , Sullivan PM , Dodart JC , Bales K , Mathis C ((2005) ) Human apoE targeted replacement mouse lines: h-apoE4 and h-apoE3 mice differ on spatial memory performance and avoidance behavior. Behav Brain Res 159: , 1–14. |
[40] | Taniguchi Y , Taniguchi-Ueda Y , Mori K , Yodoi J ((1996) ) A novel promoter sequence is involved in the oxidative stress-induced expression of the adult T-cell leukemia-derived factor (ADF)/human thioredoxin (Trx) gene. Nucleic Acids Res 24: , 2746-2752. |
[41] | Kim YC , Masutani H , Yamaguchi Y , Itoh K , Yamamoto M , Yodoi J ((2001) ) Hemin-induced activation of the thioredoxin gene by Nrf2. A differential regulation of the antioxidant responsive element by a switch of its binding factors. J Biol Chem 276: , 18399-18406. |
[42] | Lkhider M , Castino R , Bouguyon E , Isidoro C , Ollivier-Bousquet M ((2004) ) Cathepsin D released by lactating rat mammary epithelial cells is involved in prolactin cleavage under physiological conditions. J Cell Sci 117: , 5155–5164. |
[43] | Lin Y , Epstein DL , Liton PB ((2010) ) Intralysosomal iron induces lysosomal membrane permeabilization and cathepsin D-mediated cell death in trabecular meshwork cells exposed to oxidative stress. Invest Ophthalmol Vis Sci 51: , 6483–6495. |
[44] | Spuch C , Ortolano S , Navarro C ((2012) ) LRP-1 and LRP-2 receptors function in the membrane neuron. Trafficking mechanisms and proteolytic processing in Alzheimer’s disease. Front Physiol 3: , 269. |
[45] | Williams KR , Saunders AM , Roses AD , Armati PJ ((1998) ) Uptake and internalization of exogenous apolipoprotein E3 by cultured human central nervous system neurons. Neurobiol Dis 5: , 271–279. |
[46] | Ruiz J , Kouiavskaia D , Migliorini M , Robinson S , Saenko EL , Gorlatova N , Li D , Lawrence D , Hyman BT , Weisgraber KH , Strickland DK ((2005) ) The apoE isoform binding properties of the VLDL receptor reveal marked differences from LRP and the LDL receptor. J Lipid Res 46: , 1721–1731. |
[47] | LaDu MJ , Stine WB Jr , Narita M , Getz GS , Reardon CA , Bu G ((2006) ) Self-assembly of HEK cell-secreted ApoE particles rebles ApoE enrichment of lipoproteins as a ligand for the LDL receptor-related protein. Biochemistry 45: , 381–390. |
[48] | Ji ZS , Mullendorff K , Cheng IH , Miranda RD , Huang Y , Mahley RW ((2006) ) Reactivity of apolipoprotein E4 and amyloid beta peptide: Lysosomal stability and neurodegeneration. J Biol Chem 281: , 2683–2692. |
[49] | Morrow JA , Hatters DM , Lu B , Hochtl P , Oberg KA , Rupp B , Weisgraber KH ((2002) ) Apolipoprotein E4 forms a molten globule. A potential basis for its association with disease. J Biol Chem 277: , 50380–50385. |
[50] | Johansson AC , Steen H , Ollinger K , Roberg K ((2003) ) Cathepsin D mediates cytochrome c release and caspase activation in human fibroblast apoptosis induced by staurosporine. Cell Death Differ 10: , 1253–1259. |
[51] | Appelqvist H , Johansson AC , Linderoth E , Johansson U , Antonsson B , Steinfeld R , Kagedal K , Ollinger K ((2012) ) Lysosome-mediated apoptosis is associated with cathepsin D-specific processing of bid at Phe24, Trp48, and Phe183. Ann Clin Lab Sci 42: , 231–242. |
[52] | Marques MA , Tolar M , Harmony JA , Crutcher KA ((1996) ) A thrombin cleavage fragment of apolipoprotein E exhibits isoform-specific neurotoxicity. Neuroreport 7: , 2529–2532. |
[53] | Jordan J , Galindo MF , Miller RJ , Reardon CA , Getz GS , LaDu MJ ((1998) ) Isoform-specific effect of apolipoprotein E on cell survival and beta-amyloid-induced toxicity in rat hippocampal pyramidal neuronal cultures. J Neurosci 18: , 195–204. |
[54] | Hashimoto Y , Jiang H , Niikura T , Ito Y , Hagiwara A , Umezawa K , Abe Y , Murayama Y , Nishimoto I ((2000) ) Neuronal apoptosis by apolipoprotein E4 through low-density lipoprotein receptor-related protein and heterotrimeric GTPases. J Neurosci 20: , 8401–8409. |
[55] | Chang S , ran Ma T , Miranda RD , Balestra ME , Mahley RW , Huang Y ((2005) ) Lipid- and receptor-binding regions of apolipoprotein E4 fragments act in concert to cause mitochondrial dysfunction and neurotoxicity. Proc Natl Acad Sci U S A 102: , 18694–18699. |
[56] | Veinbergs I , Everson A , Sagara Y , Masliah E ((2002) ) Neurotoxic effects of apolipoprotein E4 are mediated via dysregulation of calcium homeostasis. J Neurosci Res 67: , 379–387. |
[57] | Cedazo-Minguez A , Popescu BO , Blanco-Millan JM , Akterin S , Pei JJ , Winblad B , Cowburn RF ((2003) ) Apolipoprotein E and beta-amyloid (1-42) regulation of glycogen synthase kinase-3 beta. J Neurochem 87: , 1152–1164. |
[58] | Madan E , Gogna R , Kuppusamy P , Bhatt M , Mahdi AA , Pati U ((2013) ) SCO2 induces p53-mediated apoptosis by Thr845 phosphorylation of ASK-1 and dissociation of the ASK-1-Trx complex. Mol Cell Biol 33: , 1285–1302. |
[59] | Hodges NJ , Smart D , Lee AJ , Lewis NA , Chipman JK ((2004) ) Activation of c-Jun N-terminal kinase in A549 lung carcinoma cells by sodium dichromate: Role of dissociation of apoptosis signal regulating kinase-1 from its physiological inhibitor thioredoxin. Toxicology 197: , 101–112. |
[60] | Su WP , Chen YT , Lai WW , Lin CC , Yan JJ , Su WC ((2011) ) Apolipoprotein E expression promotes lung adenocarcinoma proliferation and migration and as a potential survival marker in lung cancer. Lung Cancer 71: , 28–33. |
[61] | Chen YC , Pohl G , Wang TL , Morin PJ , Risberg B , Kristensen GB , Yu A , Davidson B , Shih Ie M ((2005) ) Apolipoprotein E is required for cell proliferation and survival in ovarian cancer. Cancer Res 65: , 331–337. |
[62] | Arner ES , Holmgren A ((2006) ) The thioredoxin system in cancer. Semin Cancer Biol 16: , 420–426. |
[63] | Lehrer S ((1998) ) Possible relationship of the apolipoprotein E (ApoE) epsilon4 allele to prostate cancer. Br J Cancer 78: , 1398. |
[64] | Saeed U , Ray A , Valli RK , Kumar AM , Ravindranath V ((2010) ) DJ-1 loss by glutaredoxin but not glutathione depletion triggers Daxx translocation and cell death. Antioxid Redox Signal 13: , 127–144. |
[65] | Bonifati V , Rizzu P , van Baren MJ , Schaap O , Breedveld GJ , Krieger E , Dekker MC , Squitieri F , Ibanez P , Joosse M , van Dongen JW , Vanacore N , van Swieten JC , Brice A , Meco G , van Duijn CM , Oostra BA , Heutink P ((2003) ) Mutations in the DJ-1 gene associated with autosomal recessive early-onset parkinsonism. Science 299: , 256–259. |
[66] | Kenchappa RS , Ravindranath V ((2003) ) Glutaredoxin is essential for maintenance of brain mitochondrial complex I: Studies with MPTP. FASEB J 17: , 717–719. |
[67] | Arodin L , Miranda-Vizuete A , Swoboda P , Fernandes AP ((2014) ) Protective effects of the thioredoxin and glutaredoxin systems in dopamine-induced cell death. Free Radic Biol Med 73: , 328–336. |
[68] | Miranda-Vizuete A , Rodriguez-Ariza A , Toribio F , Holmgren A , Lopez-Barea J , Pueyo C ((1996) ) The levels of ribonucleotide reductase, thioredoxin, glutaredoxin 1, and GSH are balanced in Escherichia coli K12. J Biol Chem 271: , 19099–19103. |
[69] | Im JY , Lee KW , Junn E , Mouradian MM ((2010) ) DJ-1 protects against oxidative damage by regulating the thioredoxin/ASK1 complex. Neurosci Res 67: , 203–208. |
[70] | Im JY , Lee KW , Woo JM , Junn E , Mouradian MM ((2012) ) DJ-1 induces thioredoxin 1 expression through the Nrf2 pathway. Hum Mol Genet 21: , 3013–3024. |
[71] | Carew JS , Nawrocki ST , Kahue CN , Zhang H , Yang C , Chung L , Houghton JA , Huang P , Giles FJ , Cleveland JL ((2007) ) Targeting autophagy augments the anticancer activity of the histone deacetylase inhibitor SAHA to overcome Bcr-Abl-mediated drug resistance. Blood 110: , 313–322. |
[72] | Goy C , Czypiorski P , Altschmied J , Jakob S , Rabanter LL , Brewer AC , Ale-Agha N , Dyballa-Rukes N , Shah AM , Haendeler J ((2014) ) The imbalanced redox status in senescent endothelial cells is due to dysregulated Thioredoxin-1 and NADPH oxidase 4. Exp Gerontol 56: , 45–52. |
[73] | Papassotiropoulos A , Bagli M , Kurz A , Kornhuber J , Forstl H , Maier W , Pauls J , Lautenschlager N , Heun R ((2000) ) A genetic variation of cathepsin D is a major risk factor for Alzheimer’s disease. Ann Neurol 47: , 399–403. |
[74] | Cataldo AM , Barnett JL , Berman SA , Li J , Quarless S , Bursztajn S , Lippa C , Nixon RA ((1995) ) Gene expression and cellular content of cathepsin D in Alzheimer’s disease brain: Evidence for early u-regulation of the endosomal-lysosomal system. Neuron 14: , 671–680. |
Figures and Tables
Fig.1
ApoE4 lowers Trx1 levels in vivo and in vitro. A) Representative picture of Trx1 levels in hippocampus from 6-month-old ApoE TR mice, analyzed with western blot. Bars represent mean values of 9 animals±SEM. Data are expressed as percentage of values for ApoE3 mice (Mann-Whitney U-test, **p < 0.01). B) Representative picture of Trx1 levels in SH-SY5Y cells treated with 100 nM rApoE3 or rApoE4 for 5 and 24 h and analyzed with western blot. Non-treated cells were used as control. Histogram shows the quantification of Trx1 levels in rApoE treated cells. Bars represent mean values±SEM of 4 independent experiments and data are expressed as percentage of values for control cells (one-way ANOVA, **p < 0.01). C) Western blot analysis of Trx1 in lysates from human primary cortical neurons treated with 100 nM rApoE for 5 h. The histogram shows mean values±SEM of 3 independent experiments and data are expressed as percentage of values for control cells (one-way ANOVA, *p < 0.05). D) Western blot analysis of Trx1 in cell medium from SH-SY5Y cells treated with or without 100 nM rApoe for 5 h. E) Levels of Trx1 mRNA in hippocampus from 6 months old ApoE TR mice. Relative gene expression is presented as mean value of 6 animals±SEM (Mann-Whitney U-test, *p < 0.05). F) Trx1 mRNA levels in SH-SY5Y cells treated with 100 nM rApoE for 24 h. Relative gene expression is presented as mean±SEM of 4 different experiments (one-way ANOVA, *p < 0.01).
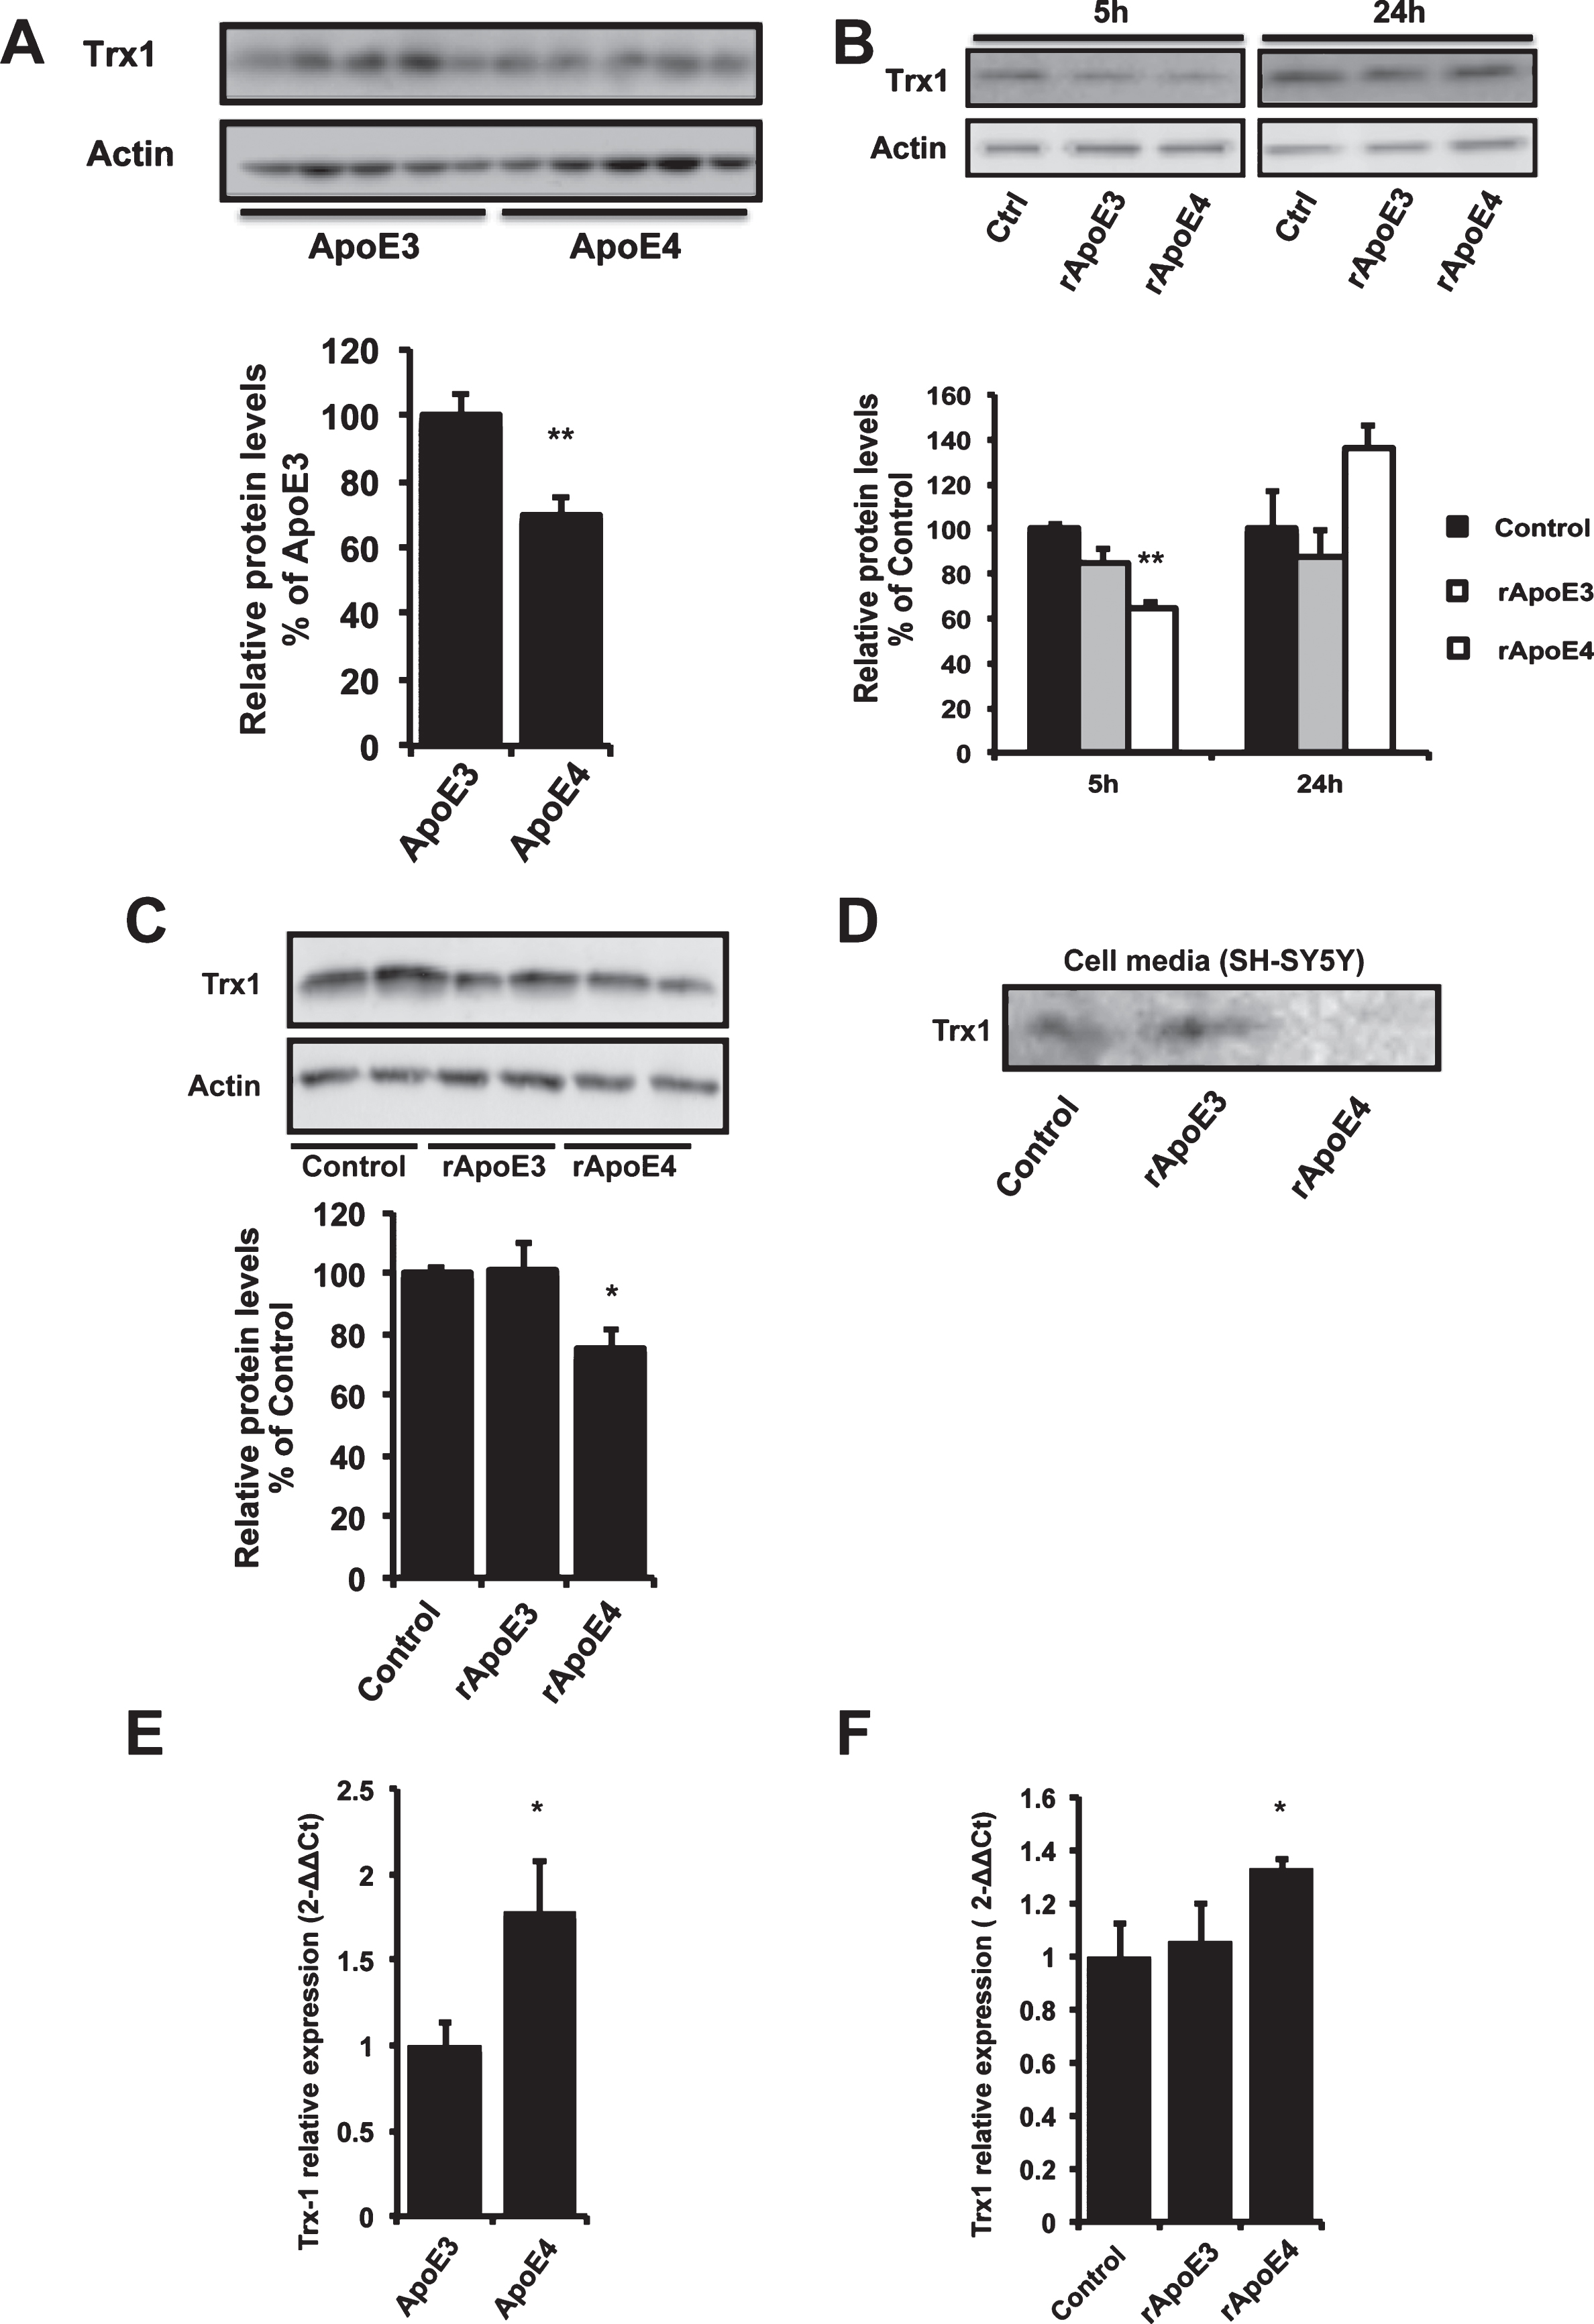
Fig.2
ApoE4 causes cytosolic translocation of Daxx and apoptosis. A) Immunoblot of cytosolic and nuclear fractions of SH-SY5Y cells treated with 100 nM rApoE for 5 h using Daxx antibody. Staining with Lamin A was used to visualize the purity of the fractions (lower panel). (C, Cytosolic fraction; N, nuclear fraction). B) Immunocytochemistry with DAPI (blue) and an antibody against Daxx (red) of SH-SY5Y cells treated with 100 nM rApoE for 24 h. The pictures show representative images of three independent experiments. C) Immunocytochemistry with DAPI (blue) and an antibody against Daxx (red) of human primary cortical neurons treated with 100 nM rApoE for 18 h. The pictures show representative images of three independent experiments. D) The effect of ApoE treatment on the level of apoptosis in SH-SY5Y cells. Cells were treated with 100 nM ApoE for indicated time points followed by analysis of mono- and oligonucleosome levels to measure apoptosis. Samples were measured in triplicate and experiments were repeated 4 times. Data represent mean values±S.E.M and are expressed as percentage of values for untreated control cells (***p < 0.001; one-way ANOVA, Fisher’s PLSD post hoc test). E) Representative picture of cleaved Caspase 3 levels in SH-SY5Y cells treated for 24 h with 100 nM rApoE3 or rApoE4 and analyzed with western blot. Actin was used as loading control. Histogram show mean values±SEM of 3 independent experiments and data are expressed as percentage of values for control cells (one-way ANOVA, *p < 0.05).
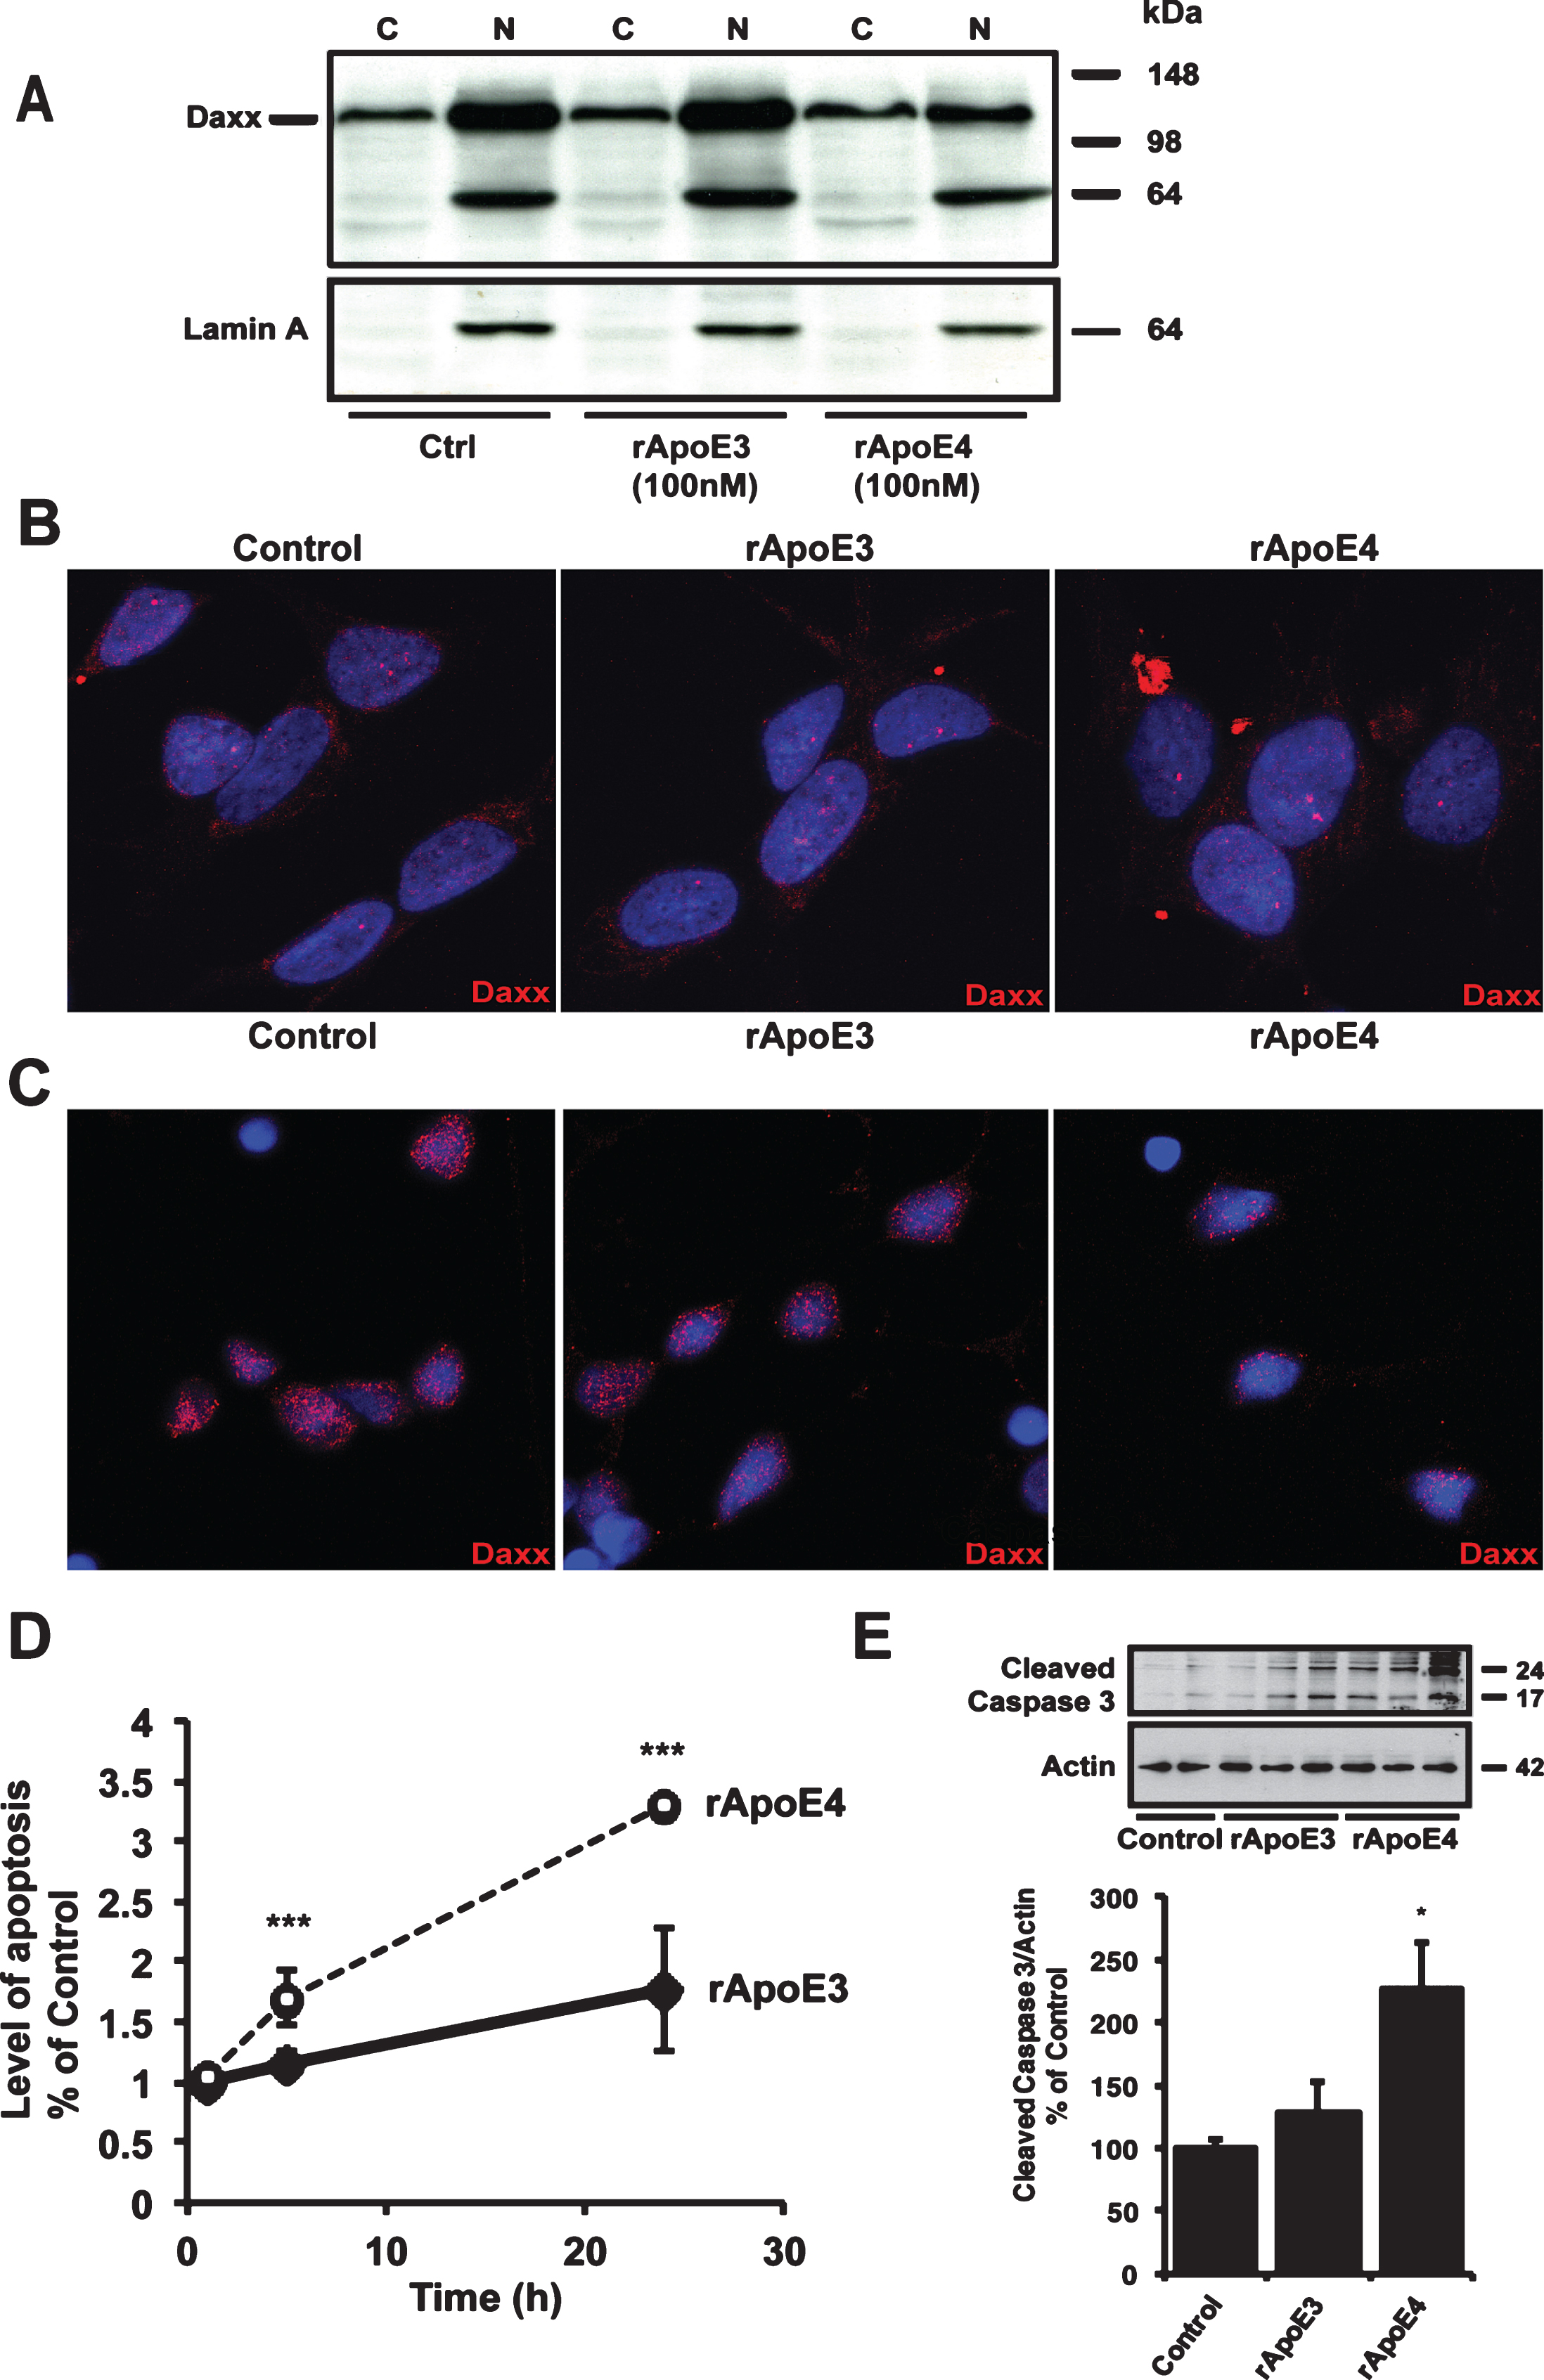
Fig.3
Overexpression of endogenous Ask-1 inhibitors protects against ApoE4 toxicity. Cell viability analysis using MTT reduction assay in SH-SY5Y cells overexpressing Trx1, Grx1 or Parkin (A), and in BE(2)-M17 cells overexpressing DJ-1 (B). Cells were treated for 24 h with 100 nM rApoE before analysis. Bars represent mean±S.E.M of three experiments measured in triplicates and are presented as percentage of values for untreated control cells. (**p < 0.01, ***p < 0.001; one-way ANOVA, Fisher’s PLSD post hoc test).
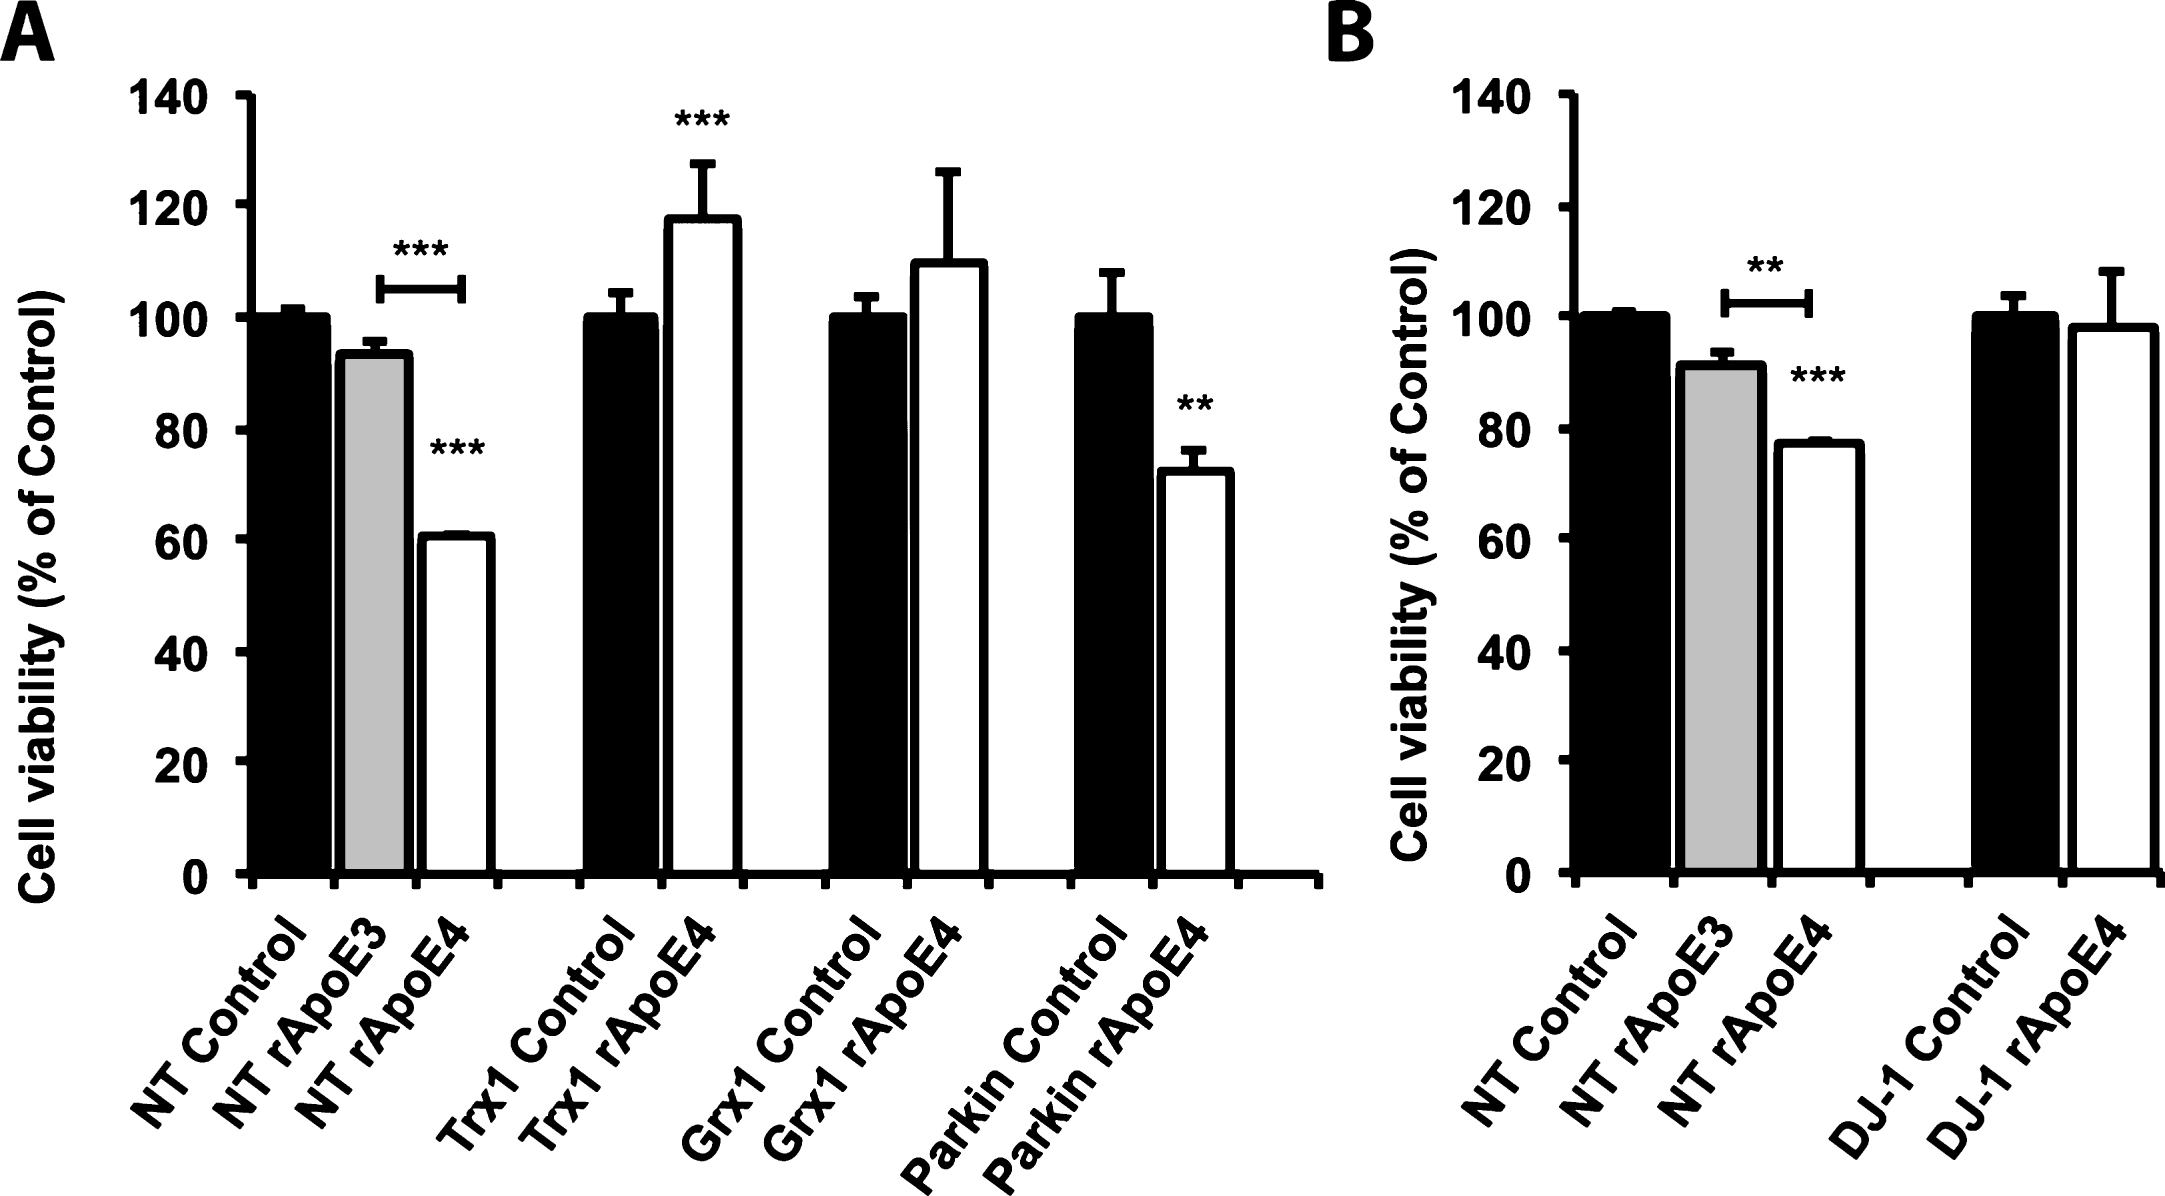
Fig.4
ApoE4 induces minor oxidative stress effects in SH-SY5Y cells. A) Trx1 redox status assessment using AMS gel shift assay. The pictures show representative images of four repeated experiments. Effects of rApoE on GSH levels (B) and on catalase activity (C). Bars represent mean values±S.E.M of six experiments and are presented as percentage of values for control cells at each time point (**p < 0.01; one-way ANOVA, Fisher’s PLSD post hoc test).
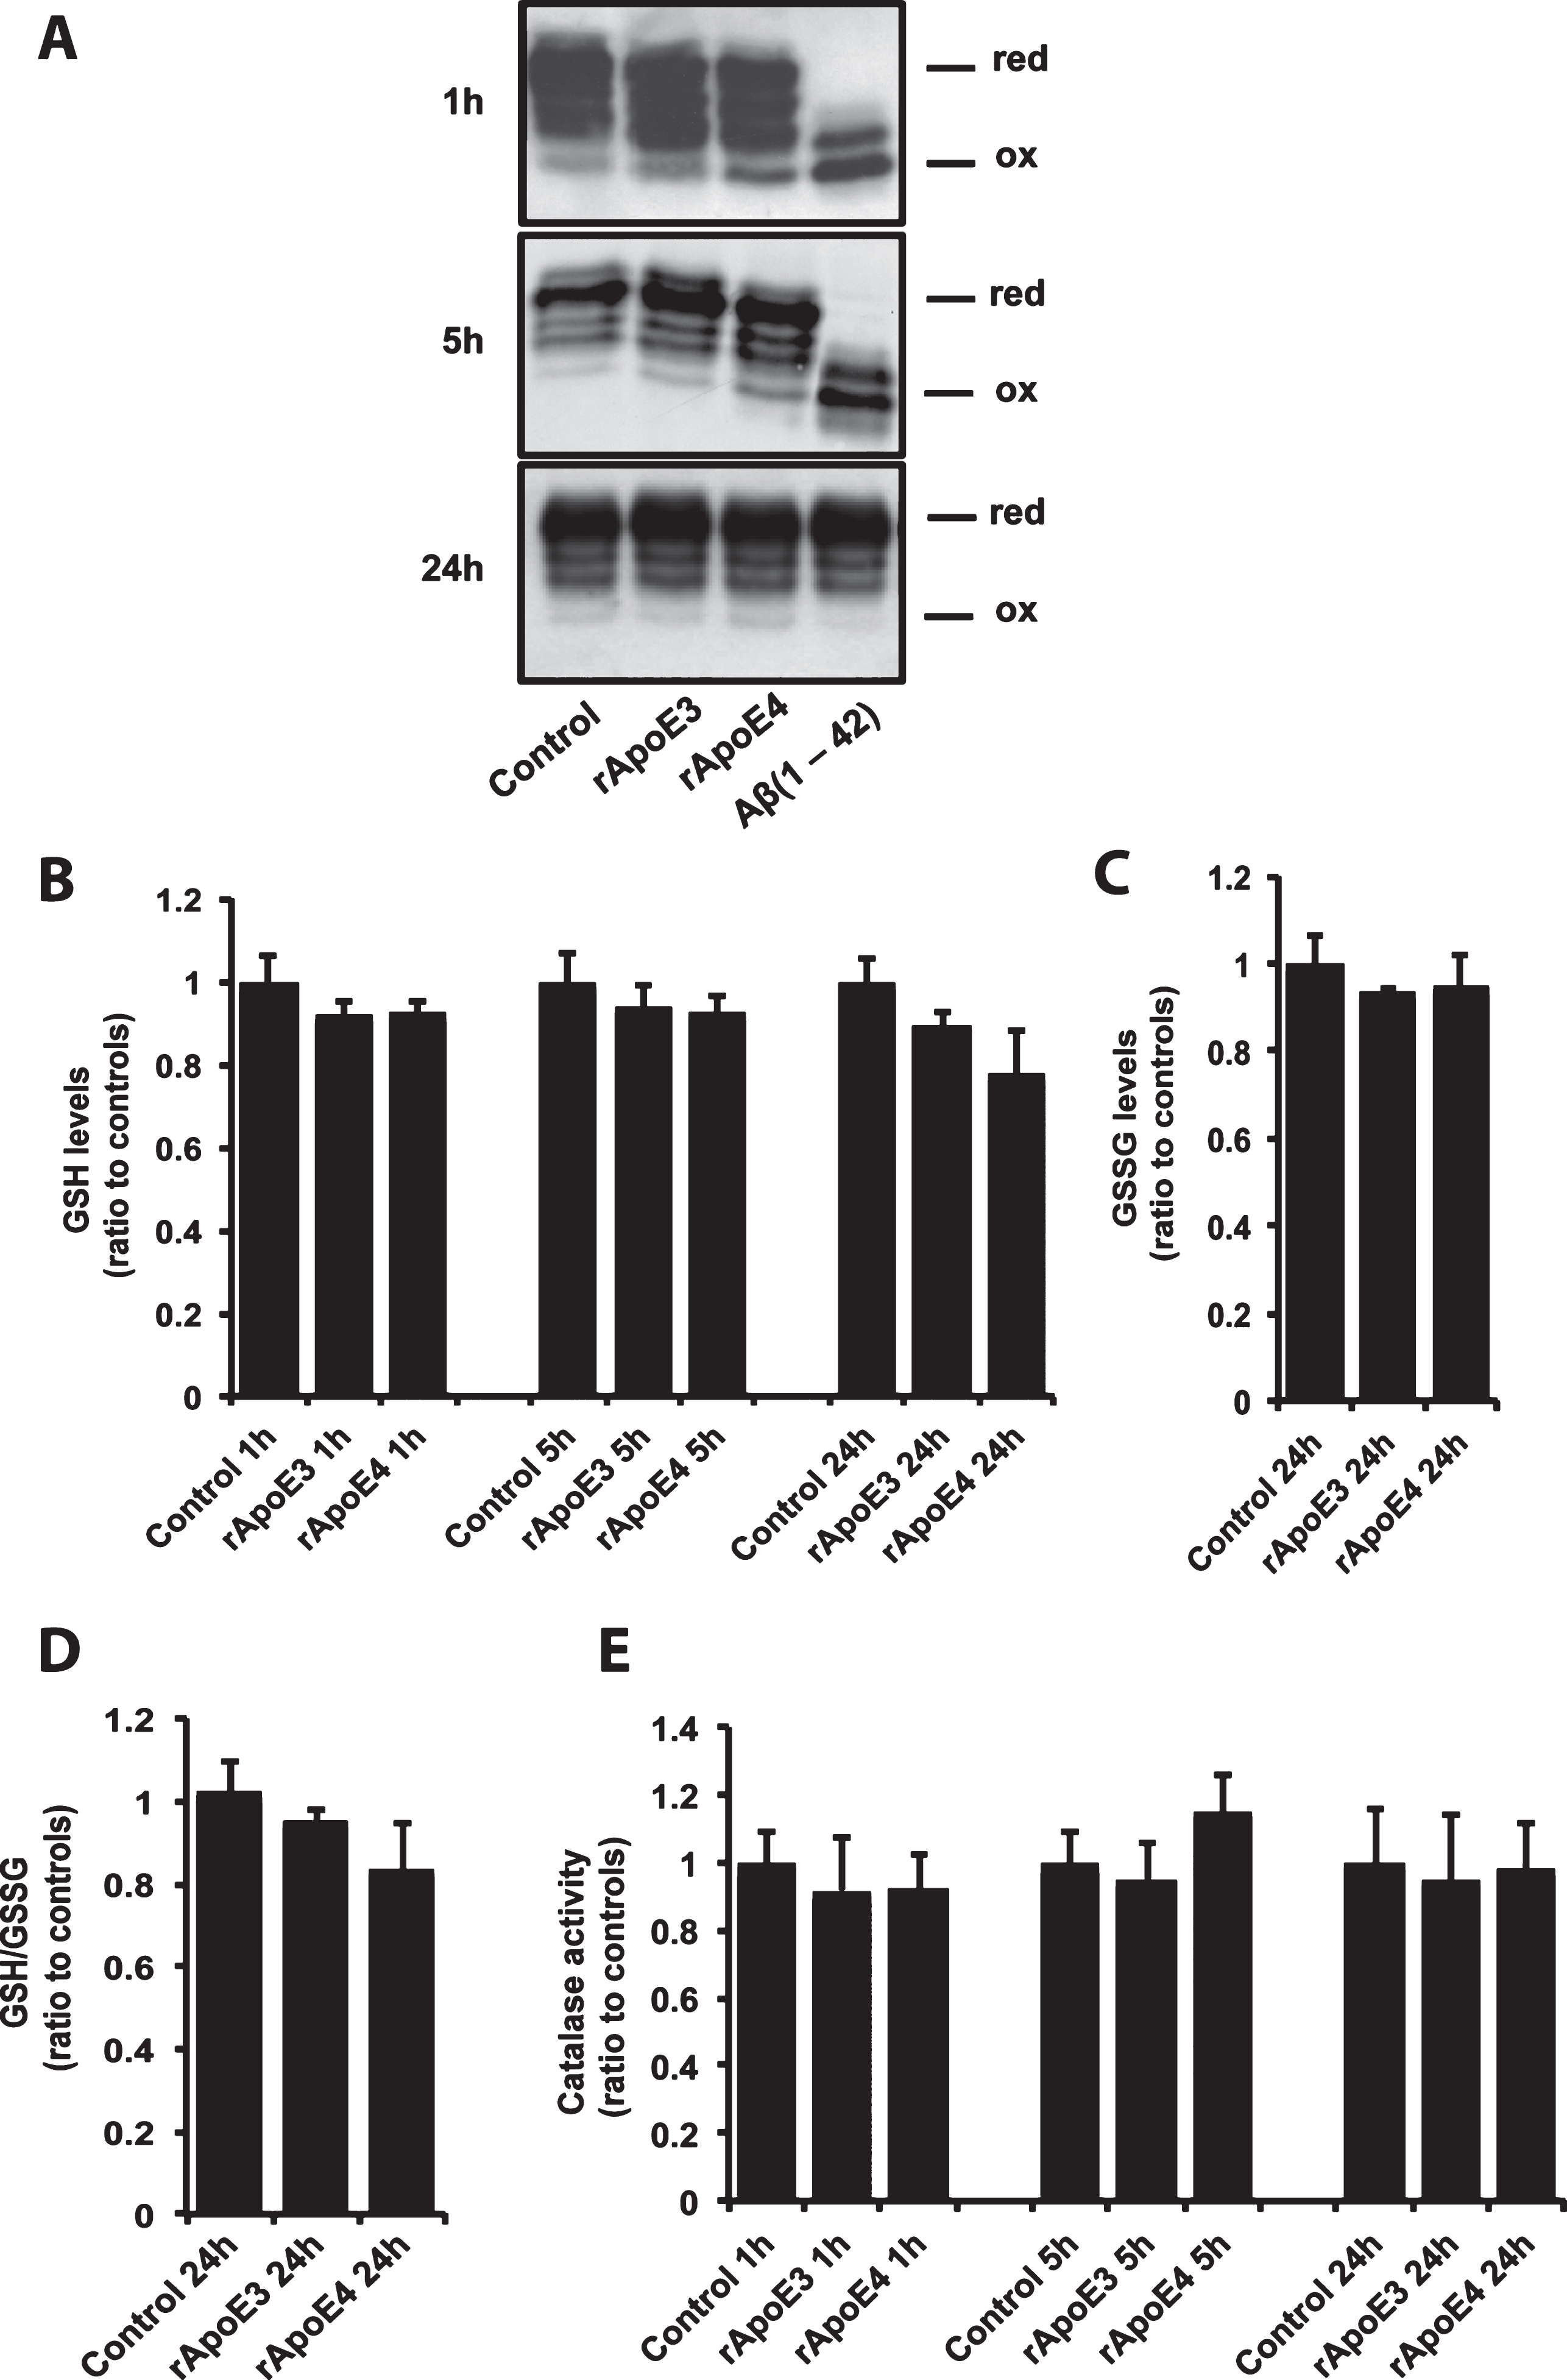
Fig.5
ApoE4 causes lysosomal leakage of Cathepsin D. A) Immunocytochemistry with antibodies against Lamp-2 (red) and Cathepsin D (green) in SH-SY5Y cells treated with 100 nM rApoE for 1 h. The pictures show representative images of experiments repeated three times. B) Acridin orange (AO) staining for visualization of lysosomal integrity of SH-SY5Y cells treated with 100 nM rApoE for 1 h. Cells were visualized with confocal laser scanning microscopy. Pictures show representative images of three independent experiments. C) Representative picture of Cathepsin D levels in microsomal and cytosolic fractions of SH-SY5Y cells treated with 100 nM rApoE for 1 h. Bars represents mean values±SEM of 3 independent experiments and data are expressed as percentage of values for control cells (One-way ANOVA, *p < 0.05 (Microsomal rApoE3 treated versus both Control and rApoE4 treated, and Cytosolic rApoE4 treated versus both Control and rApoE3 treated)) Ponceau staining was used as loading control. D) Representative picture of Trx1 levels in lysates from SH-SY5Y cells treated for 5 h with 100 nM rApoE, alone or together with 10 μg/ml Pepstatin A. Bars represents mean values±SEM of 3 independent experiments and data are expressed as percentage of values for control cells (One-way ANOVA, *p < 0.05, **p < 0.01. E) Immunocytochemistry with antibodies against Lamp-2 (red) and Cathepsin D (green) in human primary cortical neurons treated with 100 nM rApoE for 1 h. The pictures show representative images of experiments repeated three times.