
Subtle Cognitive Decline and Biomarker Staging in Preclinical Alzheimer’s Disease
Abstract
The NIA-AA criteria for “preclinical” Alzheimer’s disease (AD) propose a staging method in which AD biomarkers follow an invariable temporal sequence in accordance with the amyloid cascade hypothesis. However, recent findings do not align with the proposed temporal sequence and “subtle cognitive decline,” which has not been definitively operationalized, may occur earlier than suggested in preclinical AD. We aimed to define “subtle cognitive decline” using sensitive and reliable neuropsychological tests, and to examine the number and sequence of biomarker abnormalities in the Alzheimer’s Disease Neuroimaging Initiative (ADNI). 570 cognitively normal ADNI participants were classified based on NIA-AA criteria and separately based on the number of abnormal biomarkers/cognitive markers associated with preclinical AD that each individual possessed. Results revealed that neurodegeneration alone was 2.5 times more common than amyloidosis alone at baseline. For those who demonstrated only one abnormal biomarker at baseline and later progressed to mild cognitive impairment/AD, neurodegeneration alone was most common, followed by amyloidosis alone or subtle cognitive decline alone, which were equally common. Findings suggest that most individuals do not follow the temporal order proposed by NIA-AA criteria. We provide an operational definition of subtle cognitive decline that captures both cognitive and functional decline. Additionally, we offer a new approach for staging preclinical AD based on number of abnormal biomarkers, without regard to their temporal order of occurrence. This method of characterizing preclinical AD is more parsimonious than the NIA-AA staging system and does not presume that all patients follow a singular invariant expression of the disease.
INTRODUCTION
The pathogenesis of Alzheimer’s disease (AD) is believed to begin many years prior to clinical diagnosis, and there is a great need to better detect and characterize the earliest phases of the disease process. The National Institute on Aging and the Alzheimer’s Association (NIA-AA) published research criteria for “preclinical” AD [1], an asymptomatic phase in which individuals are classified as cognitively normal but have biomarkers associated with AD (i.e., evidence of amyloid-β or tau protein alterations) and possible evidence of “subtle cognitive decline,” which has yet to be definitively operationalized. The criteria propose a staging method based on the notion that biomarkers of AD follow an invariable temporal sequence in accordance with the amyloid cascade hypothesis [2, 3]. In Stage 1, individuals show biomarker evidence of cerebral amyloid accumulation. Stage 2 is characterized by amyloid positivity plus evidence of neuronal injury or neurodegeneration. Stage 3 involves these two criteria plus evidence of subtle cognitive decline. However, this temporal sequence has been called into question [4, 5], as studies have shown that biomarkers of neurodegeneration can occur before amyloidosis and many individuals who progress to AD demonstrate a pattern of biomarker abnormalities that fail to conform to the amyloid cascade hypothesis [6–13]. In addition, several studies have shown that cognitive decline, reflected by sensitive episodic memory measures, is at least as sensitive as, and sometimes superior to, cerebrospinal fluid (CSF) and imaging biomarkers in predicting the development of AD [14–17]. Our studies in mild cognitive impairment (MCI) have shown significant heterogeneity in cognitive profiles associated with early stages of AD beyond the typical “amnestic” profile [18–22]. Thus, it is plausible that there are different neurobiological pathways to AD [23].
Previous studies have demonstrated the imprecision of the conventional MCI diagnosis, including its instability over time (e.g., high rates of reversion to cognitive normalcy) [24–26] and a high rate of false positive diagnostic errors [20–22]. Such imprecision in diagnosis will likely become even more pronounced as studies attempt to identify “subtle cognitive decline,” which according to the NIA-AA criteria [1] “may include slightly abnormal performance on sensitive cognitive measures, self-complaint of memory decline, or subtle neurobehavioral changes.” We aimed to operationalize subtle cognitive decline within the same conceptual framework we have previously used to define MCI and to examine associated CSF biomarker abnormalities within the Alzheimer’s Disease Neuroimaging Initiative (ADNI) cohort.
METHODS
Data were obtained from the ADNI database (http://adni.loni.usc.edu). ADNI was launched in 2003 by the National Institute on Aging, National Institute of Biomedical Imaging and Bioengineering, Food and Drug Administration, private pharmaceutical companies, and non-profit organizations. The primary goal of ADNI is to test whether neuroimaging, other biological markers, and clinical and neuropsychological assessment can be combined to measure the progression of MCI and early AD. ADNI is the result of efforts of many co-investigators from a range of academic institutions and private corporations. This study was approved by an ethical standards committee on human experimentation at each institution. Written informed consent was obtained from all participants or authorized representatives participating in the study. For more information, including criteria for eligibility, see http://www.adni-info.org.
Participants
Participants were 570 cognitively normal ADNI participants drawn from the pool of 1,381 non-demented participants who completed a baseline neuropsychological evaluation. We included non-demented participants who were determined to be “cognitively normal” based on an actuarial neuropsychological method put forward by Jak and Bondi [22, 27] as applied to participants’ baseline neuropsychological data. Six neuropsychological scores were examined; two measures of language: Animal Fluency (total score) and 30-item Boston Naming Test (total score); two scores from a measure of attention/executive function: Trail Making Test, Parts A & B (time to completion); and two scores from a measure of memory: Rey Auditory Verbal Learning Test (AVLT) 30-minute delayed free recall and AVLT recognition. Non-demented participants were diagnosed with MCI and therefore excluded from the study sample if any of the following three criteria were met: (1) they had an impaired score, defined as >1 standard deviation (SD) below the age-corrected normative mean, on two measures within at least one cognitive domain (i.e., memory, language, or attention/executive function), (2) they had an impaired score, defined as >1 SD below the age-corrected normative mean, in each of the three cognitive domains sampled, or (3) they had a score on the Functional Assessment Questionnaire (FAQ) ≥9 indicating dependence in three or more daily activities [22, 27]. This actuarial definition of MCI does not rely on clinical judgment or include subjective cognitive complaints as a criterion for MCI. Four-hundred-one of the 1,381 individuals (29.0%) met the above MCI criteria and were removed from further study. Of the 980 participants who were considered cognitively normal, 570 (58.2%) had undergone lumbar puncture and had at least one year of follow-up data available (range 12–96 months), and were thus included in our sample; the remaining 410 were excluded. The included 570 participants were younger (t(978) = 3.1, p = 0.002, η p 2 = 0.01) and performed better on the Trail Making Test, Part A (t(761.4) = 3.2, p = 0.001, η p 2 = 0.01) relative to the 410 excluded participants; there were no other differences in demographics or performance on neuropsychological testing.
Materials
The same six neuropsychological scores (described above) used to diagnose MCI were also used to classify whether participants demonstrated evidence of “subtle cognitive decline.” CSF measures included concentrations of amyloid-β (Aβ 1 - 42), tau, and hyperphosphorylated tau (p-tau181p). Apolipoprotein E (APOE) genotype was available for all participants.
Procedure
Each neuropsychological score was converted to a standard score using published normative data. Age-adjusted norms from the Mayo Older Americans Normative Study [28] were applied to Rey AVLT scores. Age-adjusted norms from the National Alzheimer’s Coordinating Center [29, 30] were applied to the remaining neuropsychological measures. To operationalize the NIA-AA criterion of subtle cognitive decline, cognitively normal participants were considered to have subtle cognitive or functional decline if (1) they had impaired scores, defined as >1 SD below the age-corrected normative mean, on two of the six neuropsychological measures in different cognitive domains, or (2) they had an FAQ score of 6–8 (indicating some dependence in daily activities). These criteria were selected because they are based on the same conceptual framework we have used to define MCI, capturing both the breadth and depth of cognitive impairments (see Fig. 1). The criteria are designed to balance sensitivity (impairment defined as below −1 SD as opposed to −1.5 or −2 SDs) and reliability (two impaired scores required as opposed to a single impaired score) [27, 22]. Specifically, we required two tests to fall below 1 SD, rather than just one test, given the high base rates of an isolated low score in neurologically normal older adults [31, 32]. For example, Brooks and colleagues [31] found that 55.5% of healthy older adults had at least one memory score 1 SD below the mean, and Palmer and colleagues [32] found 73% of healthy older adults showed at least one borderline score while 37% demonstrated at least one impaired score. Further, we required that the two low scores be within different cognitive domains for a classification of subtle cognitive decline, rather than in the same domain, as an individual with two impaired scores in the same domain would meet our criteria for MCI (see Fig. 1). This distinction is based on research showing that >20% of healthy older adults obtain one impaired score in two different cognitive domains, but far fewer (<5%) earn two or more impaired scores within the same cognitive domain [32]. The criteria for subtle cognitive decline that we propose are likely to provide a relatively conservative estimate of subtle cognitive decline, as some individuals may have experienced a decline in their cognitive abilities but are nonetheless still performing in the normal range on neuropsychological testing. However, by requiring performance to be in the “impaired” range, the criteria can be more reliably and consistently applied.
Per cut-offs specified in Shaw et al. [33], the presence of cerebral amyloid accumulation (Stage 1 of preclinical AD based on the NIA-AA criteria [1]) was determined by an abnormally low Aβ 1 - 42 level, while neurodegeneration (Stage 2) was determined by abnormally high levels of tau or p-tau181p. Specific cut-off values were as follows: 192 pg/ml for Aβ 1 - 42, 93 pg/ml for tau, and 23 pg/ml for p-tau181p.
After characterizing the 570 participants with regard to subtle cognitive decline, amyloidosis, and neurodegeneration, we then applied two classification procedures. The first was based on the NIA-AA criteria [1], and the second involved simply a tally of the number of abnormal biomarkers (i.e., amyloidosis, neurodegeneration) or cognitive markers (i.e., subtle cognitive decline) associated with preclinical AD that each individual possessed without regard for the temporal order of occurrence.
Statistical analyses
Differences between groups were examined separately for each classification method using a series of ANOVAs with post-hoc t-tests, and chi-squares. Bonferroni correction was used to adjust for multiple comparisons. Hazard curves were used to explore rates of progression to MCI/AD.
RESULTS
At baseline, 48.9% of the sample (n = 279) was positive for amyloidosis, 63.3% (n = 361) for neurodegeneration, and 13.3% (n = 76) for subtle cognitive decline. There was no difference in age, education, or gender between individuals who demonstrated subtle cognitive decline and those who did not (all p-values >0.05). Of the 76 participants who demonstrated subtle cognitive decline, 65 had impaired scores on two of the six neuropsychological measures in different cognitive domains (criterion 1 of our operational definition), and 11 had an FAQ score between 6–8 but no impairment on neuropsychological testing (indicating functional decline; criterion 2 of our operational definition). Comparison of those who met criteria for subtle cognitive decline based on cognitive performance versus functional performance showed no significant differences in age, education, gender, amyloid positivity, neurodegeneration, APOE status, or rates of progression to AD or MCI (all p-values >0.05).
Forty-four of the 570 participants (7.7%) progressed to dementia at a subsequent follow-up visit (mean time of diagnosis = 31.4 months, SD = 23.1). Of these,43 met the National Institute of Neurological and Communicative Disorders and Stroke and the Alzheimer’s Disease and Related Disorders Association (NINCDS/ADRDA) criteria for AD. The remaining participant was diagnosed with progressive supranuclear palsy and was therefore excluded from the progression analyses. One-hundred-thirty four additional participants (23.5%) progressed to a diagnosis of MCI (mean time of diagnosis = 18.5 months, SD = 21.3) based on the actuarial neuropsychological criteria.
Preclinical AD stages based on the NIA-AA criteria [1]
As shown in Table 1, 24.9% (n = 142) of the sample did not meet criteria for preclinical AD (Stage 0), 8.4% (n = 48) showed evidence of amyloidosis based on low CSF Aβ 1 - 42 (Stage 1), 30.4% (n = 173) showed amyloidosis and neurodegeneration based on high CSF tau or p-tau181p (Stage 2), and 8.8% (n = 50) showed abnormalities on all three markers (i.e., amyloidosis, neurodegeneration, and subtle cognitive decline; Stage 3). An additional 24.2% (n = 138) of the sample showed normal amyloid levels but abnormal levels on biomarkers of neurodegeneration (with or without subtle cognitive decline). This group has been referred to by Jack and others [9, 34, 35] as “suspected non-AD pathophysiology” (SNAP). The remaining 3.3% (n = 19) were considered “Unclassified” [8] as they showed subtle cognitive decline but no evidence of neurodegeneration (with or withoutamyloidosis).
A Genotype (APOE-ɛ4 versus non-ɛ4)×Group chi-square analysis showed significant differences in the presence of the APOE-ɛ4 allele. Frequency of APOE-ɛ4 carriers was similar for the Stage 0 and SNAP groups (13–19%), similar for the Stage 1 and Unclassified groups (37–38%), and significantly higher for the Stage 2 and 3 groups (55–72%); see Table 1. Total score on the FAQ did not differ between the Stage 3 and Unclassified groups, but both had significantly higher total scores than all other groups, which did not differ from one another; see Table 1. Longitudinal data showed that the Stage 0 group had a longer period of follow-up on average (39 months) than the Stage 2 and SNAP groups (29–30 months), but there were no other significant differences in length of follow-up. Outcome (progression versus no progression)×Group chi-square analyses revealed significant differences in prevalence of progression to MCI/AD (χ 2(5) = 92.6, p < 0.001, φ c = 0.40) and to AD (χ 2(5) = 61.9, p < 0.001, φ c = 0.33). Progression rates to MCI/AD were similar for the Stage 0, Stage 1, and SNAP groups (17–22%); moderately higher for the Stage 2 (37% ; p < 0.01, φ c = 0.17 to 0.21) and Unclassified groups (44% ; p < 0.05, φ c = 0.17 to 0.29); and higher still for the Stage 3 group (84% ; p≤0.001, φ c = 0.39 to 0.67); see Figs. 2a and 3a. For only those who progressed to a diagnosis of AD (n = 43), progression rates were similar for the Stage 0, Stage 1, SNAP, and Unclassified groups (2–6%); somewhat higher for the Stage 2 group (9% ; p < 0.05 for Stage 2 versus Stage 0 and SNAP, φ c = 0.13 to 0.15); and higher still for the Stage 3 group (34% ; p < 0.001 for all comparisons except p < 0.05 for Stage 3 versus Unclassified, φ c = 0.28 to 0.46); see Fig. 2a.
Preclinical AD stages based on number of abnormal biomarkers
As shown in Table 2, 24.9% (n = 142) of the sample had no abnormal biomarkers or cognitive markers, while 8.8% (n = 50) showed abnormalities on all three markers at baseline; these groups are identical to Stages 0 and 3 using the NIA-AA criteria [1] described above. One-hundred-ninety participants (33.3%) had only one abnormal marker: 48 with amyloidosis, 131 with neurodegeneration, and 11 with subtle cognitive decline. Finally, 33.0% (n = 188) had two abnormal markers: 173 with amyloidosis and neurodegeneration, 8 with amyloidosis and subtle cognitive decline, and 7 with neurodegeneration and subtle cognitive decline.
A Genotype (APOE-ɛ4 versus non-ɛ4)×Group chi-square analysis showed significant differences in the presence of the APOE-ɛ4 allele. The prevalence of APOE-ɛ4 carriers increased significantly with greater number of abnormal markers; see Table 2. Total score on the FAQ for the group with three abnormal markers was significantly higher than for all other groups, which did not differ from one another; see Table 2. Longitudinal data showed that the group demonstrating no abnormal markers had the longest period of follow-up on average (39 months), but there were no significant differences in length of follow-up for the other groups (29–30 months). Of the 177 participants who progressed to MCI/AD, 14.1% (n = 25) had no abnormal markers at baseline, 20.9% (n = 37) had one abnormal marker (8 with amyloidosis, 24 with neurodegeneration, 5 with subtle cognitive decline), 41.2% (n = 73) had two abnormal markers (64 with amyloidosis and neurodegeneration, 3 with amyloidosis and subtle cognitive decline, and 6 with neurodegeneration and subtle cognitive decline), and 23.7% (n = 42) had three abnormal markers. Outcome (progression versus no progression)×Group chi-square analyses revealed significant differences in prevalence of progression to MCI/AD (χ 2(3) = 94.8, p < 0.001, φ c = 0.41) and to AD (χ 2(3) = 59.3, p < 0.001, φ c = 0.32). Possessing one abnormal marker did not significantly increase risk for progression to MCI/AD relative to having zero (20% versus 18% , respectively), but having two abnormal markers increased risk (39% ; p < 0.001, φ c = 0.22 to 0.24), and having three increased risk even further (84% ; p < 0.001, φ c = 0.36 to 0.61); see Figs. 2b and 3b. When examining only those who progressed to a diagnosis of AD (n = 43), a similar pattern was seen, as having one abnormal marker did not significantly increase risk for progression to AD relative to having zero (3% for both), but having two abnormal markers was associated with a moderately increased risk (9% ; p < 0.05, φ c = 0.12 to 0.13), and having three abnormal markers increased risk even further (34% ; p < 0.001, φ c = 0.29 to 0.44); see Fig. 2b.
DISCUSSION
Using a novel operational definition of “subtle cognitive decline” that examined the performance of individual neuropsychological test scores and captured both cognitive and functional decline, we classified cognitively normal participants based on the NIA-AA criteria [1] and separately based on the number of abnormal biomarkers or cognitive markers that each individual possessed. Using the NIA-AA criteria [1], we found that Stage 2 (amyloidosis plus neurodegeneration) and SNAP (neurodegeneration with normal amyloid levels) were the most common stages in individuals who showed evidence of preclinical AD. When we used the number of biomarkers or cognitive markers without regard for their temporal order, we found that neurodegeneration alone was 2.5 times more common than amyloidosis alone at baseline. For those who demonstrated only one abnormal marker at baseline and later progressed to MCI/AD (n = 37), it was most common to have neurodegeneration alone (n = 24), and nearly equally common to have amyloidosis alone or subtle cognitive decline alone (n = 8 versus 5) as the first sign of prodromal AD. These findings suggest that most individuals did not follow the temporal order proposed by the amyloid cascade hypothesis, which is that amyloid biomarkers become abnormal first, followed by biomarkers of neurodegeneration, and then clinical symptoms [2, 3]. Our results are consistent with research showing that biomarkers of neurodegeneration can occur before amyloidosis [10], as well as findings that individuals with subtle cognitive decline but normal neurodegeneration biomarkers (i.e., the Unclassified group) have a relatively high rate of progression to AD [36]. By presuming that all patients follow a singular invariant expression of the disease, we may be failing to identify individuals with differing initial presentations who nevertheless will progress to AD. It should be noted that the NIA-AA diagnostic criteria for AD [37] and MCI [38] are agnostic with respect to the temporal order of biomarker changes. Evidence of amyloidosis or neural injury increases diagnostic confidence to an “intermediate” likelihood, and having both increases it to a “high” likelihood that the diagnosis of dementia or MCI is due to AD. Our method of staging preclinical AD based on the number of abnormal markers, irrespective of their order of appearance, similarly demonstrated increasing likelihood of progression.
A comparison of our findings to other studies [34–36] aimed at examining the NIA-AA criteria [1] for preclinical AD are shown in Fig. 4. Our study found relatively high rates of amyloid positivity (48.9%) and neurodegeneration (63.3%), which is reflected in the higher percentage of participants in Stage 2 and Stage 3 compared to previous studies. This discrepancy is purely the result of the way in which we defined “cognitively normal” versus “MCI.” Rather than using the diagnoses assigned by ADNI, which has been shown to produce a high rate of false positive diagnostic errors (i.e., roughly one-third of those diagnosed with MCI by ADNI actually perform normally on more extensive cognitive testing and have normal CSF biomarker levels) [21, 22], we used actuarial neuropsychological criteria [22, 27] to determine cognitively normal versus MCI classifications. Of the 570 deemed cognitively normal by the actuarial criteria and included in the current study, only 250 were also classified as normal by ADNI while the remaining 320 were diagnosed with MCI by ADNI (based on subjective memory complaints, a Clinical Dementia Rating Scale score of 0.5, and low performance on a single memory test) [39]. If our analyses are conducted only on the 250 individuals classified as cognitively normal by ADNI, the percentage of participants in each preclinical AD classification stage based on NIA-AA criteria [1] is comparable to previous studies. In particular, our results are quite similar to the Toledo et al. [36] study, which also used an ADNI sample (Stage 0 : 29% versus 32% ; Stage 1 : 13% versus 15% ; Stage 2 : 25% versus 22% ; Stage 3 : 2% versus 3% ; SNAP: 30% versus 23% ; Unclassified: 2% versus 5% in the current study versus the Toledo et al. [36] study, respectively). However, the main findings of our study remain the same in this smaller sample of 250. Specifically, of the 2% (n = 5) who progressed to dementia at follow-up, three of these five individuals had one abnormal biomarker at baseline: one with amyloidosis and two with neurodegeneration. In addition, two of the five individuals were in the SNAP category at baseline based on NIA-AA criteria [1]. Thus, the majority did not show amyloid biomarker abnormalities as the firstsign of AD.
Although our findings do not abide by the amyloid cascade model [2, 3], they do concur with the theoretical notions of Braak and colleagues [4], who have proposed an alternative model to the amyloid cascade hypothesis. They propose that detectable AD pathologic markers (CSF Aβ and tau pathology, neuronal loss, cognitive symptoms) all representlate-appearing and relatively simultaneous changes in the AD pathophysiologic cascade, which appear in a very narrow time sequence. The perceived differences in the sequence of biomarker abnormalities may be more a reflection of the varying sensitivity of the biomarkers or of our ability to detect change than to the timing of these neurobiological changes. The fact that subtle cognitive decline has traditionally been viewed as the last marker to be affected in preclinical AD may be due to the routine use of crude, insensitive measures of cognitive abilities (i.e., rating scales or screening measures) or variations in the way subtle cognitive decline is defined. By contrast, sensitive memory measures (e.g., Rey Auditory Verbal Learning Test) have been shown to be the earliest markers to become abnormal in the progression to AD relative to screening measures, rating scales, and biomarkers [14], and are more robust predictors of conversion from MCI to AD than most biomarkers [15, 16].
Our novel method of staging preclinical AD is at least as predictive of progression to MCI/AD as the stages proposed by the NIA-AA criteria [1]. This approach that simply tallies the number of abnormal markers provides a more parsimonious method of characterizing preclinical AD, since the staging system described by others [9, 34, 35] results in ambiguous “SNAP” and “Unclassified” categories. In the current study, the SNAP group was similar to Stages 0 or 1 with regard to APOE-ɛ4 frequency, FAQ total scores, and progression rates, while the Unclassified group was similar to Stages 1 or 2 with regard to APOE-ɛ4 frequency and progression rates and similar to Stage 3 with regard to FAQ total scores. It is not clear if there is anything to be gained by creating these separate SNAP and Unclassified groups, particularly given that SNAP (i.e., suspected non-AD pathophysiology) itself has been shown to be a misnomer by research demonstrating that both amyloid-first and neurodegeneration-first biomarker profile pathways to preclinical AD exist [10].
One might argue that biological markers offer a more specific marker of AD pathophysiology than cognitive decline, which could be due to a number of other non-AD pathologies, and that elevating the notion of subtle cognitive decline to be on par with the highly specific amyloid pathology may ultimately decrease specificity of the AD diagnosis. In the current study, nearly all (43/44) of the participants who progressed to dementia met NINCDS/ADRDA criteria for a diagnosis of AD. Nonetheless, an individual who demonstrates the biomarkers and cognitive markers examined in this study may also show non-AD pathology and could go on to develop a mixed dementia syndrome. Indeed, the notion of “pure” AD pathology is increasingly thought to be far more rare than multiple underlying neuropathologies (e.g., AD, cerebrovascular disease, Lewy bodies, hippocampal sclerosis, TDP-43) [40–42] for the vast majority of late-onset AD. Thus, a combination of biomarkers and sensitive neuropsychological tests that detect these various underlying pathologies is an improvement on any individual biomarker and can substantially improve prediction of dementia risk [17].
A strength of the present study was the use of individual test scores and actuarial neuropsychological criteria to operationalize subtle cognitive decline within the same conceptual framework we have previously used to define MCI [27]. This method of defining subtle cognitive decline may improve diagnostic consistency and reliability compared to the use of “self-complaint of memory decline or subtle neurobehavioral changes,” [1] which has been shown to cloud rather than clarify diagnosis [43], or the use of composite scores [9, 34, 35] in which sensitive and insensitive test performances are averaged together, with the result that the composite score’s sensitivity to subtle cognitive decline is likely reduced. A direction for future research will be to examine individual neuropsychological markers of subtle cognitive decline against different methods of constructing composite scores (e.g., principle components analysis, item response theory) [44] to determine which method most reliably predicts progression. In addition, future studies are needed to explore the impact of using different normative reference methods (e.g., education-based norms) to define subtle cognitive decline.
One limitation of our criteria for subtle cognitive decline is that they may be too strict to capture all individuals with very early cognitive changes (i.e., those who have declined cognitively but are still performing in the normal range on neuropsychological testing or those who show only one impaired score). On the other hand, it is possible that false positive errors could result from applying our actuarial criteria for subtle cognitive decline to populations where individuals deviate from the demographic characteristics of ADNI (e.g., low education or premorbid abilities). Despite this potential risk, our previous work has demonstrated that using our actuarial criteria for MCI actually substantially reduces false positive diagnostic errors compared to conventional criteria that rely on subjective complaints, rating scales, and a single memory test [20, 22]. Another limitation of the current study is that ADNI participants undergo only a relatively brief battery of neuropsychological tests. A more extensive neuropsychological evaluation would enhance our ability to detect and more fully characterize subtle cognitive decline, provided that we are mindful of the possible increase in base rates of low scores with increasing numbers of tests [45, 46] and the resulting potential for misclassification [31]. By clearly defining “subtle cognitive decline” via sensitive and reliable neuropsychological test scores, and by re-exploring timelines of biomarker and cognitive changes, we hope to improve diagnostic precision of preclinical AD and sharpen our ability to identify early signs associated with different neurobiological pathways to the diagnosis of AD.
ACKNOWLEDGMENTS
This study was supported by National Institutes of Health grants R01 AG012674 (MWB), K24 AG026431 (MWB), and P50 AG05131 (DRG).
Authors’ disclosures available online (http://j-alz.com/manuscript-disclosures/15-0128r1).
Data collection and sharing for this project was funded by the Alzheimer’s Disease Neuroimaging Initiative (ADNI) (National Institutes of Health Grant U01 AG024904) and DOD ADNI (Department of Defense award number W81XWH-12-2-0012). ADNI is funded by the National Institute on Aging, the National Institute of Biomedical Imaging and Bioengineering, and through generous contributions from the following: Alzheimer’s Association; Alzheimer’s Drug Discovery Foundation; BioClinica, Inc.; Biogen Idec Inc.; Bristol-Myers Squibb Company; Eisai Inc.; Elan Pharmaceuticals, Inc.; Eli Lilly and Company; F. Hoffmann-La Roche Ltd and its affiliated company Genentech, Inc.; GE Healthcare; Innogenetics, N.V.; IXICO Ltd.; Janssen Alzheimer Immunotherapy Research & Development, LLC.; Johnson & Johnson Pharmaceutical Research & Development LLC.; Medpace, Inc.; Merck & Co., Inc.; Meso Scale Diagnostics, LLC.; NeuroRx Research; Novartis Pharmaceuticals Corporation; Pfizer Inc.; Piramal Imaging; Servier; Synarc Inc.; and Takeda Pharmaceutical Company. The Canadian Institutes of Health Research is providing funds to support ADNI clinical sites in Canada. Private sector contributions are facilitated by the Foundation for the National Institutes of Health (http://www.fnih.org). The grantee organization is the Northern California Institute for Research and Education, and the study is coordinated by the Alzheimer’s Disease Cooperative Study at the University of California, San Diego. ADNI data are disseminated by the Laboratory for Neuro Imaging at the University of Southern California.
References
1 | Sperling RA, Aisen PS, Beckett LA, Bennett DA, Craft S, Fagan AM, Iwatsubo T, Jack CRJr, Kaye J, Montine TJ, Park DC, Reiman EM, Rowe CC, Siemers E, Stern Y, Yaffe K, Carrillo MC, Thies B, Morrison-Bogorad M, Wagster MV, Phelps CH(2011) Toward defining the preclinical stages of Alzheimer’s disease: Recommendations from the National Institute on Aging-Alzheimer’s Association workgroups on diagnostic guidelines for Alzheimer’s diseaseAlzheimers Dement7: 280292 |
2 | Jack CRJr, Knopman DS, Jagust WJ, Shaw LM, Aisen PS, Weiner MW, Petersen RC, Trojanowski JQ(2010) Hypothetical model of dynamic biomarkers of the Alzheimer’s pathological cascadeLancet Neurol9: 119128 |
3 | Jack CRJr, Knopman DS, Jagust WJ, Petersen RC, Weiner MW, Aisen PS, Shaw LM, Vemuri P, Wiste HJ, Weigand SD, Lesnick TG, Pankratz VS, Donohue MC, Trojanowski JQ(2013) Tracking pathophysiological processes in Alzheimer’s disease: An updated hypothetical model of dynamic biomarkersLancet Neurol12: 207216 |
4 | Braak H, Zetterberg H, Del Tredici K, Blennow K(2013) Intraneuronal tau aggregation precedes diffuse plaque deposition, but amyloid-β changes occur before increases of tau in cerebrospinal fluidActa Neuropathol126: 631641 |
5 | Drachman DA(2014) The amyloid hypothesis, time to move on: Amyloid is the downstream result, not cause, of Alzheimer’s diseaseAlzheimers Dement10: 372380 |
6 | Braak H, Thal DR, Ghebremedhin EDel, Tredici(2011) Stages of the pathologic process in Alzheimer disease: Age categories from 1 to 100 yearsJ Neruopathol Exp Neurol70: 960969 |
7 | Sheline YI, Morris JC, Snyder AZ, Price JL, Yan Z, D’Angelo G, Liu C, Dixit S, Benzinger T, Fagan A, Goate A, Mintun MA(2010) APOE4 allele disrupts resting state fMRI connectivity in the absence of amyloid plaques or decreased CSF Aβ42J Neurosci30: 1703517040 |
8 | Wirth M, Madison CM, Rabinovici GD, Oh H, Landau SM, Jagust WJ(2013) Alzheimer’s disease neurodegenerative biomarkers are associated with decreased cognitive function but not β-Amyloid in cognitively normal older individualsJ Neurosci33: 55535563 |
9 | Jack CRJr, Knopman DS, Weigand SD, Wiste HJ, Vemuri P, Lowe V, Kantarci K, Gunter JL, Senjem ML, Ivnik RJ, Roberts RO, Rocca WA, Boeve BF, Petersen RC(2012) An operational approach to National Institute on Aging-Alzheimer’s Association criteria for preclinical Alzheimer diseaseAnn Neurol71: 765775 |
10 | Jack CRJr, Wiste HJ, Weigand SD, Knopman DS, Lowe V, Vemuri P, Mielke MM, Jones DT, Senjem ML, Gunter JL, Gregg BE, Pankratz VS, Petersen RC(2013) Amyloid-first and neurodegeneration-first profiles characterize incident amyloid PET positivityNeurology81: 17321740 |
11 | Knopman DS, Jack CR, Wiste JH, Weigand SD, Vemuri P, Lowe VJ, Kantarci K, Gunter JL, Senjem ML, Mielke MM, Roberts RO, Boeve BF, Petersen RC(2013) Brain injury biomarkers are not dependent on β-amyloid in normal elderlyAnn Neurol73: 472480 |
12 | Nettiksimmons J, DeCarli C, Landau S, Beckett L(2014) Biological heterogeneity in ADNI amnestic mild cognitive impairmentAlzheimers Dement10: 511521 |
13 | Da X, Toledo JB, Zee J, Wolk DA, Xie SX, Ou Y, Shacklett A, Parmpi P, Shaw L, Trojanowski JQ, Davatzikos C(2013) Integration and relative value of biomarkers for prediction of MCI to AD progression: Spatial patterns of brain atrophy, cognitive scores, APOE genotype and CSF biomarkersNeuroImage Clin28: 164173 |
14 | Jedynak BM, Lang A, Liu B, Katz E, Zhang Y, Wyman BT, Rauig D, Jedynak CP, Caffo B, Prince JL(2012) A computational neurodegenerative disease progression score: Method and results with the Alzheimer’s disease neuroimaging initiative cohortNeuroimage63: 14781486 |
15 | Gomar JJ, Bobes-Bascaran MT, Conejero-Goldberg C, Davies P, Goldberg TE(2011) Utility of combinations of biomarkers, cognitive markers, and risk factors to predict conversion from mild cognitive impairment to Alzheimer disease in patients in the Alzheimer’s disease neuroimaging initiativeArch Gen Psychiatry68: 961969 |
16 | Richard E, Schmand BA, Eikelenboom P, Van Gool WA(2013) MRI and cerebrospinal fluid biomarkers for prediction progression to Alzheimer’s disease in patients with mild cognitive impairment: A diagnostic accuracy studyBMJ Open3: e002541 |
17 | Heister D, Brewer JB, Magda S, Blennow K, McEvoy LK(2011) Predicting MCI outcome with clinically available MRI and CSF biomarkersNeurology77: 16191628 |
18 | Delano-Wood L, Bondi MW, Sacco J, Abeles N, Jak AJ, Libon DJ, Bozoki A(2009) Heterogeneity in mild cognitive impairment: Differences in neuropsychological profile and associated white matter lesion pathologyJ Int Neuropsychol Soc15: 906914 |
19 | Libon DJ, Xie SX, Eppig J, Wicas G, Lamar M, Lippa C, Bettcher BM, Price CC, Giovannetti T, Swenson R, Wambach DM(2010) The heterogeneity of mild cognitive impairment: A neuropsychological analysisJ Int Neuropsychol Soc16: 8493 |
20 | Clark LR, Delano-Wood L, Libon DJ, McDonald CR, Nation DA, Bangen KJ, Jak AJ, Au R, Salmon DP, Bondi MW(2013) Are empirically derived subtypes of mild cognitive impairment consistent with conventional subtypes?J Int Neuropsychol Soc19: 635645 |
21 | Edmonds EC, Delano-Wood L, Clark LR, Jak AJ, Nation DA, McDonald CR, Libon DJ, Au R, Galasko DP, Bondi MW(2015) Susceptibility of the conventional criteria for mild cognitive impairment to false positive diagnostic errorsAlzheimers Dement11: 415424 |
22 | Bondi MW, Edmonds EC, Jak AJ, Clark LR, Delano-Wood L, McDonald CR, Nation DA, Libon DJ, Au R, Galasko D, Salmon DP(2014) Neuropsychological criteria for mild cognitive impairment improves diagnostic precision, biomarker associations, and prediction of progressionJ Alzheimers Dis42: 275289 |
23 | Murray ME, Graff-Radford NR, Ross OA, Petersen RC, Duara R, Dickson DW(2011) Neuropathologically defined subtypes ofAlzheimer’s disease with distinct clinical characteristics: Aretrospective studyLancet Neurol10: 785796 |
24 | Ganguli M, Snitz BE, Saxton JA, Chang CC, Lee CW, Vander Bilt J, Hughes TF, Loewenstein DA, Unverzagt FW, Petersen RC(2011) Outcomes of mild cognitive impairment by definition: A population studyArch Neurol68: 761767 |
25 | Koepsell TD, Monsell SE(2012) Reversion from mild cognitive impairment to normal or near-normal cognitionNeurology79: 15911598 |
26 | Summers MJ, Saunders NL(2012) Neuropsychological measures predict decline to Alzheimer’s dementia from mild cognitive impairmentNeuropsychology26: 498508 |
27 | Jak AJ, Bondi MW, Delano-Wood L, Wierenga C, Corey-Bloom J, Salmon DP, Delis DC(2009) Quantification of five neuropsychological approaches to defining mild cognitive impairmentAm J Geriatr Psychiatry17: 368375 |
28 | Ivnik RJ, Malec JF, Smith GE, Tangalos EG, Petersen RC, Kokmen E, Kurland LT(1992) Mayo’s older Americans normative studies: Updated AVLT norms for ages 56 to 97Clin Neuropsychol6: 83104 |
29 | Shirk SD, Mitchell MB, Shaughnessy LW, Sherman JC, Locascio JJ, Weintraub S, Atri A(2011) A web-based normative calculator for the uniform data set (UDS) neuropsychological test batteryAlzheimers Res Ther3: 32 |
30 | Weintraub S, Salmon D, Mercaldo N, Ferris S, Graff-Radford NR, Chui H, Cummings J, DeCarli C, Foster NL, Galasko D, Peskind E, Dietrich W, Beekly DL, Kukull WA, Morris JC(2009) The Alzheimer’s disease centers’ uniform data set (UDS): The neuropsychologic test batteryAlzheimer Dis Assoc Disord23: 91101 |
31 | Brooks BL, Iverson GL, White T(2007) Substantial risk of “accidental MCI” in healthy older adults: Base rates of low memory scores in neuropsychological assessmentJ Int Neuropsychol Soc13: 490500 |
32 | Palmer BW, Boone KB, Lesser IM, Wohl MA(1998) Base rates of “impaired” neuropsychological test performance among healthy older adultsArch Clin Neuropsychol13: 503511 |
33 | Shaw LM, Vanderstichele H, Knapik-Czajka M, Clark CM, Aisen PS, Petersen RC, Blennow K, Soares H, Simon A, Lewczuk P, Dean R, Siemers E, Potter W, Lee VM, Trojanowski JQ(2009) Cerebrospinal fluid biomarker signature in Alzheimer’s disease neuroimaging initiative subjectsAnn Neurol65: 403413 |
34 | Knopman DS, Jack CR, Wiste HJ(2012) Short-term clinical outcomes for stages of NIA-AA preclinical Alzheimer diseaseNeurology78: 15761582 |
35 | Vos SJ, Xiong C, Visser PJ, Jasielec MS, Hassenstab J, Grant EA, Cairns NJ, Morris JC, Holtzman DM, Fagan AM(2013) Preclinical Alzheimer’s disease and its outcome: A longitudinal cohort studyLancet Neurol12: 957965 |
36 | Toledo JB, Weiner MW, Wolk DA, Da X, Chen K, Arnold SE, Jagust W, Jack C, Reiman EM, Davatzikos C, Shaw LM, Trojanowski JQ(2014) Neuronal injury biomarkers and prognosis in ADNI subjects with normal cognitionActa Neuropathol Commun2: 26 |
37 | McKhann GM, Knopman DS, Chertkow H, Hyman BT, Jack CRJr, Kawas CH, Klunk CH, Koroshetz WJ, Manly JJ, Mayeux R, Mohs RC, Morris JC, Rossor MN, Scheltens P, Carrillo MC, Thies B, Weintraub S, Phelps CH(2011) The diagnosis of dementia due to Alzheimer’s disease: Recommendations from the National Institute on Aging-Alzheimer’s Association workgroups on diagnostic guidelines for Alzheimer’s diseaseAlzheimers Dement7: 263269 |
38 | Albert MS, DeKosky ST, Dickson D, Dubois B, Feldman HH, Fox NC, Gamst A, Holtzman DM, Jagust WJ, Petersen RC, Snyder PJ, Carrillo MC, Thies B, Phelps CH(2011) The diagnosis of mild cognitive impairment due to Alzheimer’s disease: Recommendations from the National Institute on Aging-Alzheimer’s Association workgroups on diagnostic guidelines for Alzheimer’s diseaseAlzheimers Dement7: 270279 |
39 | Petersen RC, Aisen PS, Beckett LA, Donohue MC, Gamst AC, HarveyDJ , Jack CRJr, Jagust WJ, Shaw LM, Toga AW, Trojanowski JQ, Weiner MW(2010) Alzheimer’s Disease Neuroimaging Initiative(ADNI): Clinical characterizationNeurology74: 201209 |
40 | Schneider JA, Arvanitakis Z, Leurgans SE, Bennett DA(2009) The neuropathology of probable Alzheimer disease and mild cognitive impairmentAnn Neurol66: 200208 |
41 | Zlokovic BV(2011) Neurovascular pathways to neurodegeneration in Alzheimer’s disease and other disordersNat Rev Neurosci12: 723738 |
42 | Wilson RS, Yu L, Trojanowski JQ, Chen EY, Boyle PA, Bennett DA, Schneider JA(2013) TDP-43 pathology, cognitive decline, and dementia in old ageJAMA Neurol70: 14181424 |
43 | Edmonds EC, Delano-Wood L, Galasko DR, Salmon DP, Bondi MW(2014) Subjective cognitive complaints contribute to misdiagnosis of mild cognitive impairmentJ Int Neuropsychol Soc20: 836847 |
44 | Kryscio RJ(2014) Secondary prevention trails in Alzheimer disease: The challenge of identifying a meaningful end pointJAMA Neurol71: 947949 |
45 | Schretlen DJ, Testa SM, Winicki JM, Pearlson GD, Gordon B(2008) Frequency and bases of abnormal performance by healthy adults on neuropsychological testingJ Int Neuropsychol Soc14: 436445 |
46 | Mistridis P, Egli SC, Iverson GL, Berres M, Wilmes K, Welsh-Bohmer KA, Monsch AU(2015) Considering the base rates of low performance in cognitively healthy older adults improves the accuracy to identify neurocognitive impairment with the Consortium to Establish a Registry for Alzheimer’s Disease-Neuropsychological Assessment Battery (CERAD-NAB)Eur Arch Psychiatry Clin Neurosci10.1007/s00406-014-0571-z |
Figures and Tables
Fig.1
Comparison of the actuarial neuropsychological criteria for mild cognitive impairment and subtle cognitive decline. The criteria are set up along a continuum and capture both the breadth and depth of cognitive impairments.
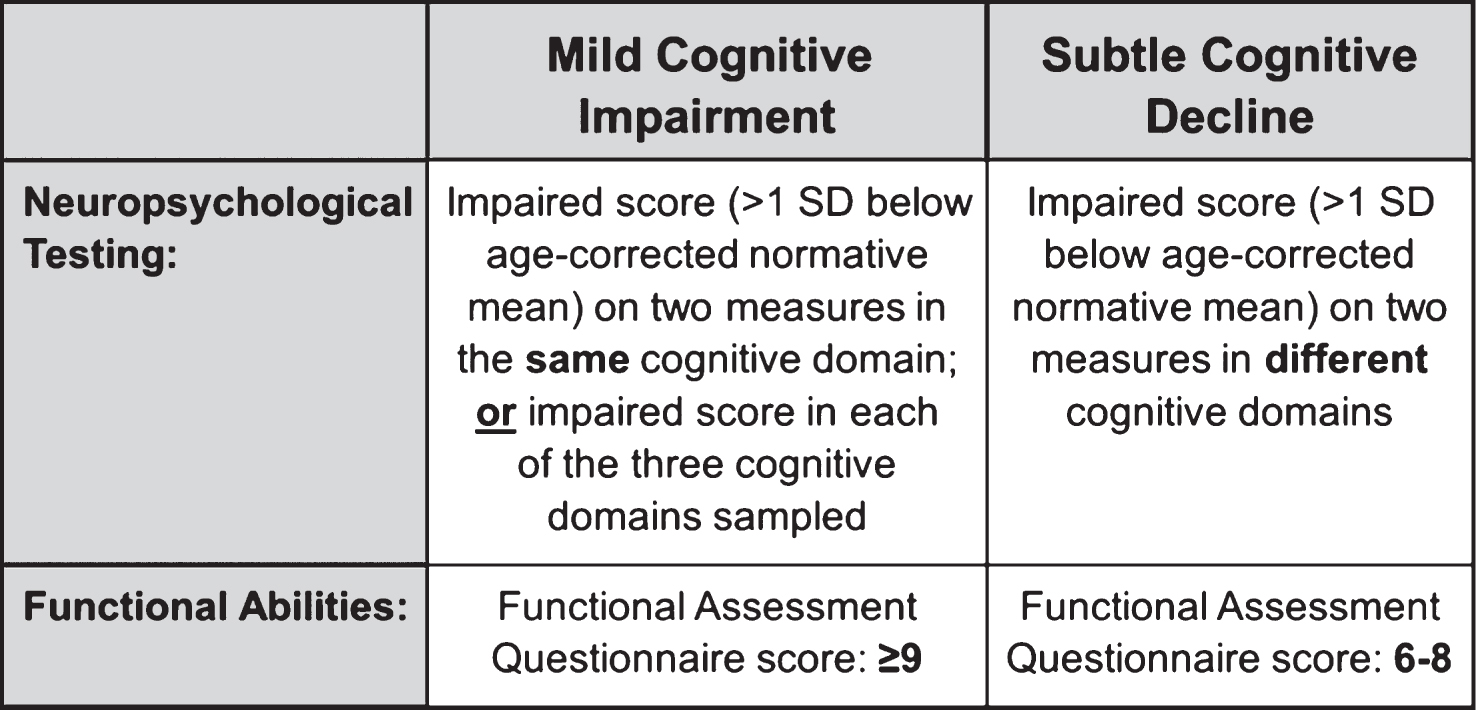
Fig.2
Rate of progression to MCI/AD and to AD for each group based on a) the NIA-AA criteria [1] and b) the number of abnormal biomarkers and cognitive markers for “preclinical” AD.
![Rate of progression to MCI/AD and to AD for each group based on a) the NIA-AA criteria [1] and b) the number of abnormal biomarkers and cognitive markers for “preclinical” AD.](https://content.iospress.com:443/media/jad/2015/47-1/jad-47-1-jad150128/jad-47-1-jad150128-g002.jpg)
Fig.3
Hazard functions showing risk of progression to MCI/AD across time for each group based on a) the NIA-AA criteria [1] and b) the number of abnormal biomarkers and cognitive markers for “preclinical” AD.
![Hazard functions showing risk of progression to MCI/AD across time for each group based on a) the NIA-AA criteria [1] and b) the number of abnormal biomarkers and cognitive markers for “preclinical” AD.](https://content.iospress.com:443/media/jad/2015/47-1/jad-47-1-jad150128/jad-47-1-jad150128-g003.jpg)
Fig.4
Percentage of participants in each preclinical AD classification stage based on NIA-AA criteria [1]; comparison of current study to previous studies.
![Percentage of participants in each preclinical AD classification stage based on NIA-AA criteria [1]; comparison of current study to previous studies.](https://content.iospress.com:443/media/jad/2015/47-1/jad-47-1-jad150128/jad-47-1-jad150128-g004.jpg)
Table 1
Baseline characteristics for each group based on the NIA-AA criteria [1]
| Stage 0 | Stage 1 | Stage 2 | Stage 3 | SNAP | Unclassified | F or X 2 | Sig. | Effect | |
| (n = 142) | (n = 48) | (n = 173) | (n = 50) | (n = 138) | (n = 19) | size | |||
| Demographics * | |||||||||
| Age (y) | 72.3 (6.8) | 71.8 (6.7) | 74.6 (6.9) | 74.3 (6.1) | 71.9 (7.7) | 71.5 (8.5) | F = 3.6 | p = 0.004 | η p 2 = 0.03 |
| Education (y) | 16.2 (2.6) | 16.1 (3.0) | 16.2 (2.5) | 16.3 (2.8) | 16.9 (2.5) | 16.7 (3.0) | F = 1.6 | p = 0.17 | η p 2 = 0.01 |
| Gender (% female) | 48.6% | 54.2% | 46.8% | 44.0% | 45.7% | 31.6% | X 2 = 3.2 | p = 0.67 | φ c = 0.08 |
| Neuropsychological (raw) * | |||||||||
| Animal Fluency | 20.3 (5.0) | 20.4 (5.3) | 20.2 (4.7) | 16.1 (3.9) | 20.9 (5.1) | 17.2 (5.8) | F = 8.6 | p < 0.001 | η p 2 = 0.07 |
| BNT | 28.0 (1.8) | 28.2 (1.7) | 27.8 (2.3) | 26.4 (2.6) | 28.1 (2.2) | 27.3 (2.4) | F = 5.5 | p < 0.001 | η p 2 = 0.05 |
| TMT, Part A (s) | 31.5 (9.4) | 31.6 (8.0) | 34.3 (10.0) | 43.8 (12.3) | 31.4 (9.4) | 42.2 (12.5) | F = 16.7 | p < 0.001 | η p 2 = 0.13 |
| TMT, Part B (s) | 77.5 (28.1) | 84.2 (40.9) | 91.6 (46.6) | 132.3 (61.1) | 72.7 (27.0) | 96.2 (27.2) | F = 19.6 | p < 0.001 | η p 2 = 0.15 |
| AVLT Recall | 7.8 (3.7) | 7.7 (3.5) | 5.9 (3.6) | 3.0 (2.9) | 7.4 (4.1) | 3.9 (2.3) | F = 18.6 | p < 0.001 | η p 2 = 0.14 |
| AVLT Recognition | 13.0 (2.2) | 13.4 (1.9) | 12.7 (2.2) | 11.7 (2.3) | 12.8 (1.9) | 11.6 (3.5) | F = 4.5 | p = 0.001 | η p 2 = 0.04 |
| Clinical characteristics | |||||||||
| APOE (% ɛ4 positive) † | 18 (12.7%) | 18 (37.5%) | 95 (54.9%) | 36 (72.0%) | 26 (18.8%) | 7 (36.8%) | X 2 = 106.2 | p < 0.001 | φ c = 0.43 |
| FAQ total score * | 0.53 (1.10) | 0.50 (1.13) | 0.84 (1.30) | 3.10 (2.87) | 0.48 (1.05) | 2.1 (2.71) | F = 30.1 | p < 0.001 | η p 2 = 0.21 |
| Preclinical AD criteria † | |||||||||
| % low Aβ 1 - 42 | 0 (0%) | 48 (100%) | 173 (100%) | 50 (100%) | 0 (0%) | 8 (42.1%) | |||
| % high tau/p-tau181p | 0 (0%) | 0 (0%) | 173 (100%) | 50 (100%) | 138 (100%) | 0 (0%) | |||
| % subtle cognitive decline | 0 (0%) | 0 (0%) | 0 (0%) | 50 (100%) | 7 (5.1%) | 19 (100%) |
BNT, Boston Naming Test; TMT, Trail Making Test; AVLT, Rey Auditory Verbal Learning Test; APOE, apolipoprotein E; FAQ, Functional Assessment Questionnaire; Aβ 1 - 42, amyloid-beta; p-tau181p, hyperphosphorylated tau. *Data are summarized as mean (standard deviation), unless otherwise indicated. †Data are summarized as raw number of participants (% of participants).
Table 2
Baseline characteristics for each group based on the number of abnormal biomarkers and cognitive markers for preclinical AD
| 0 markers | 1 marker | 2 markers | 3 markers | F or X2 | Sig. | Effect | |
| (n = 142) | (n = 190) | (n = 188) | (n = 50) | size | |||
| Demographics * | |||||||
| Age (y) | 72.3 (6.8) | 71.9 (7.4) | 74.4 (7.1) | 74.3 (6.1) | F = 5.2 | p = 0.001 |
|
| Education (y) | 16.2 (2.6) | 16.7 (2.6) | 16.2 (2.6) | 16.3 (2.8) | F = 1.5 | p = 0.21 |
|
| Gender (% female) | 48.6% | 47.9% | 45.2% | 44.0% | X 2 = 0.6 | p = 0.89 | φ c = 0.03 |
| Neuropsychological (raw) * | |||||||
| Animal Fluency | 20.3 (5.0) | 20.7 (5.2) | 19.9 (4.9) | 16.1 (3.9) | F = 11.8 | p < 0.001 |
|
| BNT | 28.0 (1.8) | 28.2 (1.9) | 27.6 (2.4) | 26.4 (2.6) | F = 9.8 | p < 0.001 |
|
| TMT, Part A (s) | 31.5 (9.4) | 31.7 (8.9) | 35.0 (10.7) | 43.8 (12.3) | F = 23.0 | p < 0.001 |
|
| TMT, Part B (s) | 77.5 (28.1) | 76.7 (31.9) | 91.4 (45.3) | 132.3 (61.2) | F = 30.2 | p < 0.001 |
|
| AVLT Recall | 7.8 (3.7) | 7.5 (3.9) | 5.8 (3.5) | 3.0 (2.9) | F = 28.3 | p < 0.001 |
|
| AVLT Recognition | 13.0 (2.2) | 13.0 (2.0) | 12.6 (2.3) | 11.7 (2.3) | F = 5.3 | p = 0.001 |
|
| Clinical characteristics | |||||||
| APOE (% ɛ4 positive) † | 18 (12.7%) | 48 (25.3%) | 98 (52.1%) | 36 (72.0%) | X 2 = 92.4 | p < 0.001 | φ c = 0.40 |
| FAQ total score * | 0.53 (1.10) | 0.53 (1.20) | 0.93 (1.45) | 3.10 (2.87) | F = 43.70 | p < 0.001 |
|
| Preclinical AD criteria † | |||||||
| % low Aβ 1 - 42 | 0 (0%) | 48 (25.3%) | 181 (96.3%) | 50 (100%) | |||
| % high tau/p-tau181p | 0 (0%) | 131 (68.9%) | 180 (95.7%) | 50 (100%) | |||
| % subtle cognitive decline | 0 (0%) | 11 (5.8%) | 15 (8.0%) | 50 (100%) |
BNT, Boston Naming Test; TMT, Trail Making Test; AVLT, Rey Auditory Verbal Learning Test; APOE, apolipoprotein E; FAQ, Functional Assessment Questionnaire; Aβ 1 - 42, amyloid-beta; p-tau181p, hyperphosphorylated tau. *Data are summarized as mean (standard deviation), unless otherwise indicated. †Data are summarized as raw number of participants (% of participants).

