
An Investigation of the Inflammatory Landscape in the Brain and Bone Marrow of the APP/PS1 Mouse
Abstract
Background:
The APP/PS1 mouse model recapitulates pathology of human Alzheimer’s disease (AD). While amyloid-β peptide deposition and neurodegeneration are features of AD, the pathology may involve inflammation and impaired vascular regeneration.
Objective:
This study evaluated inflammatory environments in the brain and bone marrow (BM), and the impact on brain microvascular density.
Methods:
BM and frontal cortex from male nine-month-old APP/PS1 or the control C57Bl6/j mice were studied. Vascular density and inflammatory cells were evaluated in the sections of frontal cortex by immunohistochemistry. Different subsets of hematopoietic stem/progenitor cells (BM) and monocyte-macrophages were characterized by flow cytometry and by clonogenic assays. Myelopoietic or inflammatory factors were evaluated by real-time RT-PCR or by western blotting.
Results:
CD34+ or CD31+ vascular structures were lower (p < 0.01, n = 6) in the frontal cortex that was associated with decreased number of Lin−Sca-1+cKit+ vasculogenic progenitor cells in the BM and circulation (p < 0.02, n = 6) compared to the control. Multipotent progenitor cells MPP4, common lymphoid, common myeloid and myeloid progenitor cells were higher in the APP/PS1-BM compared to the control, which agreed with increased numbers of monocytes and pro-inflammatory macrophages. The expression of pro-myelopoietic factors and alarmins was higher in the APP/PS1 BM-HSPCs or in the BM-supernatants compared to the control. Frontal cortices of APP/PS1 mice showed higher number of pro-inflammatory macrophages (CD11b+F4/80+ or CD80+) and microglia (OX42+Iba1+).
Conclusions:
These findings show that AD pathology in APP/PS1 mice is associated with upregulated myelopoiesis, which contributes to the brain inflammation and decreased vascularity.
INTRODUCTION
Alzheimer’s disease (AD) is a complex neurodegenerative disorder characterized by progressive cognitive decline and memory loss. While the accumulation of amyloid-β (Aβ) plaques and tau protein tangles in the brain has traditionally been the primary focus of AD research, emerging evidence suggests that vascular dysfunction and impaired vascular regeneration also play a crucial role in disease pathogenesis [1, 2]. Dysfunctional blood-brain barrier (BBB) integrity and impaired cerebral blood flow regulation have been observed in AD patients, contributing to neuronal dysfunction and cognitive decline.
Vascular regeneration comprises of processes such as angiogenesis, and vasculogenesis, which involve the formation and remodeling of new blood vessels. Bone marrow (BM)-derived vasculogenic progenitor cells, also known as endothelial progenitor cells (EPCs), a subpopulation of hematopoietic stem/progenitor cells (HSPCs) that were shown to promote vascular re-endothelialization and vascular regeneration [3–5]. Accumulated evidence shows that EPCs promote regeneration of vasculature via paracrine mechanisms [6]. Murine Lineage-negative, Sca-1+ and cKit+ (LSK) cells were consistently shown to be vasculogenic and to accelerate vascular repair [7, 8]. This population consists of HSPCs with 10% stem cells [9] and showed the highest potential of re-endothelialization in experimental models of ischemic injury via paracrine effects [10, 11]. Circulating vasculogenic progenitor cells were found to be decreased in the early stages of AD suggesting impaired vascular regenerative potential precedes the development of AD [12]. This finding was later corroborated by other studies [13–15].
Neuroinflammation, regulated by a plethora of immune cells, cytokines and chemokines, emerged as a critical contributor, exacerbating the neurodegenerative processes associated with the disease [16]. The inflammatory environment in the brain created by the infiltration of inflammatory cells or the microglia can compromise BBB integrity and exacerbate neurovascular dysfunction in AD. Lymphocyte antigen 6C (Ly6C)-expressing murine monocytes possess pro-inflammatory functions and express high levels of C-C chemokine receptor 2 (CCR2) [17]. Ly6C+ cells migrate and differentiate into macrophages in peripheral tissues [18–20]. Two subsets of macrophages with distinct functions, pro-inflammatory and anti-inflammatory macrophages that were previously termed as M1 and M2 macrophages are well-documented [21]. Invading monocytes and macrophages in the brain were shown to be derived from circulating monocytes or from the BM-derived progenitors such as granulocyte-macrophage progenitors or other hematopoietic stem cell progeny [22, 23]. Systemic inflammation associated with increased myelopoiesis may accelerate the progression of AD [24]. An increased infiltration of inflammatory monocyte-macrophages impairs vascular regeneration resulting in microvascular rarefaction [25–27]. Neuroinflammation also influences vascular remodeling. Inflammation and a loss of vascular wall integrity are the earliest identifiable changes in subjects with AD, preceding Aβ and tau accumulation [28, 29]. Perivascular macrophages in the brain were known to induce BBB breakdown via releasing oxidative molecules in a mouse model of hypertension [30].
In recent years, numerous animal models have been generated to study AD for understanding molecular mechanisms and for the development of novel pharmacological targets. APP/PS1 mice harbor mutations in both the amyloid precursor protein (APP) and presenilin 1 (PS1) genes, recapitulating several key pathological features observed in brains of subjects with AD, including Aβ plaques, tau hyperphosphorylation, synaptic dysfunction, and cognitive impairment [31, 32]. This model harbors two transgenes in the chromosome 9 encoding the chimeric amyloid beta (A4) precursor protein, the so-called Swedish mutation (K595N/M596L) (APPswe) and the delta e9 mutation of presenilin 1 (PS1de9) on C57Bl/6j background. This model is well studied for cognitive deficits and is known to develop impairments in reference memory [33, 34] and associative learning tasks at 6–8 months [35, 36].
This study aims to explore the vascular regenerative reserve and inflammatory environment in the BM of APP/PS1 mice and to evaluate microvascular density and inflammation in the brain. Mice were studied at the age of nine months, the age at which the cognitive deficits are manifested. We have characterized EPCs, the inflammatory cells and pro-myelopoietic potential of the BM-HSPCs. Selected pro-inflammatory and pro-myelopoietic factors were analyzed in the BM-supernatants. Inflammatory cells and microvascular density were characterized in the brain. The expression of S100 family of calcium-binding proteins and high-mobility group box 1 protein (HMGb1), collectively known as alarmins, and the receptors was evaluated in the BM-HSPCs.
METHODS
Animal model
All animal studies were approved by the Institutional Animal Care and Use Committee at North Dakota State University (NDSU). All authors complied with and all methods are reported in accordance with ARRIVE guidelines. Male C57BL/6 or APP/PS1 mice were obtained from the Jackson Laboratories; the strain is originally derived from the MMRRC stock # 34832 [31]. All mice were housed at the NDSU on a 12-hour light-dark cycle with food and water ad libitum. Mice were used for experimentation at the age of nine months. Mice were euthanized by the following procedure, which was approved by IACUC at NDSU. The procedure involved isoflurane anesthesia followed by thoracotomy. Cardiac puncture was performed as a secondary measure to ensure euthanasia.
Isolation of bone marrow cells
Mononuclear cells (MNCs) were isolated from BM cell suspension by density gradient centrifugation using Ficoll (GE Healthcare). Layer of MNCs was separated and used for enrichment of lineage-depleted cells or for the enumeration of vasculogenic progenitor cells and monocyte-macrophages as described below. HSPCs were enriched by negative selection by using immunomagnetic enrichment kit (EasySep, Cat#19856A, StemCell Technologies Inc.) as per manufacturer’s instructions. Briefly, the lineage depletion was first carried out by incubating the suspension of MNCs with the cocktail of antibodies for CD5, CD11b, CD19, CD45R, 7– 4, Ly-6G/C (Gr-1), and TER119 followed by labeling with Tetrameric Antibody Complexes that recognize biotin and dextran-coated magnetic particles. The antibody-bound cells were then separated by using EasySep magnet to obtain HSPCs, which were preserved until used for gene expression assay by real-time RT-PCR.
BM supernatants were collected by harvesting the whole BM and the suspensions of which were centrifuged at 1200 g. The cell-free supernatants were collected and concentrated to 0.5 mL by using Amicon centrifugal filters (3 kDa molecular weight cutoff) (Millipore Sigma). Supernatants were preserved at –80°C for analysis.
Flow cytometry
Peripheral blood samples were collected from submandibular vein and white blood cells were isolated after treatment with red blood cell lysis buffer. Cells obtained from peripheral blood or BM MNCs were suspended in 100μL of cell staining buffer (Biolegend) and incubated for 5 min with 0.5μL of Trustain (Biolegend). Later, the cells were incubated with fluorescent conjugated antibodies at 4°C for 45 min. Dead cells were identified by using 7AAD (BD Pharmingen). Different cell populations as listed in the Table 1 were characterized by using the respective markers indicated in the table [25, 27]. The gating strategy for characterizing different cell populations were illustrated in Supplementary Figures 1–3. Flow cytometry was carried out by using BD FACS Aria II (BD Biosciences) cytometer by following standard protocols.
Table 1
Immunophenotypic markers used of identification of different cell populations [86–88]
| Cell type | Immunophenotypic markers |
| Monocytes | CD45+Ly6G–Ly6C+CD115+ |
| Pro-inflammatory Macrophages | CD45+CD11b+Ly6G–Ly6C+F4/80+CCR2+CD80+ |
| Anti-inflammatory Macrophages | CD45+CD11b+Ly6G–Ly6C+F4/80+CX3CR1+CD206+ |
| Long term repopulating HSCs | Lin–Sca-1+ckit+CD34–Flk2–CD48–CD150+ |
| Short term repopulating HSCs | Lin–Sca-1+ckit+CD34+Flk2–CD48–CD150– |
| Multipotent Progenitor cells 2 (MPP2) | Lin–Sca-1+ckit+CD34+Flk2–CD48+CD150+ |
| Multipotent Progenitor cells 3 (MPP3) | Lin–Sca-1+ckit+CD34+Flk2–CD48+CD150– |
| Multipotent Progenitor cells 4 (MPP4) | Lin–Sca-1+ckit+CD34+Flk2+CD48+/0CD150– |
| Common Myeloid Progenitor cells (CMP) | Lin–Sca-1–cKit+CD34+FcRγ– |
| Granulocyte Macrophage Progenitor cells (GMP) | Lin–Sca-1–cKit+CD34+FcRγ+ |
| Megakaryocyte-Erythroid progenitor cells (MEP) | Lin–Sca-1–cKit+CD34-FcRγ– |
| Common Lymphoid Progenitor cells (CLP) | Lin–IL7rα+ Sca-1–cKit+ |
| Myeloid Progenitor cells (MyP) | Lin–IL7rα+ Sca-1+cKit+ |
Clonogenic assay
BM-MNCs were obtained by using Ficoll reagent as described above and five thousand cells were tested for CFU-GM assay in a 30 mm culture dish by using Methocult medium (Methocult GF M3534, Stem Cell Technologies) as per manufacturer’s protocol. After 10 days, colonies were counted, and bright field images were taken by using a microscope (Leica). Then, colonies were dissociated, and inflammatory monocyte-macrophages were enumerated by flow cytometry as described above.
Western blotting
Protein concentrations in the BM supernatants were assayed by using BCA assay kit (Thermo scientific pierce, Cat# 23225). Aliquots of supernatants were boiled at 95°C for 5 min in Laemmli buffer containing β-mercaptoethanol and snap-cooled and separated by electrophoresis using 4–20% SDS- PAGE gradient gels (Bio-Rad). Proteins were transferred to PVDF membranes and processed as per standard protocols with primary and secondary antibodies and the enhanced chemiluminescence substrate (Pierce ECL substrate) was used to detect protein bands. Ponceau S was used to quantify the total protein in the BM-supernatants. The protein bands were quantified by using ImageJ software (https://imagej.nih.gov/ij/) [37]. The list of antibodies with concentrations is shown in the Supplementary Table 1. Original western blot images are shown in the Supplementary Figure 4.
Semi-quantitative real-time polymerase chain reaction (RT-PCR)
RNA was extracted by using Trizol and the concentration and purity were determined by a spectrophotometer (NanoDrop Technologies). RNA (1μg) was reverse-transcribed by using a qScript cDNA synthesis kit (Bio-Rad), which was used for real-time PCR. Each sample for PCR contained 50 ng DNA, 500 nM of forward and reverse primers, and the iQ SYBR green containing supermix (Bio-Rad). β-actin was used as an internal housekeeping gene. The reactions were run in the Quantitative PCR System (Stratagene Mx3000P) using the following conditions: 3 min at 95°C, followed by 40 cycles of 10 s at 95°C (denaturation step), 30 s at 55°C (annealing step), and 30 s at 72°C (extension step). Primer sequences with concentrations were listed in the Supplementary Table 2.
Immunohistochemistry
Frontal cortices of mice brains were isolated and fixed in 4% Paraformaldehyde solution for 24 h at room temperature and the tissue samples were then embedded in paraffin blocks to obtain sections of 5 microns thickness. Sections were deparaffinized by using xylene and then hydrated. The deparaffinized sections were subjected to epitope retrieval procedure by steaming in sodium citrate buffer (pH 6.0). Then, normal goat serum was used to avoid non-specific binding prior to incubation with primary and secondary antibodies by using standard protocols. CD31 or CD34 and IlB4 were used for determining vascular density. CD11b and F4/80 antibodies were used for detecting monocyte-macrophages. Monocyte-macrophages were detected by using CD11b and F4/80 and the pro and anti-inflammatory macrophages were identified by using CD80 and CX3CR1, respectively. OX42 and IBA1 were used as markers for microglia. The list of primary and secondary antibodies with concentrations is shown in the Supplementary Table 2. The nuclei were stained by using DAPI (Vector laboratories) the fluorescence imaging was carried out in Permount (Electron Microscopy Sciences) by using the Zeiss microscope. Primary antibodies were excluded for negative controls. Images were analyzed offline by using ImageJ (https://imagej.nih.gov/ij/) [37].
Data analysis
Results are expressed as Mean±S.E.M. Number of experiments ‘n’ indicates the number of mice used per each treatment group. Experimental groups were compared for statistical differences by using an unpaired nonparametric test, Mann-Whitney test, by using the Prism software (version 10.1.1, GraphPad Software, Inc.) (http://www.graphpad.com) Experimental groups were considered significantly different if p < 0.05.
RESULTS
Decreased microvascular density in the frontal cortex and decreased vasculogenic progenitor cells in the bone marrow of APP/PS1 mouse
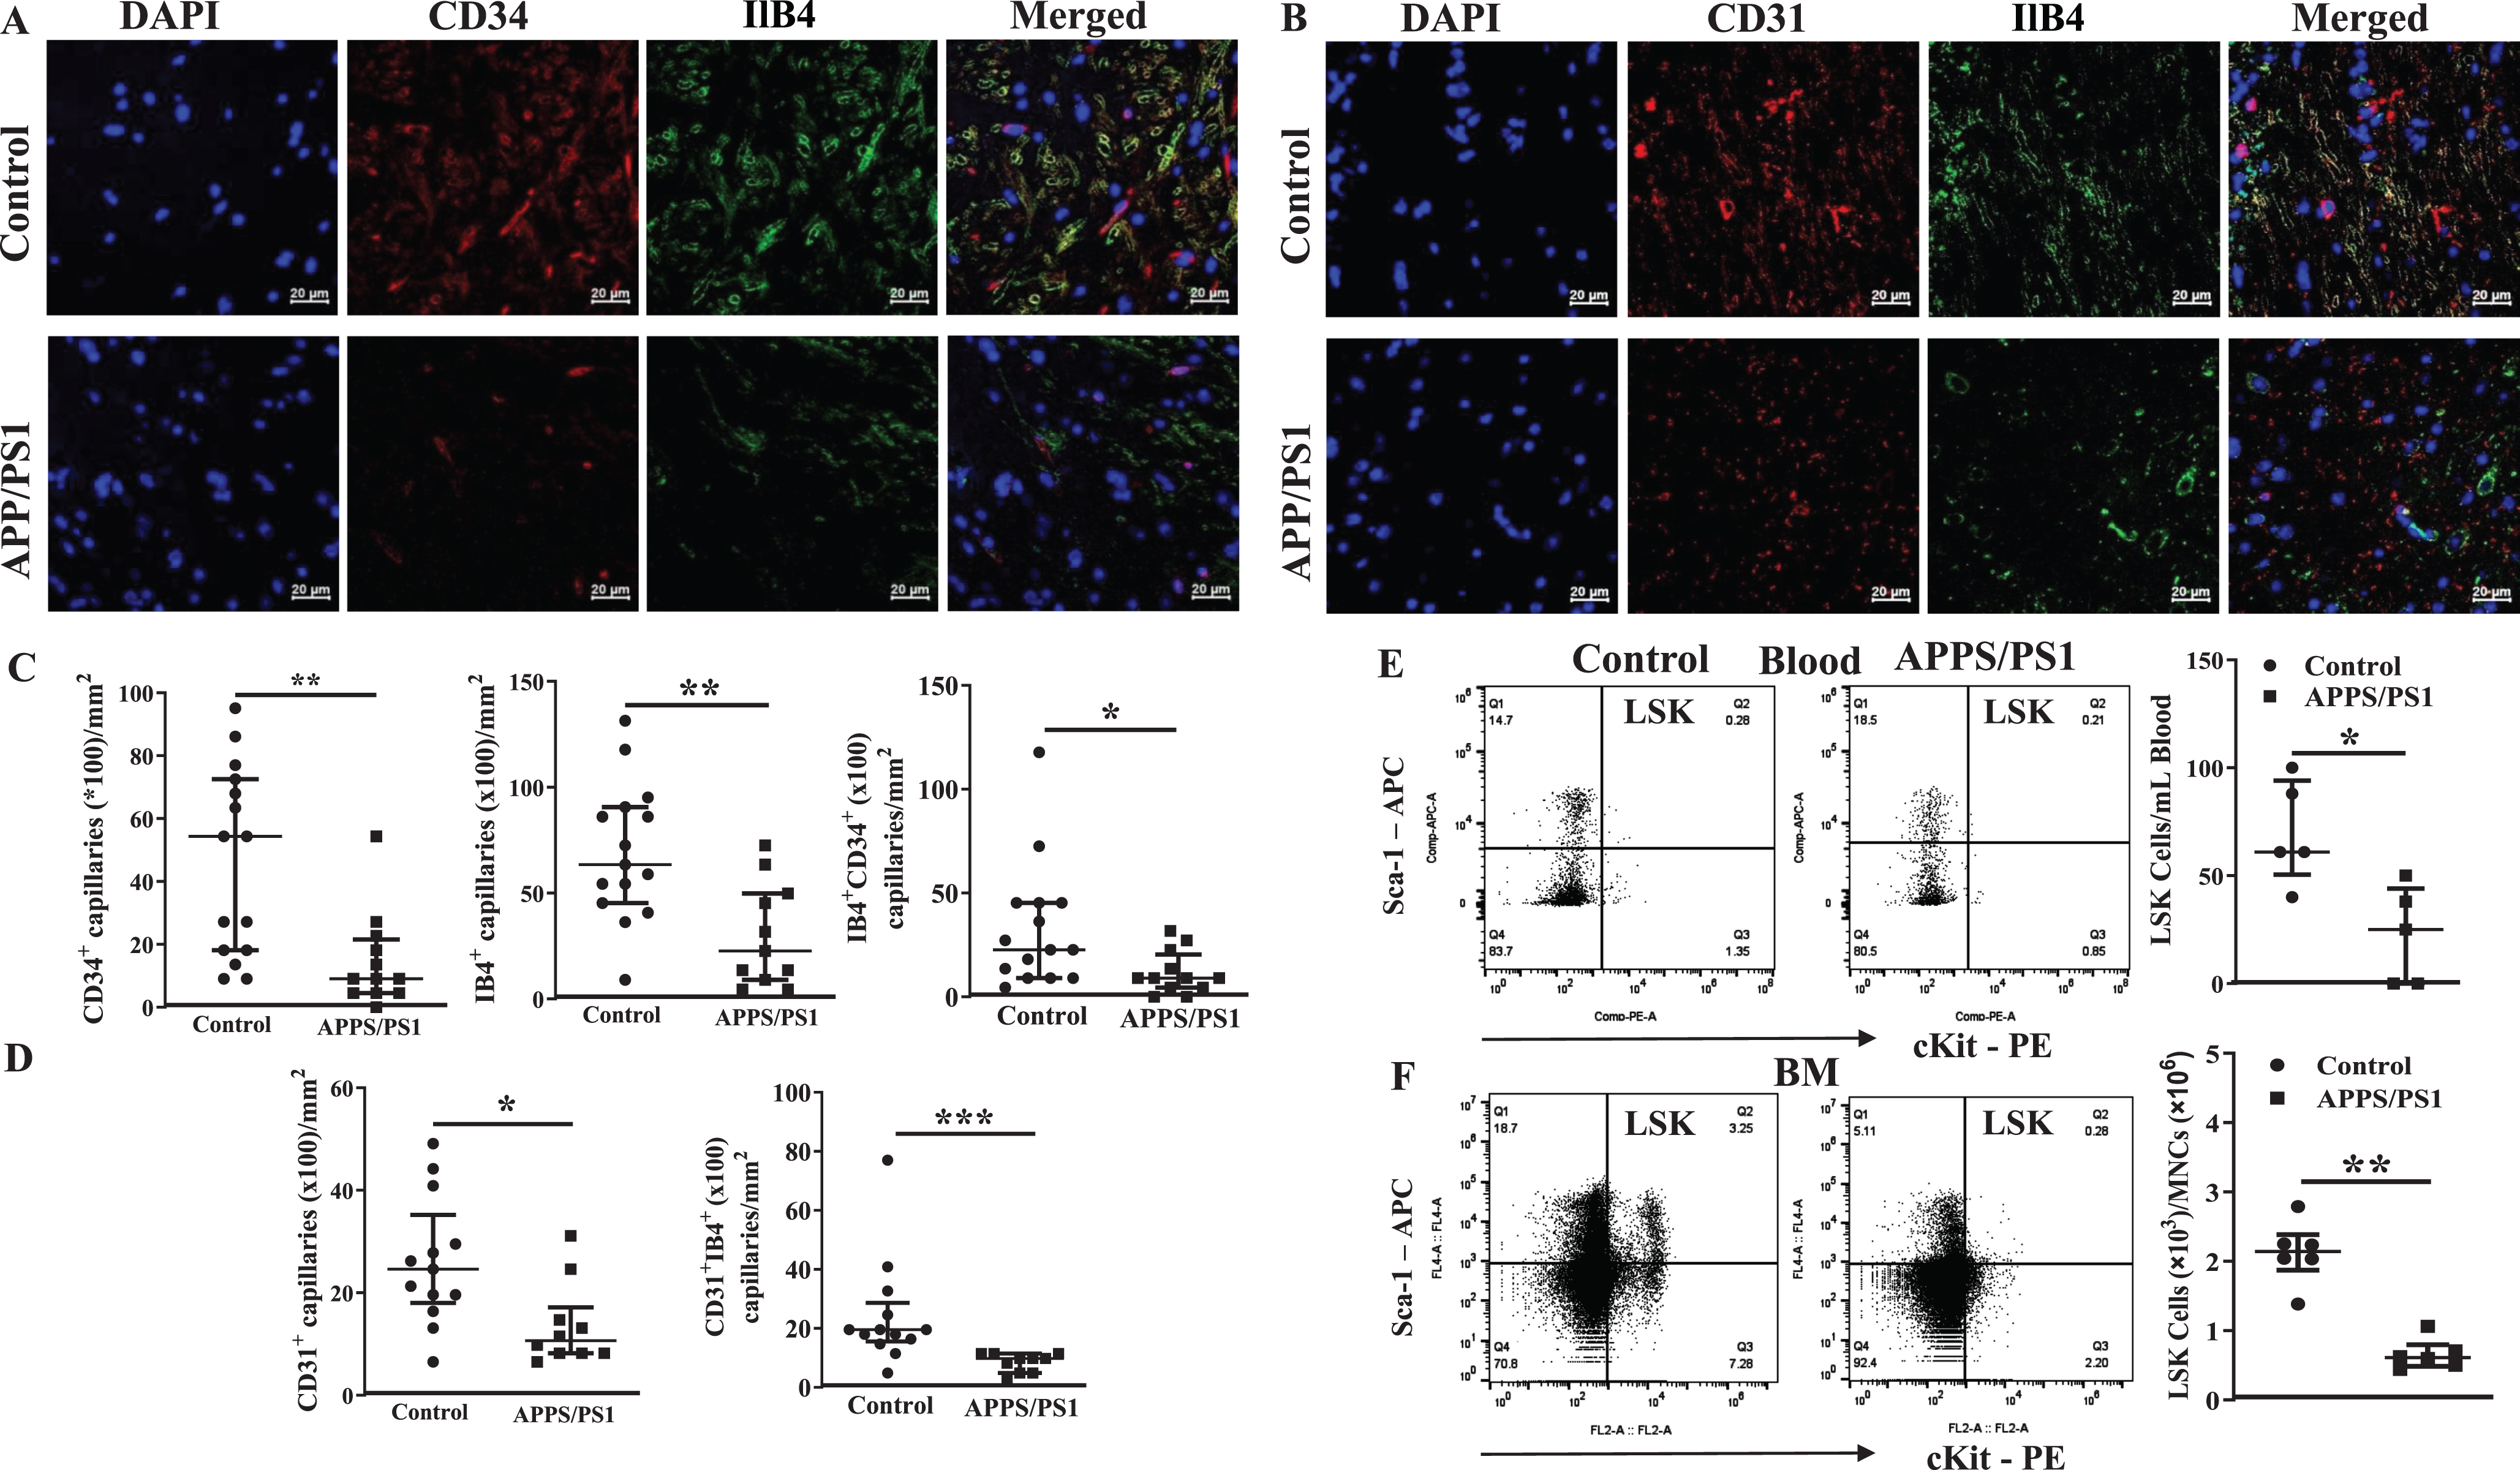
Microvascular density in the frontal cortex was evaluated by using markers for endothelial cells, CD31 or CD34, and the basement membrane matrix by using isolectin B4 (IlB4). Number of single marker or dual marker-positive cells were lower in the frontal cortices of APP/PS1 mice compared to that observed in the control mice (CD34+ (p < 0.01), Ilb4+ (p < 0.01), CD34+IlB+ (p < 0.05), CD31+ (p < 0.05), CD31+IlB4+ cells (p < 0.001)) (n = 5) (Fig. 1A– D). This led us to test if the vasculogenic stem/progenitor cells, LSK cells, are altered in APP/PS1 mice. The gating strategy for the flow cytometry of LSK cells is shown in the Supplementary Figure 1. flow cytometry detected that the number of LSK cells in the peripheral blood were lower in the APP mice (23±10, p < 0.02, n = 6) compared to that observed in the WT group (70±11, n = 5). In agreement with a decrease in the number of cells in the circulation, LSK cells were significantly lower in the BM of APP/PS1 mice (0.66×10³±0.2, p < 0.002, n = 6) when expressed per a million of total BM-MNCs compared to that observed in the BM of control group (2.1×10³±0.5, n = 5).
Fig. 1
Decreased microvascular density in the frontal cortex in APP/PS1 mice is associated with decreased vasculogenic progenitor cells in the blood and bone marrow. A, B) Shown were representative immunofluorescence images of frontal cortex derived from control and APP/PS1 mice stained for nuclei (DAPI), CD31, CD34 or the basement matrix by Isolectin B4 (IlB4). Scale bar measures 20 microns. C) Microvascular density, defined by CD34+, IB4+, or CD34+IB4+ structures or D) CD31 or CD31+IB4+ structures in the sections of frontal cortices of APP/PS1 mice (n = 6) was lower than that observed in the control group (n = 5). *p < 0.05, **p < 0.01, and ***p < 0.001, Mann-Whitney test. Shown in E were representative flow cytometry dot plots of LSK cells in blood and bone marrow mononuclear cells derived from control and APP/PS1 mice. F) The number of LSK cells were significantly lower in blood or bone marrow of APP/PS1 mice (n = 6) compared to control group (n = 5). *p < 0.05, **p < 0.01, and ***p < 0.001, Mann-Whitney test.
Altered subsets of stem/progenitor cell populations in the bone marrow of APP/PS1 mouse
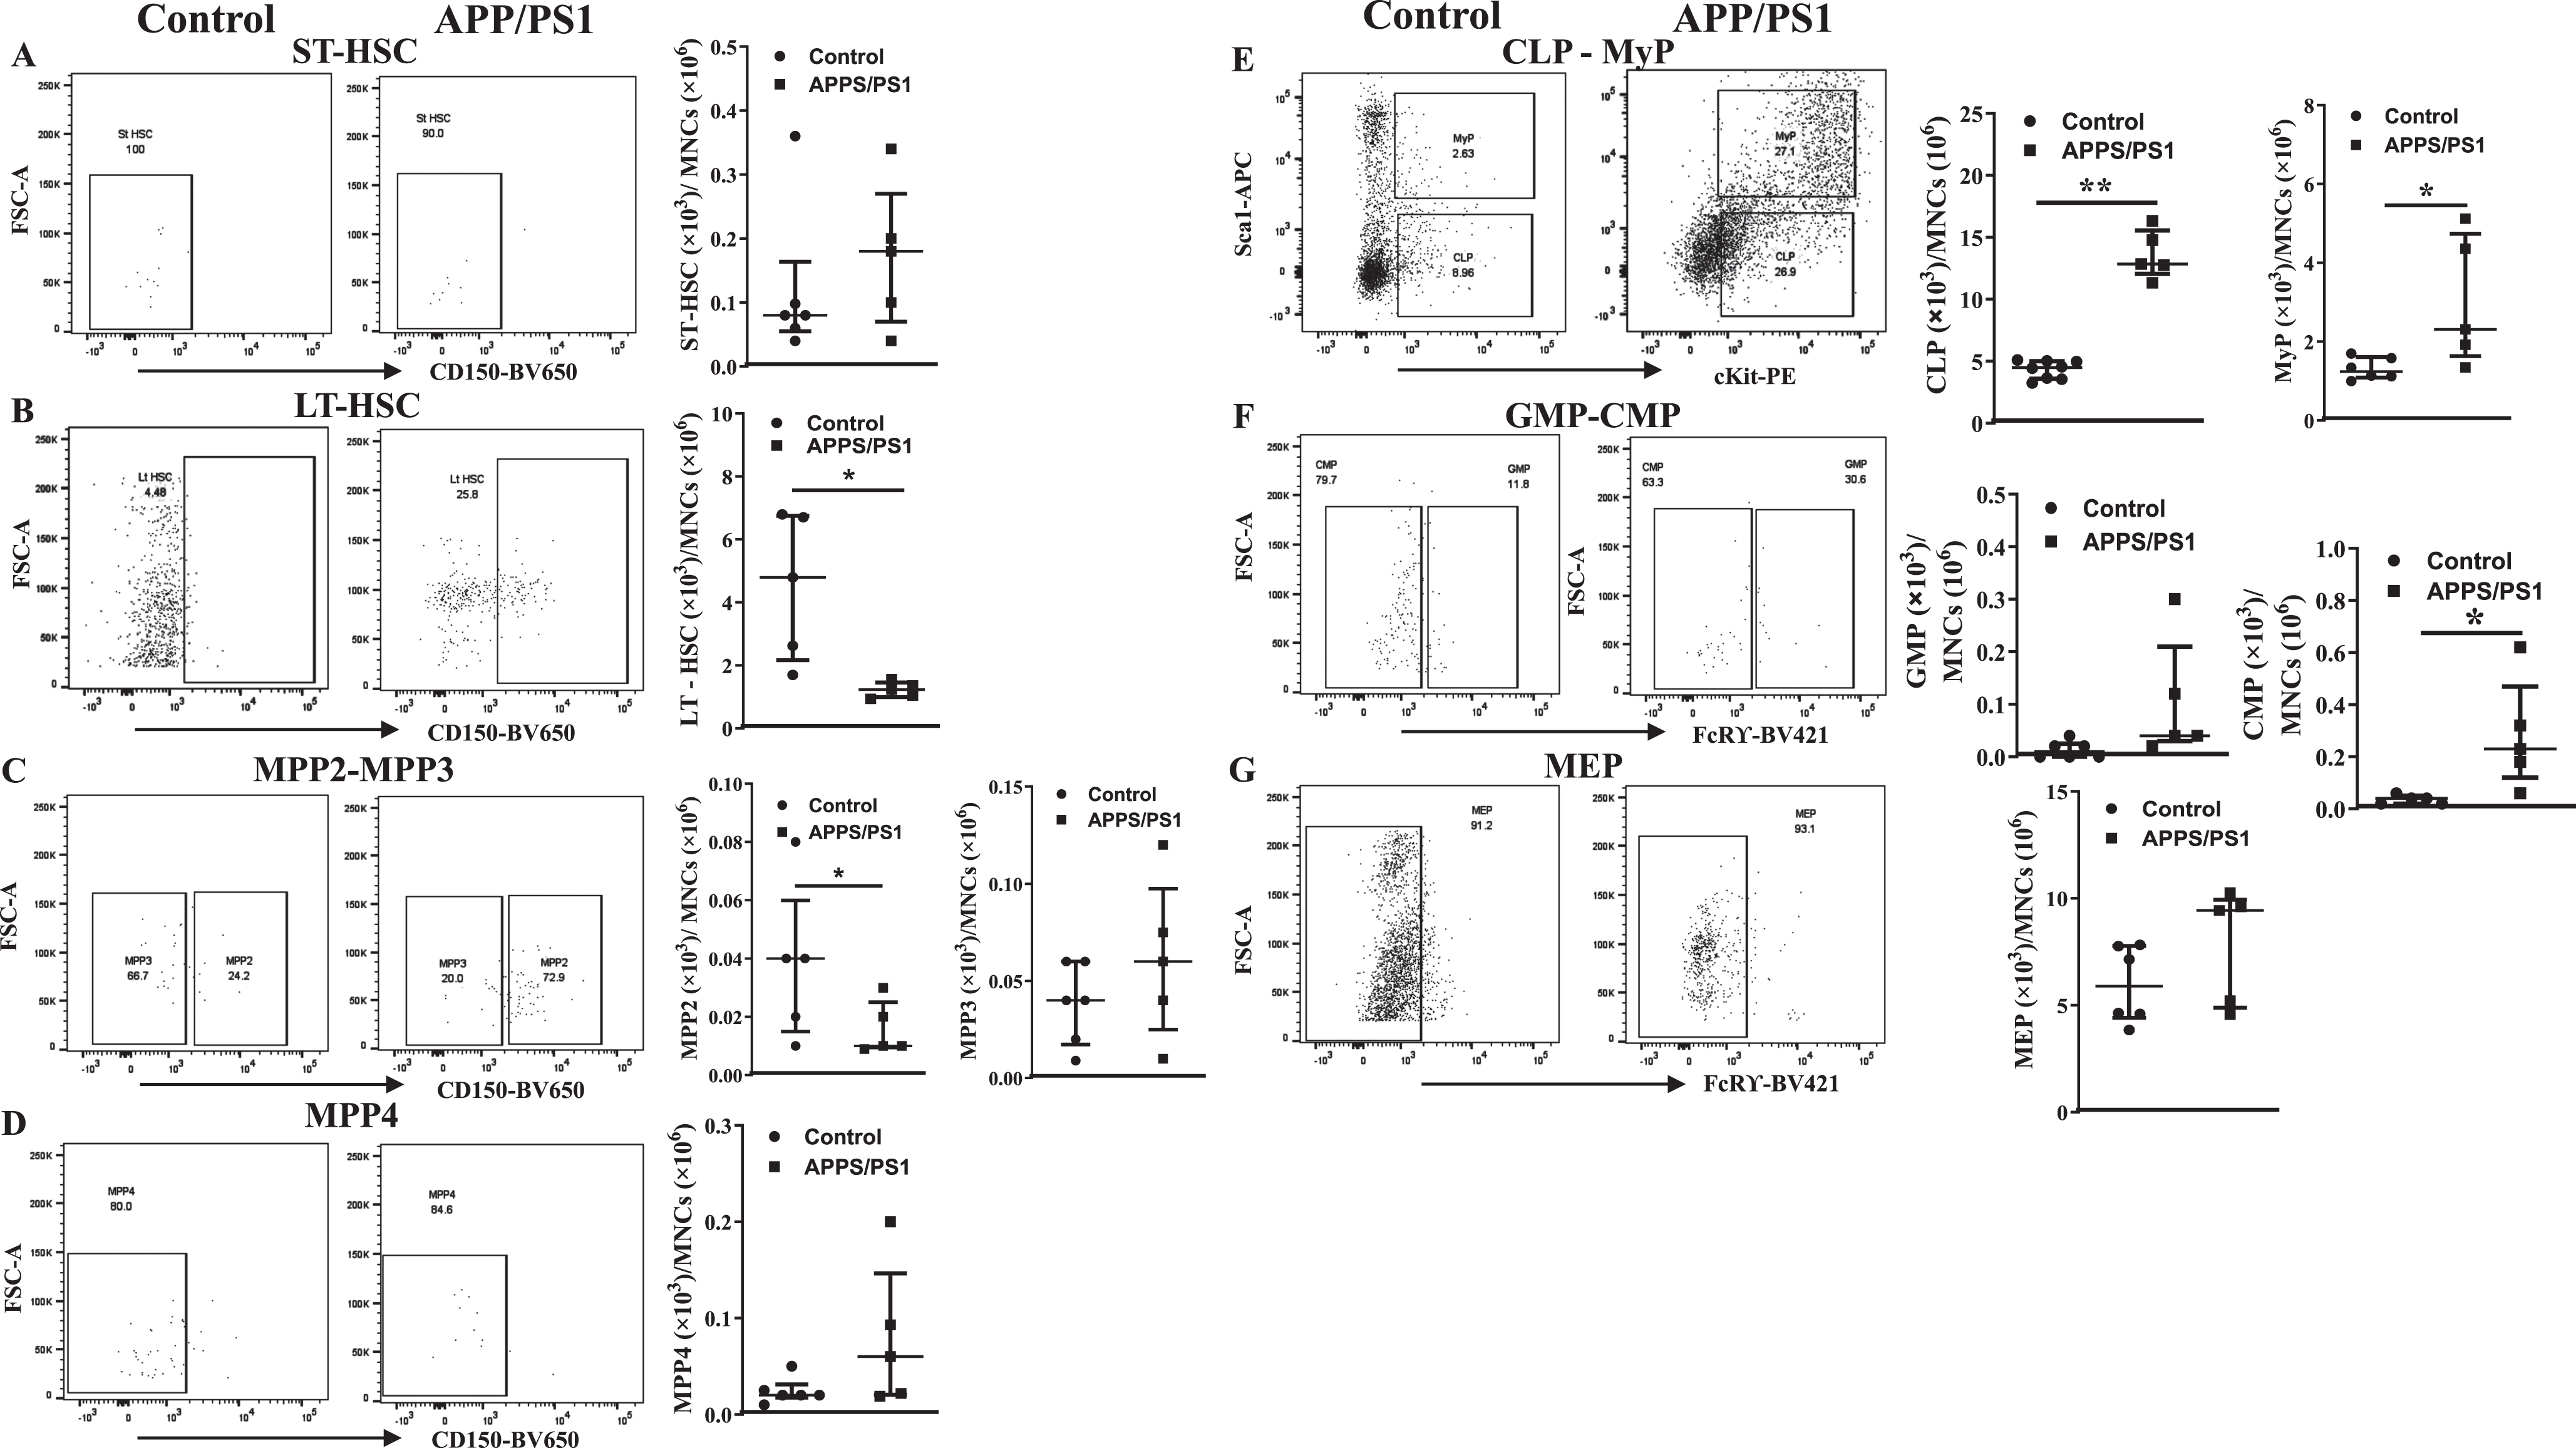
Then, we analyzed different subsets of HSCs and multipotent progenitor cells to characterize BM hematopoiesis in the APP/PS1 mice. The gating strategy for the flow cytometry for different subsets of cells is shown in the Supplementary Figure 2. The number of each subset of HSPCs were expressed as numbers per a million of BM-MNCs. The short-term repopulating HSCs (ST-HSCs) (Lin−Sca-1+cKit+CD34+Flk2–CD48–CD150–) were similar in both groups of mice while the long-term repopulating HSCs (Lin–Sca-1+cKit+CD34+Flk2–CD48–CD150+) were lower ((1.2±0.1)×103, p < 0.05, n = 6)) in the APP-PS1 BM compared to that observed in the control group ((4.5±1.0)×103, n = 5) (Fig. 2A, B). Multipotent progenitor cells (MPP)2 were decreased ((0.005±0.004)×103, n = 6) in the APP/PS1 and the MPP4 showed increasing trend ((0.07±0.05)×103, n = 6) compared to the control group (MPP2: (0.04±0.01)×103 and MPP4: (0.01±0.005)×103, n = 5, p < 0.05) while MPP3 were similar in the both groups (Fig. 2C, D). Possible alterations in the populations of lineage-committed progenitor cells were then characterized. The common lymphoid progenitor cells (CLPs, Lin–IL7rα+Sca-1–cKit+) ((13.8±1.1)×103, n = 6) and the myeloid progenitor cells (MyPs, Lin–IL7rα+Sca-1+cKit+) ((3.2±0.9)×103, n = 6) were significantly higher in the APP/PS1 mice compared to that observed in the WT control (CLPs: (4.3±0.3)×103, p < 0.01, n = 5; MyPs: (1.3±0.1)×103, n = 5, p < 0.05). Along similar lines, the common myeloid progenitor cells (CMPs) were significantly increased in the APP/PS1 BM compared to the WT control (0.1±0.06, n = 6 versus WT 0.036±0.008, n = 5, p < 0.05) while granulocyte-macrophage progenitor cells (GMPs) showed increasing trend (APP/PS1 : 0.1±0.07, n = 6 versus WT: 0.013±0.007, n = 5) (Fig. 2F). No change was observed in the population of megakaryocyte-erythroid progenitor populations (MEPs, Lin−Sca-1–cKit+CD34–FcRγ–) (Fig. 2G).
Fig. 2
Altered hematopoiesis in the bone marrow of APP/PS1 mouse. Shown were representative flow cytometry dot plots and quantification of ST-HSC, LT-HSC, MPP2-MPP3, MPP4, CLP-MyP, GMP-CMP, and MEP in the bone marrow of control and APP/PS1 mice. LT-HSCs (B) and MPP2 (C) populations of cells were decreased while CLP, MyP (E) or CMP (F) populations were increased in the APP/PS1 mice. No change was observed in the ST-HSCs (A), MPP3 (C), MPP4 (D), GMP (F), and MEP (G) populations (*p < 0.05 and **p < 0.01, n = 6 (APP/PS1) and n = 5 (control), Mann-Whitney test).
Ex vivo Myelopoietic potential is higher in the BM-MNCs derived from APP/PS1 mice
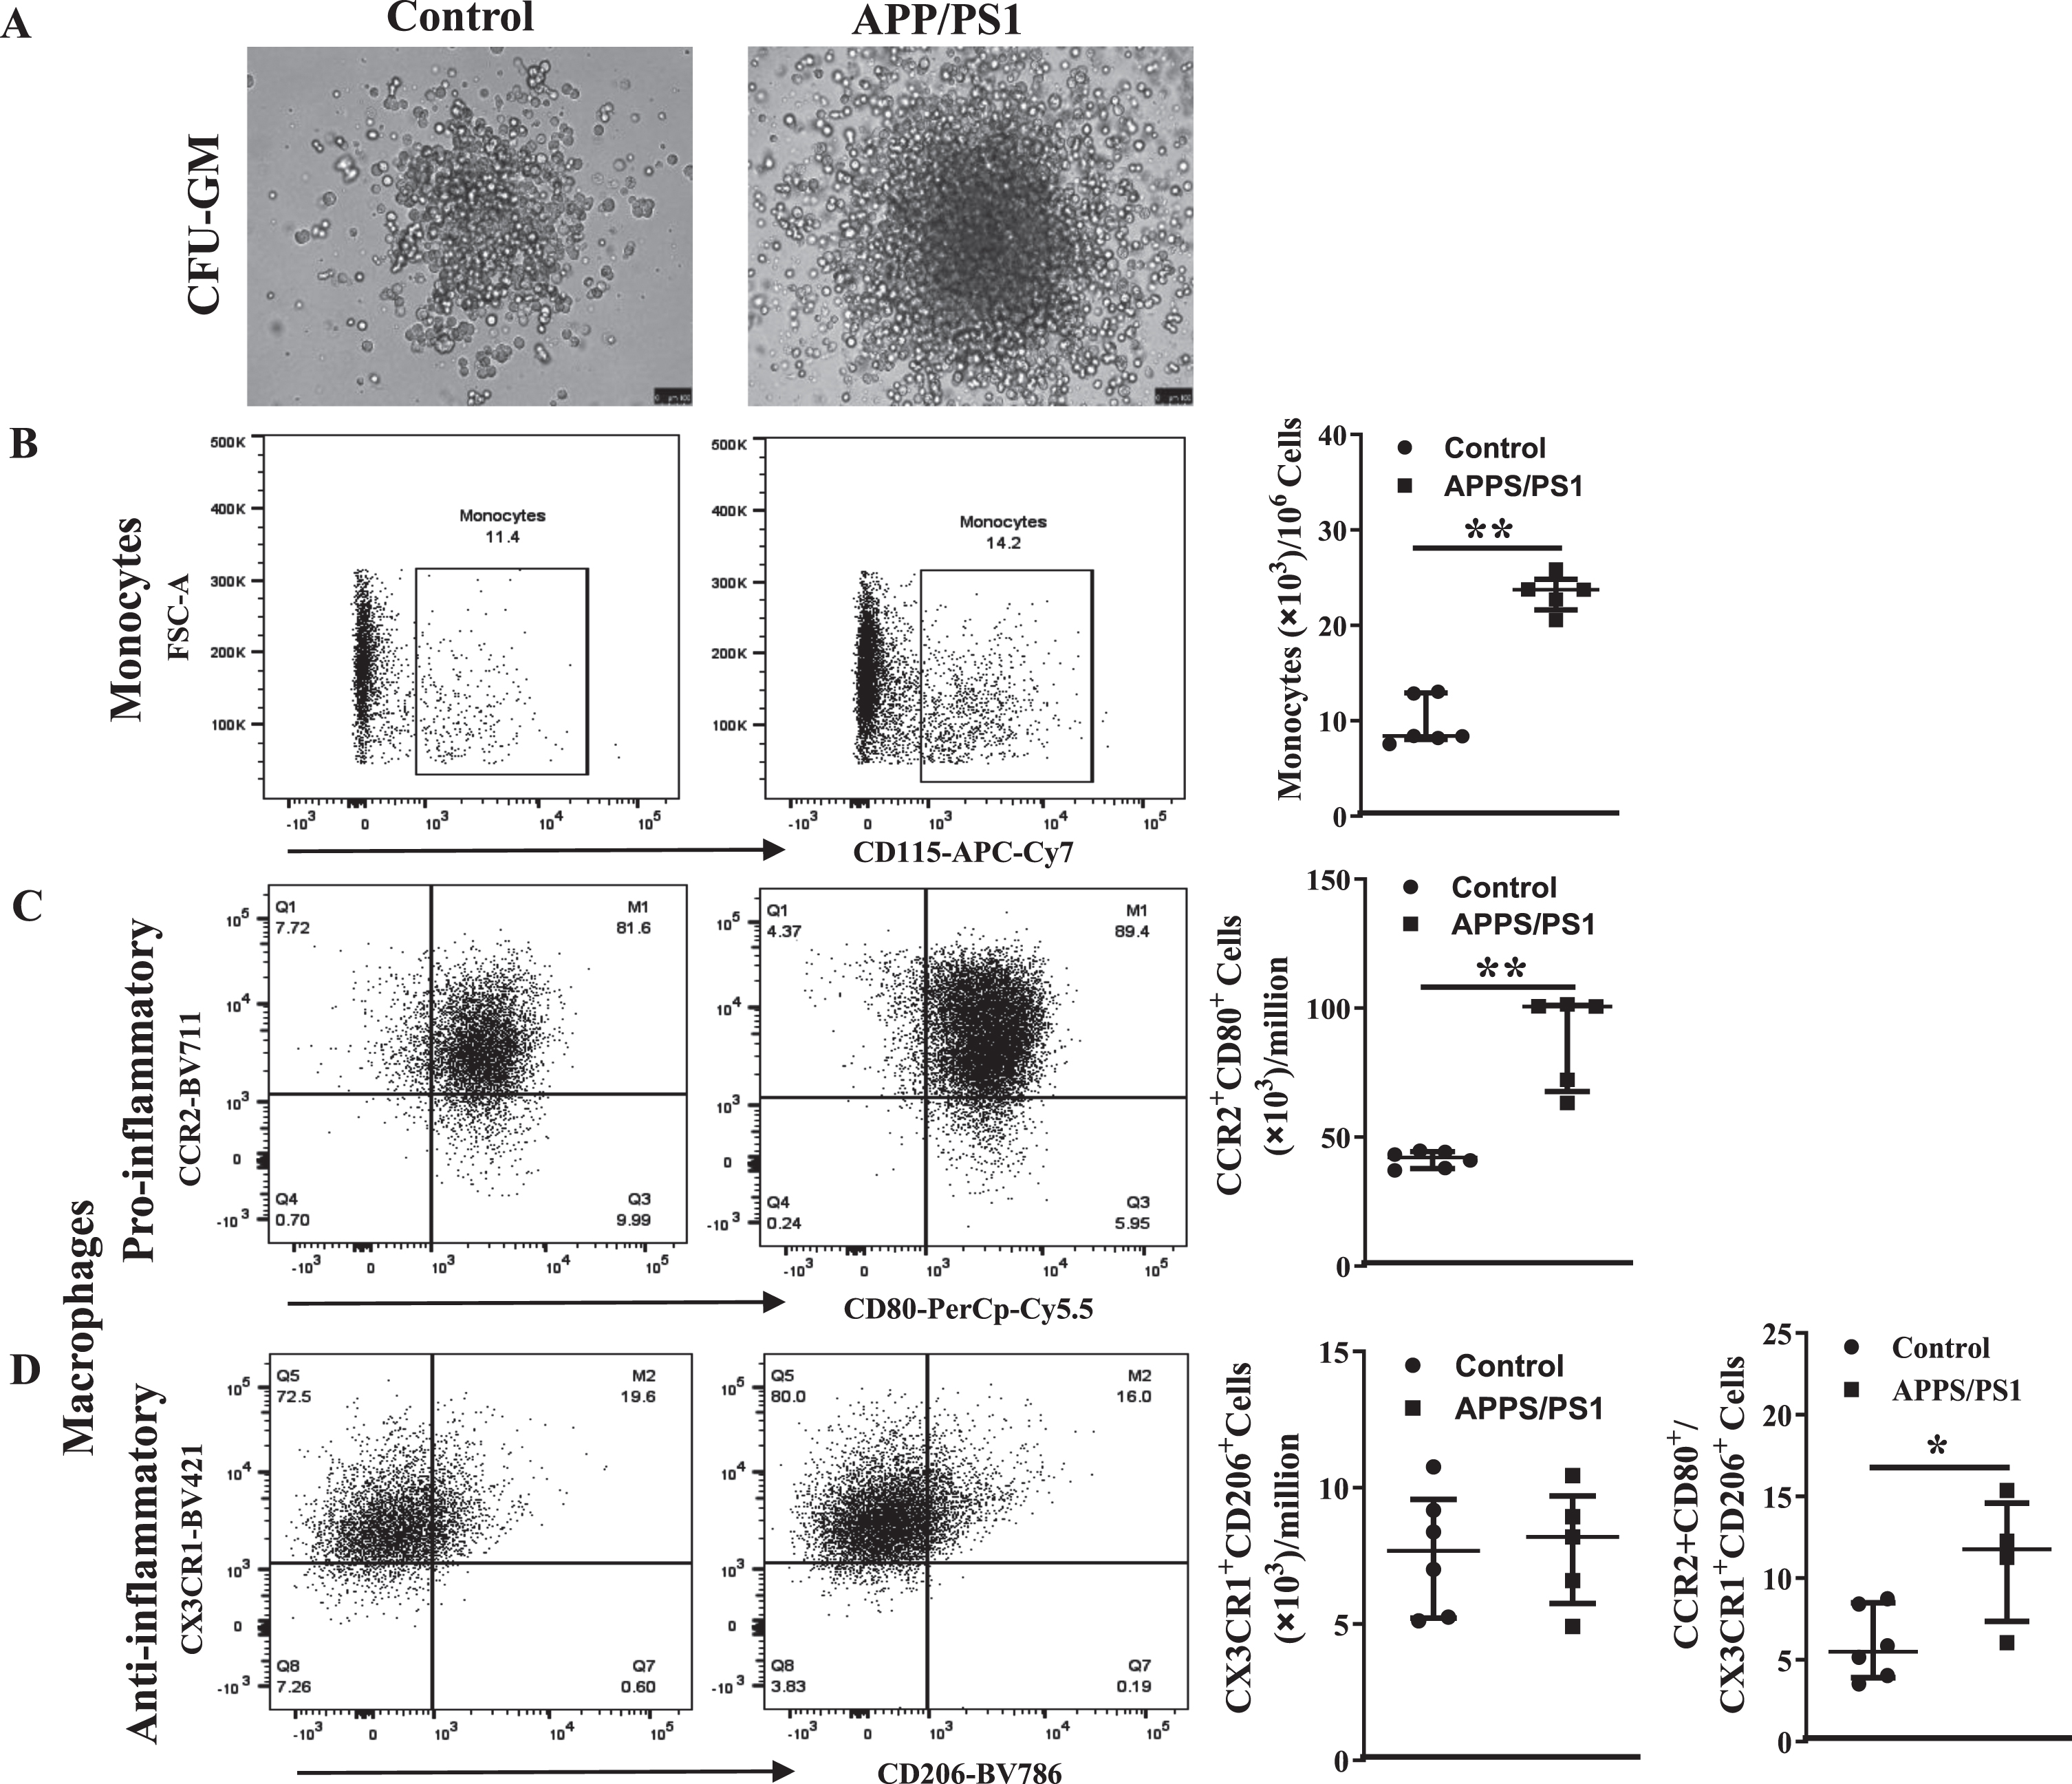
Ex vivo clonogenic assays by using CFU-GM assay were carried out to test the myelopoietic potential in the in the BM-MNCs derived from APP/PS1 mice. The total number of colonies were higher in APP/PS1 mice (61±3, n = 12 plates/6 mice) compared to the WT control mice (32±4, n = 10 plates/5 mice) (Fig. 3A). The size of the colonies was also bigger in those derived from APP/PS1 although this parameter was quantified. Then monocyte-macrophages were characterized in single-cell suspensions derived from dissociated colonies by flow cytometry. The gating strategy for the flow cytometry is shown in the Supplementary Figure 3. The number of monocytes (CD45+Ly6G– LyC+CD115+) in the colonies derived from APP/PS1 mice were higher compared to that derived from colonies of control group (APP/PS1: (24.0±0.7)×103, n = 6 versus WT: (9.8±1.0)×103, n = 5, p < 0.01) (Fig. 3B, C). The number of pro-inflammatory macrophages (CD45+ Ly6G–Ly6C+CD11b+F4/80+CCR2+CD80+) were higher in the colonies derived from APP/PS1 mice compared to the control (APP/PS1: (91.5±9.4)×103, n = 6 versus WT: (41.4±1.3)×103, n = 5, p < 0.01) while anti-inflammatory macrophages were unaltered (Fig. 3B, E) thus the ratio of pro- to the anti-inflammatory macrophages (CD45+Ly6G–Ly6C+CD11b+F4/80+CX3CR1+CD206+) was higher in the colonies derived from APP/PS1 BM-MNCs (11±1.9) compared to that in WT control (6±0.9, p < 0.05, Fig. 3F).
Fig. 3
Myeolpoietic potential is higher in the bone marrow cells derived from APP/PS1 mice. A) Shown were representative bright field images of colonies observed in the CFU-GM assay by using the control or APP/PS1 mice bone marrow cells. B-D) Representative flow cytometry dot plots for the enumeration of monocyte-macrophages derived from CFU-GM colonies and the quantification for relative comparison. Monocytes (CD45+Ly6G−Ly6C+CD115+) (B) and the pro-inflammatory macrophages (CD45+CD11b+Ly6G−Ly6C+F4/80+CCR2+CD80+) (C) were higher in the colonies of obtained from APP/PS1 group (**p < 0.01, n = 12 plates/6 mice) compared to controls (n = 10 plates/5 mice) while the anti-inflammatory macrophages (CD45+CD11b+Ly6G−Ly6C+F4/80+CX3CR1+CD206+) (D) were similar in both groups. Ratios of pro-inflammatory macrophage to anti-inflammatory macrophages were significantly higher in colonies derived from APP/PS1 bone marrow cells compared to control (**p < 0.05). Mann-Whitney test was used to test the statistical significance.
Upregulation of myelopoietic factors in the bone marrow progenitor cells of APP/PS1 mouse
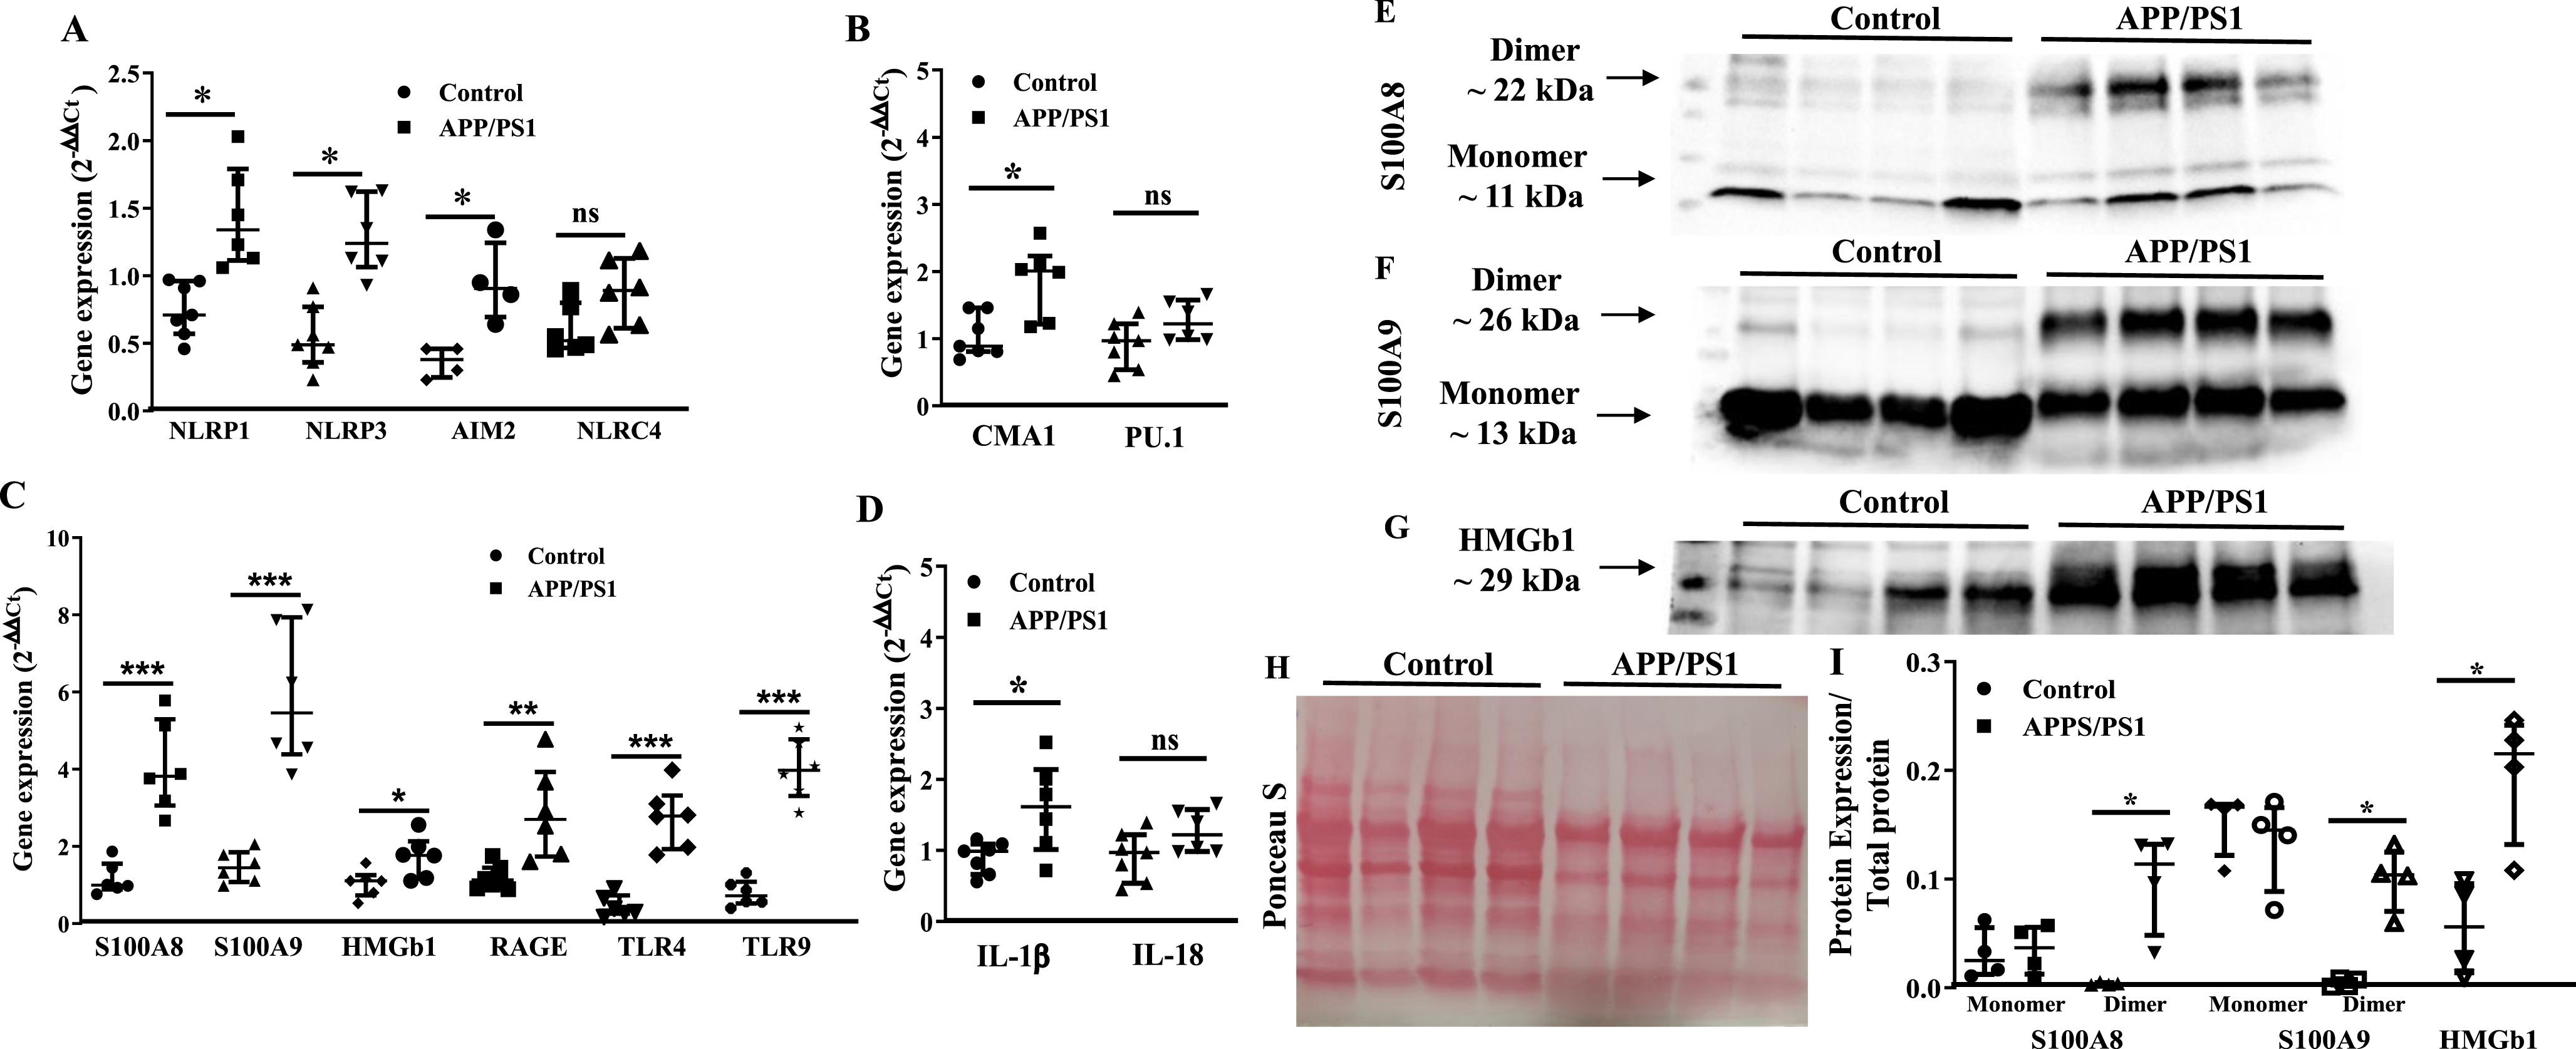
Then, we focused at characterizing molecular signatures of increased myelopoiesis in Old BM-HSPCs. Real time PCR studies revealed significant increase in the gene expression of selected factors in the APP/PS1 BM-HSPCs. Expression of NLRP1, NLRP3 (p < 0.05, n = 5), NLRC4, AIM2 and CMA1 was increased in the APP/PS1 progenitor cells to the WT (p < 0.01, n = 5) while PU.1 expression was not altered (Fig. 4A, B). Gene expression of alarmins, S100A8 (p < 0.01), S100A9 (p < 0.01), or HMGb1 (p < 0.05) and the receptors for alarmins, receptor for advanced glycation end products (RAGE), Toll-like receptor 4 (TLR4), and TLR9 (p < 0.01) were increased in the HSPCs of APP/PS1 mice compared to that observed in the control group (n = 5) (Fig. 4C). IL-1β expression was increased while that of IL18 was unchanged (Fig. 4D).
Protein levels of select factors, S100A8, S100A9 and HMGb1, were then analyzed in the BM-supernatants by western blotting and were normalized to the total protein detected by Ponceau S. Both monomers and dimers of S100A8 and S100A9 were detected in the BM-supernatants however dimers of either of the proteins was higher in the APP/PS1 compared to that observed in the BM-supernatants of control mice (p < 0.05) (Fig. 4E, F, H, I) however the concentrations of monomers were similar in both groups. Along similar lines, HMGb1 concentration was higher in the BM-supernatants of APP/PS1 mice compared to the WT control (p < 0.05) (Fig. 4G–I).
Fig. 4
Increased expression of pro-myelopoietic/pro-inflammatory factors in the bone marrow hematopoietic stem/progenitor cells (HSPCs) of APP/PS1 mice. A– D) Gene expression was normalized to the β-actin. The relative gene expression was higher for NLRP1 (*p < 0.05), NLRP3 (*p < 0.05), and AIM2 (*p < 0.05) (A), CMA1 (*p < 0.05) (B), S100A8 (*p < 0.001), S100A9 (*p < 0.001), HMGb1 (*p < 0.05), RAGE (*p < 0.01), TLR4 (*p < 0.001), and TLR9 (*p < 0.001) (C) and IL1β (*p < 0.05) (D) in the HSPCs of APP/PS1 mice compare to the control while that of NLRC4 (A), PU.1 (B) and IL18 (D) were unchanged. E– G) Shown were representative optical density images of western blots of S100A8 (E), S100A9 (F), and HMGb1 and the Ponceau S staining of total protein (G) in the bone marrow supernatants. I) Protein expression of the dimers of S100A8 or S100A9 and HMGb1 was higher (*p < 0.05, n = 4) in the BM-supernatants of APP/PS1 mice compared to that of control while the protein levels of the monomers were unchanged. Data sets were analyzed by using Mann-Whitney test.
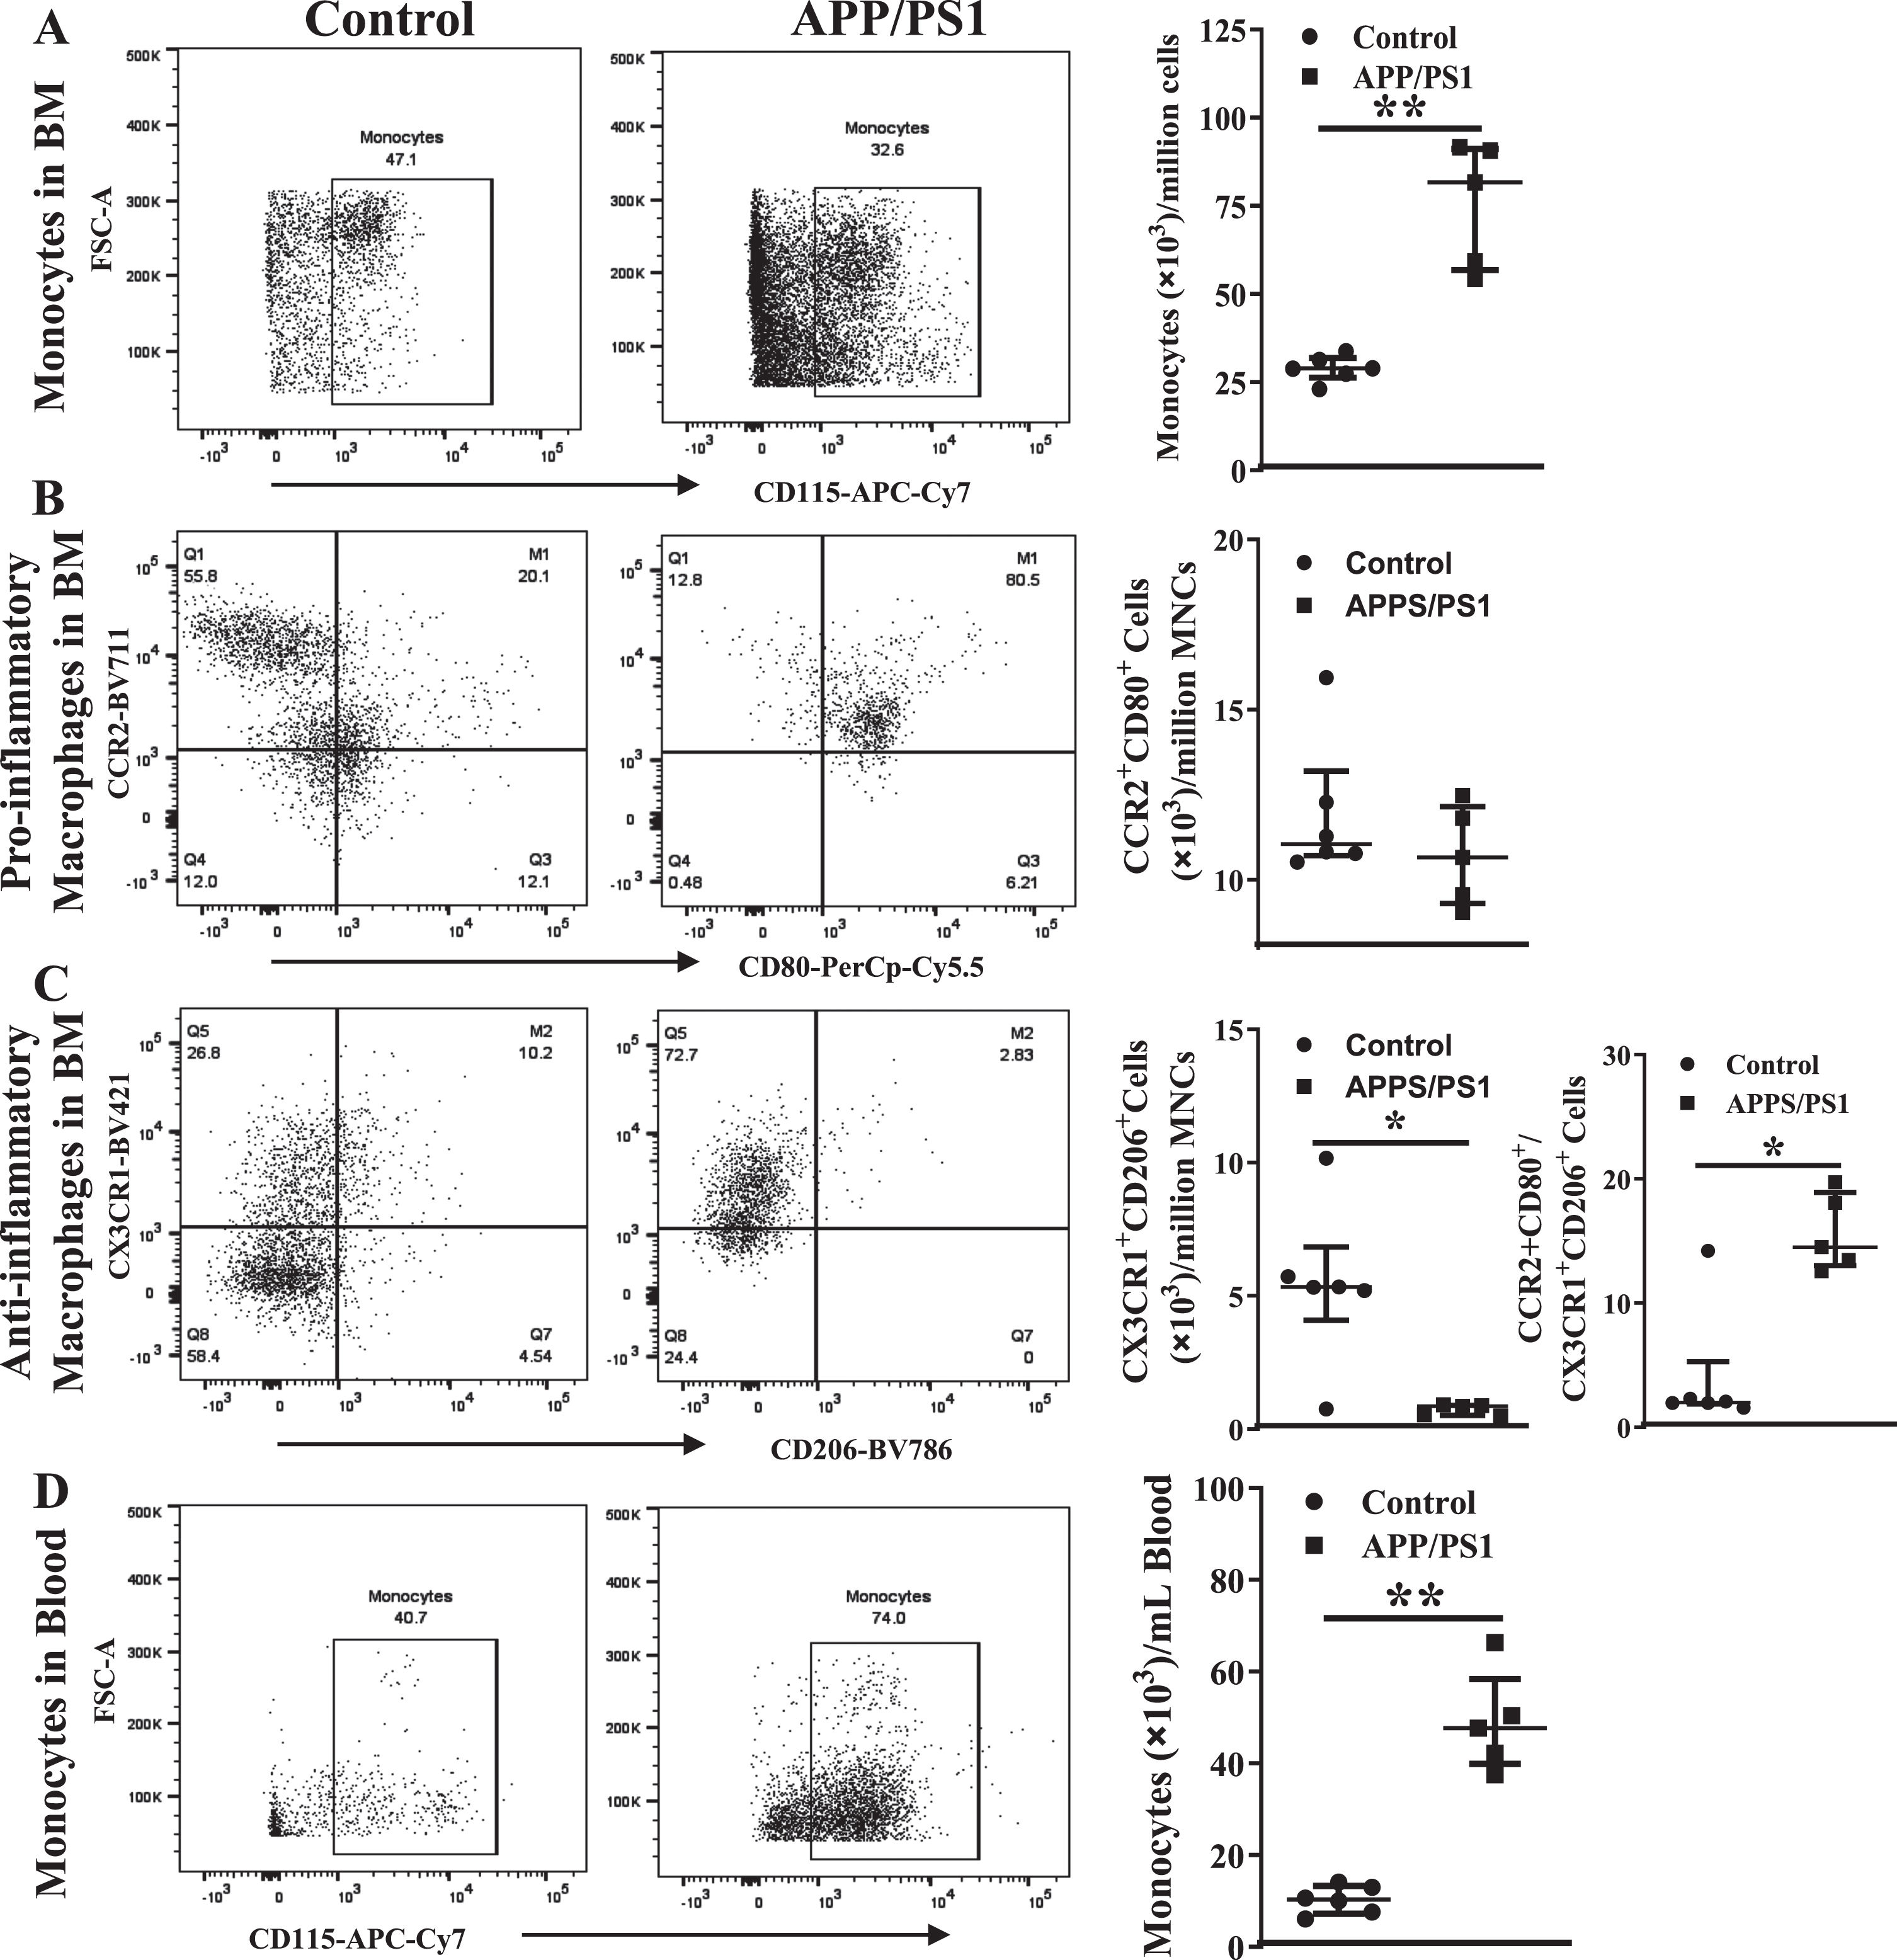
Inflammatory cells in the circulation and bone marrow are higher in the APP/PS1 mice
In agreement with the in vitro CFU-GM assays, the number of monocytes (CD45+Ly6G– LyC+CD115+) in the peripheral blood were higher in the APP/PS1 mice ((80±9)×103/mL, n = 6) compared to that observed in the control mice ((29±2)×103/mL, n = 5, p < 0.01) (Fig. 5A) per million BM-MNCs. However, in contrast to that observed in the clonogenic assay, the number of pro-inflammatory macrophages (CD45+ Ly6G–Ly6C+CD11b+F4/80+CCR2+CD80+) in the APP/PS1 BM was similar to that observed in the control (Fig. 5B) while the anti-inflammatory macrophages (CD45+Ly6G–Ly6C+CD11b+F4/80+CX3CR1+CD206+) were lower in the APP/PS1 group ((6±1)×103, n = 6 versus WT: (11±2)×103, n = 5, p < 0.01) (Fig. 5C). As observed in the clonogenic assay, the ratio of pro-versus anti-inflammatory macrophages was higher in the APP/PS1 (16±2) compared to the control BM (4±2, p < 0.05). The number of monocytes was increased in the peripheral blood in accordance with the observed increase in the BM ((49±6)×103, n = 6) (Fig. 5D) of APP/PS1 mice compared to the control ((10±1)×103, n = 5, p < 0.01). Neither of the macrophage populations were detected in the peripheral blood derived from either of the mouse models.
Fig. 5
Increased numbers of monocyte-macrophages in the circulation and the bone marrow of APP/PS1 mice. Representative flow cytometry dot plots for the enumeration of monocyte-macrophages in the bone marrow (A– C) and blood (D). Monocytes (CD45+Ly6G−Ly6C+CD115+) were higher (**p < 0.01) (A) and the anti-inflammatory macrophages (CD45+CD11b+Ly6G−Ly6C+F4/80+CX3CR1+CD206+) were lower (*p < 0.05) (B) in the APP/PS1 bone marrow (n = 6) compared to that in the control (n = 5) while the pro-inflammatory macrophages (CD45+CD11b+Ly6G−Ly6C+F4/80+CCR2+CD80+) (C) were not different. Ratios of pro-/anti-inflammatory macrophages were significantly higher in the APP/PS1 bone marrow compared to the control (*p < 0.05). The number of monocytes in the circulation was higher (D) in the APP/PS1 compared to control (**p < 0.01). Mann-Whitney test was used to analyze the datasets for statistical significance.
Increased infiltration of the frontal cortex of APP/PS1 mice with inflammatory cells
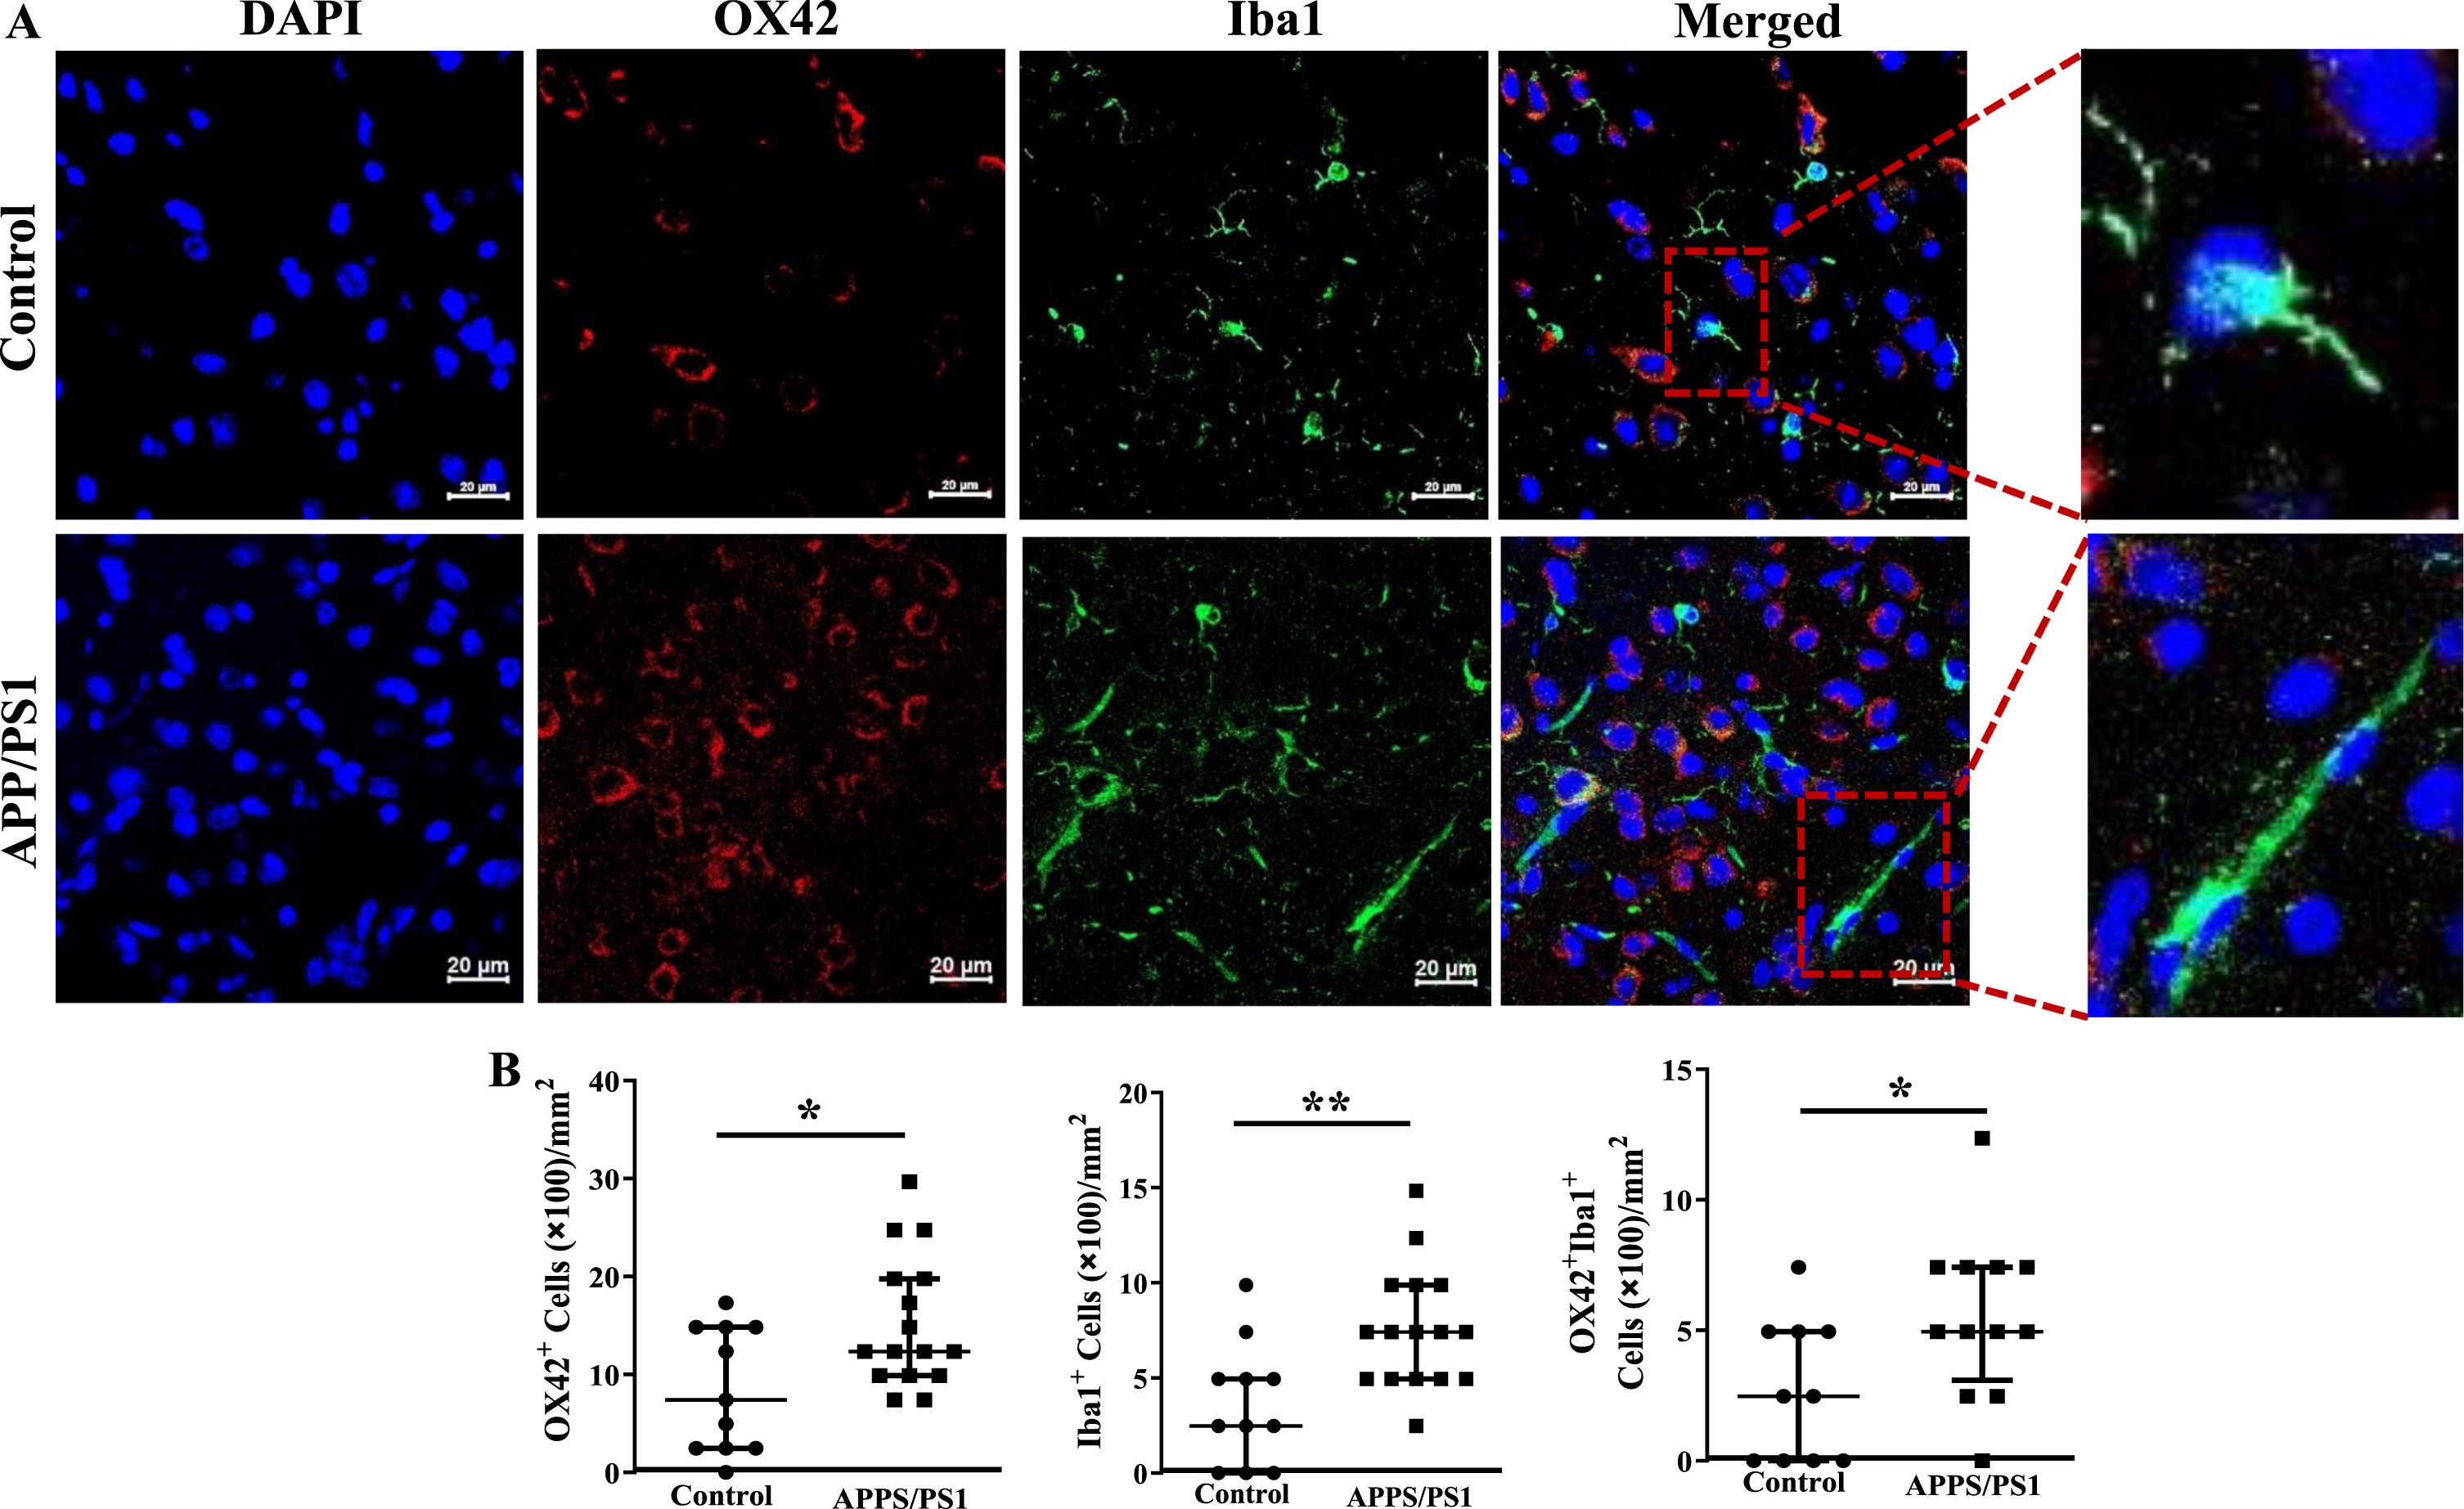
Fixed sections of frontal cortex derived from mice were analyzed for the presence of inflammatory cells by immunocytochemistry. CD11b+, F4/80+ or the dual positive cells per millimeter2 area were higher in the frontal cortices of APP/PS1 mice compared to that observed in the control group (p < 0.05) (Fig. 6A, B). Along similar lines, CX3CR1+ cells were lower (p < 0.001) and CD80+ cells were higher (p < 0.001) in the frontal cortices of APP/PS1 compared to that observed in the control mice (Fig. 6C, D). Lastly, microglial cells were characterized by using OX42 and Iba1 expressions. The number of OX42+ (p < 0.05), Iba1+ (p < 0.01), or the dual positive cells (p < 0.05) were higher in the frontal cortices of APP/PS1 mice compared to that observed in the control group (Fig. 7A, C). Morphological appearance of Iba1+ cells indicated that microglia in the APP/PS1 mice are activated as manifested by elongated processes (Fig. 7B).
Fig. 6
Increased number of inflammatory macrophage in the frontal cortices of APP/PS1 mice. A) Shown were representative immunofluorescence images of frontal cortices derived from control and APP/PS1 mice stained for nuclei (DAPI), CD11b or F4/80. Scale bar measures 20 microns. B) CD11b+ or F4/80+ or the dual positive cells were higher in the APP/PS1 mice (*p < 0.05, n = 6) compared to the control (n = 5). C) Shown were representative immunofluorescence images of frontal cortices derived from control and APP/PS1 mice stained for nuclei (DAPI), CX3CR1 or CD80. Scale bar measures 20 microns. D) CD80+ cells were higher in the APP/PS1 mice (*p < 0.001, n = 6) compared to the control (n = 5), while the number of CX3CR1+ cells was similar in both groups. Datasets were compared by Mann-Whitney test for statistical significance.
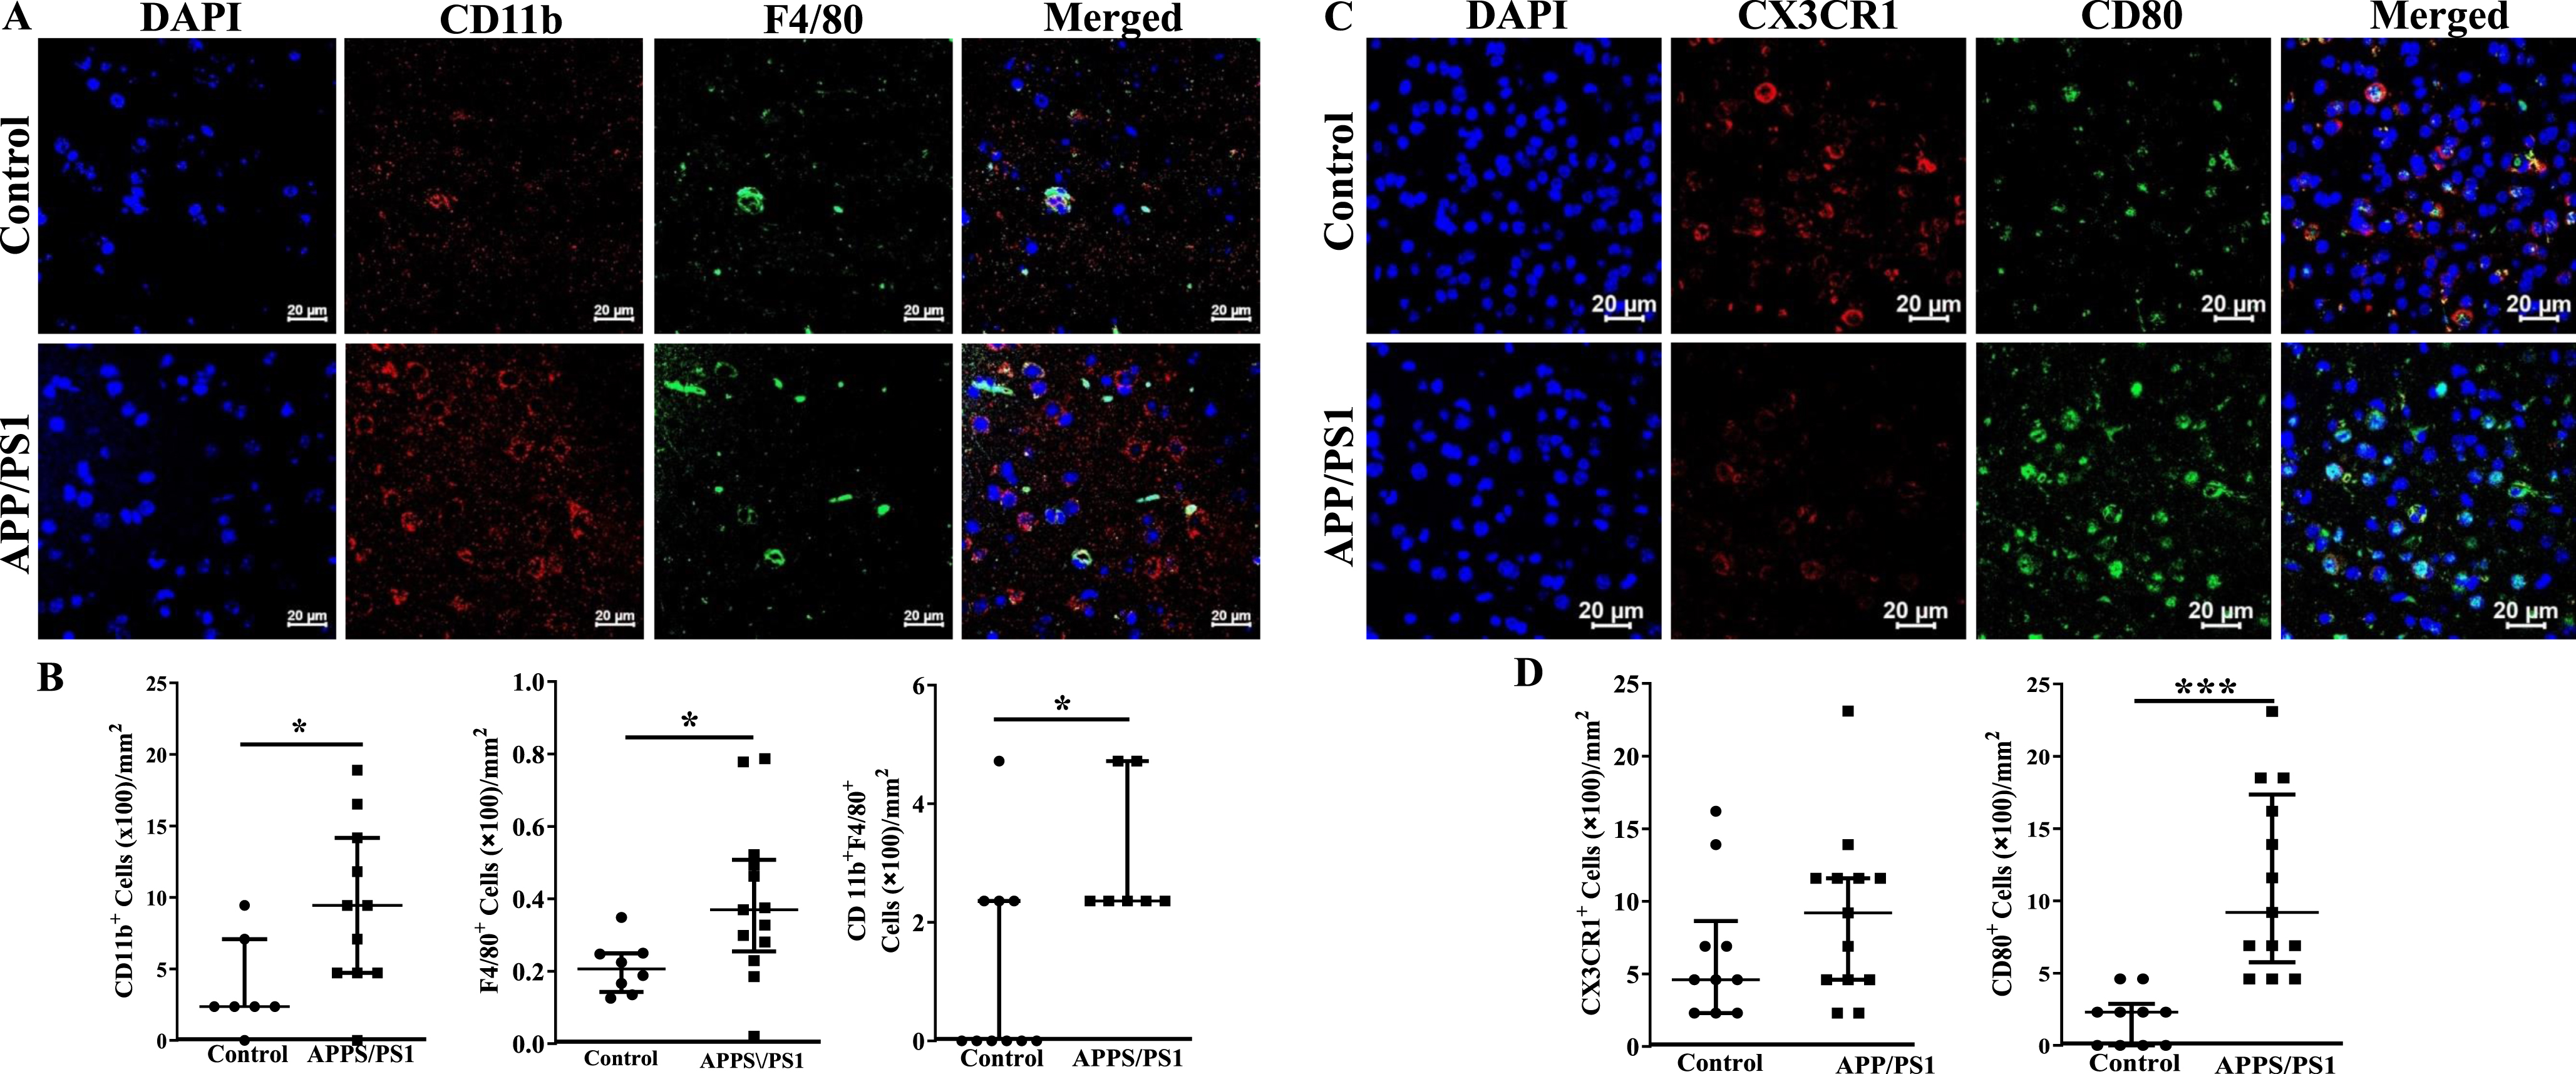
Fig. 7
Increased number of inflammatory macrophage in the frontal cortices of APP/PS1 mice. A) Shown were representative immunofluorescence images of frontal cortices derived from control and APP/PS1 mice stained for nuclei (DAPI), Ox42, or Iba1. Scale bar measures 20 microns. B) Ox42+ (*p < 0.05) or Iba1+ (*p < 0.05) or the dual positive cells (*p < 0.01) were higher in the APP/PS1 mice (*p < 0.05, n = 6) compared to the control (n = 5).
DISCUSSION
This study reports for the first time that vasculogenic progenitor cells are lower in the APP/PS1 mice and provides preliminary evidence for a dysregulated hematopoiesis in the BM with changes in selected populations of HSPCs. Increased inflammatory monocyte-macrophages and microglia in the frontal cortex involves upregulation of myelopoiesis in the BM with increased generation of monocytes that are mobilized into the blood stream. Decreased microvascular density in the frontal cortex is likely due to reduced regenerative reserve as well as due to local inflammatory stress.
Microvascular density in the frontal cortex and vascular regenerative reserve in APP/PS1 mice
Literature shows contradicting reports on alterations in the microvascular density in APP/PS1 mice. While some studies showed decreased vascularity [38, 39], others reported no change [40, 41] or even increased vascular density [42, 43]. Selected studies that reported altered cerebrovascular reactivity or dilation, which implied cerebral hypoperfusion did not report vascular density [44, 45]. Here, we show evidence for decreased vascular density by using two different routinely used markers for vascular endothelium, CD31 and CD34, which is supported by decreased vascular regenerative potential due to reduced vasculogenic progenitor cells in the circulation. Vasculogenic progenitor cells, a subpopulation of HSPCs, provide impetus for vascular regeneration largely via paracrine mechanisms [19, 46]. A high oxygen consumption by brain tissue and limited cerebral energy reserves requires tight neurovascular coupling for optimal physiological functions. Decreased vascular density and the regenerative capacity collectively lead to hypoperfusion that impair optimal brain function by inducing neurovascular uncoupling within the metabolically active brain regions [47]. Importantly, hypoperfusion of the central nervous system impairs clearance of Aβ from the brain parenchyma, which was shown in Alzheimer’s disease [48].
Myelopoietic bias and local inflammatory environment in the APP/PS1 bone marrow
This study is first to report dysregulation of hematopoiesis characterized by decreased LT-HSCs and MPP2 and increased populations of MPP4, CLP, CMP, MyP, and GMPs in the BM. While decreased number of LT-HSCs negatively impact the overall regenerative capacity of generating different blood cells, increases in CLP, CMP, MyP, and GMPs point to the increased myelopoietic fate of HSCs in this model. Our study further evaluated the potential of BM cells to generate pro-inflammatory cells. The ex vivo clonogenic assays resulted in increased generation of monocytes and increased ratio of pro-/anti-inflammatory macrophages by BM cells from APP/PS1 mice. In agreement with this, number of monocytes and the ratio of pro-/anti-inflammatory macrophages were increased in the BM.
While the ratio of increased ratio of pro-/anti-inflammatory macrophages was observed in the BM and in the in vitro clonogenic assays, discrepancy was observed in the generation of pro-inflammatory macrophages, increased in the in vitro assays while unchanged in the BM, and the anti-inflammatory macrophages, unchanged in the in vitro assays while decreased in the BM. The discrepancy may be due to the factors and the respective concentrations that are present in the CFU-GM assay medium, IL3, IL6, and stem cell factor; myelopoietic differentiation in the assay appears to be exclusively in response to IL3 and IL6 compared to the diverse nature of paracrine factors in the BM-microenvironment. Further investigation is required if the CFU-GM assay composition is optimal for obtaining physiologically relevant outcomes.
Our study further showed evidence for increased expression of genes indicative of pro-myelopoietic potential and upregulation of pro-inflammatory signaling in the APP/PS1 BM-HSPCs and increased levels of selected factors in the BM-supernatants. NLRP1, NLRP3, AIM2, and CMA1 gene expressions that are known to be pro-myelopoietic were increased in the BM-HSPCs of APP/PS1 mice. Other factors with pro-myelopoietic and pro-inflammatory functions, IL1β, S100A8, S100A9, and HMGb1 were higher, which correlated with elevated protein levels of S100A8, S100A9, and HMGb1. As the receptor for alarmins RAGE [49] was also increased, RAGE-ligand signaling is likely to be overactivated in the HSPCs of APP/PS1 mice. Extracellular HMGb1 mediates inflammation by enhancing differentiation of myeloid progenitor cells and by inducing migration, proliferation and differentiation of monocyte-macrophages via RAGE [50, 51]. S100A8/A9, derived from BM-cells were shown to promote myelopoiesis in BM-HSPCs largely via RAGE or TLR4 or TLR9 with common downstream signaling molecule, NFκB, that triggers gene transcription of pro-inflammatory factors [52–55]. RAGE binding affinity is highest for the heterodimer S100A8/A9 aka calprotectin [56], which was not determined in this study. Homodimers show variable potency which is relatively lower than the heterodimer in inducing gene transcription of pro-inflammatory molecules [57–59]. Importantly, S100A9 homodimers effectively induce CD11b expression/affinity in monocytes and promote their activation [60, 61]. Our data indicate that S100A8 or S100A9 dimers and HMGb1 that were increased in the BM-HSPCs of APP/PS1 mice largely contribute to the upregulated myelopoiesis via acting on RAGE, TLR4 and TLR9.
Myeloid response in the brain of APP/PS1 mice
Importantly, APP/PS1 mice have increased number of monocytes in the blood circulation compared to the WT indicating elevated systemic inflammatory stress in agreement with the increased macrophages and microglia in the frontal cortex. Pro-inflammatory macrophages CD11b+F4/80+ or CD80+ and OX42+Iba1+ cells were higher while the anti-inflammatory CX3CR1+ cells were lower in the frontal cortex. Elevated pro-inflammatory environment was shown to impair synaptic plasticity and neurogenesis in the hippocampus and frontal cortex [62, 63]. Previous studies showed compelling evidence for BM origin of brain microglia. BM-derived monocytes were shown to migrate across the BBB into the brain in the post-natal life and differentiate into microglia in the parenchyma [64, 65]. AD brains are characterized by profound inflammation [66, 67], largely contributed by the activated microglia [67, 68]. While microglia may be protective via phagocytosis of Aβ oligomers and fibrils [69, 70], sustained activation of brain microglia is detrimental to the neuronal structures and synapses via pro-inflammatory stress [71].
Inflammatory mediators accelerate the development of vascular cognitive impairment reflecting an association between inflammation as a risk factors for microvascular regeneration [72, 73]. Previous studies have shown that Aβ plaques in APPSwe mice are closely associated with brain microvasculature thus producing pro-inflammatory influence of microglia on the microvasculature [74]. Neuroinflammation also promotes vascular dysfunction, vasoconstriction, and remodeling, which lead to hypoperfusion and ischemia [75, 76].
Study findings suggest pathological similarities with aging or diabetes, which increases risk for vascular cognitive impairment [77]. Myelopoietic bias with aging or diabetes at the expense of leukocytosis or erythropoiesis was reported previously [78, 79]. Both of these conditions are associated with decreased number of circulating vasculogenic progenitor cells [80, 81]. APP/PS1 mice showed impaired glucose tolerance, hyperinsulinemia and hypercholesterolemia without increased HDL to oral sucrose [82]. Furthermore, cerebral amyloid angiopathy with myeloid deposits on vessel walls characterized by thioflavin S staining and vessel wall disruption with parenchymal hemorrhage in the leptomeningeal vasculature at 6 months of age were also reported in this model [83]. Previous studies involving wild-derived mice expressing both AD mutations, APPswe and PS1de9 demonstrated strong myeloid response in the brain as assessed by transcriptional signatures and IBA1+ cells in the frontal cortex [84]. However, these studies did not evaluate BM or the circulating monocyte-macrophages or stem/progenitor populations in the BM. Our study infers that genetic overexpression of Aβ in the brain induces perturbations in the highly regulated hierarchical BM hematopoiesis. Further research is warranted to understand brain-BM axis that is involved in the phenotypic switch to the myeloid bias in the APP/PS1mice.
In conclusion, the study showed evidence for the proinflammatory environment in the BM with enhanced myelopoiesis that likely contribute to the systemic inflammation and to the infiltration of pro-inflammatory monocyte-macrophages in the cortical areas. Local pro-inflammatory environment and decreased vasculogenic progenitor cells due to the myelopoietic bias are likely mediators of microvascular rarefaction. Importantly, study supports using this model for evaluating novel molecules that promote vasculogenic functions and ameliorate dysregulated hematopoiesis, for their potential to prevent or reverse cognitive decline in this model. These findings will potentially contribute to development of interventions or pharmacological strategies to alleviate neuroinflammation or to enhance vascularization of brain regions for preventing or reversing the cognitive decline in AD patients. While the study showed preliminary evidence for the central regulation of BM-hematopoiesis by the overexpression of APP/PS1 mutations in the brain a comprehensive examination of this phenomenon is imperative to unravel the intricate interplay between inflammation, microvascular rarefaction and pathological hallmarks of AD.
Limitations
Although the study shed light onto a previously unknown pathological involvement of BM in the widely used mouse model of AD, it is not free from limitations. Cumulative evidence supports sex-differences in the development of AD [85], but the current study did not address the sex-dependent differences in the experimental endpoints particularly those in vasculogenesis and inflammation. This study was not focused on evaluating time-dependent changes in the tested parameters and cognitive decline, which would otherwise provide a causal relationship between vasculogenesis, myelopoiesis, inflammation, and AD. Importantly, the study did not address if the genetic mutations are in anyway involved in the decreased vascularity or regenerative reserve, myelopoiesis and inflammation. Systematic studies are required to address the above limitations and to have comprehensive understanding of the complex interplay between the multitude of factors.
AUTHOR CONTRIBUTIONS
Kishore Chittimalli (Investigation; Methodology); Stephen Adkins (Methodology; Software; Supervision); Sanjay Arora (Methodology); Jagdish Singh (Animal model); Yagna Jarajapu (Conceptualization; Data curation; Formal analysis; Funding acquisition; Resources; Writing – original draft; Writing – review & editing).
ACKNOWLEDGMENTS
The content is solely the responsibility of the authors and does not necessarily represent the official views of the National Institutes of Health.
FUNDING
The research carried out in the present study was partly supported by National Institute of Aging of National Institutes of Health [AG056881]. Flow cytometry and cell sorter core at the University of North Dakota was supported by an Institutional Development Award (IDeA) Networks of Biomedical Research Excellence from the National Institute of General Medical Sciences of the National Institutes of Health [P20GM103442].
CONFLICT OF INTEREST
The authors have no conflict of interest to report.
DATA AVAILABILITY
All datasets generated and analyzed for this study are included in this article. Access to raw files, where applicable, can be provided by the corresponding author upon request.
SUPPLEMENTARY MATERIAL
[1] The supplementary material is available in the electronic version of this article: https://dx.doi.org/10.3233/ADR-240024.
REFERENCES
[1] | Heneka MT , Carson MJ , El Khoury J , Landreth GE , Brosseron F , Feinstein DL , Jacobs AH , Wyss-Coray T , Vitorica J , Ransohoff RM , Herrup K , Frautschy SA , Finsen B , Brown GC , Verkhratsky A , Yamanaka K , Koistinaho J , Latz E , Halle A , Petzold GC , Town T , Morgan D , Shinohara ML , Perry VH , Holmes C , Bazan NG , Brooks DJ , Hunot S , Joseph B , Deigendesch N , Garaschuk O , Boddeke E , Dinarello CA , Breitner JC , Cole GM , Golenbock DT , Kummer MP ((2015) ) Neuroinflammation in Alzheimer’s disease. Lancet Neurol 14: , 388–405. |
[2] | McGeer EG , McGeer PL ((2003) ) Inflammatory processes in Alzheimer’s disease. Prog Neuropsychopharmacol Biol Psychiatry 27: , 741–749. |
[3] | Arnold L , Henry A , Poron F , Baba-Amer Y , van Rooijen N , Plonquet A , Gherardi RK , Chazaud B ((2007) ) Inflammatory monocytes recruited after skeletal muscle injury switch into antiinflammatory macrophages to support myogenesis. J Exp Med 204: , 1057–1069. |
[4] | Kain V , Prabhu SD , Halade GV ((2014) ) Inflammation revisited: Inflammation versus resolution of inflammation following myocardial infarction. Basic Res Cardiol 109: , 444. |
[5] | Shi Q , Rafii S , Wu MH , Wijelath ES , Yu C , Ishida A , Fujita Y , Kothari S , Mohle R , Sauvage LR , Moore MA , Storb RF , Hammond WP ((1998) ) Evidence for circulating bone marrow-derived endothelial cells. Blood 92: , 362–367. |
[6] | Crane MJ , Daley JM , van Houtte O , Brancato SK , Henry WL Jr. , Albina JE ((2014) ) The monocyte to macrophage transition in the murine sterile wound. PLoS One 9: , e86660. |
[7] | Berg KE , Ljungcrantz I , Andersson L , Bryngelsson C , Hedblad B , Fredrikson GN , Nilsson J , Bjorkbacka H ((2012) ) Elevated CD14++CD16- monocytes predict cardiovascular events. Circ Cardiovasc Genet 5: , 122–131. |
[8] | Hopfner F , Jacob M , Ulrich C , Russ M , Simm A , Silber RE , Girndt M , Noutsias M , Werdan K , Schlitt A ((2019) ) Subgroups of monocytes predict cardiovascular events in patients with coronary heart disease. The PHAMOS trial (Prospective Halle Monocytes Study). Hellenic J Cardiol 60: , 311–321. |
[9] | Purton LE , Scadden DT ((2007) ) Limiting factors in murine hematopoietic stem cell assays. Cell Stem Cell 1: , 263–270. |
[10] | Guzik TJ , Hoch NE , Brown KA , McCann LA , Rahman A , Dikalov S , Goronzy J , Weyand C , Harrison DG ((2007) ) Role of the T cell in the genesis of angiotensin II induced hypertension and vascular dysfunction. J Exp Med 204: , 2449–2460. |
[11] | Ruparelia N , Chai JT , Fisher EA , Choudhury RP ((2017) ) Inflammatory processes in cardiovascular disease: A route to targeted therapies. Nat Rev Cardiol 14: , 314. |
[12] | Maler JM , Spitzer P , Lewczuk P , Kornhuber J , Herrmann M , Wiltfang J ((2006) ) Decreased circulating CD34+stem cells in early Alzheimer’s disease: Evidence for a deficient hematopoietic brain support? Mol Psychiatry 11: , 1113–1115. |
[13] | Lees KR ((2009) ) Stroke: Success for extending acute treatment. Lancet Neurol 8: , 2–4. |
[14] | Nation DA , Tan A , Dutt S , McIntosh EC , Yew B , Ho JK , Blanken AE , Jang JY , Rodgers KE , Gaubert A ((2018) ) Circulating progenitor cells correlate with memory, posterior cortical thickness, and hippocampal perfusion. J Alzheimers Dis 61: , 91–101. |
[15] | Moazzami K , Wittbrodt MT , Lima BB , Kim JH , Hammadah M , Ko YA , Obideen M , Abdelhadi N , Kaseer B , Gafeer MM , Nye JA , Shah AJ , Ward L , Raggi P , Waller EK , Bremner JD , Quyyumi AA , Vaccarino V ((2020) ) Circulating progenitor cells and cognitive impairment in men and women with coronary artery disease. J Alzheimers Dis 74: , 659–668. |
[16] | Sardi F , Fassina L , Venturini L , Inguscio M , Guerriero F , Rolfo E , Ricevuti G ((2011) ) Alzheimer’s disease, autoimmunity and inflammation. The good, the bad and the ugly. Autoimmun Rev 11: , 149–153. |
[17] | Geissmann F , Jung S , Littman DR ((2003) ) Blood monocytes consist of two principal subsets with distinct migratory properties. Immunity 19: , 71–82. |
[18] | Majka M , Janowska-Wieczorek A , Ratajczak J , Ehrenman K , Pietrzkowski Z , Kowalska MA , Gewirtz AM , Emerson SG , Ratajczak MZ ((2001) ) Numerous growth factors, cytokines, and chemokines are secreted by human CD34(+) cells, myeloblasts, erythroblasts, and megakaryoblasts and regulate normal hematopoiesis in an autocrine/paracrine manner. Blood 97: , 3075–3085. |
[19] | Urbich C , Aicher A , Heeschen C , Dernbach E , Hofmann WK , Zeiher AM , Dimmeler S ((2005) ) Soluble factors released by endothelial progenitor cells promote migration of endothelial cells and cardiac resident progenitor cells. J Mol Cell Cardiol 39: , 733–742. |
[20] | Ziebart T , Yoon CH , Trepels T , Wietelmann A , Braun T , Kiessling F , Stein S , Grez M , Ihling C , Muhly-Reinholz M , Carmona G , Urbich C , Zeiher AM , Dimmeler S ((2008) ) Sustained persistence of transplanted proangiogenic cells contributes to neovascularization and cardiac function after ischemia. Circ Res 103: , 1327–1334. |
[21] | Medina RJ , Barber CL , Sabatier F , Dignat-George F , Melero-Martin JM , Khosrotehrani K , Ohneda O , Randi AM , Chan JKY , Yamaguchi T , Van Hinsbergh VWM , Yoder MC , Stitt AW ((2017) ) Endothelial progenitors: A consensus statement on nomenclature. Stem Cells Transl Med 6: , 1316–1320. |
[22] | Prinz M , Priller J , Sisodia SS , Ransohoff RM ((2011) ) Heterogeneity of CNS myeloid cells and their roles in neurodegeneration. Nat Neurosci 14: , 1227–1235. |
[23] | Malm TM , Koistinaho M , Pärepalo M , Vatanen T , Ooka A , Karlsson S , Koistinaho J ((2005) ) Bone-marrow-derived cells contribute to the recruitment of microglial cells in response to beta-amyloid deposition in APP/PS1 double transgenic Alzheimer mice. Neurobiol Dis 18: , 134–142. |
[24] | Holmes C , Cunningham C , Zotova E , Woolford J , Dean C , Kerr S , Culliford D , Perry VH ((2009) ) Systemic inflammation and disease progression in Alzheimer disease. Neurology 73: , 768–774. |
[25] | Barman PK , Urao N , Koh TJ ((2019) ) Diabetes induces myeloid bias in bone marrow progenitors associated with enhanced wound macrophage accumulation and impaired healing. J Pathol 249: , 435–446. |
[26] | Pang J , Maienschein-Cline M , Koh TJ ((2021) ) Enhanced proliferation of Ly6C(+) monocytes/macrophages contributes to chronic inflammation in skin wounds of diabetic mice. J Immunol 206: , 621–630. |
[27] | Shen Z , Kuang S , Zhang M , Huang X , Chen J , Guan M , Qin W , Xu HHK , Lin Z ((2021) ) Inhibition of CCL2 by bindarit alleviates diabetes-associated periodontitis by suppressing inflammatory monocyte infiltration and altering macrophage properties. Cell Mol Immunol 18: , 2224–2235. |
[28] | Nation DA , Sweeney MD , Montagne A , Sagare AP , D’Orazio LM , Pachicano M , Sepehrband F , Nelson AR , Buennagel DP , Harrington MG , Benzinger TLS , Fagan AM , Ringman JM , Schneider LS , Morris JC , Chui HC , Law M , Toga AW , Zlokovic BV ((2019) ) Blood-brain barrier breakdown is an early biomarker of human cognitive dysfunction. Nat Med 25: , 270–276. |
[29] | Montagne A , Barnes SR , Sweeney MD , Halliday MR , Sagare AP , Zhao Z , Toga AW , Jacobs RE , Liu CY , Amezcua L , Harrington MG , Chui HC , Law M , Zlokovic BV ((2015) ) Blood-brain barrier breakdown in the aging human hippocampus. Neuron 85: , 296–302. |
[30] | Faraco G , Sugiyama Y , Lane D , Garcia-Bonilla L , Chang H , Santisteban MM , Racchumi G , Murphy M , Van Rooijen N , Anrather J , Iadecola C ((2016) ) Perivascular macrophages mediate the neurovascular and cognitive dysfunction associated with hypertension. J Clin Invest 126: , 4674–4689. |
[31] | Jankowsky JL , Fadale DJ , Anderson J , Xu GM , Gonzales V , Jenkins NA , Copeland NG , Lee MK , Younkin LH , Wagner SL , Younkin SG , Borchelt DR ((2004) ) Mutant presenilins specifically elevate the levels of the 42 residue beta-amyloid peptide in vivo: Evidence for augmentation of a 42-specific gamma secretase. Hum Mol Genet 13: , 159–170. |
[32] | Oakley H , Cole SL , Logan S , Maus E , Shao P , Craft J , Guillozet-Bongaarts A , Ohno M , Disterhoft J , Van Eldik L , Berry R , Vassar R ((2006) ) Intraneuronal beta-amyloid aggregates, neurodegeneration, and neuron loss in transgenic mice with five familial Alzheimer’s disease mutations: Potential factors in amyloid plaque formation. J Neurosci 26: , 10129–10140. |
[33] | Reiserer RS , Harrison FE , Syverud DC , McDonald MP ((2007) ) Impaired spatial learning in the APPSwe+PSEN1DeltaE9 bigenic mouse model of Alzheimer’s disease. Genes Brain Behav 6: , 54–65. |
[34] | Bernardo A , Harrison FE , McCord M , Zhao J , Bruchey A , Davies SS , Jackson Roberts L 2nd , Mathews PM , Matsuoka Y , Ariga T , Yu RK , Thompson R , McDonald MP ((2009) ) Elimination of GD3 synthase improves memory and reduces amyloid-beta plaque load in transgenic mice. Neurobiol Aging 30: , 1777–1791. |
[35] | Knafo S , Venero C , Merino-Serrais P , Fernaud-Espinosa I , Gonzalez-Soriano J , Ferrer I , Santpere G , DeFelipe J ((2009) ) Morphological alterations to neurons of the amygdala and impaired fear conditioning in a transgenic mouse model of Alzheimer’s disease. J Pathol 219: , 41–51. |
[36] | Cramer PE , Cirrito JR , Wesson DW , Lee CY , Karlo JC , Zinn AE , Casali BT , Restivo JL , Goebel WD , James MJ , Brunden KR , Wilson DA , Landreth GE ((2012) ) ApoE-directed therapeutics rapidly clear β-amyloid and reverse deficits in AD mouse models. Science 335: , 1503–1506. |
[37] | Schneider CA , Rasband WS , Eliceiri KW ((2012) ) NIH Image to ImageJ: 25 years of image analysis. Nat Methods 9: , 671–675. |
[38] | Kitaguchi H , Ihara M , Saiki H , Takahashi R , Tomimoto H ((2007) ) Capillary beds are decreased in Alzheimer’s disease, but not in Binswanger’s disease. Neurosci Lett 417: , 128–131. |
[39] | Lee GD , Aruna JH , Barrett PM , Lei DL , Ingram DK , Mouton PR ((2005) ) Stereological analysis of microvascular parameters in a double transgenic model of Alzheimer’s disease. Brain Res Bull 65: , 317–322. |
[40] | Hunter JM , Kwan J , Malek-Ahmadi M , Maarouf CL , Kokjohn TA , Belden C , Sabbagh MN , Beach TG , Roher AE ((2012) ) Morphological and pathological evolution of the brain microcirculation in aging and Alzheimer’s disease. PLoS One 7: , e36893. |
[41] | Rancillac A , Geoffroy H , Rossier J ((2012) ) Impaired neurovascular coupling in the APPxPS1 mouse model of Alzheimer’s disease. Curr Alzheimer Res 9: , 1221–1230. |
[42] | Richard E , Gouw AA , Scheltens P , van Gool WA ((2010) ) Vascular care in patients with Alzheimer disease with cerebrovascular lesions slows progression of white matter lesions on MRI: The evaluation of vascular care in Alzheimer’s disease (EVA) study. Stroke 41: , 554–556. |
[43] | Zerbi V , Jansen D , Dederen PJ , Veltien A , Hamans B , Liu Y , Heerschap A , Kiliaan AJ ((2013) ) Microvascular cerebral blood volume changes in aging APP(swe)/PS1(dE9) AD mouse model: A voxel-wise approach. Brain Struct Funct 218: , 1085–1098. |
[44] | Dorr A , Sahota B , Chinta LV , Brown ME , Lai AY , Ma K , Hawkes CA , McLaurin J , Stefanovic B ((2012) ) Amyloid-β-dependent compromise of microvascular structure and function in a model of Alzheimer’s disease. Brain 135: , 3039–3050. |
[45] | Nicolakakis N , Hamel E ((2011) ) Neurovascular function in Alzheimer’s disease patients and experimental models. J Cereb Blood Flow Metab 31: , 1354–1370. |
[46] | Capoccia BJ , Shepherd RM , Link DC ((2006) ) G-CSF and AMD3100 mobilize monocytes into the blood that stimulate angiogenesis in vivo through a paracrine mechanism. Blood 108: , 2438–2445. |
[47] | Watts ME , Pocock R , Claudianos C ((2018) ) Brain energy and oxygen metabolism: Emerging role in normal function and disease. Front Mol Neurosci 11: , 216. |
[48] | Bannai T , Mano T , Chen X , Ohtomo G , Ohtomo R , Tsuchida T , Koshi-Mano K , Hashimoto T , Okazawa H , Iwatsubo T , Tsuji S , Toda T , Iwata A ((2019) ) Chronic cerebral hypoperfusion shifts the equilibrium of amyloid β oligomers to aggregation-prone species with higher molecular weight. Sci Rep 9: , 2827. |
[49] | Leclerc E , Fritz G , Vetter SW , Heizmann CW ((2009) ) Binding of S100 proteins to RAGE: An update. Biochim Biophys Acta 1793: , 993–1007. |
[50] | Lotze MT , Tracey KJ ((2005) ) High-mobility group box 1 protein (HMGB1): Nuclear weapon in the immune arsenal. Nat Rev Immunol 5: , 331–342. |
[51] | Klune JR , Dhupar R , Cardinal J , Billiar TR , Tsung A ((2008) ) HMGB1: Endogenous danger signaling. Mol Med 14: , 476–484. |
[52] | Luan ZG , Zhang H , Yang PT , Ma XC , Zhang C , Guo RX ((2010) ) HMGB1 activates nuclear factor-kappaB signaling by RAGE and increases the production of TNF-alpha in human umbilical vein endothelial cells. Immunobiology 215: , 956–962. |
[53] | Adamopoulos C , Piperi C , Gargalionis AN , Dalagiorgou G , Spilioti E , Korkolopoulou P , Diamanti-Kandarakis E , Papavassiliou AG ((2016) ) Advanced glycation end products upregulate lysyl oxidase and endothelin-1 in human aortic endothelial cells via parallel activation of ERK1/2-NF-kappaB and JNK-AP-1 signaling pathways. Cell Mol Life Sci 73: , 1685–1698. |
[54] | Mantelmacher FD , Zvibel I , Cohen K , Epshtein A , Pasmanik-Chor M , Vogl T , Kuperman Y , Weiss S , Drucker DJ , Varol C , Fishman S ((2019) ) GIP regulates inflammation and body weight by restraining myeloid-cell-derived S100A8/A9. Nat Metab 1: , 58–69. |
[55] | Nagareddy PR , Kraakman M , Masters SL , Stirzaker RA , Gorman DJ , Grant RW , Dragoljevic D , Hong ES , Abdel-Latif A , Smyth SS , Choi SH , Korner J , Bornfeldt KE , Fisher EA , Dixit VD , Tall AR , Goldberg IJ , Murphy AJ ((2014) ) Adipose tissue macrophages promote myelopoiesis and monocytosis in obesity. Cell Metab 19: , 821–835. |
[56] | Vogl T , Propper C , Hartmann M , Strey A , Strupat K , van den Bos C , Sorg C , Roth J ((1999) ) S100A12 is expressed exclusively by granulocytes and acts independently from MRP8 and MRP14. J Biol Chem 274: , 25291–25296. |
[57] | Eue I , Konig S , Pior J , Sorg C ((2002) ) S100A8, S100A9 and the S100A8/A9 heterodimer complex specifically bind to human endothelial cells: Identification and characterization of ligands for the myeloid-related proteins S100A9 and S100A8/A9 on human dermal microvascular endothelial cell line-1 cells. Int Immunol 14: , 287–297. |
[58] | Ehlermann P , Eggers K , Bierhaus A , Most P , Weichenhan D , Greten J , Nawroth PP , Katus HA , Remppis A ((2006) ) Increased proinflammatory endothelial response to S100A8/A9 after preactivation through advanced glycation end products. Cardiovasc Diabetol 5: , 6. |
[59] | Ichikawa M , Williams R , Wang L , Vogl T , Srikrishna G ((2011) ) S100A8/A9 activate key genes and pathways in colon tumor progression. Mol Cancer Res 9: , 133–148. |
[60] | Eue I , Pietz B , Storck J , Klempt M , Sorg C ((2000) ) Transendothelial migration of 27E10+ human monocytes. Int Immunol 12: , 1593–1604. |
[61] | Newton RA , Hogg N ((1998) ) The human S100 protein MRP-14 is a novel activator of the beta 2 integrin Mac-1 on neutrophils. J Immunol 160: , 1427–1435. |
[62] | Caraci F , Copani A , Nicoletti F , Drago F ((2010) ) Depression and Alzheimer’s disease: Neurobiological links and common pharmacological targets. Eur J Pharmacol 626: , 64–71. |
[63] | Maes M , Yirmyia R , Noraberg J , Brene S , Hibbeln J , Perini G , Kubera M , Bob P , Lerer B , Maj M ((2009) ) The inflammatory & neurodegenerative (I& ND) hypothesis of depression: Leads for future research and new drug developments in depression. Metab Brain Dis 24: , 27–53. |
[64] | Nakajima K , Kohsaka S ((2001) ) Microglia: Activation and their significance in the central nervous system. J Biochem 130: , 169–175. |
[65] | Priller J , Persons DA , Klett FF , Kempermann G , Kreutzberg GW , Dirnagl U ((2001) ) Neogenesis of cerebellar Purkinje neurons from gene-marked bone marrow cells in vivo . J Cell Biol 155: , 733–738. |
[66] | Meraz-Ríos MA , Toral-Rios D , Franco-Bocanegra D , Villeda-Hernández J , Campos-Peña V ((2013) ) Inflammatory process in Alzheimer’s disease. Front Integr Neurosci 7: , 59. |
[67] | Denver P , McClean PL ((2018) ) Distinguishing normal brain aging from the development of Alzheimer’s disease: Inflammation, insulin signaling and cognition. Neural Regen Res 13: , 1719–1730. |
[68] | Rezai-Zadeh K , Gate D , Town T ((2009) ) CNS infiltration of peripheral immune cells: D-Day for neurodegenerative disease? J Neuroimmune Pharmacol 4: , 462–475. |
[69] | Fu Y , Hsiao JH , Paxinos G , Halliday GM , Kim WS ((2016) ) ABCA7 mediates phagocytic clearance of amyloid-β in the brain. J Alzheimers Dis 54: , 569–584. |
[70] | El-Shimy IA , Heikal OA , Hamdi N ((2015) ) Minocycline attenuates Aβ oligomers-induced pro-inflammatory phenotype in primary microglia while enhancing Aβ fibrils phagocytosis. Neurosci Lett 609: , 36–41. |
[71] | Leszek J , Barreto GE , Gąsiorowski K , Koutsouraki E , Ávila-Rodrigues M , Aliev G ((2016) ) Inflammatory mechanisms and oxidative stress as key factors responsible for progression of neurodegeneration: Role of brain innate immune system. CNS Neurol Disord Drug Targets 15: , 329–336. |
[72] | Fernando MS , Simpson JE , Matthews F , Brayne C , Lewis CE , Barber R , Kalaria RN , Forster G , Esteves F , Wharton SB , Shaw PJ , O’Brien JT , Ince PG ((2006) ) White matter lesions in an unselected cohort of the elderly: Molecular pathology suggests origin from chronic hypoperfusion injury. Stroke 37: , 1391–1398. |
[73] | Iadecola C ((2013) ) The pathobiology of vascular dementia. Neuron 80: , 844–866. |
[74] | Wegiel J , Imaki H , Wang KC , Wronska A , Osuchowski M , Rubenstein R ((2003) ) Origin and turnover of microglial cells in fibrillar plaques of APPsw transgenic mice. Acta Neuropathol 105: , 393–402. |
[75] | Griendling KK , Sorescu D , Ushio-Fukai M ((2000) ) NAD(P)H oxidase: Role in cardiovascular biology and disease. Circ Res 86: , 494–501. |
[76] | Picchi A , Gao X , Belmadani S , Potter BJ , Focardi M , Chilian WM , Zhang C ((2006) ) Tumor necrosis factor-alpha induces endothelial dysfunction in the prediabetic metabolic syndrome. Circ Res 99: , 69–77. |
[77] | Hersi M , Irvine B , Gupta P , Gomes J , Birkett N , Krewski D ((2017) ) Risk factors associated with the onset and progression of Alzheimer’s disease: A systematic review of the evidence. Neurotoxicology 61: , 143–187. |
[78] | Barrett TJ , Murphy AJ , Goldberg IJ , Fisher EA ((2017) ) Diabetes-mediated myelopoiesis and the relationship to cardiovascular risk. Ann N Y Acad Sci 1402: , 31–42. |
[79] | Pang WW , Price EA , Sahoo D , Beerman I , Maloney WJ , Rossi DJ , Schrier SL , Weissman IL ((2011) ) Human bone marrow hematopoietic stem cells are increased in frequency and myeloid-biased with age. Proc Natl Acad Sci U S A 108: , 20012–20017. |
[80] | Joshi S , Montes de Oca I , Maghrabi A , Lopez-Yang C , Quiroz-Olvera J , Garcia CA , Jarajapu YPR ((2021) ) ACE2 gene transfer ameliorates vasoreparative dysfunction in CD34+cells derived from diabetic older adults. Clin Sci (Lond) 135: , 367–385. |
[81] | Joshi S , Chittimalli K , Jahan J , Vasam G , Jarajapu YP ((2021) ) ACE2/ACE imbalance and impaired vasoreparative functions of stem/progenitor cells in aging. Geroscience 43: , 1423–1436. |
[82] | Cao D , Lu H , Lewis TL , Li L ((2007) ) Intake of sucrose-sweetened water induces insulin resistance and exacerbates memory deficits and amyloidosis in a transgenic mouse model of Alzheimer disease. J Biol Chem 282: , 36275–36282. |
[83] | Garcia-Alloza M , Robbins EM , Zhang-Nunes SX , Purcell SM , Betensky RA , Raju S , Prada C , Greenberg SM , Bacskai BJ , Frosch MP ((2006) ) Characterization of amyloid deposition in the APPswe/PS1dE9 mouse model of Alzheimer disease. Neurobiol Dis 24: , 516–524. |
[84] | Onos KD , Uyar A , Keezer KJ , Jackson HM , Preuss C , Acklin CJ , O’Rourke R , Buchanan R , Cossette TL , Sukoff Rizzo SJ , Soto I , Carter GW , Howell GR ((2019) ) Enhancing face validity of mouse models of Alzheimer’s disease with natural genetic variation. PLoS Genet 15: , e1008155. |
[85] | Ferretti MT , Iulita MF , Cavedo E , Chiesa PA , Schumacher Dimech A , Santuccione Chadha A , Baracchi F , Girouard H , Misoch S , Giacobini E , Depypere H , Hampel H , Women’s Brain P, the Alzheimer Precision Medicine I ((2018) ) Sex differences in Alzheimer disease – the gateway to precision medicine. Nat Rev Neurol 14: , 457–469. |
[86] | Challen GA , Boles N , Lin KK , Goodell MA ((2009) ) Mouse hematopoietic stem cell identification and analysis. Cytometry A 75: , 14–24. |
[87] | Pietras EM , Reynaud D , Kang YA , Carlin D , Calero-Nieto FJ , Leavitt AD , Stuart JM , Gottgens B , Passegue E ((2015) ) Functionally distinct subsets of lineage-biased multipotent progenitors control blood production in normal and regenerative conditions. Cell Stem Cell 17: , 35–46. |
[88] | Rose S , Misharin A , Perlman H ((2012) ) A novel Ly6C/Ly6G-based strategy to analyze the mouse splenic myeloid compartment. Cytometry A 81: , 343–350. |


