
A Two-Year Observational Study to Evaluate Conversion Rates from High- and Low-Risk Patients with Amnestic Mild Cognitive Impairment to Probable Alzheimer’s Disease in a Real-World Setting
Abstract
Background:
Predicting conversion to probable Alzheimer&s disease (AD) from amnestic mild cognitive impairment (aMCI) is difficult but important. A nomogram was developed previously for determining the risk of 3-year probable AD conversion in aMCI.
Objective:
To compare the probable AD conversion rates with cognitive and neurodegenerative changes for 2 years from high- and low risk aMCI groups classified using the nomogram.
Methods:
This prospective, multicenter, observational study was conducted in Korea. A total of patients were classified as high- or low-risk aMCI according to the nomogram and followed-up for 2 years to compare the annual conversion rate to probable AD and brain structure changes between the two groups.
Results:
In total, 176 (high-risk, 85; low-risk, 91) and 160 (high-risk, 77; low-risk, 83) patients completed the 1-year and 2-year follow-up, respectively. The probable AD conversion rate was significantly higher in the high-risk (Year 1, 28.9%; Year 2, 46.1%) versus low-risk group (Year 1, 0.0%; Year 2, 4.9%, both p < 0.0001). Mean changes from baseline in Seoul Neuropsychological Screening Battery-Dementia Version, Clinical Dementia Rating-Sum of Box, and Korean version of the Instrumental Activities of Daily Living scores and cortical atrophy index at Years 1 and 2 were significantly greater in the high-risk group (p < 0.0001).
Conclusions:
The high-risk aMCI group, as determined by the nomogram, had a higher conversion rate to probable AD and faster cognitive decline and neurodegeneration change than the low-risk group. These real-world results have clinical implications that help clinicians in accurately predicting patient outcomes and facilitating early decision-making.
Trial Registration: ClinicalTrials.gov (NCT03448445)
INTRODUCTION
Alzheimer’s disease (AD) is the most common cause of dementia worldwide [1]. Mild cognitive impairment (MCI), especially the amnestic type (aMCI), is regarded as a prodromal state of AD dementia [2, 3]. Up to 80% of patients with aMCI are known to progress to AD dementia within 6 years of diagnosis [2], with a 10–15% per year conversion rate to AD dementia [2, 4]. However, several challenges remain in predicting conversion from aMCI to AD, including the heterogeneous clinical nature of aMCI. This means that patients have variable clinical courses, making it difficult to predict the conversion from aMCI to probable AD in the real-world setting. Furthermore, progression rates can also vary between patients, with some patients showing faster progression from aMCI to AD [5]. While several biomarkers have been studied for their potential to predict conversion from aMCI to AD, these tests are limited by their invasive nature, high cost, and lack of standardized thresholds between laboratories [6]. Though difficult, early recognition of patients with MCI at high risk of developing AD in a real-world setting may allow patients to benefit from early therapeutic intervention, before the pathological hallmarks of AD (such as amyloid plaques, cerebral amyloid angiopathy, and neurofibrillary tangles of tau proteins) become established in the brain [7, 8].
There have been many studies investigating predictors for probable AD conversion in aMCI [9–14]. With advances in AD biomarker testing, numerous prediction models incorporating biomarker information such as amyloid-beta (Abeta) in cerebrospinal fluid, amyloid deposition on positron emission tomography, and atrophy measured on brain magnetic resonance imaging (MRI) have been developed and validated. These prediction models require additional testing, which is expensive, inconvenient, and unavailable at some clinical sites. However, clinical features and neuropsychological profiles are easy to obtain and could give clinically meaningful information in predicting probable AD conversion. A previous multicenter study proposed a prediction model, called a nomogram, for predicting probable AD conversion within 3 years in aMCI using only clinical and neuropsychological features [15]. This nomogram allows the stratification of patients into high- and low-risk aMCI subgroups according to a nomogram-based probable AD conversion probability [15].
In this 2-year observational study, we aimed to compare the probable AD conversion rates of the high- and low-risk aMCI groups at Year 1 and Year 2, which were categorized using the nomogram. As a secondary objective, we compared changes in cognition and structural MRI measures, including cortical thickness and volume, at Year 1 and Year 2. We hypothesized that high-risk aMCI shows a higher probable AD conversion rate and worse cognitive and neurodegenerative trajectories than low-risk aMCI.
METHODS
Study design
This prospective, multicenter, observational study was conducted at 14 study sites in the Republic of Korea from January 2018 to August 2021. Patients were classified as having either high- or low-risk aMCI according to the nomogram, which was developed in a previous study [15]. This nomogram was developed and validated to predict the risk of dementia among patients with aMCI by using clinical features and neurophysiological results. To make the risk prediction model, 3-year dementia conversion was set as the primary outcome and background factors (e.g., age, sex, body mass index, and neuropsychological features) were set as potential predictors. For model construction, data were divided into one group for training and another for validation [15]. The nomogram was developed as follows: first, a specific point was matched to each variable based on the beta coefficients from multiple regression analyses. The estimated effects were ranked based on the estimated regression coefficients. The total points made from the sum of each point were converted to the probability of AD conversion within 3 years. The variables incorporated in the nomogram were age and Seoul Neuropsychological Screening Battery-Dementia Version (SNSB) features (modality of memory impairment [visual, verbal, or both], severity of memory impairment [early or late], and multiplicity of cognitive domains involved [single or multiple]) (Supplementary Table 1) [15]. Based on these features, the predicted probability for probable AD conversion was calculated using the nomogram, where the upper and lower 30% were categorized as high- and low-risk aMCI groups, respectively (Supplementary Figure 1). The detailed probability calculation formula is shown in the Supplementary Material.
Clinical and imaging data of the participants were collected three times during the 2-year follow-up period at Visit 1 (Day 0, time of obtaining informed consent), Visit 2 (Year 1), and Visit 3 (Year 2). The study protocol was approved by the institutional review board at each site. The study was conducted in accordance with the Declaration of Helsinki and in full compliance with the International Council for Harmonization of Technical Requirements for Pharmaceuticals for Human Use and all applicable local Good Clinical Practice regulations. All patients provided written informed consent. This study was registered at ClinicalTrials.gov under the identifier number NCT03448445.
Study participants
Participants were included in this study if they met the following inclusion criteria: 1) aged between 55 and 90 years with subjective or informant-reported memory complaint, 2) Clinical Dementia Rating (CDR) score of 0.5 and CDR memory subdomain score of > 0.5, 3) general cognition and functional performance sufficiently preserved such that a diagnosis of AD cannot be made by the site physician at the time of the screening visit, 4) essentially preserved activities of daily living, 5) patients and caregivers who gave written authorization to use their personal and health data, and 6) patients who were categorized into either the high- or low-risk group by having a predicted probability for probable AD conversion above or below 30% according to the nomogram.
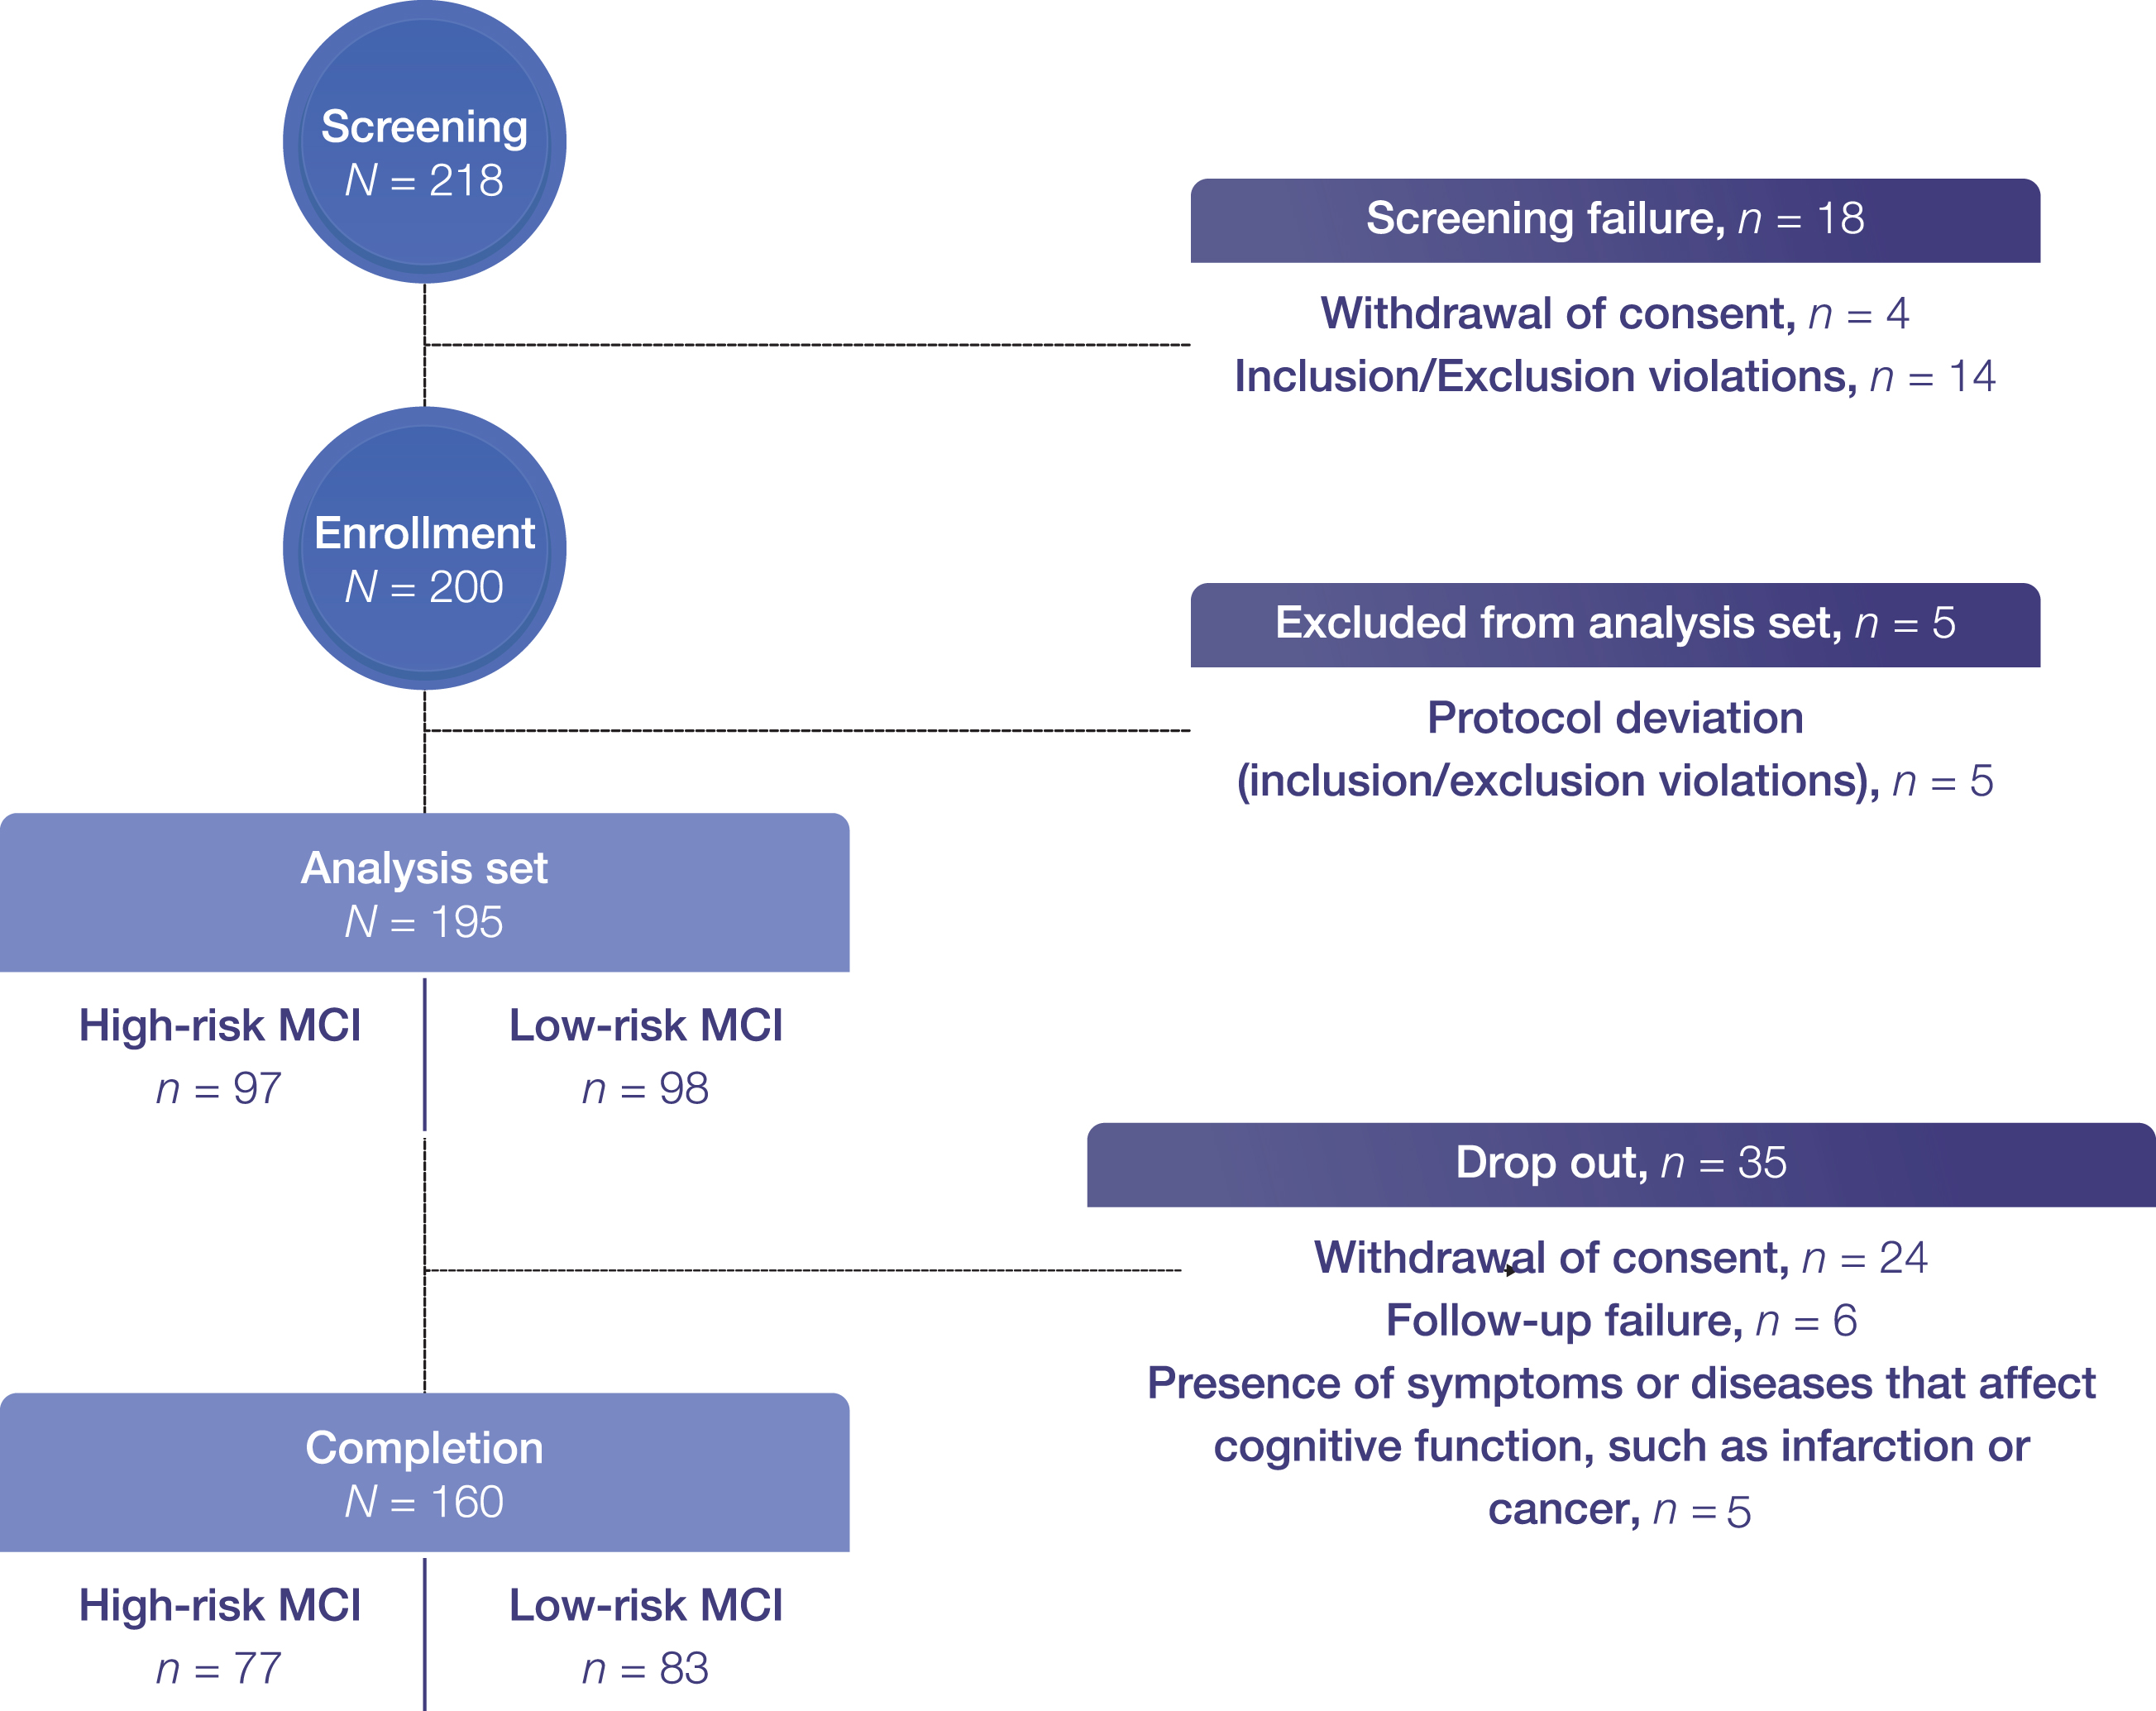
Exclusion criteria were as follows: 1) diagnostic evidence of probable AD consistent with National Institute of Neurological and Communicative Diseases and Stroke/Alzheimer’s Disease and Related Disorders Association criteria; 2) CDR-global score > 1; 3) being treated with memantine, acetylcholinesterase inhibitors, or nootropics within 6 months of enrollment; 4) presence of any other neurological diseases, such as Parkinson’s disease, multi-infarct dementia, Huntington’s disease, normal pressure hydrocephalus, brain tumor, progressive supranuclear palsy, seizure disorder, intra or subdural hematoma, multiple sclerosis, or history of significant head trauma followed by persistent neurologic deficits or known structural brain abnormalities; 5) severe white matter hyperintensities detected by neuroimaging; 6) MRI exclusions, including the presence of pacemakers, aneurysm clips, artificial heart valves, ear implants, metal fragments, or foreign objects in the eyes, skin, or body; 7) participation in any interventional clinical trial; or 8) deemed as inappropriate for participation by the investigator. The flowchart for recruiting study participants is shown in Fig. 1.
Fig. 1
Patient flowchart. Completion refers to Year 2 follow-up.; however, two were excluded from the primary endpoint analysis set as they were not assessed for probable AD conversion at Year 2. aMCI, amnestic mild cognitive impairment.
Study assessments
Data on baseline demographic and clinical characteristics were collected at Visit 1. The SNSB-D, CDR-SB, and Korean version of the Instrumental Activities of Daily Living (K-IADL) questionnaires were administered at Visits 1, 2, and 3. The SNSB-D, a standardized neuropsychological battery widely used in the Republic of Korea [16], is a modified version of the SNSB that is more readily applicable to patients. It consists of sub-domains assessing attention, language and related function, visuospatial function, memory, and frontal/executive function and has a maximum of 300 points.
According to each study site’s practice guidelines, 3T three-dimensional brain MRI was performed at Visits 1, 2, and 3. Volumetric brain MRI data, including regional and cortical global thickness and hippocampal volume, were analyzed using InbrainMorph (MIDAS Information Technology Co., Ltd., Seongnam, Republic of Korea), fully automated image analysis software approved by the Korean Ministry of Food and Drug Safety. In addition, MRI-based AD risk score (MARS), an AD-specific atrophy pattern similarity measure, was obtained based on an individual-level machine learning algorithm. MARS represents how similar the cortical atrophy pattern of an individual is to that of a typical AD patient, and its development has been described previously [17].
The primary endpoint was the difference in conversion rates to probable AD between high- and low-risk aMCI subgroups at Year 1 and 2, according to the definition of probable AD based on the CDR-SB (score > 3) and the K-IADL (score > 0.4) [18, 19]. Secondary endpoints were (1) to evaluate neuropsychological test score changes, including those of the SNSB-D total score, CDR-SB, and K-IADL; and (2) to evaluate changes of structural MRI measures including MARS, hippocampal volume, and cortical thickness (frontal, parietal, and temporal cortical thicknesses) between the high- and low-risk groups at Year 1 and Year 2 (visit window:±1 month).
Statistical methods
The planned sample size was 200 patients based on a previous study of the SNSB nomogram and a systematic review of 36 articles on conversion rates of MCI to AD [15, 20]. In the systematic review, the sample size of half of the studies was under 190 cases, and the majority had fewer than 300 patients. In addition, 338 patients with aMCI were included in the SNSB-D nomogram study, and this sample size was sufficient to show statistically significant differences in conversion rates between low-, intermediate-, and high-risk aMCI groups. As we only included low- and high-risk groups in our study based on the SNSB-D nomogram score, 200 patients were considered sufficient to generate meaningful differences in conversion rates between high- and low-risk groups.
The analysis set of this observational study included all patients who provided written informed consent and met the inclusion criteria. Demographic and clinical characteristics are summarized using descriptive statistics for each risk group using mean, standard deviation (SD), minimum, median, and maximum for continuous variables, and frequency and percentage for categorical variables.
The primary endpoint was calculated for probable AD conversion rates from baseline for each risk group at Year 1 and Year 2 using the chi-square test. For the secondary endpoints, differences in SNSB-D, CDR-SB, and K-IADL score changes from baseline to Year 1 and Year 2 between the high- and low-risk groups were analyzed using analysis of covariance (ANCOVA), with age, sex, education, and respective baseline score as covariates. Differences in changes in MARS and other structural MRI measures from baseline to Year 1 and Year 2 between the high- and low-risk groups were also analyzed using ANCOVA, with age, sex, education, and respective baseline score as covariates; for cortical thickness and volume analyses, baseline intracranial volume was also a covariate.
Tests were two-sided, and a p-value of≤0.05 indicated statistical significance. Wilcoxon’s rank test, two-sample t-test, Pearson’s chi-square, Fisher’s exact test, or ANCOVA were used to compare groups. All statistical analyses were performed using SAS software version 9.4 (SAS Institute Inc., Cary, NC, USA).
RESULTS
Study participants
In total, 195 patients (high-risk, n = 97; low-risk, n = 98) were included. Of these, 176 patients (high-risk, n = 85; low-risk, n = 91) and 160 patients (high-risk, n = 77; low-risk, n = 83), respectively, completed the Year 1 and Year 2 follow-up. A total of 35 patients dropped out, where 24 withdrew consent, six were lost to follow-up, and five newly developed cerebral infarction, cancer, or conditions that affect cognitive function (Fig. 1).
Patient demographics and clinical characteristics at baseline are shown in Table 1. The mean±SD age of all patients was 71.1±8.0 years, and the total nomogram score was 104.8±44.2. Patients in the high-risk group were significantly older than patients in the low-risk group (mean±SD 75.5±6.0 versus 66.6±7.3 years, respectively), had significantly higher total nomogram scores (mean±SD 146.3±13.1 versus 63.7±17.6), higher CDR-SB scores (mean±SD 1.9±0.9 versus 1.2±0.8), lower SNSB-D scores (mean±SD 126.7±27.2 versus 179.8±28.9) (all p < 0.0001, ANCOVA). The MARS was significantly higher in the high-risk group than in the low-risk group at baseline (mean±SD 61.3 versus 17.9; p < 0.0001, ANCOVA). The high-risk group had a significantly lower mean (±SD) hippocampal volume (6,537.2±933.4 versus 7,518.8±826.8 mm3; p < 0.0001, ANCOVA) and temporal thickness (5.2±0.2 versus 5.4±0.2 mm; p = 0.007, ANCOVA) at baseline than the low-risk group. However, the frontal and parietal thickness at baseline did not differ significantly between the two groups.
Table 1
Baseline patient demographic and clinical characteristics (analysis set)
| Item | Total (N = 195) | High-risk (n = 97) | Low-risk (n = 98) | pa |
| Age (y), mean±SD | 71.1±8.0 | 75.5±6.0 | 66.6±7.3 | <0.0001b |
| Female, n (%) | 128 (65.6) | 59 (60.8) | 69 (70.4) | 0.2c |
| Education level, n (%) | 0.8c | |||
| Elementary school or lower | 66 (33.9) | 33 (34.0) | 33 (33.7) | |
| Middle school | 35 (18.0) | 17 (17.5) | 18 (18.4) | |
| High school | 55 (28.2) | 25 (25.8) | 30 (30.6) | |
| University or higher | 38 (19.5) | 21 (21.7) | 17 (17.4) | |
| Do not know | 1 (0.5) | 1 (1.0) | 0 (0.0) | |
| Vascular risk factor, n (%) | ||||
| Hypertension | 98 (50.3) | 55 (56.7) | 43 (43.9) | 0.07c |
| Diabetes | 42 (21.5) | 24 (24.7) | 18 (18.4) | 0.3c |
| Hyperlipidemia | 62 (31.8) | 34 (35.1) | 28 (28.6) | 0.3c |
| Hypertension | 98 (50.3) | 55 (56.7) | 43 (43.9) | 0.07c |
| Nomogram total points, mean±SD | 104.8±44.2 | 146.3±13.1 | 63.7±17.6 | <0.0001b |
| APOE4 carriers, n (%) | n = 134 | n = 70 | n = 64 | |
| 36 (26.9) | 25 (35.7) | 11 (17.2) | 0.02c | |
| Neuropsychological measures | ||||
| SNSB-D, mean±SD | 153.4±38.6 | 126.7±27.2 | 179.8±28.9 | <0.0001d |
| CDR-SB, mean±SD | 1.5±0.9 | 1.9±0.9 | 1.2±0.8 | <0.0001d |
| K-IADL, mean±SD | 0.2±0.2 | 0.2±0.2 | 0.1±0.2 | <0.09d |
| MRI measures | n = 182 | n = 88 | n = 94 | |
| Cortical atrophy index (MARS), mean±SD | 38.9±36.0 | 61.3±32.4 | 17.9±25.0 | <0.0001d |
| Hippocampal volume (mm3), mean±SD | 7,044.2±1,006.0 | 6,537.2±933.4 | 7,518.8±826.8 | <0.0001d |
| Frontal thickness (mm), mean±SD | 4.9±0.2 | 4.8±0.2 | 4.9±0.2 | 0.3d |
| Temporal thickness (mm), mean±SD | 5.3±0.3 | 5.2±0.2 | 5.4±0.2 | 0.007d |
| Parietal thickness (mm), mean±SD | 4.3±0.2 | 4.2±0.2 | 4.3±0.2 | 0.06d |
aInter-group comparison: bWilcoxon’s rank-sum test, cPearson’s chi-square test, or dAnalysis of covariance APOE4, apolipoprotein E E4 allele; CDR-SB, Clinical Dementia Rating Sum of Boxes; K-IADL, Korean version of the Instrumental Activities of Daily Living; MARS, MRI-based Alzheimer’s disease risk score; MRI, magnetic resonance imaging; Min, minimum; Max, maximum; SD, standard deviation; SNSB-D, Seoul Neuropsychological Screening Battery-Dementia Version.
Primary endpoint
The conversion rate from aMCI to probable AD in the total population at Year 2 of follow-up evaluation was 24.7% (39/158), comprising 46.1% (35/76) of the high-risk group and 4.9% (4/82) of the low-risk group, respectively (p < 0.0001). At Year 1 of follow-up, the overall conversion rate was 13.9% (24/173), with 28.9% (24/83) and 0.0% (0/90) in the high- and low-risk groups, respectively (p < 0.0001).
Due to significantly different mean baseline ages between the high- and low-risk groups (75.5±6.0 years versus 66.6±7.3 years, p < 0.0001), subgroup analysis based on age (over 65 years, over 70 years) was conducted. The conversion rate was significantly higher in the high-risk group and both subgroups of age over 65 years (46.0%, 34/74 versus 8.5%, 4/47; p < 0.0001) and over 70 years (45.8%, 27/59 versus 3.7%, 1/27; p = 0.0001).
Secondary endpoints
The neuropsychological test score changes in SNSB-D, CDR-SB, and K-IADL at Year 1 and Year 2 are shown in Fig. 2. The difference in mean SNSB-D scores changed between the groups, and this trend remained significant throughout the study period, with a mean SNSB-D change at each evaluation timepoint (1.0 versus 7.3, p = 0.03 at Year 1; –5.1 versus 8.9, p = 0.04 at Year 2, ANCOVA) in the high-risk group versus the low-risk group (Fig. 2a). The mean SNSB-D score tended to increase in the low-risk group and tended to decrease in the high-risk group throughout the study period.
Fig. 2
Mean changes from baseline in (a) SNSB-D scores, (b) CDR-SB scores, and (c) K-IADL scores at Year 1 and Year 2. p-values calculated by ANCOVA using age, sex, education; and respective baseline score. ANCOVA, analysis of covariance; CDR-SB, Clinical Dementia Rating Sum of Boxes; K-IADL, Korean version of the Instrumental Activities of Daily Living; SNSB-D, Seoul Neuropsychological Screening Battery-Dementia Version.
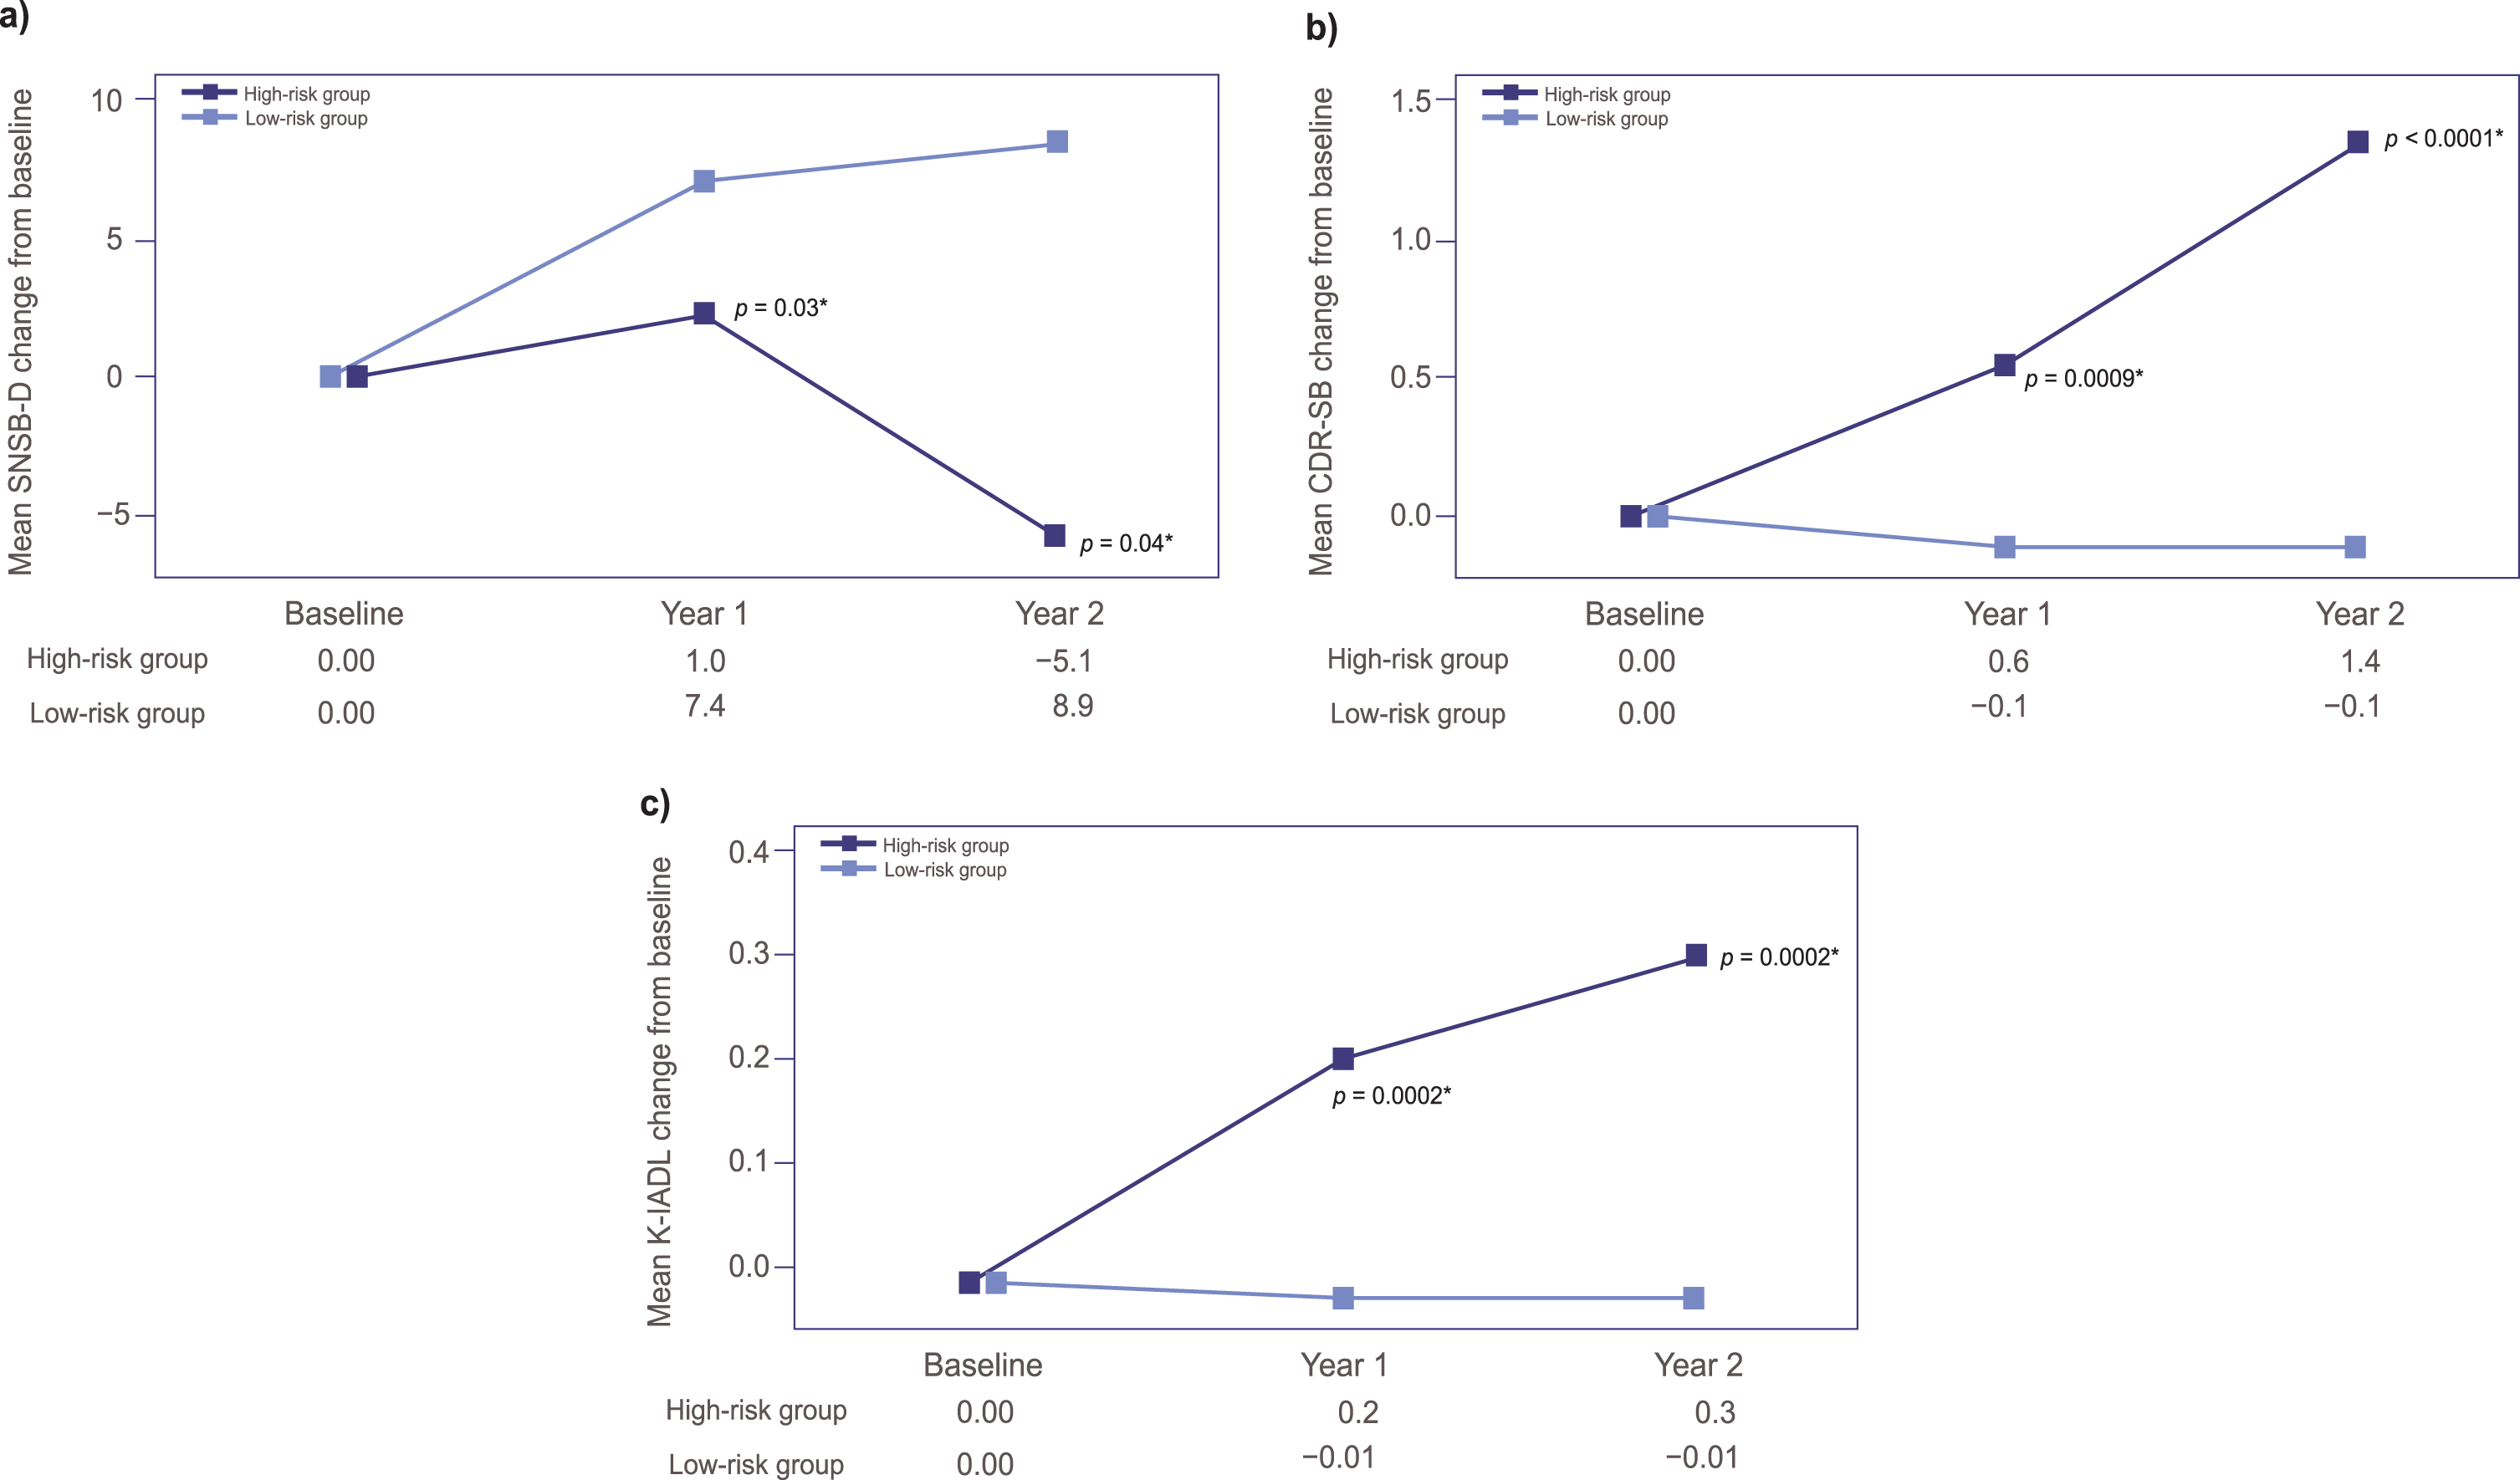
The mean CDR-SB changes showed statistically significant differences between the two groups at each evaluation timepoint (0.6 versus –0.1, p = 0.0009 at Year 1; 1.38 versus –0.11, p < 0.0001 at Year 2) (Fig. 2b).
Additionally, the mean K-IADL change from baseline tended to increase in the high-risk group, with statistically significant differences between the two groups at each evaluation timepoint (0.2 versus –0.01, p = 0.0002 at Year 1; 0.3 versus –0.01, p = 0.0002 at Year 2), while the score remained largely unchanged in the low-risk group during the 2-year follow up (Fig. 2c).
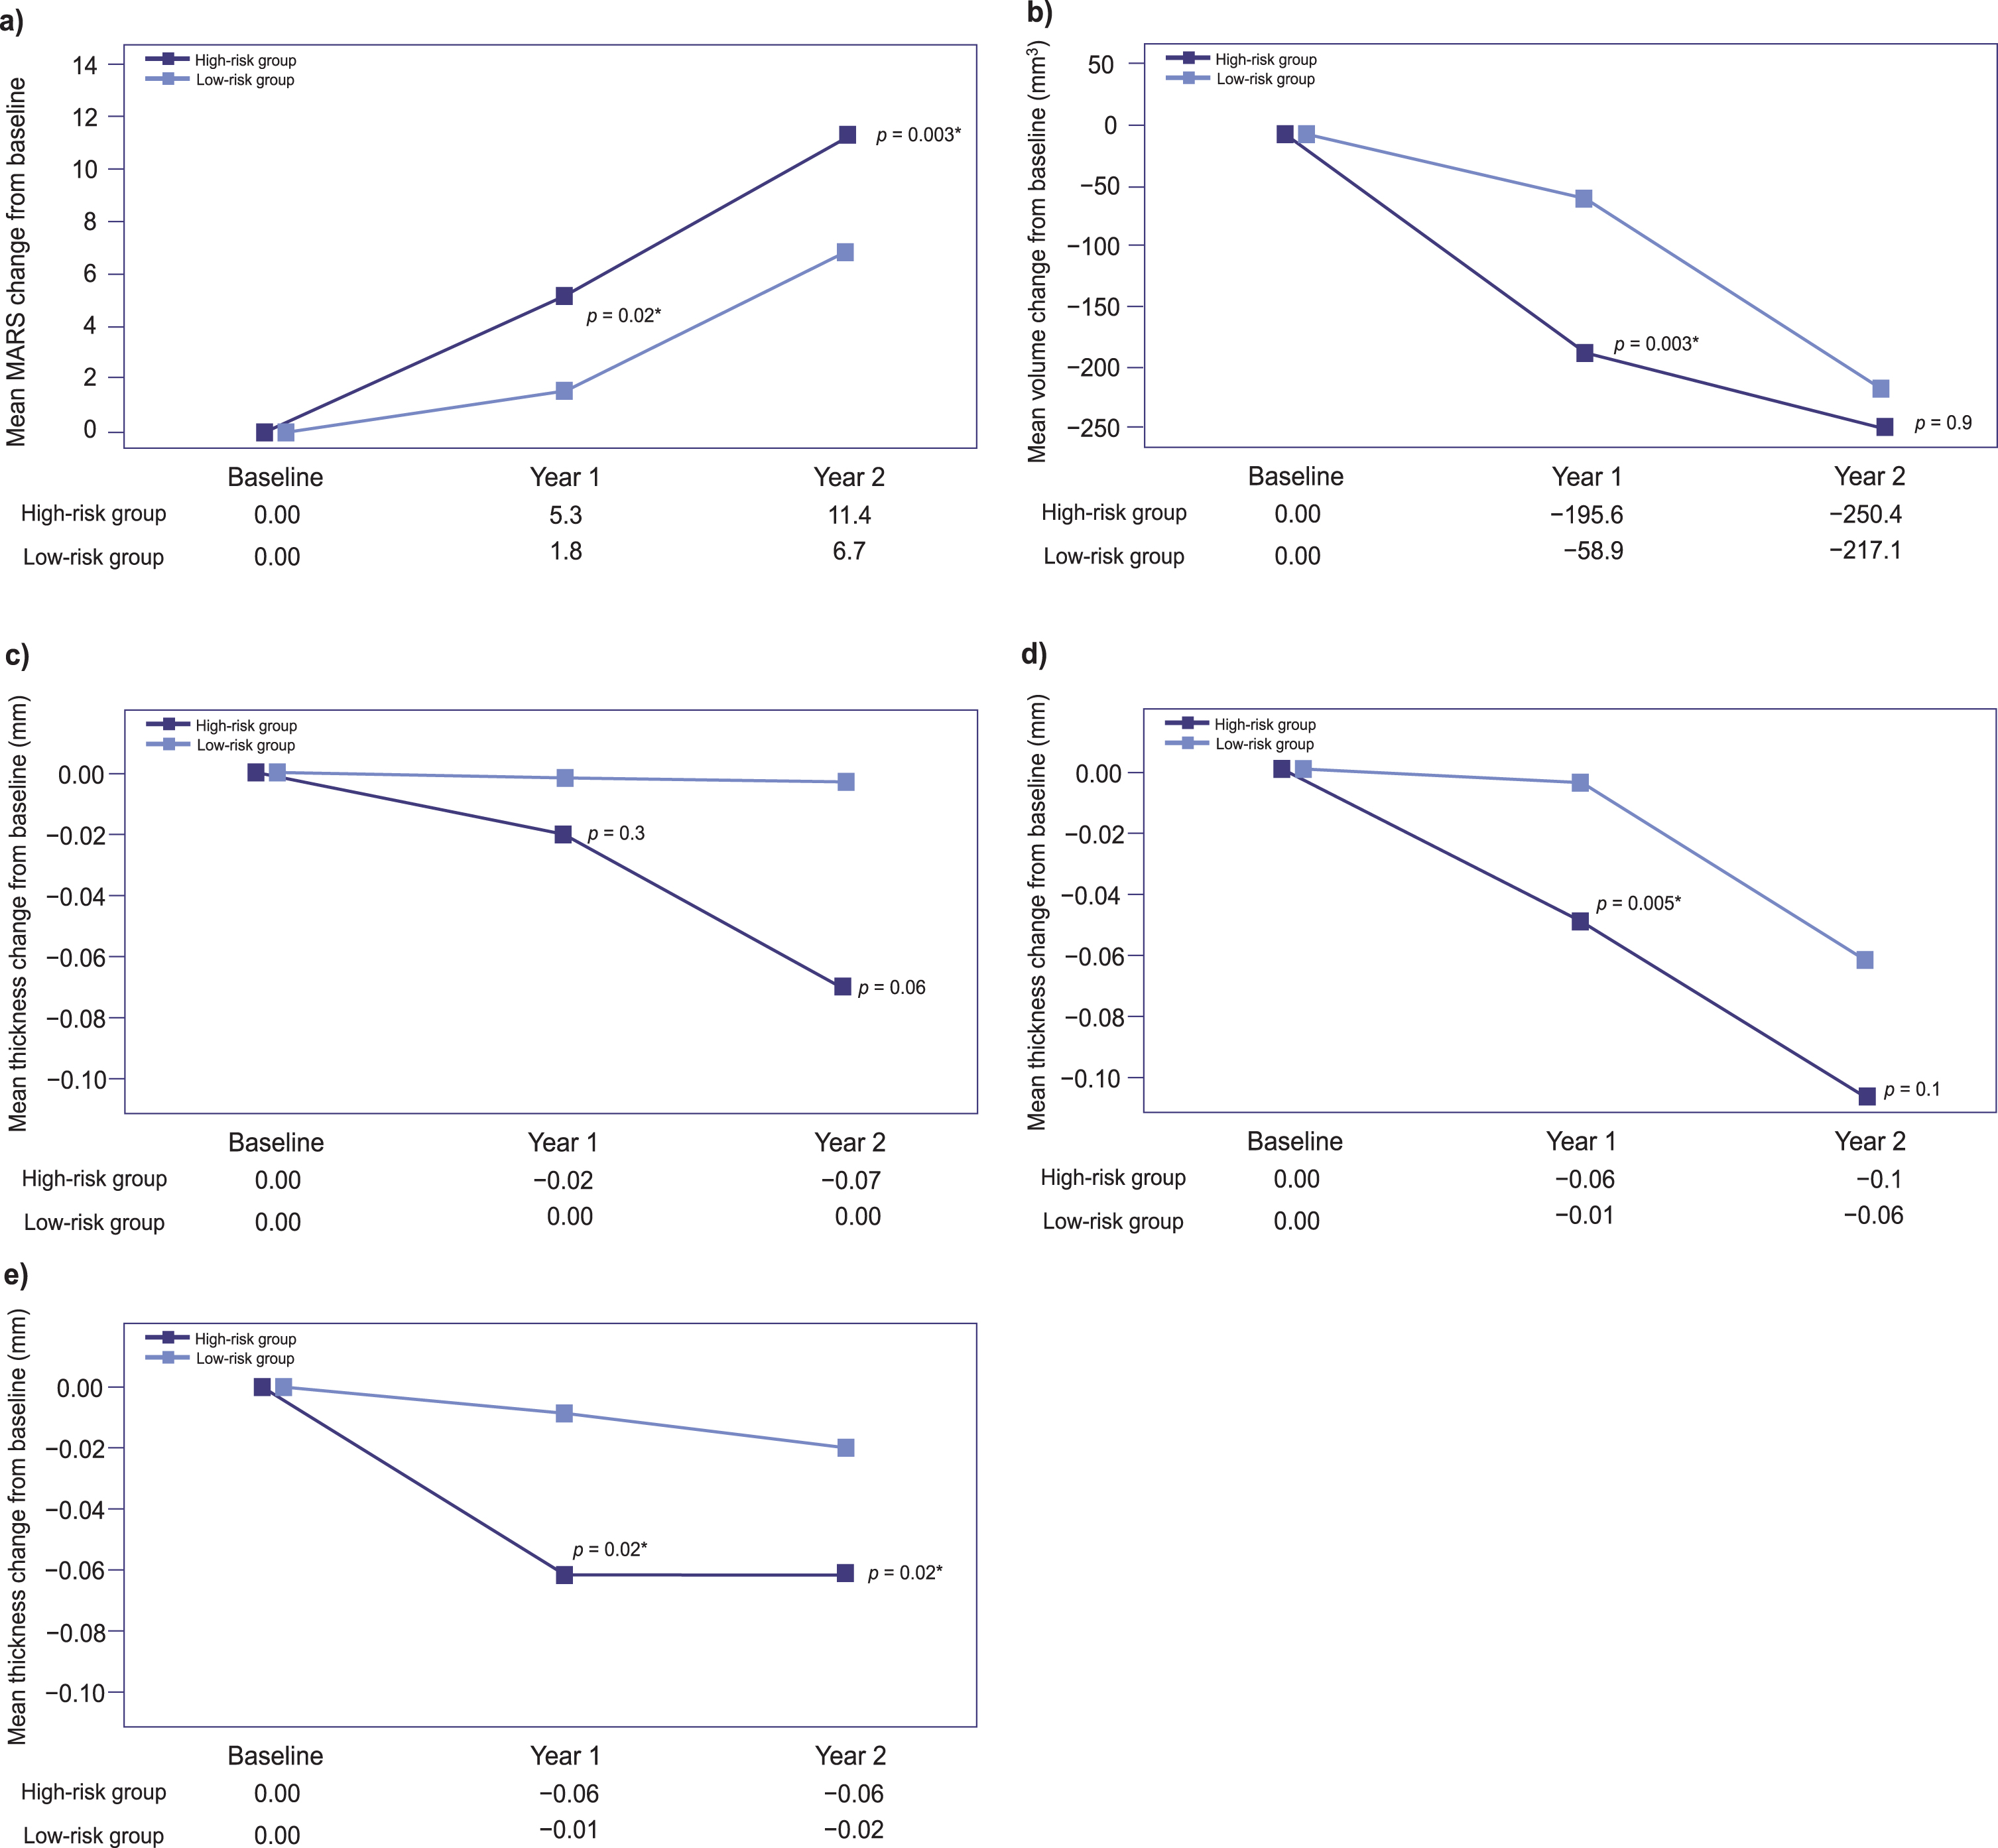
From baseline, the differences in mean MARS at Year 1 and Year 2 were significantly higher in the high-risk group versus the low-risk group (Year 1:5.3 versus 1.8, respectively, p = 0.02; Year 2 : 11.4 versus 6.7, respectively, p = 0.003, ANCOVA) (Fig. 3a). The changes in hippocampal volume and frontal, temporal, and parietal thicknesses at Year 1 and Year 2 are shown in Fig. 3b, c, d, and e, respectively. The changes in mean frontal thickness did not differ significantly between the two groups throughout the study period, although they showed a tendency to be greater in the high-risk group at Year 2 (p = 0.06) (Fig. 3c). The hippocampal volume and temporal thickness decreases were significantly greater in the high-risk group at Year 1 only (Fig. 3b, d). Parietal thickness decreases were significantly greater in the high-risk group than in the low-risk group at both Year 1 and Year 2 (Fig. 3e).
Fig. 3
Mean changes from baseline in (a) cortical atrophy index (MARS) scores, (b) hippocampal volume, and (c) frontal, (d) temporal, and (e) parietal thicknesses at Year 1 and Year 2. p-values calculated by ANCOVA using age, sex, education; and respective baseline score as covariates; for cortical thickness and volume analyses, with baseline intracranial volume as a covariate as well. ANCOVA, analysis of covariance; ICV, intracranial volume; MARS, magnetic resonance imaging-based Alzheimer’s disease risk score.
Comparison between probable AD converters and non-converters
A subgroup analysis was conducted on patients in the high-risk group at Year 2, who were stratified into converters (n = 35) and non-converters (n = 41), and the baseline characteristics of these patients are shown in Table 2. Baseline nomogram total points (probability of conversion) did not differ significantly between the two groups (p = 0.7). Significant mean±SD differences between converters and non-converters in the high-risk group were noted for baseline CDR-SB (2.2±0.7 versus 1.7±0.8; p = 0.006) and K-IADL (0.3±0.3 versus 0.2±0.1; p = 0.01), but no differences were noted for age, sex, or education. Although not statistically significant, the prevalence of apolipoprotein E4 (APOE4) carriers tended to be higher in the high-risk group than in the low-risk group (45.5%, 15/33 versus 25.0%, 9/36; p = 0.07). In terms of MRI neurodegeneration measures, the conversion group had a significantly lower hippocampal volume at baseline than the non-conversion group (mean±SD 6,288.6±944.5 versus 6,764.4±927.8 mm3; p = 0.04, ANCOVA). However, the frontal, temporal, and parietal thicknesses at baseline did not differ significantly between the two groups.
Table 2
Baseline demographic data (AD converter versus non-converter at Year 2 in the high-risk group) (analysis set)
| Item | Total (n = 76) | Converter (n = 35) | Non-converter (n = 41) | pa |
| Age (y), mean±SD | 75.6±6.0 | 76.4±6.4 | 75.0±5.7 | 0.3b |
| Female sex, n (%) | 48 (63.2) | 22 (62.9) | 26 (63.4) | 1.0c |
| Education level, n (%) | 0.8c | |||
| Elementary school or lower | 27 (35.5) | 13 (37.1) | 14 (34.2) | |
| Middle school | 14 (18.4) | 7 (20.0) | 7 (17.1) | |
| High school | 19 (25.0) | 7 (20.0) | 12 (29.3) | |
| University or higher | 16 (21.1) | 8 (22.9) | 8 (19.5) | |
| Do not know | 0 (0.0) | 0 (0.0) | 0 (0.0) | |
| Vascular risk factor, n (%) | ||||
| Hypertension | 45 (59.2) | 17 (48.6) | 28 (68.3) | 0.08 c |
| Diabetes | 20 (26.3) | 7 (20.0) | 13 (31.7) | 0.2c |
| Hyperlipidemia | 32 (42.1) | 14 (40.0) | 18 (43.9) | 0.7c |
| Cardiac disorders | 11 (14.5) | 7 (20.0) | 4 (9.8) | 0.2c |
| Nomogram total points, mean±SD | 147.0±13.2 | 148.2±15.2 | 146.0±11.4 | 0.7d |
| APOE4 carriers, n (%) | n = 69 | n = 33 | n = 36 | |
| 24 (34.8) | 15 (45.5) | 9 (25.0) | 0.07c | |
| Neuropsychological measures | ||||
| CDR-SB, mean±SD | 1.9±0.8 | 2.2±0.7 | 1.7±0.8 | 0.006e |
| SNSB-D, mean±SD | 126.5±26.8 | 121.8±24.8 | 130.5±28.1 | 0.2e |
| K-IADL, mean±SD | 0.2±0.2 | 0.3±0.3 | 0.2±0.1 | 0.01e |
| MRI measures | n = 70 | n = 34 | n = 36 | |
| Cortical atrophy index (MARS), mean±SD | 63.6±31.7 | 71.6±28.2 | 56.1±33.3 | 0.07e |
| Hippocampal volume (mm3), mean±SD | 6,533.3±959.5 | 6,288.6±944.5 | 6,764.4±927.8 | 0.04e |
| Frontal thickness (mm), mean±SD | 4.8±0.2 | 4.8±0.2 | 4.8±0.1 | 0.08e |
| Temporal thickness (mm), mean±SD | 5.2±0.2 | 5.1±0.2 | 5.2±0.2 | 0.6e |
| Parietal thickness (mm), mean±SD | 4.2±0.2 | 4.2±0.2 | 4.2±0.2 | 0.6e |
aInter-group comparison: btwo-sample t-test, cPearson’s chi-square test, dWilcoxon’s rank-sum test, or eAnalysis of covariance. AD, Alzheimer’s disease; APOE E4, apolipoprotein E E4 allele; CDR-SB, Clinical Dementia Rating Sum of Boxes; K-IADL, Korean version of the Instrumental Activities of Daily Living; MARS, magnetic resonance imaging-based Alzheimer’s disease risk score; MRI, magnetic resonance imaging; SD, Standard deviation; SNSB-D, Seoul Neuropsychological Screening Battery-Dementia Version; Min, minimum; Max, maximum.
DISCUSSION
In this observational study, we compared the conversion rates to probable AD and cognitive and neurodegenerative changes of high- and low-risk aMCI groups, which were determined based on a previously developed nomogram [15]. Of note, this study is the first to compare AD conversion rates by dividing patients into two groups, high- and low-risk aMCI groups, using a nomogram consisting of clinical and neuropsychological factors and not including APOE4 or any other biomarkers. As a result, we demonstrated that the nomogram-based high-risk group showed a higher conversion rate to probable AD as well as worse longitudinal cognitive and neurodegenerative changes. This means that we can predict conversion to probable AD using clinical and neuropsychological factors. Such data have so far been limited and are much needed to support physicians’ decision-making processes in their daily clinical experience when managing patients with aMCI.
The overall conversion rates in the present study at 1- and 2-year follow-ups were 13.9% and 24.7%, respectively. These findings indicate that the present study was a well-constructed observational study because the overall conversion rates were similar to annual rates (ranging from 10% to 15%) reported in previous studies [2, 4]. Some discrepancies might have come from the inclusion criteria of our study, where we selectively recruited aMCI participants who were at either a low or high risk of conversion based on the nomogram. We found that the nomogram-based high-risk aMCI group showed an approximately nine-fold higher probable AD conversion rate than the low-risk group (28.9% versus 0.0% at Year 1, 46.1% versus 4.9% at Year 2, respectively). When comparing the high- and low-risk aMCI groups, it should be noted that the mean ages of patients in both groups differed significantly, with the high-risk group being significantly older than the low-risk group. This was an inevitable issue considering that age was the major variable in the nomogram to predict imminent probable AD conversion. Therefore, to adjust for the notable effect of age on conversion, we performed sensitivity analyses by selecting age subgroups with age cutoffs of 65 and 70 years. Even in these subgroups, the high-risk group had a higher probable AD conversion rate (subgroup aged over 65 years: high-risk group, 46.0% versus low-risk group, 8.5%, p < 0.0001; subgroup aged over 70 years: high-risk group, 45.8% versus low-risk group, 3.7%, p = 0.0001), which suggests that factors included in the nomogram other than age are also important in predicting probable AD conversion.
Given that the nomogram included patterns of neuropsychological test results as major predictors, baseline neuropsychological scores that yielded significant differences between the high- and low-risk groups were CDR-SB, SNSB-D, and K-IADL, as expected. Although not included in the nomogram, neuroimaging findings showed that the high-risk group had more severe baseline temporal thinning and hippocampal atrophy. This is consistent with previous knowledge that baseline hippocampal or cortical atrophy is closely associated with faster cognitive decline [21, 22]. Neurodegeneration markers may be useful predictors in this setting, in conjunction with neuropsychological assessments.
In terms of longitudinal changes in neurodegeneration between the two groups, the high-risk group had a worse neurodegeneration trajectory than the low-risk group. This is consistent with previous studies showing that structural changes are strongly associated with AD progression [23, 24]; however, atrophy changes were noted differently according to the region. Temporal thickness and hippocampal volume changes in the present study were different between the high- and low-risk groups at Year 1 only. However, parietal thickness changes were different between the high- and low-risk groups at both Year 1 and Year 2 of follow-up. The difference can be explained by the fact that hippocampal and temporal atrophy occurred in both groups during follow-up, as this is the earliest neurodegeneration marker in the AD spectrum.
Finally, subgroup analysis of the high-risk group by conversion at Year 2 showed that converters had worse baseline CDR-SB and K-IADL scores and hippocampal volume, especially on MRI, than non-converters, despite similar risk scores on the nomogram. Although we could not obtain complete APOE genotype data, the prevalence of APOE4 carriers tended to be higher in the high-risk group, which confirms that APOE4 is a strong predictor of probable AD progression in aMCI [25–27]. Therefore, we consider that further consideration of CDR-SB or K-IADL scores, as well as APOE genotype and cortical structural changes, could help to predict probable AD conversion risk more accurately. This is consistent with previous studies investigating the predictors for probable AD conversion in aMCI [9, 11, 14]. A previous study showed that cognitive and functional measures, particularly those evaluating immediate memory, were associated with conversion from MCI to probable AD; however, these associations depended on hippocampal volume, with a higher probability of conversion associated with a lower hippocampal volume and vice versa [28]. Another study found that increased amyloid deposition was associated with an increased risk of conversion from MCI to AD [29]. Overall, the existing literature and our present findings emphasize the importance of using a combined or multimodal evaluation assessment to accurately predict disease progression.
Other published studies have shown that factors such as MRI and biomarkers can accurately predict the probability of probable AD conversion; however, the recently developed nomogram used in this study is a feasible and useful tool for predicting the probability of converting to probable AD among aMCI patients. Other studies have explored nomograms built according to similar parameters, including gene expression profiles and concentrations of Abeta peptides, that showed good performance at predicting MCI to AD conversion [21, 22, 30, 31], further supporting the feasibility of this approach.
Limitations
This study has several limitations. First, age was the major variable included in the nomogram for predicting the conversion risk, and there was a significant age difference between the low- and high-risk groups. Unfortunately, age was not accounted for during the protocol development stage, and this may have affected the results, despite using statistical measures to compensate for any differences. To address this limitation, setting an age range of 40–60 years should be considered when enrolling patients in future research. Second, we could not obtain information regarding amyloid biomarkers from participants at baseline or follow-up, which could be used to confirm the accuracy of predicting probable AD conversion risk in patients with aMCI. Finally, we also could not fully obtain APOE genotype data, which may provide further insight in predicting probable AD conversion in patients with aMCI.
Conclusions
This study shows that, based on the nomogram, the high-risk group had a higher rate of probable AD conversion and worse cognitive and neurodegenerative trajectories than the low-risk group. The nomogram in this study includes important predictors including not only the severity of memory impairment, but also modality of impaired memory and multiplicity of impaired cognitive domains, which could be easily and intuitively obtained by the conventional neuropsychological test in a clinical setting. Our findings have implications for early clinical diagnosis of probable AD among Korean patients with aMCI and early treatment decision-making.
AUTHOR CONTRIBUTIONS
Hyemin Jang (Investigation; Writing – review & editing); Duk L. Na (Conceptualization; Investigation; Methodology); Jay Cheol Kwon (Investigation); Na-Yeon Jung (Investigation); Yeonsil Moon (Investigation); Jung Seok Lee (Investigation); Kyung-Won Park (Investigation); Ae Young Lee (Investigation); Hanna Cho (Investigation); Jae-Hong Lee (Investigation); Byeong Chae Kim (Investigation); Kee Hyung Park (Investigation); Byung-Chul Lee (Investigation); Hojin Choi (Investigation); Jieun Kim (Funding acquisition; Writing – review & editing); Mee Young Park, MD, PhD (Investigation; Writing – review & editing).
ACKNOWLEDGMENTS
We thank Dr. Duk L. Na who, as a coordinating investigator, was a major contributor in conducting the study and data collection. Additionally, we thank Michelle Belanger, MD, and Keyra Martinez, MD, Edanz, and David P. Figgitt, PhD, CMPP, Content Ed Net, for providing medical writing support which was funded by Eisai Korea Inc. in accordance with Good Publication Practice (GPP) 2022 guidelines https://www.ismpp.org/gpp-2022).
FUNDING
This study was funded by Eisai Korea Inc., Seoul, Republic of Korea.
CONFLICT OF INTEREST
Jieun Kim is an employee of Eisai Korea Inc. All of the other authors have nothing to declare.
DATA AVAILABILITY
The datasets used during the current study are available from the corresponding author on reasonable request.
SUPPLEMENTARY MATERIAL
[1] The supplementary material is available in the electronic version of this article: https://dx.doi.org/10.3233/ADR-230189.
REFERENCES
[1] | DeTure MA , Dickson DW ((2019) ) The neuropathological diagnosis of Alzheimer’s disease. Mol Neurodegener 14: , 32. |
[2] | Petersen RC , Doody R , Kurz A , Mohs RC , Morris JC , Rabins PV , Ritchie K , Rossor M , Thal L , Winblad B ((2001) ) Current concepts in mild cognitive impairment. Arch Neurol 58: , 1985–1992. |
[3] | Morris JC , Storandt M , Miller JP , McKeel DW , Price JL , Rubin EH , Berg L ((2001) ) Mild cognitive impairment represents early-stage Alzheimer disease. Arch Neurol 58: , 397–405. |
[4] | Boyle PA , Wilson RS , Aggarwal NT , Tang Y , Bennett DA ((2006) ) Mild cognitive impairment: Risk of Alzheimer disease and rate of cognitive decline. Neurology 67: , 441–445. |
[5] | Tahami Monfared AA , Byrnes MJ , White LA , Zhang Q ((2022) ) Alzheimer’s disease: Epidemiology and clinical progression. Neurol Ther 11: , 553–569. |
[6] | Altuna-Azkargorta M , Mendioroz-Iriarte M ((2021) ) Blood biomarkers in Alzheimer’s disease. Neurologia (Engl Ed) 36: , 704–710. |
[7] | Rye I , Vik A , Kocinski M , Lundervold AS , Lundervold AJ ((2022) ) Predicting conversion to Alzheimer’s disease in individuals with mild cognitive impairment using clinically transferable features. Sci Rep 12: , 15566. |
[8] | Serrano-Pozo A , Frosch MP , Masliah E , Hyman BT ((2011) ) Neuropathological alterations in Alzheimer disease. Cold Spring Harb Perspect Med 1: , a006189. |
[9] | Kim HJ , Oh JS , Lim JS , Lee S , Jo S , Chung EN , Shim WH , Oh M , Kim JS , Roh JH , Lee JH ; Alzheimer’s Disease Neuroimaging Initiative ((2022) ) The impact of subthreshold levels of amyloid deposition on conversion to dementia in patients with amyloid-negative amnestic mild cognitive impairment. Alzheimers Res Ther 14: , 93. |
[10] | Chun MY , Park CJ , Kim J , Jeong JH , Jang H , Kim K , Seo SW ((2022) ) Prediction of conversion to dementia using interpretable machine learning in patients with amnestic mild cognitive impairment. Front Aging Neurosci 14: , 898940. |
[11] | Cerbone B , Massman PJ , Kulesz PA , Woods SP , York MK ((2022) ) Predictors of rate of cognitive decline in patients with amnestic mild cognitive impairment. Clin Neuropsychol 36: , 138–164. |
[12] | Tien YT , Lee WJ , Liao YC , Wang WF , Jhang KM , Wang SJ , Fuh JL ((2019) ) Plasma transthyretin as a predictor of amnestic mild cognitive impairment conversion to dementia. Sci Rep 9: , 18691. |
[13] | Park JE , Choi KY , Kim BC , Choi SM , Song MK , Lee JJ , Kim J , Song HC , Kim HW , Ha JM , Seo EH , Song WK , Park SG , Lee JS , Lee KH ((2019) ) Cerebrospinal fluid biomarkers for the diagnosis of prodromal Alzheimer’s disease in amnestic mild cognitive impairment. Dement Geriatr Cogn Dis Extra 9: , 100–113. |
[14] | Karas G , Sluimer J , Goekoop R , van der Flier W , Rombouts SA , Vrenken H , Scheltens P , Fox N , Barkhof F ((2008) ) Amnestic mild cognitive impairment: Structural MR imaging findings predictive of conversion to Alzheimer disease. AJNR Am J Neuroradiol 29: , 944–949. |
[15] | Jang H , Ye BS , Woo S , Kim SW , Chin J , Choi SH , Jeong JH , Yoon SJ , Yoon B , Park KW , Hong YJ , Kim HJ , Lockhart SN , Na DL , Seo SW ((2017) ) Prediction model of conversion to dementia risk in subjects with amnestic mild cognitive impairment: A longitudinal, multi-center clinic-based study. J Alzheimers Dis 60: , 1579–1587. |
[16] | Ahn HJ , Chin J , Park A , Lee BH , Suh MK , Seo SW , Na DL ((2010) ) Seoul Neuropsychological Screening Battery-dementia version (SNSB-D): A useful tool for assessing and monitoring cognitive impairments in dementia patients. J Korean Med Sci 25: , 1071–1076. |
[17] | Lee JS , Kim C , Shin JH , Cho H , Shin DS , Kim N , Kim N , Kim HJ , Kim Y , Lockhart SN , Na DL , Seo SW , Seong JK ((2018) ) Machine learning-based individual assessment of cortical atrophy pattern in Alzheimer’s disease spectrum: Development of the classifier and longitudinal evaluation. Sci Rep 8: , 4161. |
[18] | O’Bryant SE , Waring SC , Cullum CM , Hall J , Lacritz L , Massman PJ , Lupo PJ , Reisch JS , Doody R ; Texas Alzheimer’s Research Consortium ((2008) ) Staging dementia using Clinical Dementia Rating Scale Sum of Boxes scores: A Texas Alzheimer’s research consortium study. Arch Neurol 65: , 1091–1095. |
[19] | Chin J , Park J , Yang SJ , Yeom J , Ahn Y , Baek MJ , Ryu HJ , Lee BH , Han NE , Ryu KH , Kang Y ((2018) ) Re-standardization of the Korean-Instrumental Activities of Daily Living (K-IADL): Clinical usefulness for various neurodegenerative diseases. Dement Neurocogn Disord 17: , 11–22. |
[20] | Ward A , Tardiff S , Dye C , Arrighi HM ((2013) ) Rate of conversion from prodromal Alzheimer’s disease to Alzheimer’s dementia: A systematic review of the literature. Dement Geriatr Cogn Dis Extra 3: , 320–332. |
[21] | Ottoy J , Niemantsverdriet E , Verhaeghe J , De Roeck E , Struyfs H , Somers C , Wyffels L , Ceyssens S , Van Mossevelde S , Van den Bossche T , Van Broeckhoven C , Ribbens A , Bjerke M , Stroobants S , Engelborghs S , Staelens S ((2019) ) Association of short-term cognitive decline and MCI-to-AD dementia conversion with CSF, MRI, amyloid- and 18F-FDG-PET imaging. Neuroimage Clin 22: , 101771. |
[22] | Jang H , Park J , Woo S , Kim S , Kim HJ , Na DL , Lockhart SN , Kim Y , Kim KW , Cho SH , Kim SJ , Seong JK , Seo SW ; Alzheimer’s Disease Neuroimaging Initiative ((2019) ) Prediction of fast decline in amyloid positive mild cognitive impairment patients using multimodal biomarkers. Neuroimage Clin 24: , 101941. |
[23] | Feczko E , Augustinack JC , Fischl B , Dickerson BC ((2009) ) An MRI-based method for measuring volume, thickness and surface area of entorhinal, perirhinal, and posterior parahippocampal cortex. Neurobiol Aging 30: , 420–431. |
[24] | Lerch JP , Pruessner J , Zijdenbos AP , Collins DL , Teipel SJ , Hampel H , Evans AC ((2008) ) Automated cortical thickness measurements from MRI can accurately separate Alzheimer’s patients from normal elderly controls. Neurobiol Aging 29: , 23–30. |
[25] | Fleisher AS , Sowell BB , Taylor C , Gamst AC , Petersen RC , Thal LJ ((2007) ) Clinical predictors of progression to Alzheimer disease in amnestic mild cognitive impairment. Neurology 68: , 1588–1595. |
[26] | Elias-Sonnenschein LS , Viechtbauer W , Ramakers IH , Verhey FR , Visser PJ ((2011) ) Predictive value of APOE-epsilon4 allele for progression from MCI to AD-type dementia: A meta-analysis. J Neurol Neurosurg Psychiatry 82: , 1149–1156. |
[27] | Petersen RC , Smith GE , Ivnik RJ , Tangalos EG , Schaid DJ , Thibodeau SN , Kokmen E , Waring SC , Kurland LT ((1995) ) Apolipoprotein E status as a predictor of the development of Alzheimer’s disease in memory-impaired individuals. JAMA 273: , 1274–1278. |
[28] | Tabatabaei-Jafari H , Shaw ME , Walsh E , Cherbuin N ((2020) ) Cognitive/functional measures predict Alzheimer’s Disease, dependent on hippocampal volume. J Gerontol B Psychol Sci Soc Sci 75: , 1393–1402. |
[29] | Roberto N , Portella MJ , Marquié M , Alegret M , Hernández I , Mauleón A , Rosende-Roca M , Abdelnour C , de Antonio EE , Gil S , Tartari JP , Vargas L , Espinosa A , Ortega G , Pérez-Cordón A , Sanabria Á , Orellana A , de Rojas I , Moreno-Grau S , Montrreal L , Alarcón-Martín E , Ruíz A , Tárraga L , Boada M , Valero S ((2021) ) Neuropsychiatric profiles and conversion to dementia in mild cognitive impairment, a latent class analysis. Sci Rep 11: , 6448. |
[30] | Huang K , Lin Y , Yang L , Wang Y , Cai S , Pang L , Wu X , Huang L ; Alzheimer’s Disease Neuroimaging Initiative ((2020) ) A multipredictor model to predict the conversion of mild cognitive impairment to Alzheimer’s disease by using a predictive nomogram. Neuropsychopharmacology 45: , 358–366. |
[31] | Tang L , Wu X , Liu H , Wu F , Song R , Zhang W , Guo D , Feng J , Li C ((2021) ) Individualized prediction of early Alzheimer’s disease based on magnetic resonance imaging radiomics, clinical, and laboratory examinations: A 60-month follow-up study. J Magn Reson Imaging 54: , 1647–1657. |


