
Identification of Cinnamein, a Component of Balsam of Tolu/Peru, as a New Ligand of PPARα for Plaque Reduction and Memory Protection in a Mouse Model of Alzheimer’s Disease
Abstract
Background:
Despite intense investigations, no effective treatment is yet available to reduce plaques and protect memory and learning in patients with Alzheimer’s disease (AD), the most common neurodegenerative disorder. Therefore, it is important to identify a non-toxic, but effective, treatment option for AD.
Objective:
Cinnamein, a nontoxic compound, is naturally available in Balsam of Peru and Tolu Balsam. We examined whether cinnamein treatment could decrease plaques and improve cognitive functions in 5XFAD mouse model of AD.
Methods:
We employed in silico analysis, time-resolved fluorescence energy transfer assay, thermal shift assay, primary neuron isolation, western blot, immunostaining, immunohistochemistry, Barnes maze, T maze, and open field behavior.
Results:
Oral administration of cinnamein led to significant reduction in amyloid-β plaque deposits in the brain and protection of spatial learning and memory in 5XFAD mice. Peroxisome proliferator-activated receptor alpha (PPARα), a nuclear hormone receptor, is involved in plaque lowering and increase in hippocampal plasticity. While investigating underlying mechanisms, we found that cinnamein served as a ligand of PPARα. Accordingly, oral cinnamein upregulated the level of PPARα, but not PPARβ, in the hippocampus, and remained unable to decrease plaques from the hippocampus and improve memory and learning in 5XFAD mice lacking PPARα. While A disintegrin and metalloproteinase domain-containing protein 10 (ADAM10) is one of the drivers of nonamyloidogenic pathway, transcription factor EB (TFEB) is considered as the master regulator of autophagy. Cinnamein treatment was found to upregulate both ADAM10 and TFEB in the brain of 5XFAD mice via PPARα.
Conclusions:
Our results suggest that this balsam component may have therapeutic importance in AD.
INTRODUCTION
Pathologically, Alzheimer’s disease (AD) is characterized by the deposition of extracellular senile plaques composed of aggregated amyloid-β (Aβ) and the formation of intracellular neurofibrillary tangles driven by hyperphosphorylation of the microtubule-associated protein tau [1–3]. On the other hand, being the most common form of dementia, AD is clinically characterized by progressive impairment in memory, judgment, decision making, and language usage [4]. At present, AD is considered as a multifactorial disease of the brain arising due to lifestyle changes, stress, aging, genetic alterations, and environmental factors [5, 6]. However, only 5–10% of AD cases are hereditary, thus leaving the rest (about 90%) of the cases as sporadic. Although the etiology of sporadic AD cases remains elusive, increasing evidence suggest that impaired Aβ clearance is one of the underlying mechanisms in patients with sporadic AD [7]. Therefore, delineation of non-toxic molecules capable of removing plaques from the CNS is an important area of research.
Cinnamein is a natural compound that is available in Balsam of Peru and Tolu Balsam [8, 9]. Cinnamein is not same as cinnamon, a natural spice and a flavoring ingredient [10–12]. While cinnamon contains multiple compounds such as cinnamaldehyde, benzaldehyde, cinnamic acid, styrene, benzene, 1,1’–(2-butene-1,4-diyl)bis-, benzene, 1,1’–(1,2-cyclobutanediyl)bis-, palmitic acid, stearic acid, 4-phenylbutyl chloride, (2,3-diphenylcyclopropyl)methyl phenyl sulfoxide, etc. [10], being a single compound, cinnamein is chemically known as benzyl cinnamate. It is non-toxic and white to pale yellow crystalline solid with a sweet odor. Pharmaceutically, cinnamein is utilized for its antibacterial and antifungal properties in tropical formulation. For example, Sudocrem, an over-the-counter medicated cream containing cinnamein, is primarily used for the treatment of nappy rash [13]. Moreover, it has a long medical history as part of balsam of tolu or balsam of Peru. In one hand, being a part of balsam of Peru, it finds use as an antiseptic for the treatment of burns and wounds, an expectorant, a heart stimulant, and a bactericidal agent. On the other hand, being a part of balsam of tolu, it is used to take care of cough, bronchitis, swollen airways, and cancer. Recently, we have delineated anti-inflammatory effect of cinnamein in which it inhibits the production of proinflammatory cytokine and nitric oxide in glial cells and macrophages [14].
Formation of amyloid plaques in neurons is known to be inhibited by ADAM10-driven nonamyloidogenic pathway [15]. On the other hand, degradation of amyloid plaques in stimulated by TFEB-mediated lysosome-autophagy pathway [16]. Here, we delineate beneficial effects of cinnamein in a mouse model of AD in which orally administered cinnamein upregulated non-amyloidogenic factor ADAM10 [17] and autophagy driver TFEB [18] in hippocampus and cortex, lowered plaque load from the brain and improved cognitive behaviors in 5XFAD mice. Although PPARα is a lipid-lowering transcription factor and liver is rich in PPARα, it is also present in the hippocampus [19, 20]. Interestingly, we also observed that cinnamein bound to the ligand-binding domain of PPARα and that cinnamein remained unable to upregulate ADAM10 and TFEB, reduce plaques from the hippocampus and increase spatial learning and memory in 5XFAD mice lacking PPARα. These results underline new properties of cinnamein: lowering hippocampal plaques and upregulating memory and learning via direct collaboration with PPARα.
MATERIALS AND METHODS
Animals and cinnamein treatment
We used 6-month-old male and female 5XFAD, background-matched non-transgenic (non-Tg) and 5X FADΔPPARα (5XFAD lacking PPARα) mice for this study. All animals were housed under a 12-h light/dark cycle with ad libitum access to food and water. All animal experiments were carried out following the guidelines and approval of the Institutional Animal Care and Use Committee. Since sodium benzoate protected 5XFAD mice at a dose of 50 mg/kg body wt/day [21], we also considered the same dose for cinnamein or benzyl cinnamate. Accordingly, 6-month-old 5XFAD mice were treated with cinnamein (50 mg/kg body weight/day) that was solubilized in 100 μl 0.1% methyl cellulose via gavage for 30 days. Therefore, control 5XFAD mice received only 100 μl 0.1% methyl cellulose as vehicle.
Barnes maze
The Barnes Maze (BM) test apparatus consisted of a circular platform (75 cm diameter) elevated 1 meter above the floor with 20 equally spaced holes (5 cm diameter) along the perimeter. One hole led to an escape box. Visual cues were placed around the maze. Over four consecutive days, mice underwent 2 trials per day for 2 day with a day of rest on the third day and trials were recorded on the fourth day. Each trial started by placing the mouse in the center of the platform under a start chamber, which was lifted to initiate the trial. The trial ended when the mouse entered the escape box or after 3 min had elapsed. The platform and escape box were cleaned with 70% ethanol between trials. On the test day, a video camera (Basler Gen I Cam - Basler acA 1300-60) connected to a Noldus computer system was placed above the maze and was illuminated with high wattage light to generate enough light and heat for motivating mice to enter into the escape tunnel. The performance was monitored by the Noldus video tracking system as described by us [22, 23].
T-maze
It was performed as described before [22, 23]. The T-maze apparatus was made of black plastic and consisted of a start arm (30 cm long×10 cm wide) and two identical goal arms forming a “T” shape. Mice were habituated in the T-maze for two days under food-deprived conditions so that animals can eat food rewards at least five times during a 10 min period of training. During each trial, mice were placed in the start point for 30 s and then forced to make a right arm turn which was always baited with color food chips. The test consisted of two trials: a forced-choice run followed by a free-choice run. In the forced-choice run, one arm was randomly blocked, and the mouse was allowed to enter the unblocked arm. After a brief inter-trial interval (1 min), the mouse was returned to the start arm for the free-choice run where it could freely choose either arm. Entry into the previously unvisited arm was scored as a correct choice as described by us [22, 23]. The maze was cleaned with 70% ethanol between trials.
Open field test
The open field test apparatus was a square arena (50×50 cm) with 40 cm high walls made of opaque plastic. The arena floor was divided into two parts, the perimeter and the center. Each mouse was placed in the center of the arena and allowed to explore freely for 5 minutes. The total distance traveled and time spent in the central and peripheral zones were recorded using video tracking software as described by us [24, 25].
In silico analysis
To get insight into the interaction between cinnamein and ligand-binding domain (LBD) of PPARs, in silico docking study was performed as described before [26–28] with modifications. In this case, Autodock4 (The Scripps Research Institute, La Jolla, USA) was used. First, the ligand molecule (.sdf file) was downloaded from the Zinc database and then further processed using Open Babel and saved as a PDB. The three-dimensional structures of PPARα (PDB:3vi8) and PPARδ/β (PDB:5xmx) were downloaded from the protein data bank website. Prior to docking, the crystal structures of the proteins were refined, water molecules were deleted, the polar hydrogen and the Kollman Charges were added. The final docked structures were generated with the help of Pymol software (http://www.pymol.org/).
Thermal shift assay (TSA)
TSA was performed in QuantStudio 3 real-time thermal cycler with thermal shift dye kit (Thermo Fisher), as described before [23, 29, 30]. Briefly, purified protein (0.5 μg to 1 μg) was added to 18 μl of thermal shift buffer and 1–2 μl of dye for each reaction. Reaction was fixed in 96-well PCR plate in dark and then placed in the thermal cycler using the following two-stage program ([25°C for 2 min] 1 cycle; [27°C for 15 s, 26°C for 1 min] 70 cycles; auto increment 1°C for both stages). The filter was set at ROX with no passive filter and no quencher filter.
Time-resolved fluorescence energy transfer (TR-FRET)
Lanthascreen TR-FRET PPARα coactivator assay kit was used for TR-FRET assay as described earlier [23, 29, 30]. Briefly, cinnamein was added to GST-tagged recombinant PPARα LBD, terbium (Tb)-tagged anti GST antibody, and fluorescein (FL)-tagged PGC-1α as mentioned in the manufacturer’s protocol. Plate was centrifuged, incubated in dark for 30 min, and then analyzed in molecular devices analyst. The excitation and emission were set at 340 nm and 540 nm, respectively.
Tissue preparation and plaque immunostaining
Mouse brains were harvested after behavior experiments were completed, post-fixed in 4% paraformaldehyde, and cryoprotected in 30% sucrose [31, 32]. Coronal sections (40 μm) were cut on a freezing microtome. For 6E10 DAB staining, sections were washed in PBS, then blocked in a solution of PBS with 2% bovine serum albumin (BSA) and 0.3% Triton X-100 for 1 hour at room temperature. Sections were incubated overnight at 4°C with 6E10 antibody (1 : 500, BioLegend) in blocking solution. After three washes in PBS, sections were incubated with biotinylated goat anti-mouse secondary antibody (1 : 200) for 2 h at room temperature, followed by amplification with an ABC kit (Vector Laboratories) and color development with DAB substrate kit (Vector Laboratories). Sections were then mounted, dehydrated, cleared, and cover slipped.
Immunocytochemistry and immunohistochemistry
For immunocytochemistry, cultured neurons were fixed with 4% PFA for 30 min at room temperature, then permeabilized with chilled Methanol for 15 min and stored in –20°C until ready for processing. For immunohistochemistry, brain sections were washed with PBS and permeabilized with 0.3% Triton X-100 for 20 min.
After blocking in 2% bovine serum albumin for 1 h, samples were incubated overnight at 4°C with primary antibodies: Sections were then incubated overnight at 4°C with the primary antibodies: mouse anti-amyloid beta 1–16 (6E10, BioLegend) at 1 : 500, rabbit anti-PPARα (Abcam) at 1 : 200, rabbit anti-PPARβ (Abcam) at 1 : 200, mouse anti-NeuN (Millipore) at 1 : 500, mouse anti-MAP2 (1 : 1000, Sigma-Aldrich), rabbit anti-ADAM10 (1 : 500, Abcam), and rabbit anti-TFEB (1 : 200, Cell Signaling Technology). Following primary antibody incubation, samples were incubated with appropriate Alexa Fluor-conjugated secondary antibodies (1 : 500, Invitrogen) for 1 h at room temperature. Nuclei were counterstained with DAPI. Samples were mounted using fluorescence mounting medium and imaged using a fluorescence microscope.
Thioflavin-S staining
After the secondary antibody incubation, sections were stained with 0.05% Thioflavin-S in 50% ethanol for 8 min, followed by differentiation in 80% ethanol for 30 s. The sections were then washed with distilled water and coverslipped with a fluorescence mounting medium as described [23, 33].
Plaque quantification using ImageJ/FIJI
It was performed as described before [17, 23]. Briefly, digital images of stained sections were captured under brightfield illumination. Aβ plaque quantification was performed using ImageJ/FIJI software. The images were converted to 8-bit, and a uniform threshold was applied to all images. Regions of interest specific to the entire hippocampal formation and cortex were empirically defined. Using the analyze particles function, total plaque area, average plaque size, and average puncta count were determined to quantify amyloid area fraction and plaque numbers.
Mean fluorescence intensity calculation
Fluorescent images were captured using a fluorescence microscope. For each animal, at least 3 sections were selected, and 5 fields of view per section were randomly chosen for imaging. The exposure time and gain were kept constant across all the images. Mean fluorescence intensity (MFI) was calculated using ImageJ/FIJI software as described [19, 34]. After background subtraction, a region of interest (ROI) was drawn around the area of staining, and the mean grey value was obtained. The MFI was calculated as the integrated density divided by the area of the ROI.
Western blotting
It was performed as described before [33, 34]. Briefly, after treatment, mice were anesthetized with ketamine and xylazine, perfused with PBS and hippocampal tissues were homogenized in RIPA buffer containing protease and phosphatase inhibitors. Protein concentrations were determined using the BCA Protein Assay kit. Equal amounts of protein were separated on SDS-PAGE and then transferred onto PVDF membranes. Membranes were blocked with Licor PBS Intercept Blocking Buffer for 1 hour at room temperature and then incubated with Biolegend 6E10 antibody (1 : 1000) overnight at 4°C. After washing, membranes were incubated with Licor conjugated secondary antibody (1 : 5000) for 2 h at room temperature. Bands were visualized using an ECL detection system.
Band intensity analysis using ImageJ/FIJI
The intensity of the western blot bands was quantified using ImageJ/FIJI. Digital images of blots were opened in ImageJ/FIJI, and the area, mean grey value, and integrated density of each band were measured. The background near each band was also measured and subtracted from the band’s integrated density to obtain the corrected total band intensity.
Preparation of primary mouse cortical and hippocampal neurons
Primary neurons were isolated as described before [23, 35] with slight modifications. Pregnant C57BL/6 mice at embryonic day 18 (E18) were euthanized, and the fetuses were quickly removed. The cerebral cortex and hippocampus were dissected out from each fetus under a dissection microscope. Tissue was minced and enzymatically dissociated using 0.25% trypsin for 15 min at 37°C. Trypsin was neutralized with fetal bovine serum (FBS), and cells were mechanically dissociated by gentle pipetting. The cell suspension was passed through a 40 μm cell strainer and centrifuged at 200 g for 5 min. The cells were resuspended in Neurobasal medium supplemented with B27, GlutaMAX, and antibiotics, then seeded onto poly-D-lysine-coated coverslips at a density of 1×10⁵ cells/cm2. Cells were maintained at 37°C in a 5% CO2 incubator, and half of the medium was replaced with fresh medium every 7 days.
Statistical analysis
Quantitative data were expressed as mean±SEM. Comparisons were made using Student’s t-test or one-way ANOVA followed by post hoc tests as appropriate. A p-value < 0.05 was considered statistically significant.
RESULTS
Cinnamein attenuates Aβ plaque load in 5XFAD mice
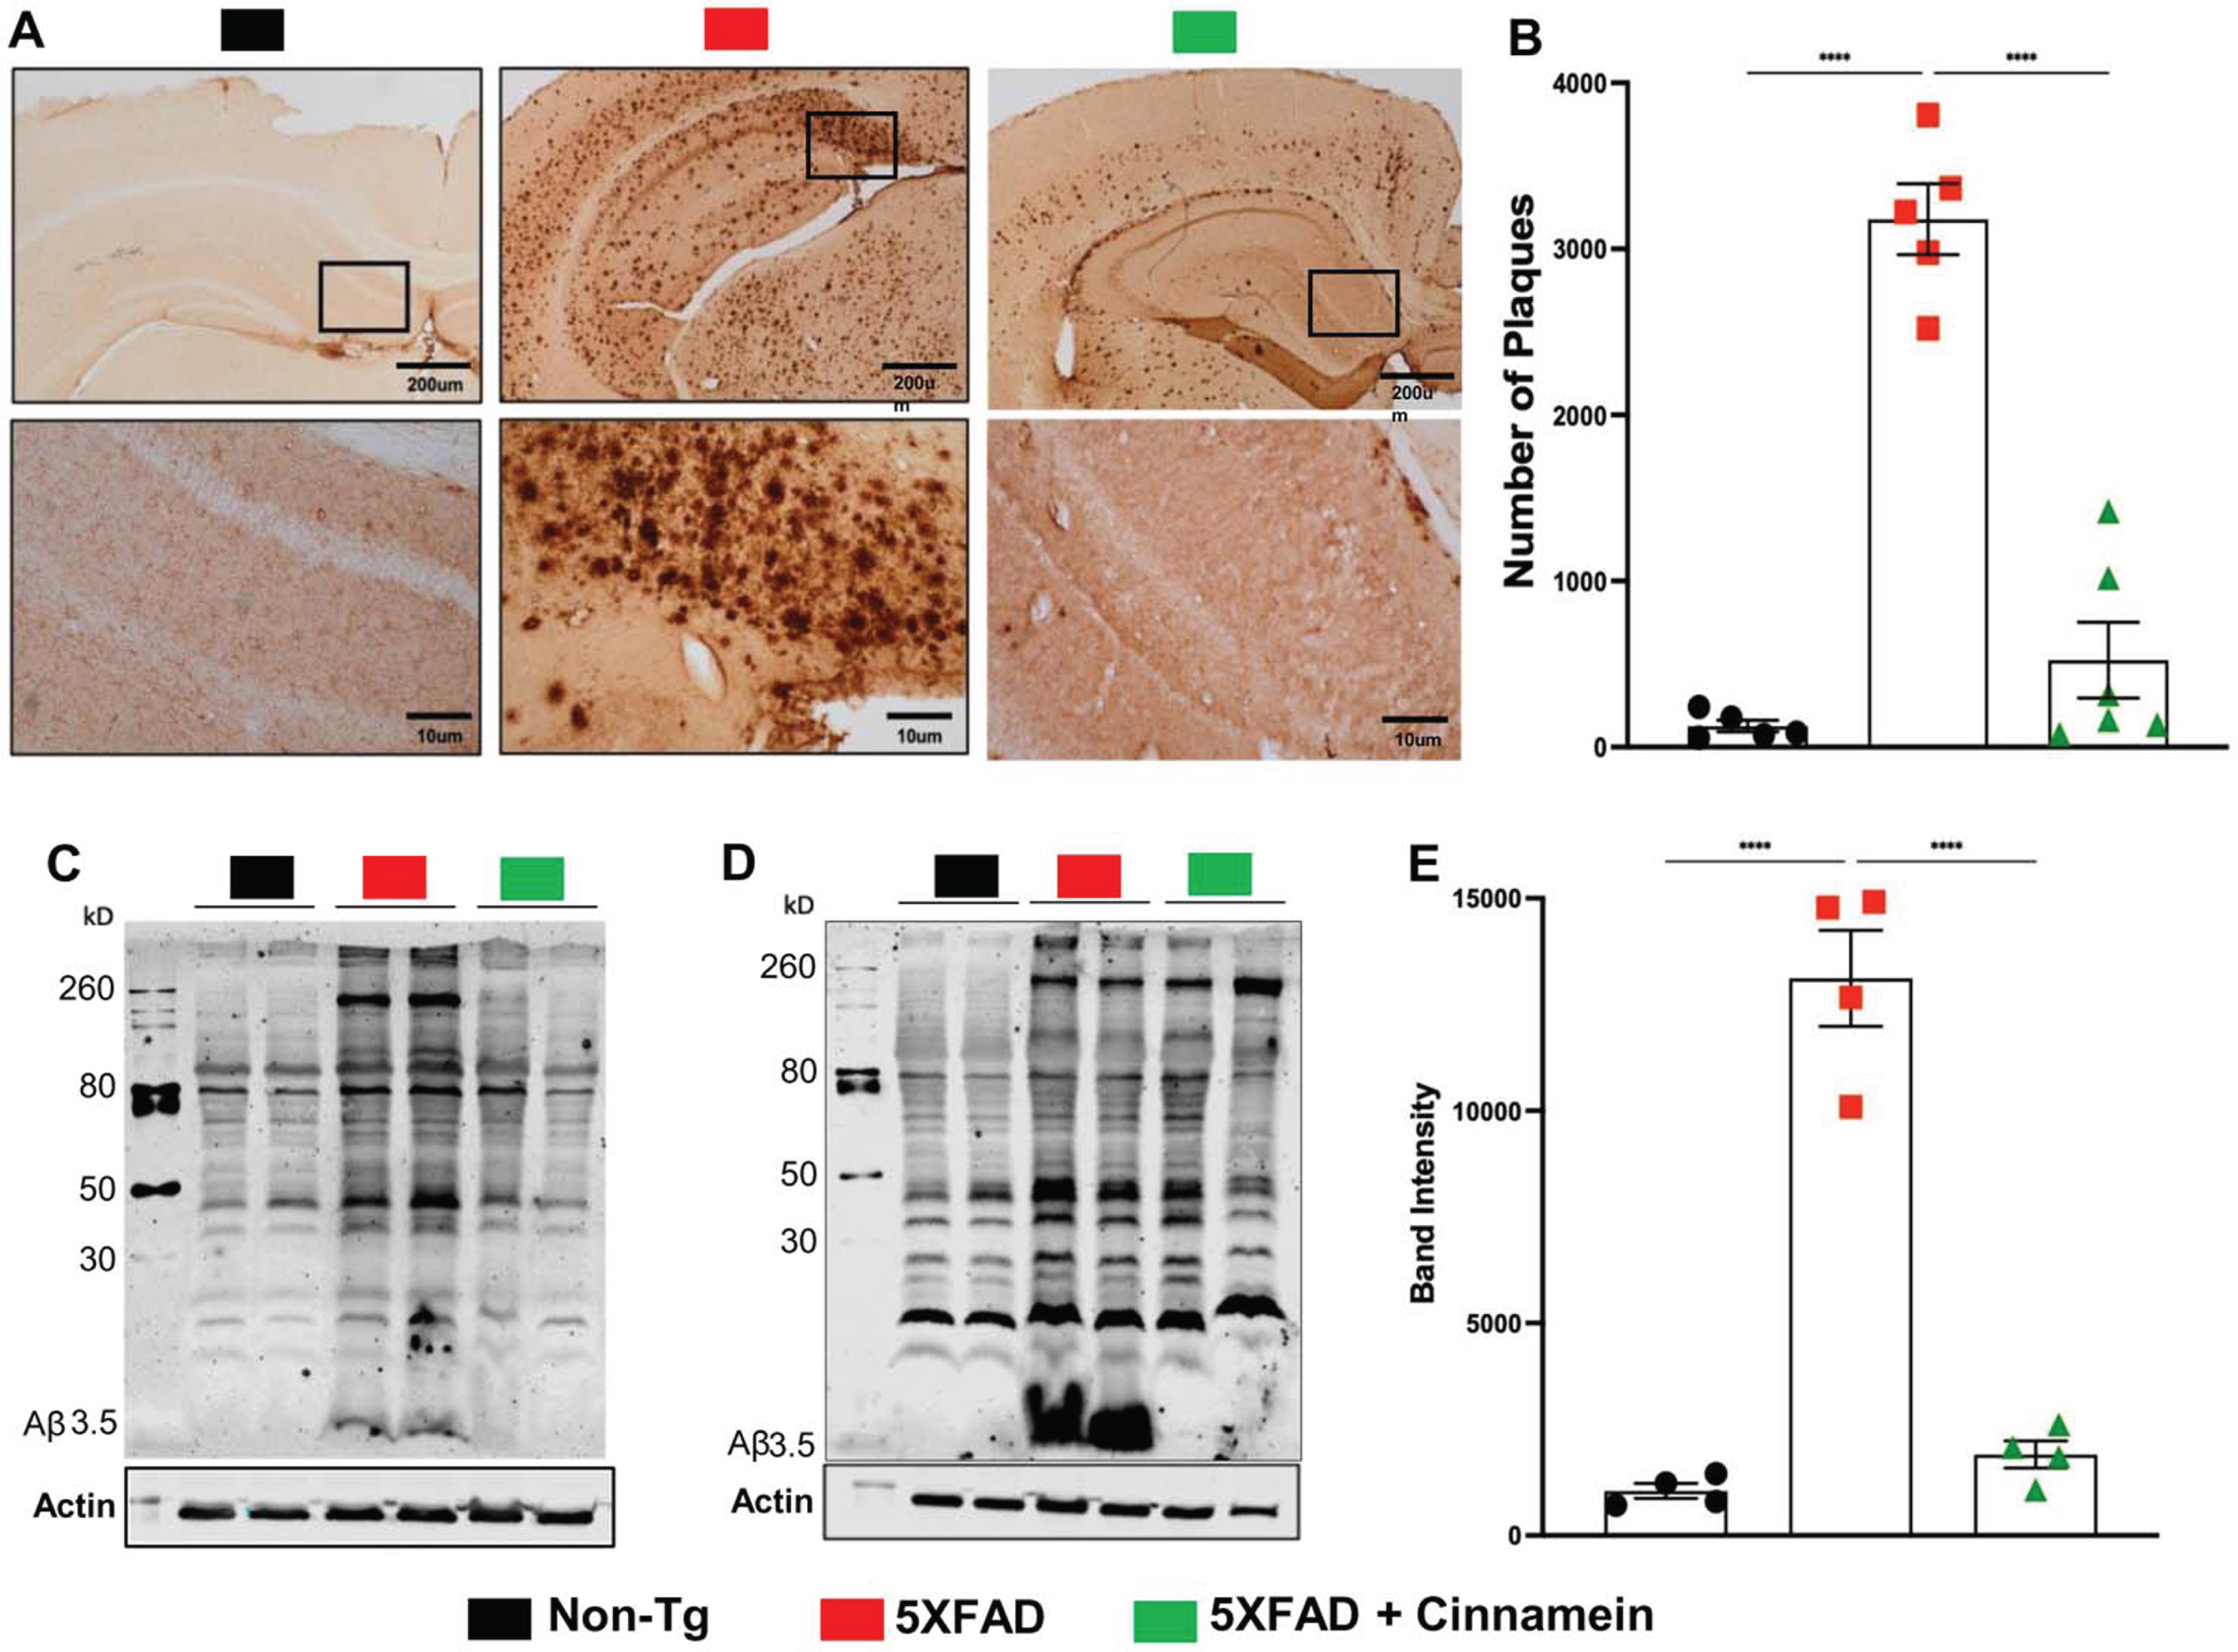
The therapeutic potential of cinnamein was first examined on plaque deposition in the 5XFAD model of AD. Male and female 5XFAD mice at 6 months of age (n = 12) received an oral dosage of 50 mg/kg/day of cinnamein over a one-month span. Post treatment, the Aβ plaque deposition in the hippocampus was gauged through diaminobenzidine (DAB) staining (Fig. 1A). A significant reduction in the amyloid plaque burden within the hippocampus was observed in the cinnamein-treated mice relative to the untreated 5XFAD group. Further analysis quantifying the total count of Aβ plaques in the hippocampus (two sections per mouse) was performed using Image J (Fig. 1B), which also showed decrease in plaque load by cinnamein treatment. Subsequently, immunoblotting of the hippocampal homogenate was done with the Aβ 6E10 monoclonal antibody, indicating a marked decrease in Aβ levels due to cinnamein treatment (Fig. 1C, D). Densitometric analysis further confirmed this reduction when comparing Aβ levels relative to actin (Fig. 1E).
Fig. 1
Oral administration of cinnamein reduces Aβ deposition. Six-month-old 5XFAD mice (n = 9) were administered cinnamein orally (50 mg/kg/day) for one month followed by measurement of amyloid-β (Aβ) plaque load by (A) diaminobenzidine (DAB) staining of hippocampal sections (1.25x and 20x magnification) followed by (B) quantification of total count of Aβ plaques in the hippocampus (two sections per mouse of 5 mice per group) using Image J. Immunoblotting of hippocampal homogenates (C, n = 2; D, n = 2) with Aβ 6E10 monoclonal antibody and densitometric analysis (E) of relative Aβ levels (Aβ/Actin) of four mice (n = 4) per group. All data, analyzed with Prism, represent the mean±SEM. One-way ANOVA followed by Šìdák’s multiple comparisons test was used for statistical analysis; ****p < 0.0001.
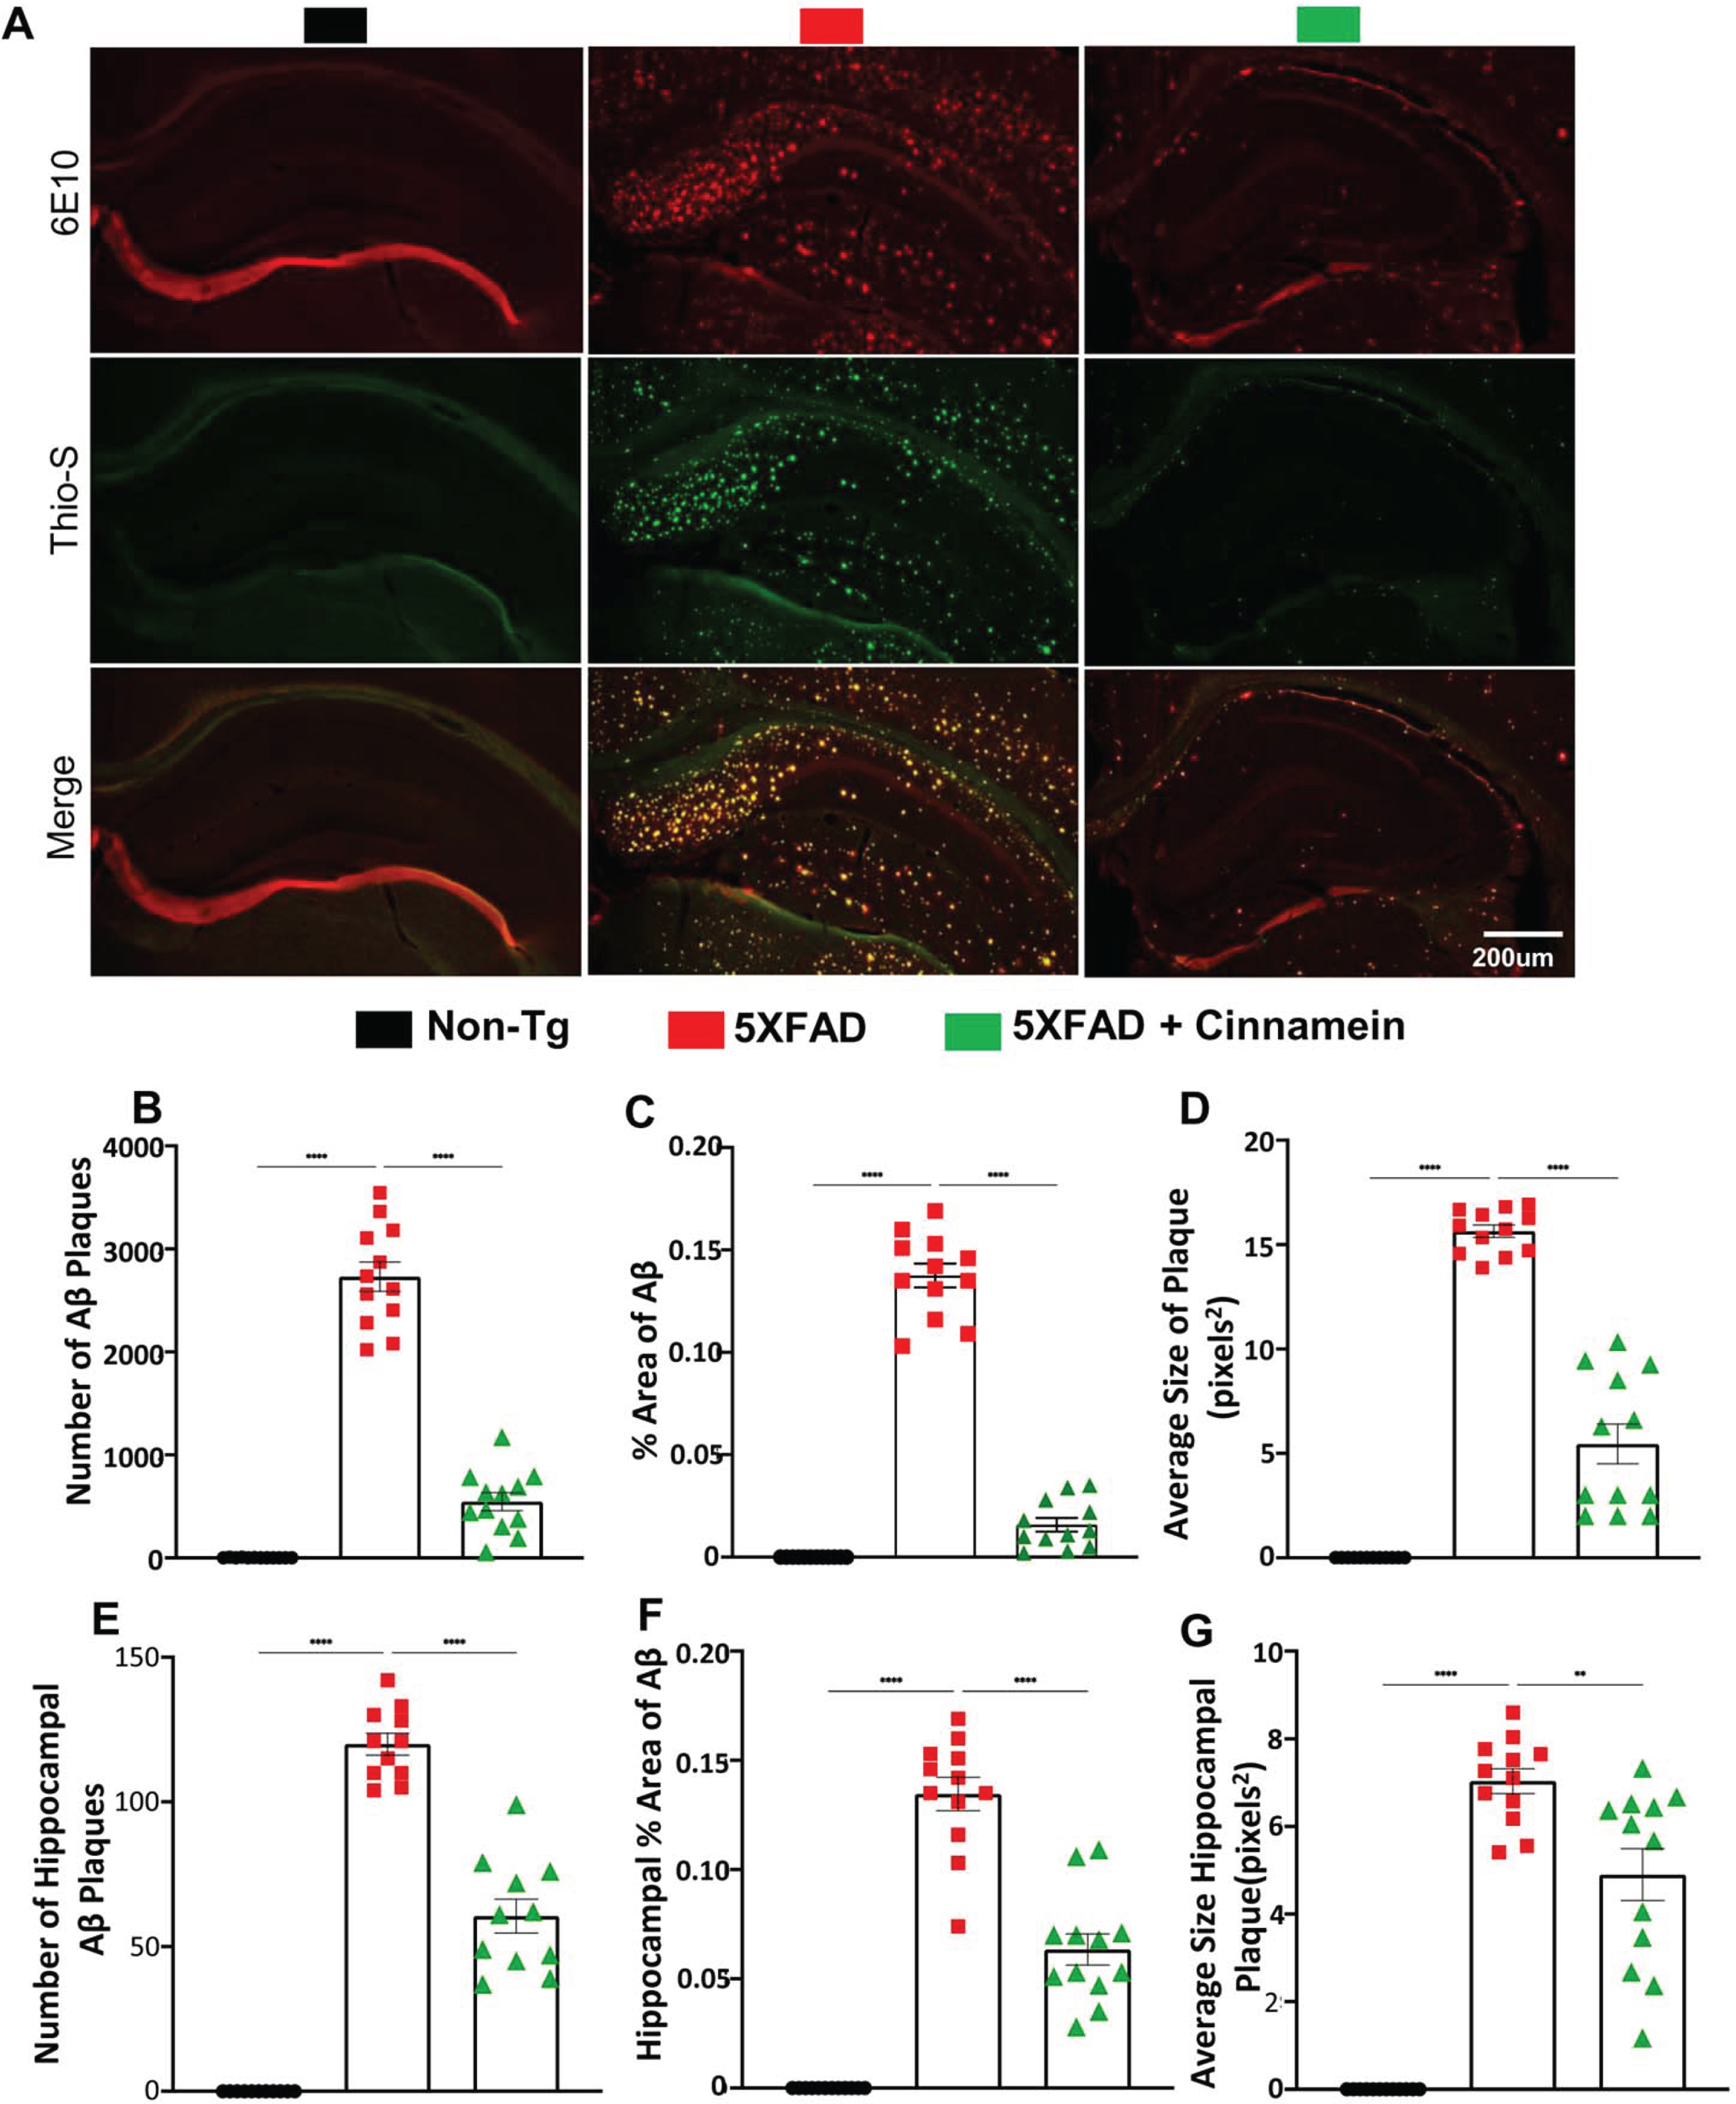
Additional assessment of the cinnamein’s impact on plaques was conducted in another cohort of 6-month-old 5XFAD mice (n = 6), focusing on the overall brain and specifically the hippocampus. Immunofluorescent staining was employed using 6E10 and Thio-S to pinpoint the location and morphology of Aβ and protein aggregates. Notably, cinnamein significantly curbed the Aβ plaque load, as evidenced in whole brain sections (Fig. 2A, B) and localized regions of the hippocampus (Fig. 2E, F). Metrics such as the percentage area and average size of the Aβ plaques were derived through Image J, revealing significant reductions in both parameters post cinnamein treatment (Fig. 2C, % area of Aβ; Fig. 2D, average size of plaque; Fig. 2G, average size of hippocampal plaque). Statistical evaluations, undertaken using Prism and employing one-way ANOVA followed by Šìdák’s multiple comparisons test, signified the data’s robustness, with p-values of **p < 0.01 and ****p < 0.0001. Collectively, the evidence presented underscores that the oral administration of cinnamein is capable of curtailing amyloid plaque pathology in 5XFAD mice.
Fig. 2
Cinnamein attenuates Aβ plaque pathology and protein aggregates. Six-month-old 5XFAD mice (n = 6) were treated with cinnamein orally (50 mg/kg/day) via gavage for one month followed by monitoring amyloid plaque load by double-label immunofluorescence for 6E10 and Thio-S (A). Image J was used to quantify the number of Aβ plaques (B, whole brain; E, hippocampus), % area of Aβ plaques (C, whole brain; F, hippocampus) and average size of Aβ plaques (D, whole brain; G, hippocampus) in two sections of each of six mice per group. All data, analyzed with Prism, represent the mean±SEM. One-way ANOVA followed by Šìdák’s multiple comparisons test was used for statistical analysis. **p < 0.01; ****p < 0.0001.
Cinnamein enhances cognitive functions in 5XFAD mice
A core symptom of AD is cognitive dysfunction. With this in mind, the effects of cinnamein on the cognitive capabilities of 5XFAD mice were examined. Prior studies have established that several agents can augment memory and learning via various mechanisms [32, 36, 37], but the cognitive benefits of cinnamein remain uncharted. Post a one-month treatment regimen with cinnamein, the cognitive functions of 5XFAD mice were tested using Barnes Maze and T-Maze.
For the Barnes Maze assessment, a heat map vividly charted each mouse’s journey from the maze’s center to the target (Fig. 3A). Quantitative analysis by Noldus computer system was employed to evaluate the number of errors committed (Fig. 3B) and the latency to find the target (Fig. 3C). 5XFAD mice treated with cinnamein showed significant improvement, manifested by fewer errors (Fig. 3B) and reduced latency times (Fig. 3C), suggesting enhanced memory capacities.
Fig. 3
Cinnamein improves cognitive functions in 5XFAD mice. Six-month-old 5XFAD mice were administered cinnamein orally (50 mg/kg/day) for one month followed by Barnes maze, T-maze and open field tests. A heatmap (A) tracks the trajectory of each mouse to find the target starting from the center of the Barnes maze (n = 5). Image J was used to quantify errors made (B) and latency (C) to find the target. T-maze results reveal the number of positive turns (D) and negative turns (E) made by each mouse (n = 6). Time spent in the center of the open field arena (a measure of anxiety) (F, heatmap; G, center time) and the velocity (H) of mice (n = 5). All data, analyzed with Prism, represent the mean±SEM. One-way ANOVA followed by Šìdák’s multiple comparisons test was used for statistical analysis. *p < 0.05; ***p < 0.001; ****p < 0.0001; ns, not significant.
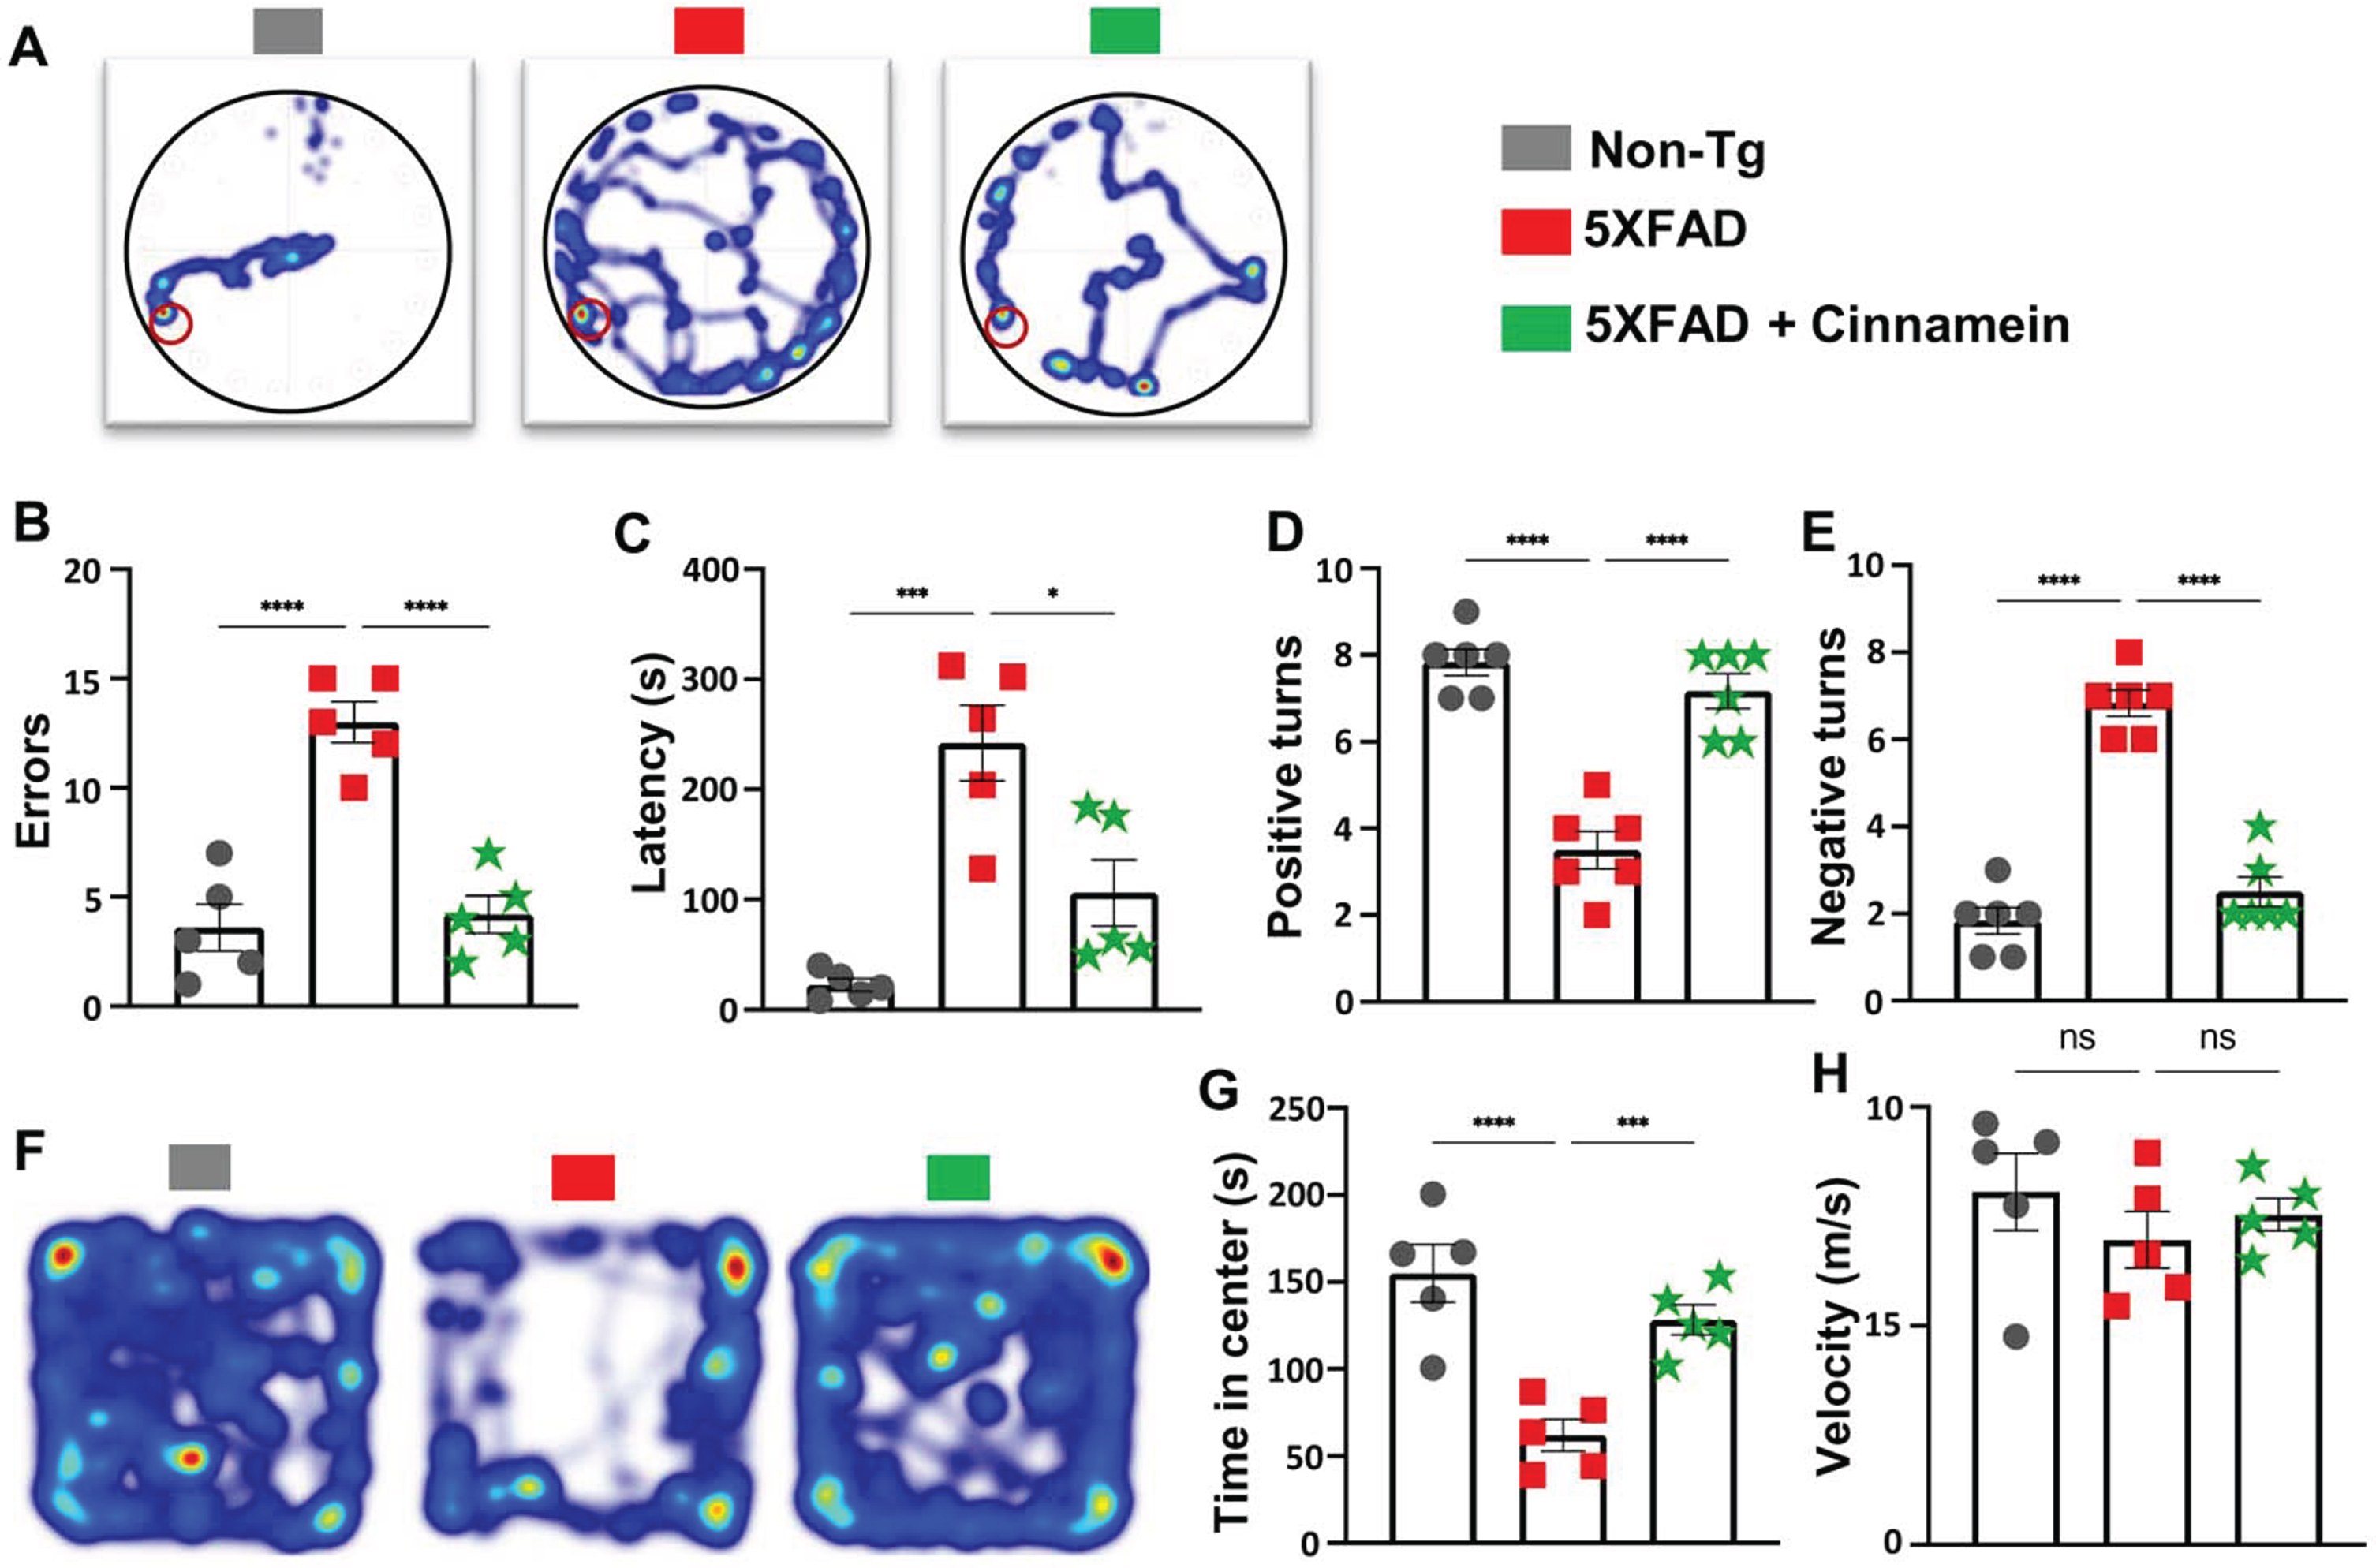
Next, the T-Maze test was utilized to further delineate spatial learning and memory performance [31, 36]. Results indicated that cinnamein-treated 5XFAD mice exhibited an increased number of positive turns (Fig. 3D) and committed fewer errors (Fig. 3E) when compared to untreated counterparts.
The open field test offered insights into anxiety levels and motor activity. Time spent by each mouse in the arena’s center, a well-accepted marker for anxiety, was notably different among the groups (Fig. 3F, heatmap; Fig. 3G, center time). While 5XFAD mice spent less time at the center as compared to non-Tg mice, after cinnamein treatment, 5XFAD mice occupied more time at the center than untreated 5XFAD mice (Fig. 3F-3G). The velocity at which the mice moved around the arena was also logged (Fig. 3H), and we did not find any significant difference in velocity (Fig. 3H) among different groups of mice, indicating that the improvement in spatial learning and memory by cinnamein was not due to any improvement in general locomotor activities.
Cinnamein reduces amyloid accumulation through PPARα activation
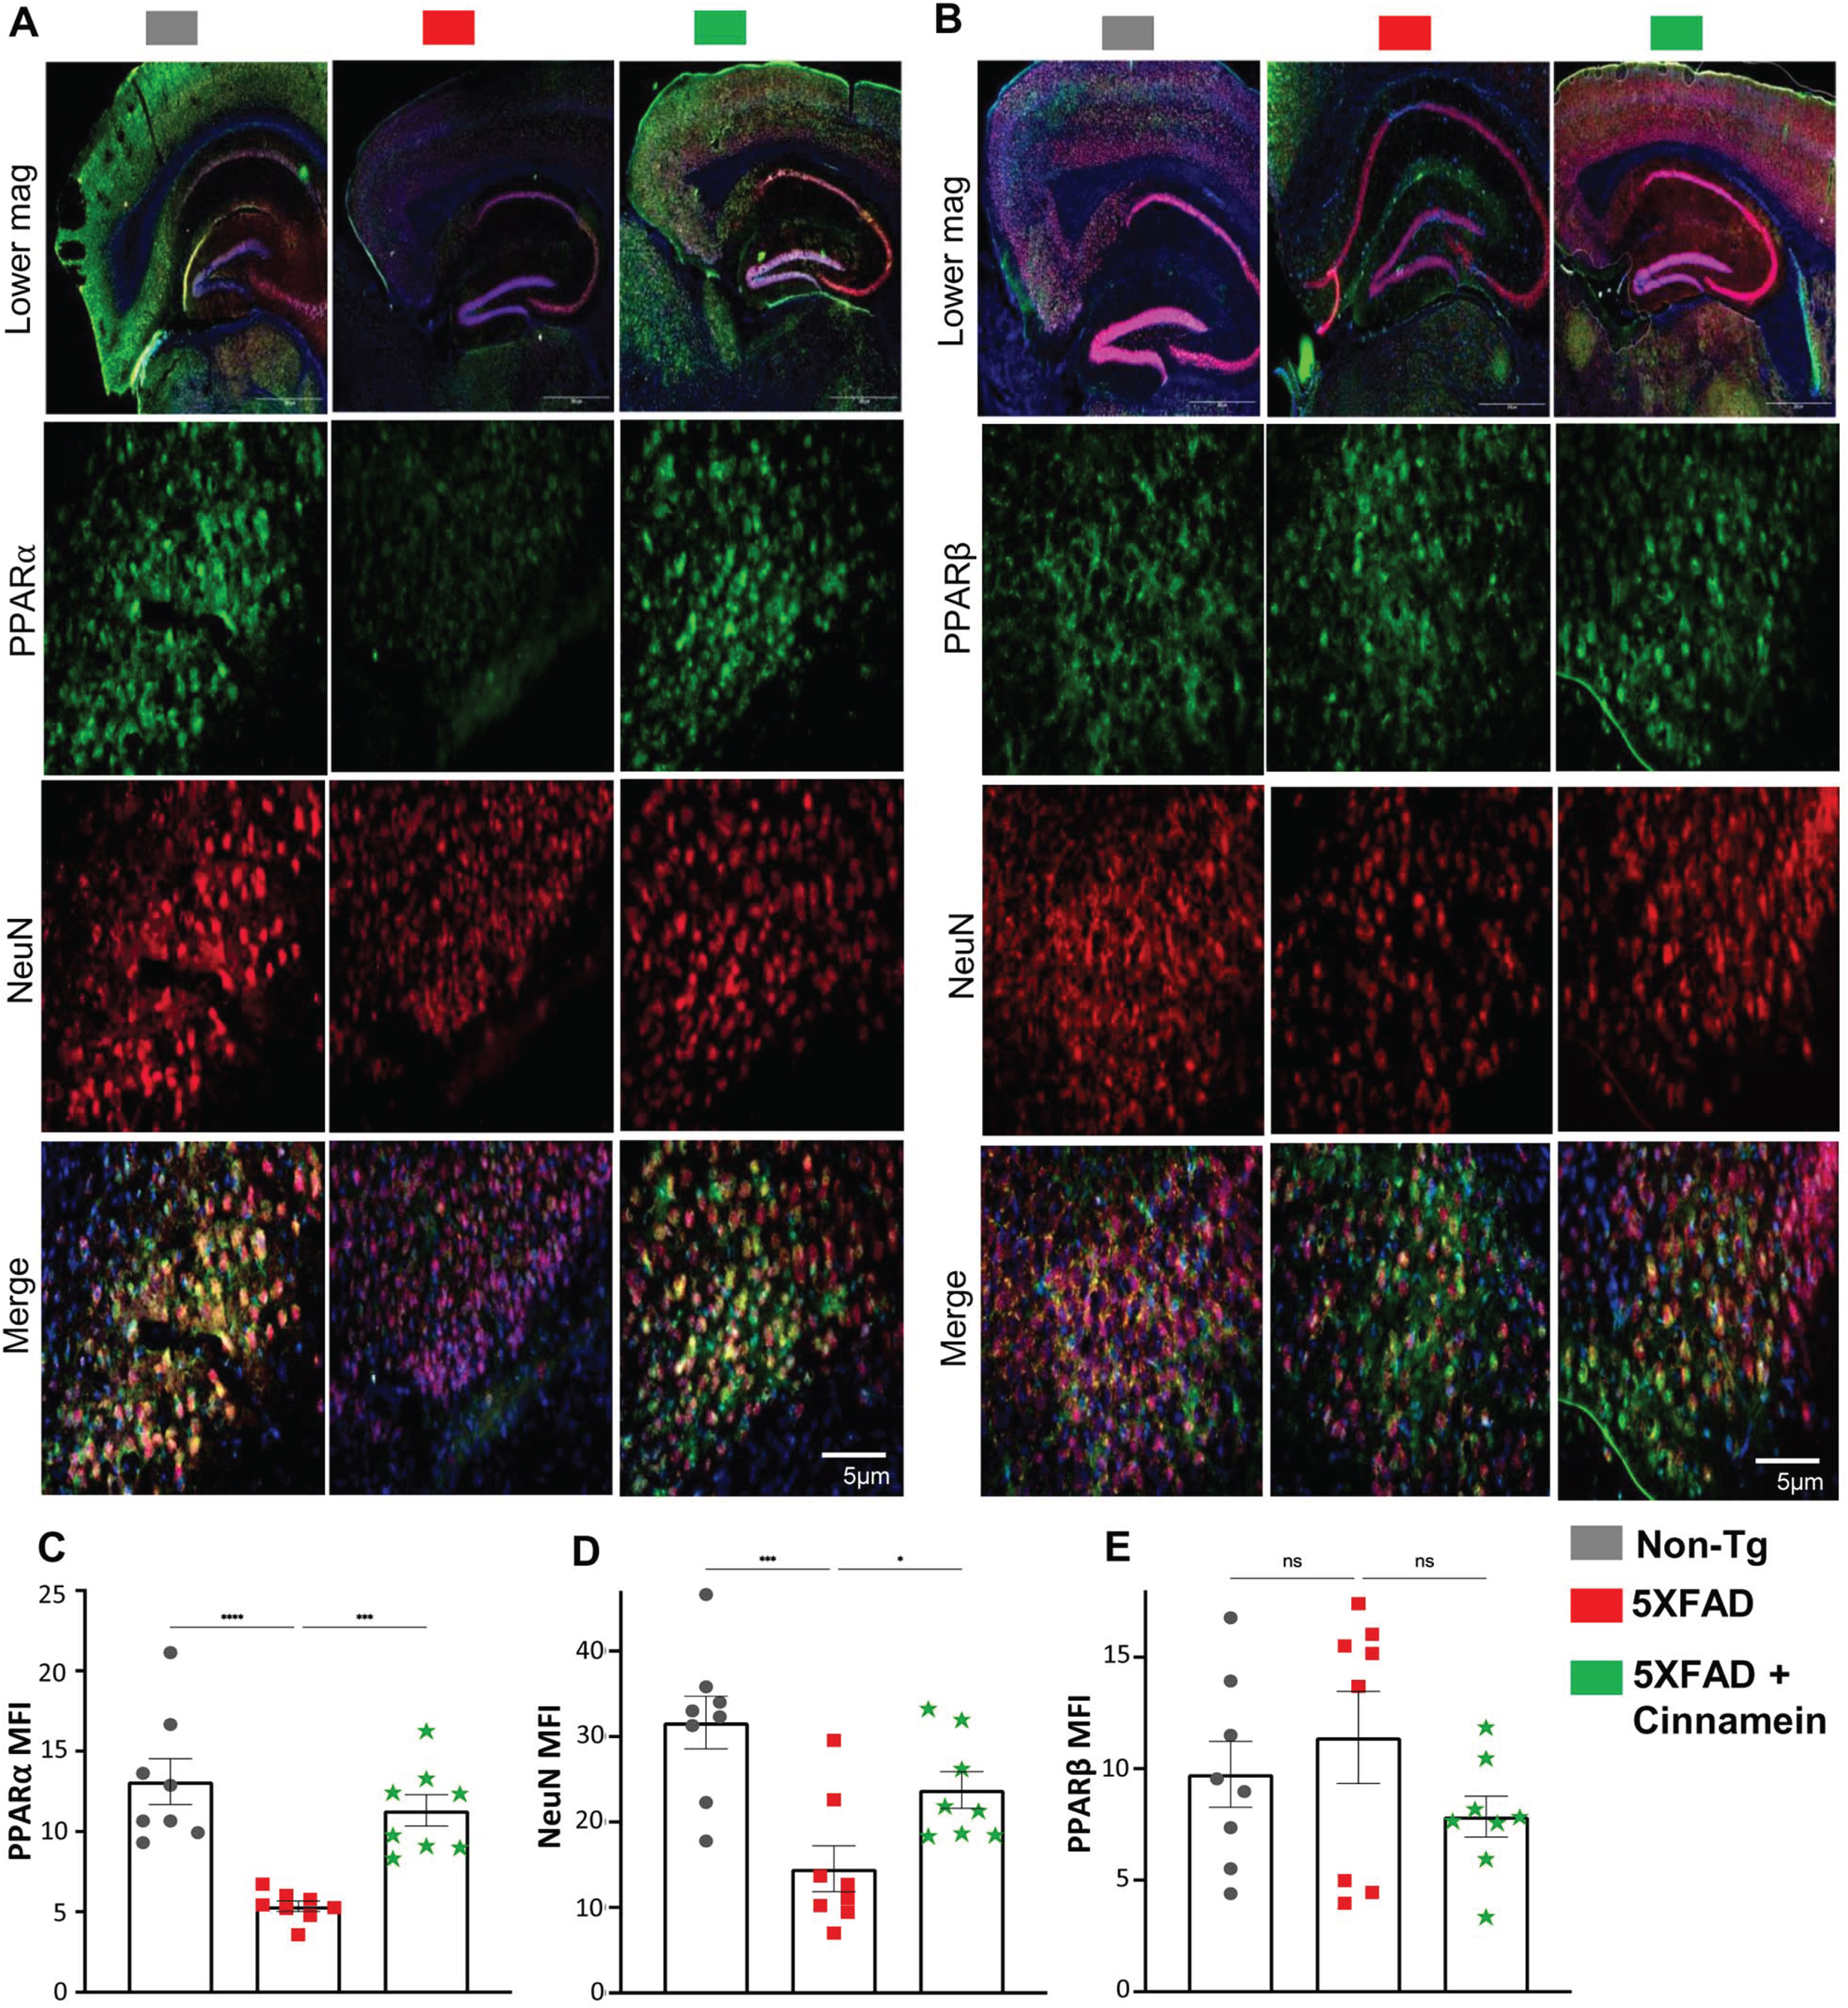
To elucidate the mechanism underpinning cinnamein’s capability of lowering plaque load in 5XFAD mice, we explored its association with PPARα given its involvement in plaque lowering [17, 33]. As reported before [38, 39], the level of PPARα was less in the hippocampus of 5XFAD mice as compared to non-Tg mice (Fig. 4A). However, the level of PPARα was noticeably upregulated in the subiculum of 5XFAD mice post-cinnamein treatment (Fig. 4A). On the other hand, the level of PPARβ remained unaltered (Fig. 4B). Specifically, immunofluorescent labeling showed distinct PPARα (Fig. 4A) and negligible PPARβ (Fig. 4B) colocalization when co-labeled with NeuN (a neuronal marker). Subsequent quantification of mean fluorescent intensities of PPARα (Fig. 4C) and PPARβ (Fig. 4D) also corroborated the finding.
Fig. 4
Oral administration of cinnamein upregulates PPARα expression in 5XFAD mice. Six-month-old 5XFAD mice were treated with cinnamein orally (50 mg/kg/day) for one month followed by double-labeling of either NeuN & PPARα (A) or NeuN & PPARβ (B) in the subiculum. Mean fluorescence intensity (MFI) of PPARα (C), NeuN (D) and PPARβ (E) was quantified in one section of each of eight mice per group (n = 8). All data, analyzed with Prism, represent the mean±SEM. One-way ANOVA followed by Šìdák’s multiple comparisons test was used for statistical analysis. *p < 0.05; ***p < 0.001; ****p < 0.0001; ns, not significant.
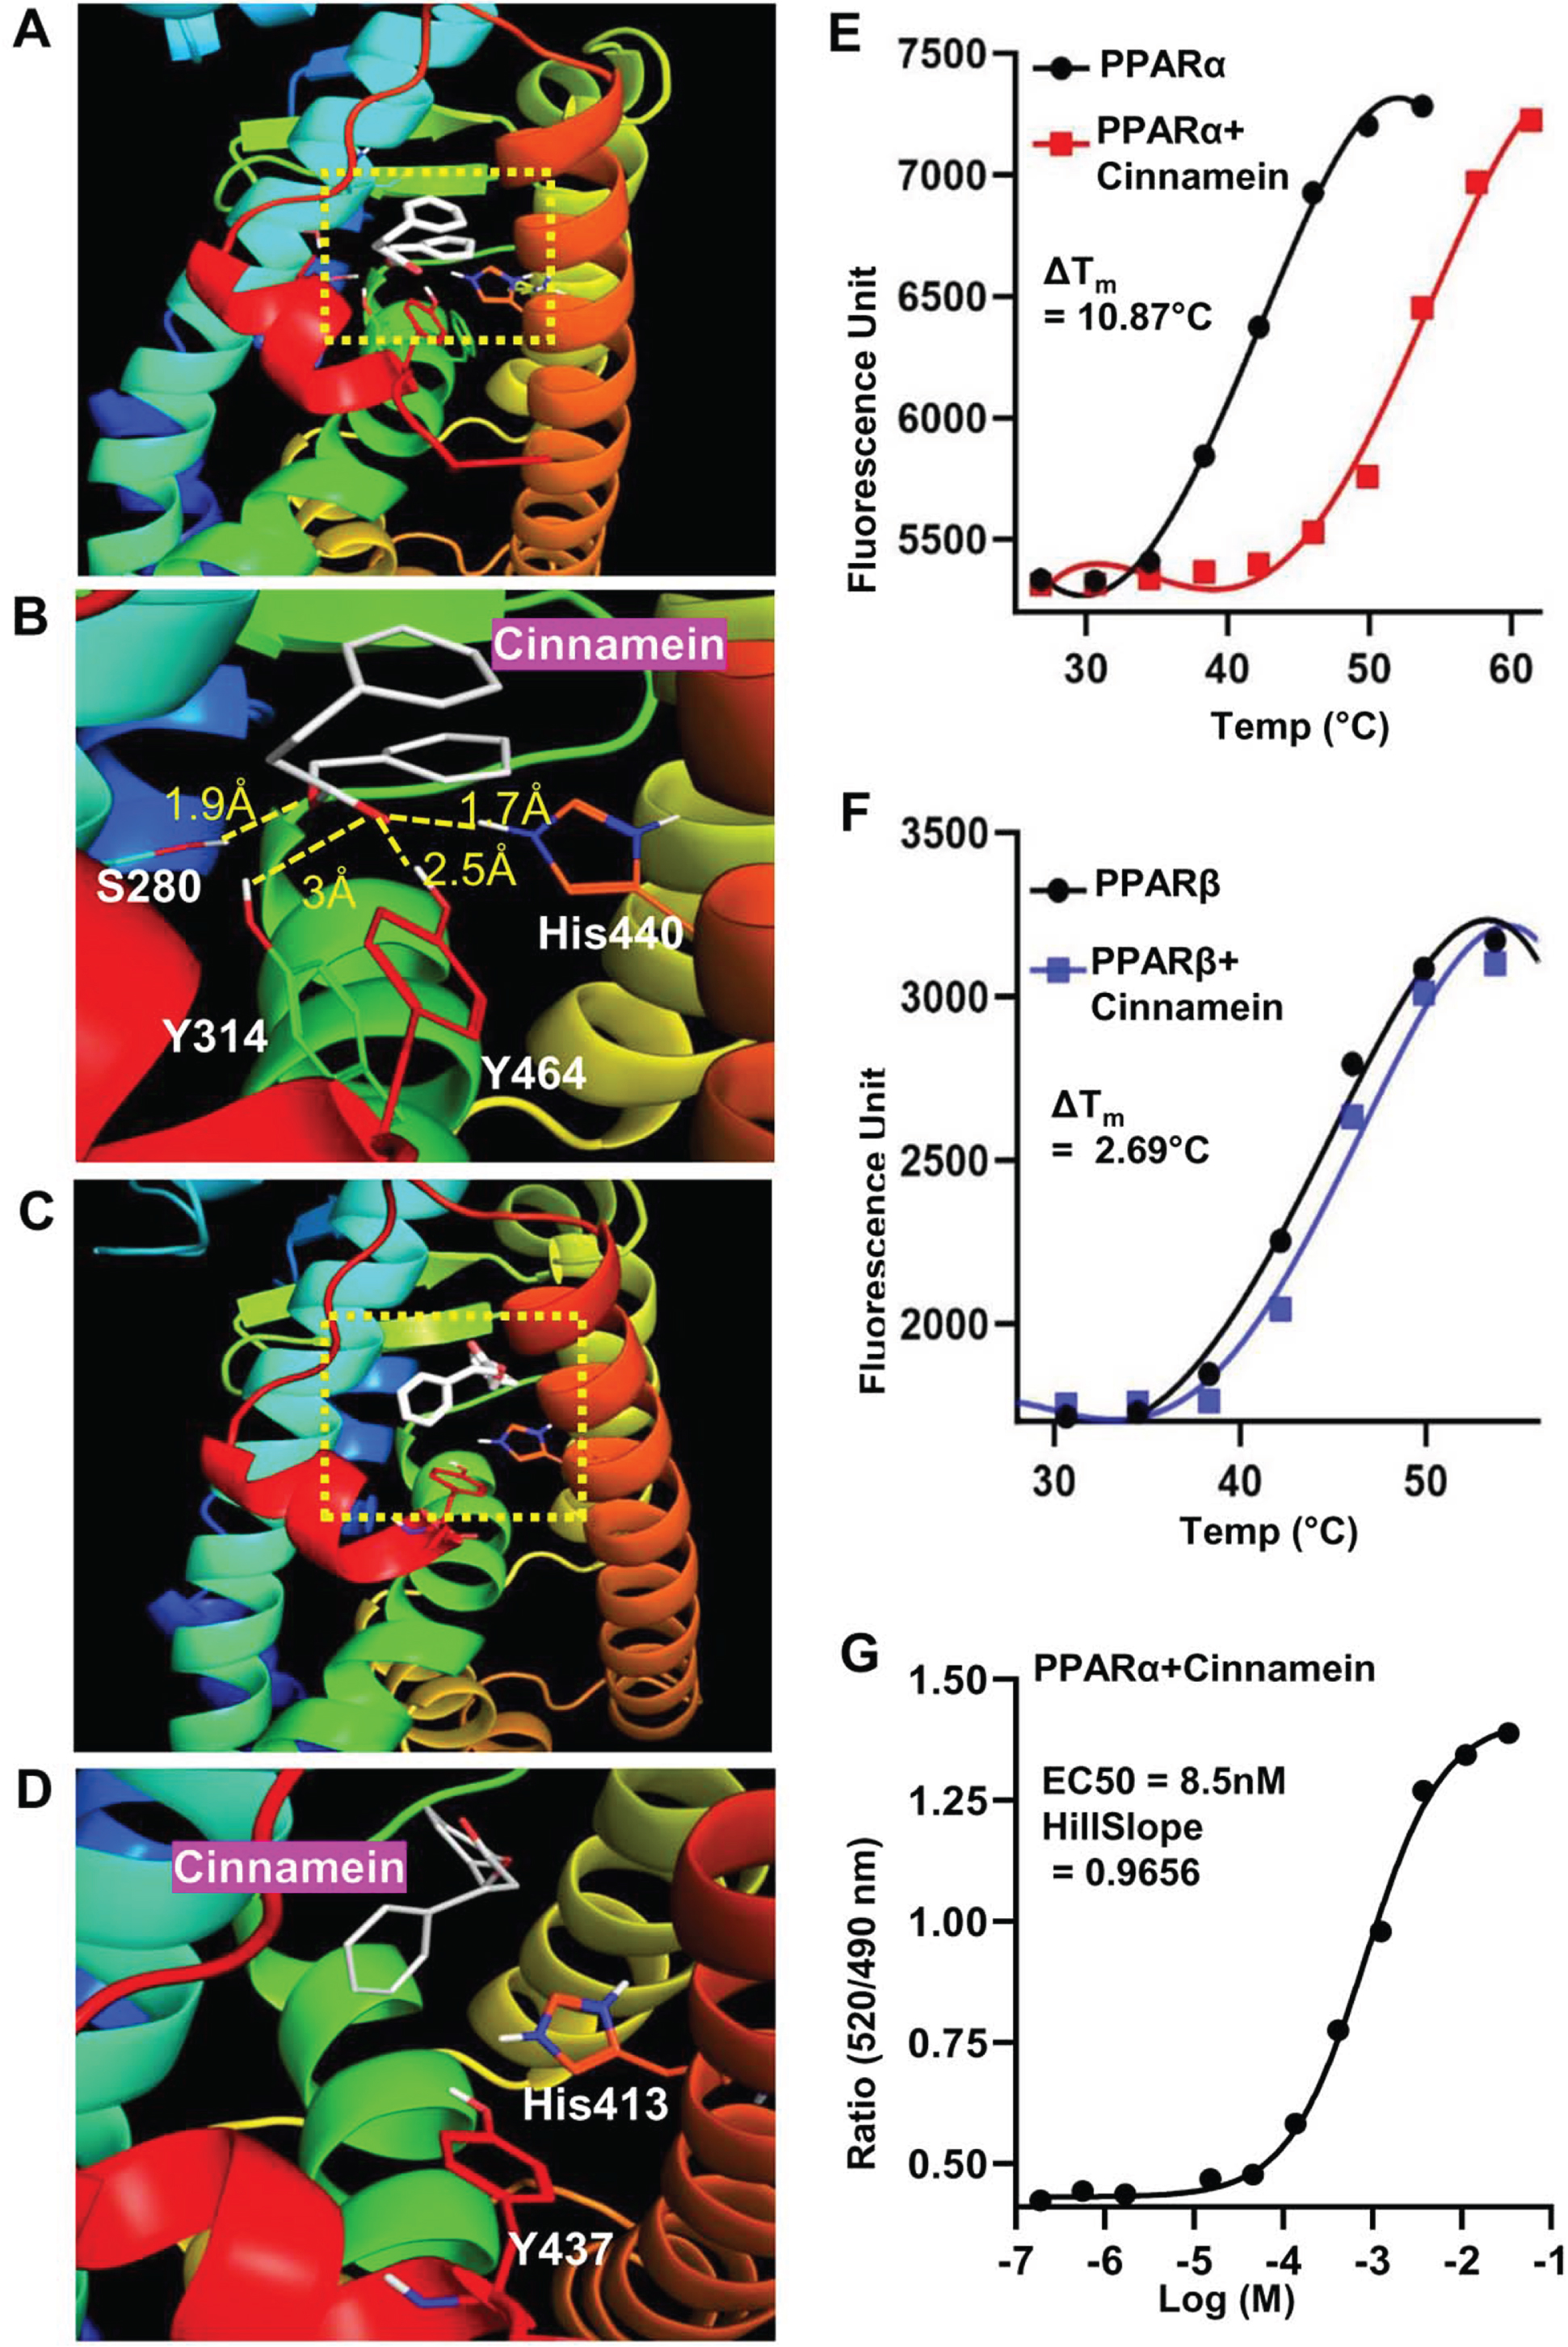
Next, we investigated mechanisms by which cinnamein increases PPARα. Autodock4, an in silico docking tool, was used to explore the interaction between cinnamein and ligand-binding domain (LBD) of PPARα at a molecular level. Based on the foremost docking pose, the ester group of cinnamein was found to form a conserved H-bond network to Ser280, Tyr314, His440, and Tyr464 of PPARα, making cinnamein a strong ligand for PPARα (Fig. 5A-B). On the other hand, the head group of cinnamein was far from the key interacting residues (His287, His413, Tyr437) of PPARδ/β, thus failing to form H-bonding network (Fig. 5C, D). Therefore, cinnamein is not a ligand or a very weak ligand for PPARδ/β. These results on the interactions between PPARs and cinnamein were supported by thermal shift assay (Fig. 5E, PPARα; Fig. 5F, PPARδ). We employed this assay to quantify ligand recognition by stabilizing the protein against thermal denaturation in the presence of 10 μM cinnamein under the same conditions. The ΔTm values for each case showed that cinnamein has a much higher degree of binding affinity towards PPARα (ΔTm = 10.87°C) than PPARδ (ΔTm = 2.69°C) (Fig. 5E, F). To further support this finding, we used TR-FRET assay. The isolated LBDs of both PPARα and PPARδ were allowed to interact with cinnamein in serial dilution and the fluorescence signals were monitored at 495 nm and 520 nm. The ratio (520/495) of the FRET signal was plotted against the concentration of the ligand and the EC50 values were calculated. While we found a characteristic sigmoidal curve for PPARα with an EC50 value of 8.5 nM (Fig. 5G), such sigmoidal curve was not seen for PPARδ. Together, these results suggest that cinnamein is a ligand of PPARα.
Fig. 5
Detailed comparison of the binding properties of cinnamein to PPARs LBD by in silico docking and biophysical analysis. A) Representative in silico binding mode of cinnamein with the PPARα-LBD. B) Zoomed view of the interaction site of the protein. The ligand was depicted as white. Dotted line denoted H-bonds and the numbers are measured H-bond distance. C) Binding mode of cinnamein with the PPARδ-LBD. D) Zoomed view of the interaction site of the protein. The ligand was depicted as white. No H-bond was found. Determination of ΔTm for binding of cinnamein with PPARα (E) and PPARδ (F), respectively, by the Thermal Shift assay. The ligand and protein concentrations were 10 μM and 100 ng, respectively. Data were collected at 0.114°C intervals from 25°C–99°C on the Applied Biosystems Real-time PCR system. Representative plots were made by GraphPad prism after processing the raw data. G) Saturation binding curve of cinnamein for PPARα-LBD in the LanthaScreen TR-FRET assay. Serial dilution of ligand was assayed. Curves were fit using a sigmoidal dose-responsive equation in GraphPad prism.
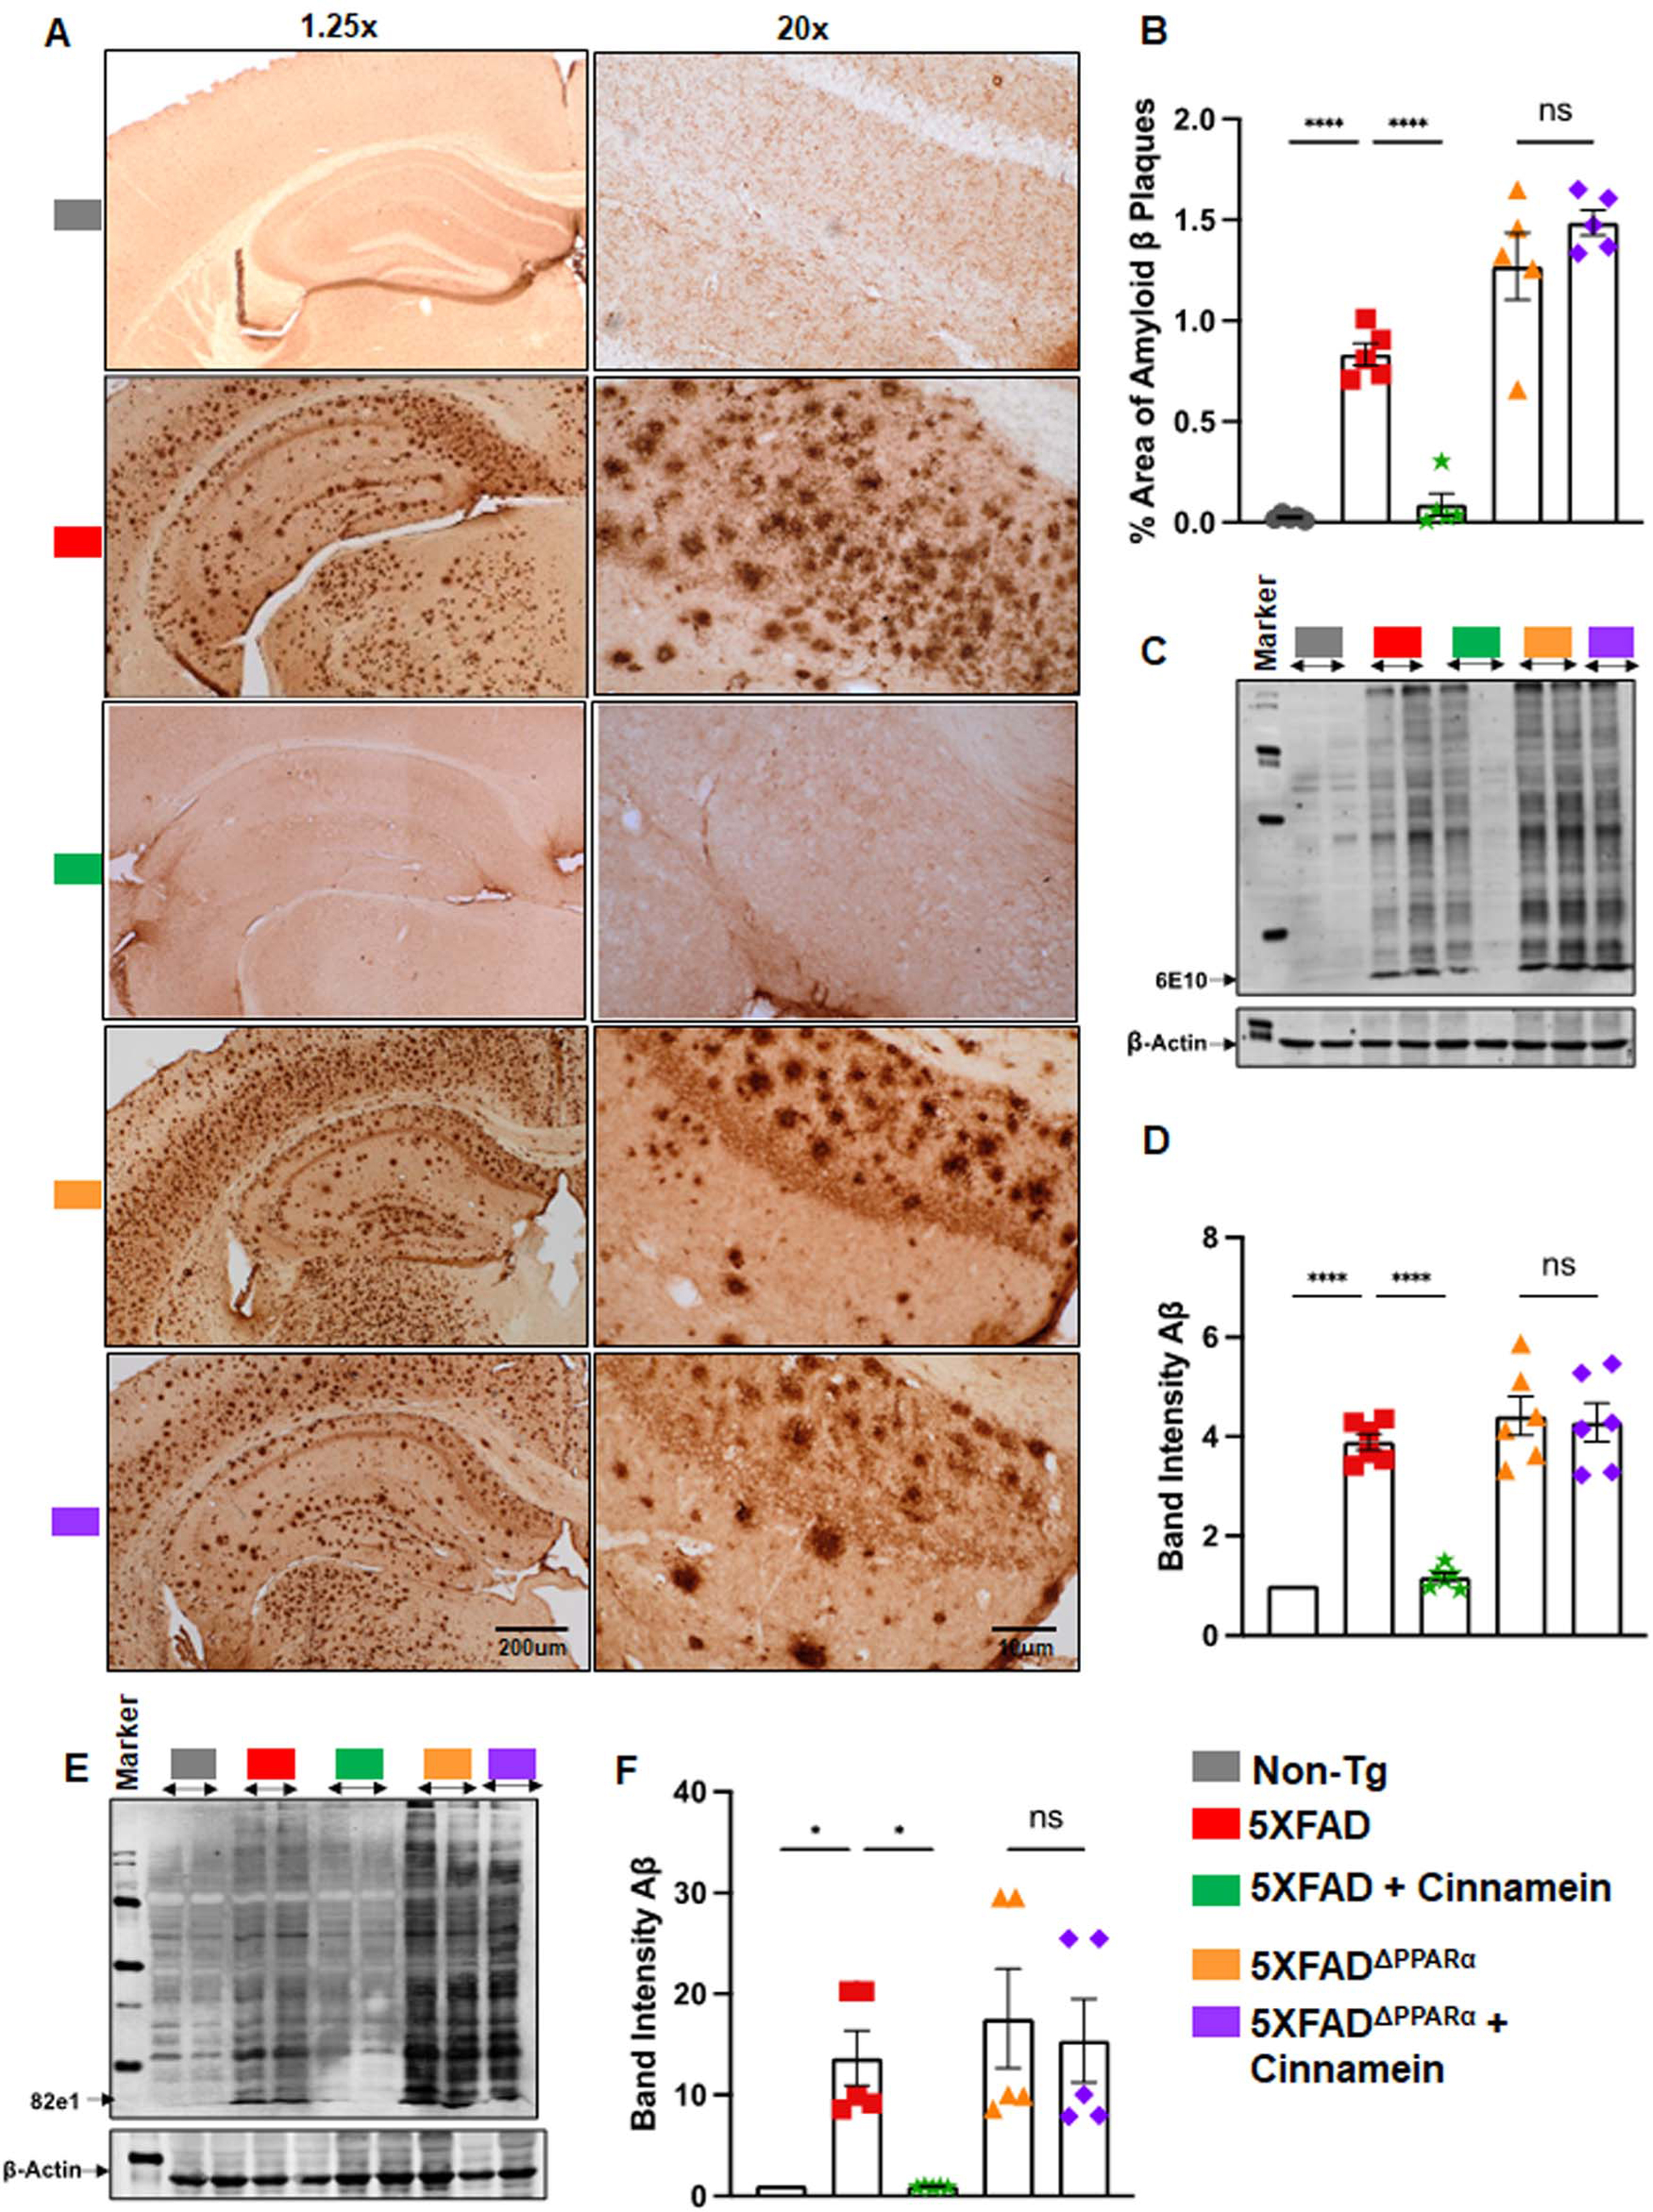
With this link between cinnamein and PPARα, our next objective was to ascertain if PPARα is indeed essential for cinnamein to manifest its anti-amyloid effects in 5XFAD mice. Therefore, we used 5XFADΔPPARα mice (5XFAD mice lacking PPARα) [17, 20]. Although cinnamein treatment reduced plaques from the hippocampus of 5XFAD mice, this plaque decrease was not seen from the hippocampus of cinnamein-treated 5XFADΔPPARα mice (Fig. 6A, B). It is evident from western blot analysis of hippocampal extracts with 6E10 (Fig. 6C) and 82E1 (Fig. 6E) antibodies. Quantification of immunoblot bands (Fig. 6D, 6E10; Fig. 6F, 82E1) also confirmed these findings. These results suggest that cinnamein requires PPARα to lower plaques from the hippocampus of 5XFAD mice.
Fig. 6
Oral administration of cinnamein reduces Aβ deposition in 5XFAD mice via PPARα. Six-month-old 5XFAD and 5X FADΔPPARα mice (n = 5 or 6) were administered cinnamein orally (50 mg/kg/day) for one month followed by measurement of amyloid-β (Aβ) plaque load by (A) diaminobenzidine (DAB) staining of hippocampal sections (1.25x and 20x magnification) followed by (B) quantification of % area of Aβ plaques in each entire section (two sections per mouse) using Image J. C) Immunoblotting of hippocampal homogenate with Aβ 6E10 monoclonal antibody and (D) densitometric analysis of relative Aβ levels (Aβ/Actin). E) Immunoblotting of hippocampal homogenate with 82e1 monoclonal antibody (F) densitometric analysis of relative Aβ levels (Aβ/Actin). All data, analyzed with Prism, represent the mean±SEM. One-way ANOVA followed by Šìdák’s multiple comparisons test was used for statistical analysis. *p < 0.05; ***p < 0.001; ****p < 0.0001; ns, not significant.
Cinnamein augments cognitive functions of 5XFAD mice through PPARα
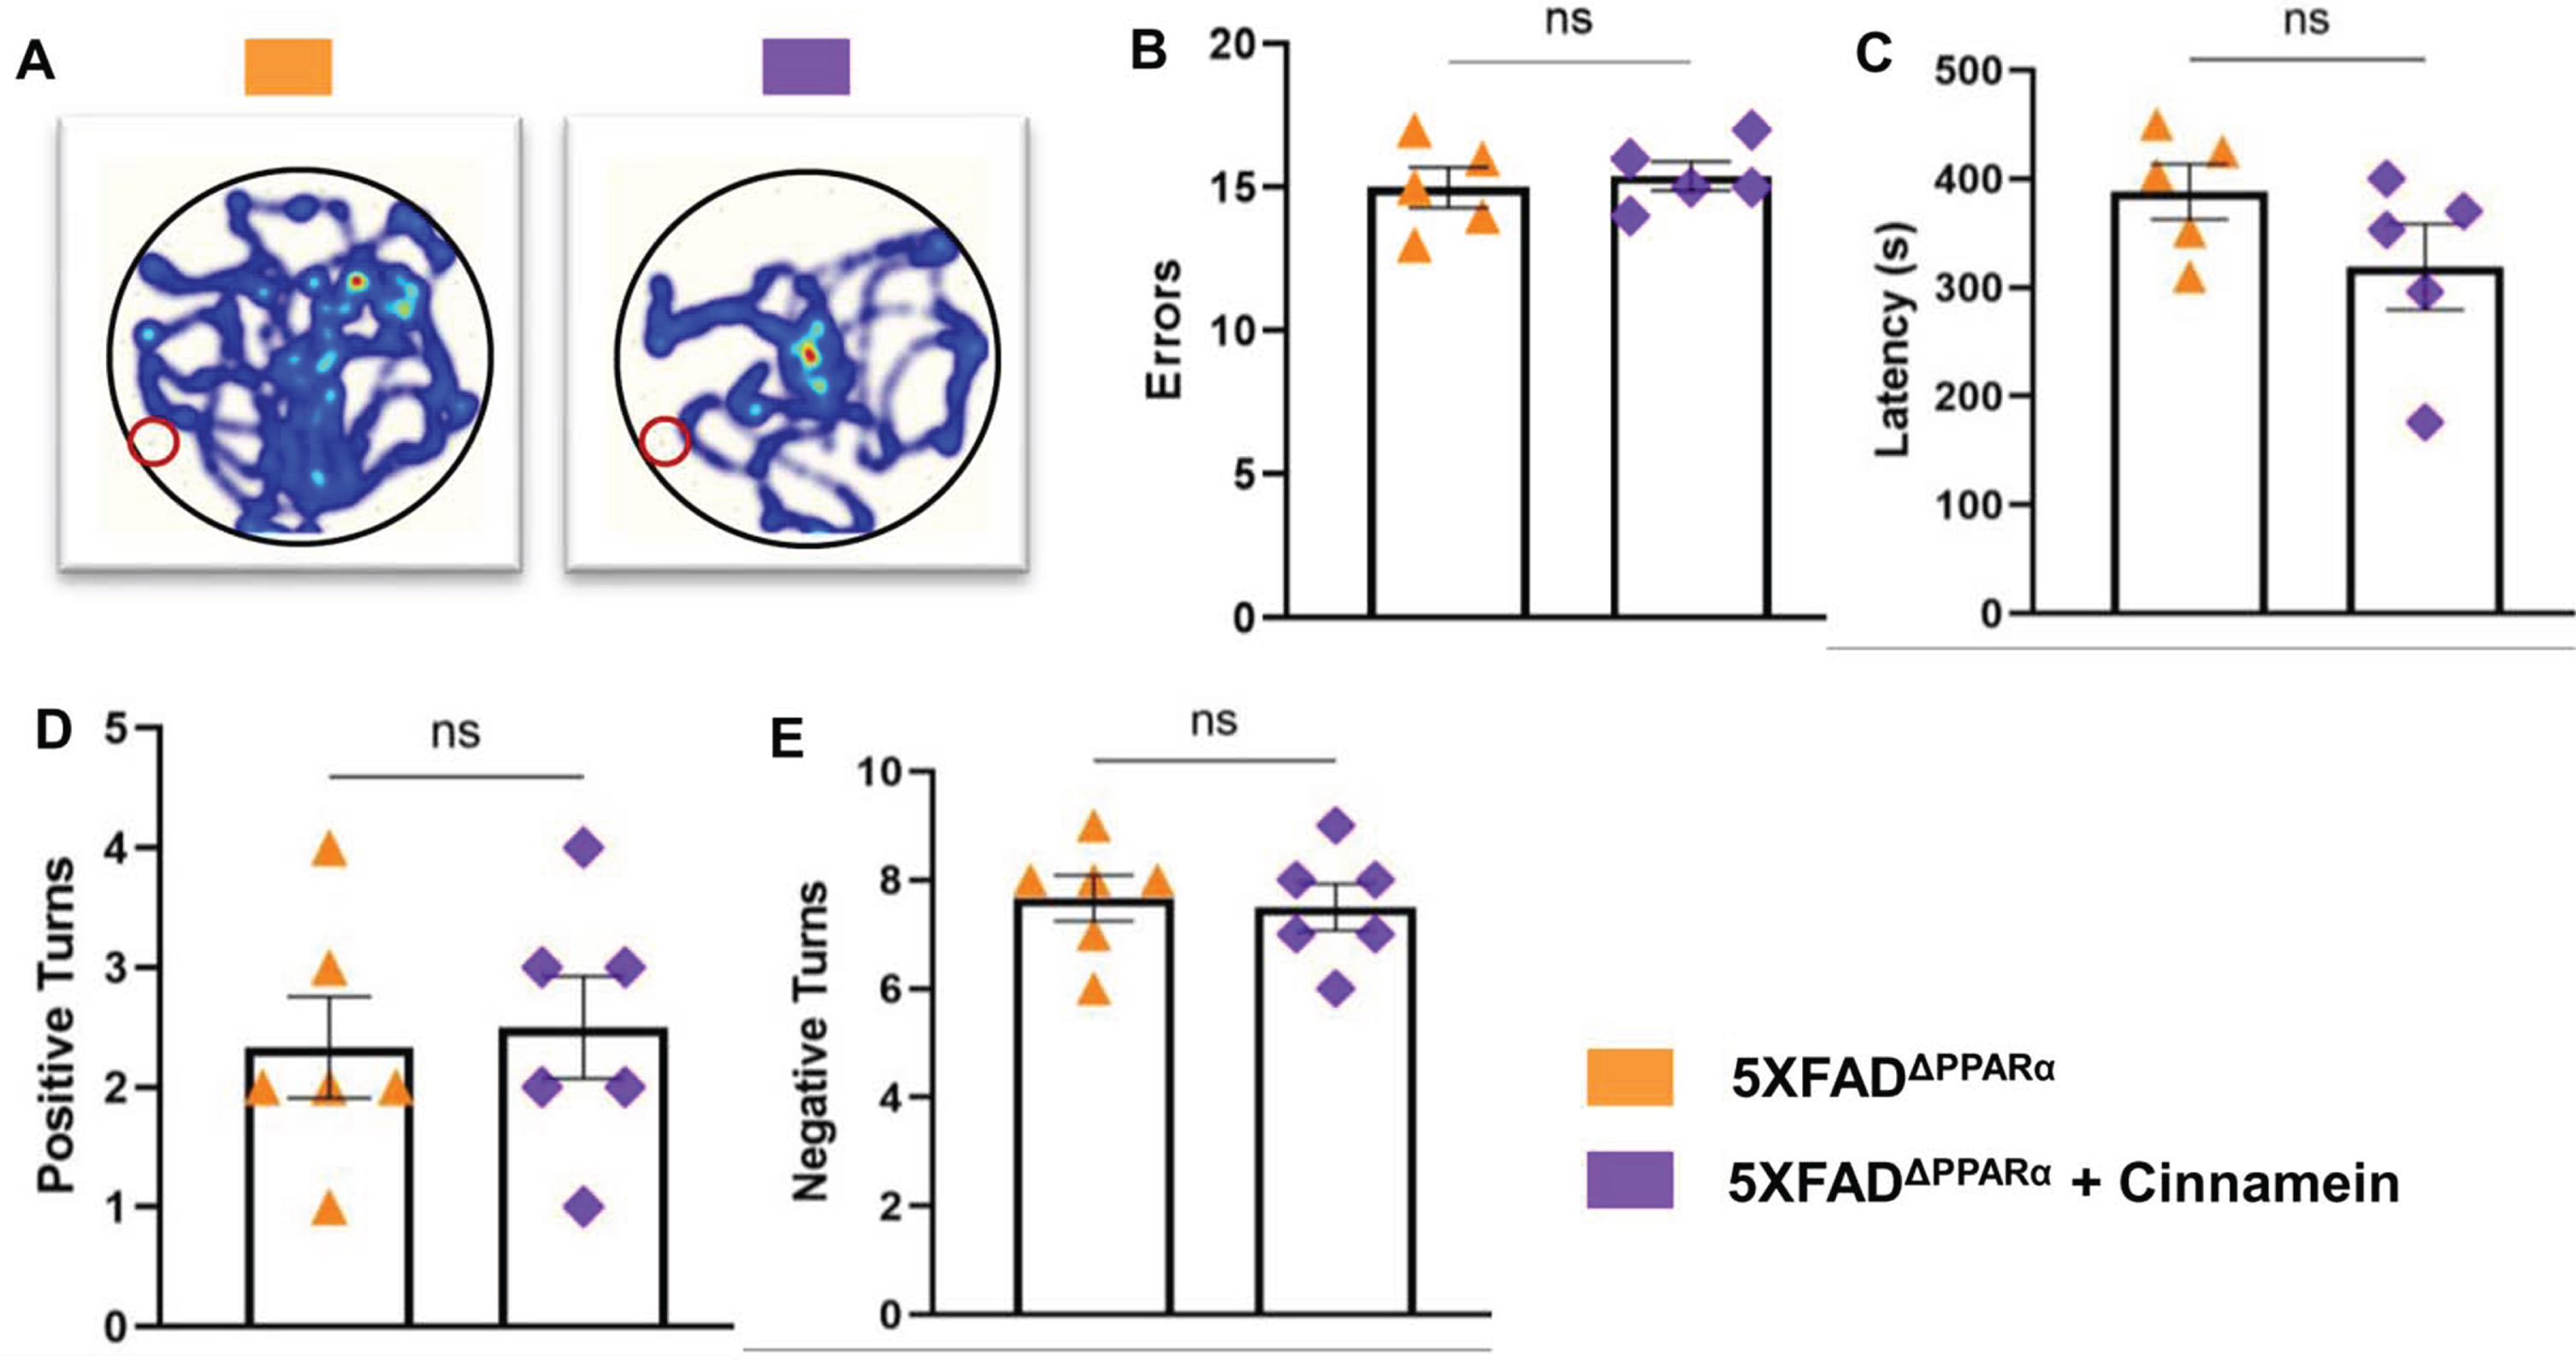
Cognitive decline characterizes AD, prompting our evaluation of cinnamein’s impact on 5XFAD mouse cognition in the presence and absence of PPARα. Though PPARα agonists have been previously correlated with cognitive enhancement, the influence of cinnamein on cognitive improvement remains uncharted territory. After one month of oral administration of cinnamein, we gauged the cognitive capacities of these mice using the Barnes Maze and T Maze assessments. While cinnamein treatment increased the performance of 5XFAD mice on Barnes maze as evidenced by heat map (Fig. 7A), error (Fig. 7B) and latency (Fig. 7C), cinnamein could not improve Barnes maze performance of 5X FADΔPPARα mice. Similarly, cinnamein treatment also upregulated T maze performance of 5XFAD, but not 5XFADΔPPARα, mice as shown by positive turn (Fig. 7D) and negative turn (Fig. 7E). These results indicate that cinnamein protects memory and learning in 5XFAD mice via PPARα.
Fig. 7
Cinnamein improves memory and learning via PPARα. Six-month-old 5XFAD and 5X FADΔPPARα mice (n = 5 per group) were administered cinnamein orally (50 mg/kg/day) for one month followed by monitoring spatial learning and memory by Barnes maze (A, heatmap; B, error; C, latency) and T maze (D, positive turns; E, negative turns). All data, analyzed with Prism, represent the mean±SEM. One-way ANOVA followed by Šìdák’s multiple comparisons test was used for statistical analysis. *p < 0.05; ***p < 0.001; ****p < 0.0001; ns, not significant.
Cinnamein treatment elevates TFEB and ADAM10 expression in mouse primary hippocampal and cortical neurons
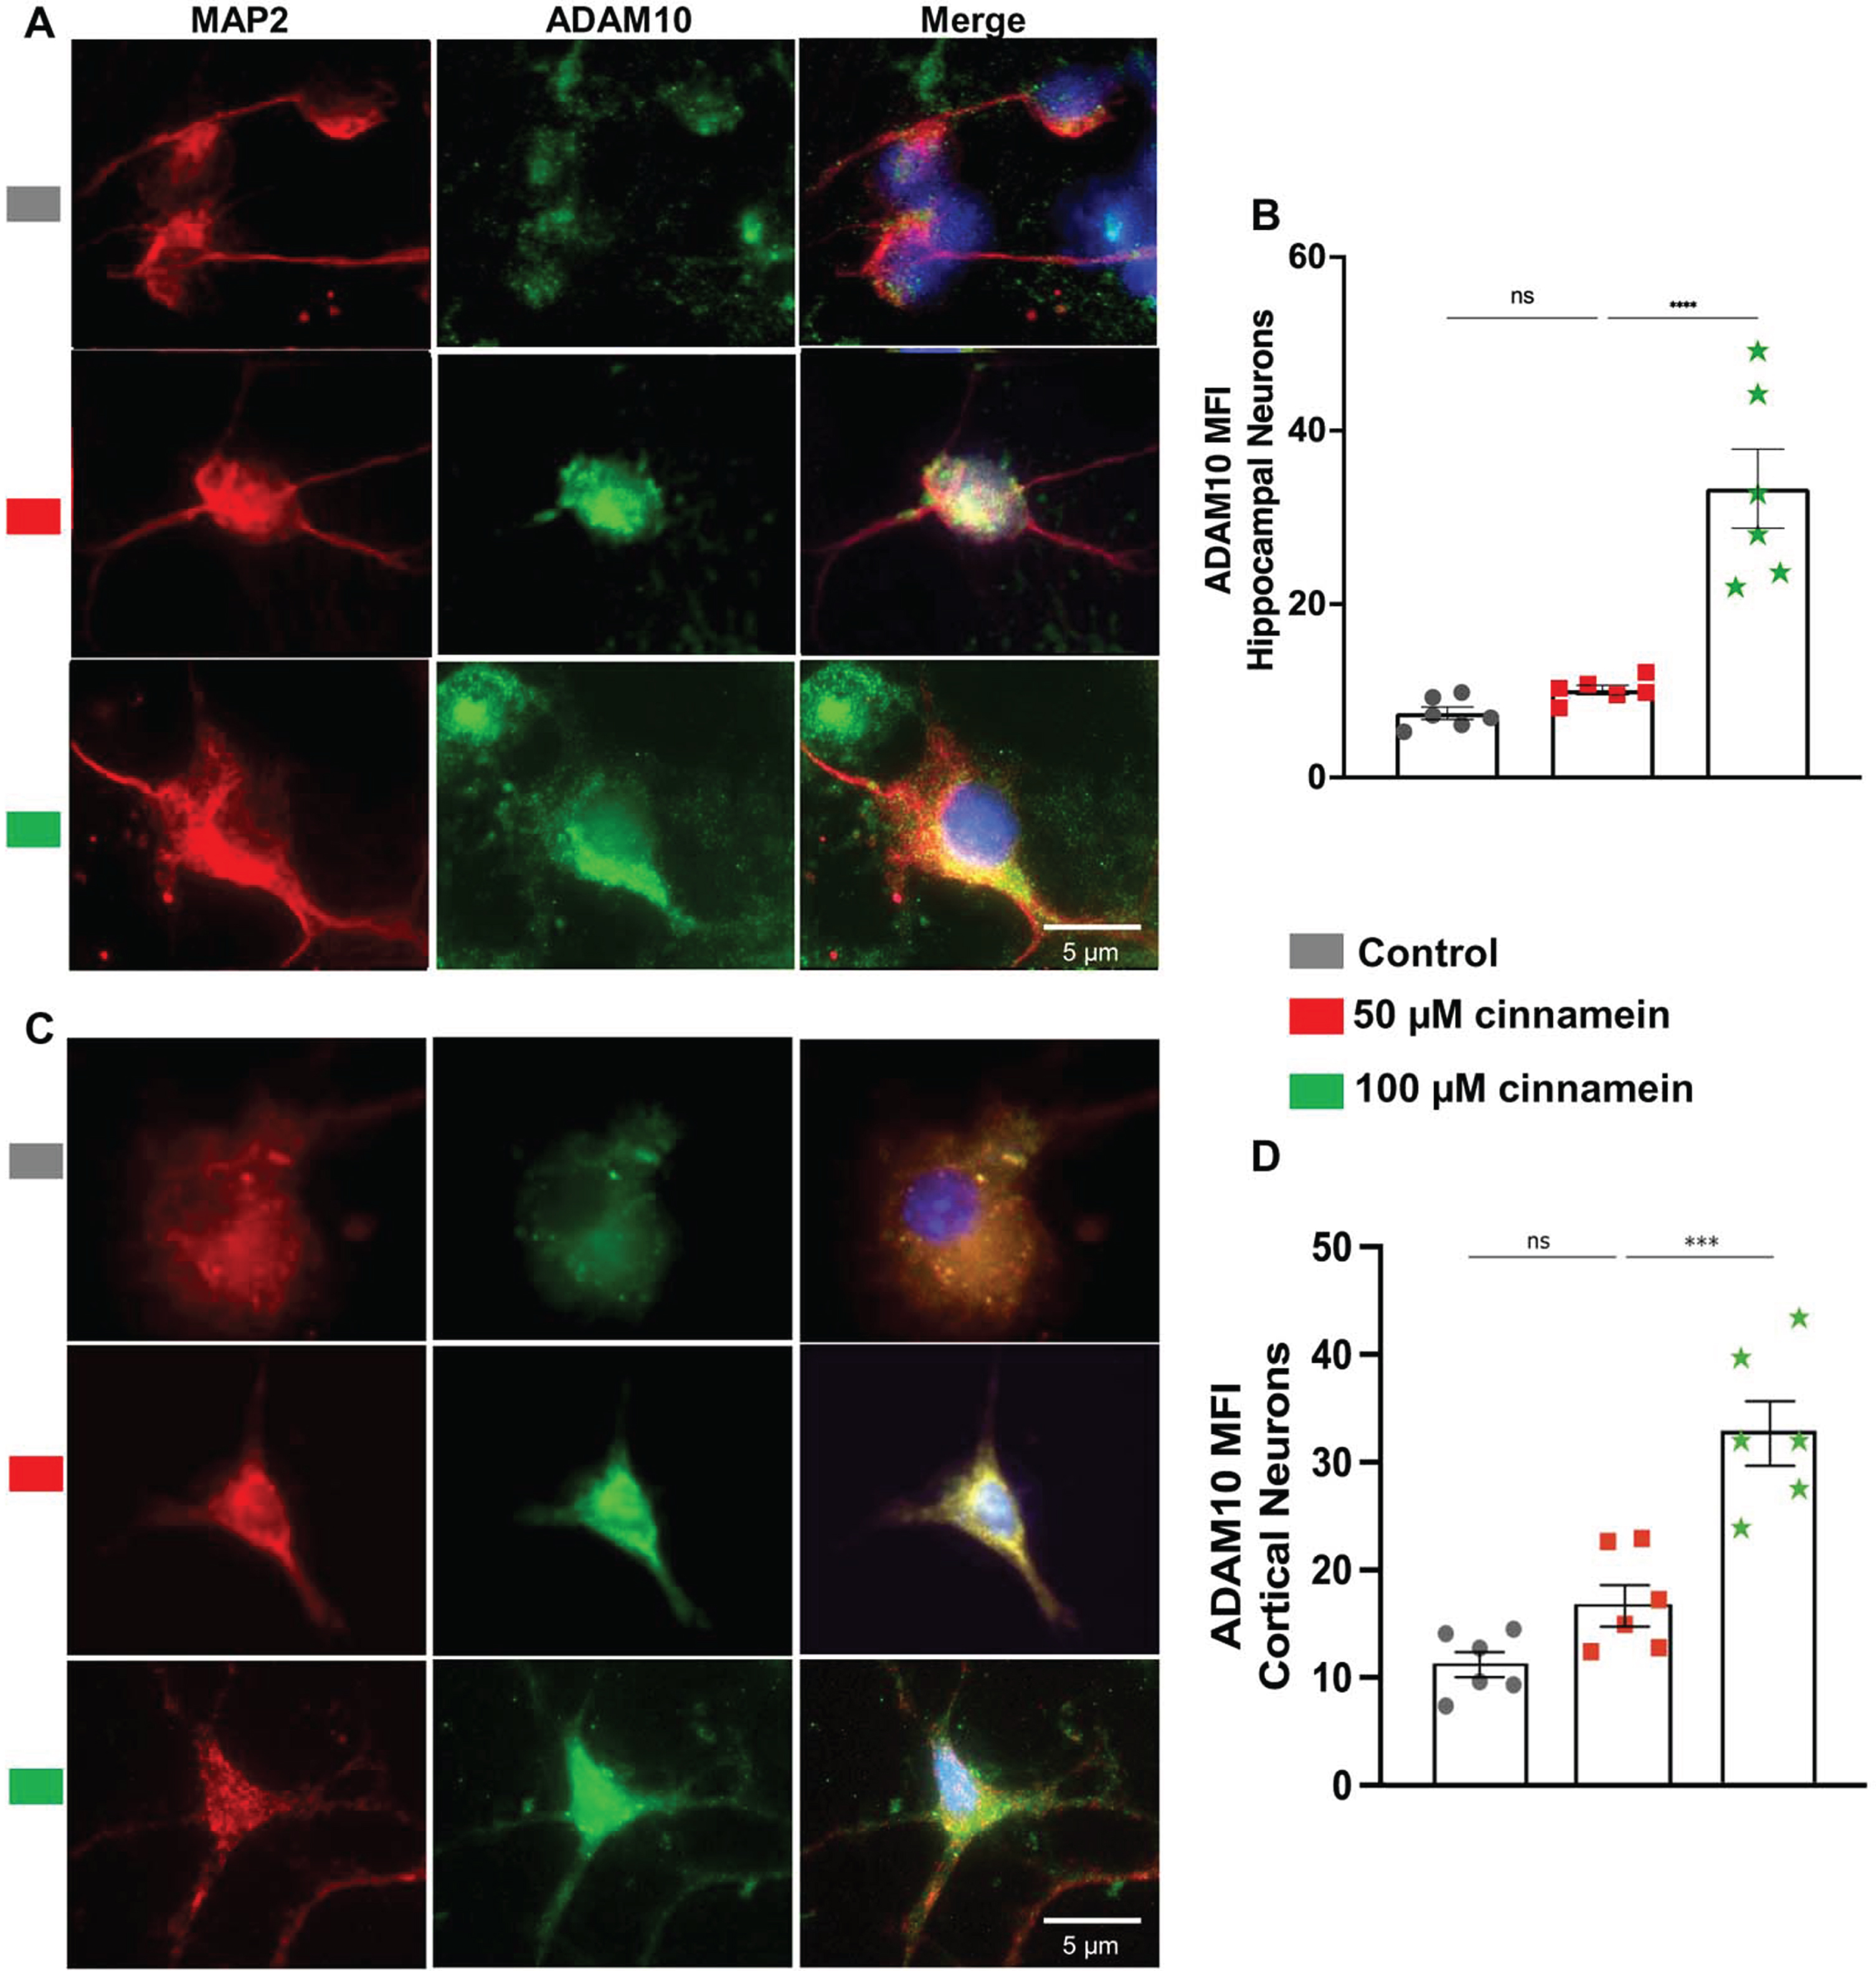
For reducing plaques, one drug has to either stimulate the degradation of plaques or inhibit the formation of plaques. Plaque degradation is facilitated by TFEB-driven autophagy [40, 41]. On the other hand, plaque formation is inhibited by ADAM10-driven nonamyloidogenic pathway [17, 38]. Interestingly, promoters of both TFEB and ADAM10 genes contains PPRE and activation of PPARα has been shown to upregulate both TFEB and ADAM10 genes at the transcriptional level [17, 18]. Since cinnamein increases PPARα, we examined the effect of cinnamein on the expression of TFEB and ADAM10 in primary hippocampal and cortical neurons. Figure 8 showcases the consequences of cinnamein treatment on TFEB expression. A notable rise in TFEB expression, as evidenced by immunofluorescent labeling, was observed in both hippocampal (Fig. 8A) and cortical neurons (Fig. 8C) after 18 h of treatment with 50 and 100 μM cinnamein. This upregulation was quantitatively validated by the MFI of TFEB in both hippocampal (Fig. 8B) and cortical neurons (Fig. 8D). Figure 9 illustrates the impact of cinnamein administration on ADAM10 expression. Similar to the upregulation of TFEB, double-label immunofluorescence analysis demonstrated increase in ADAM10 level in primary hippocampal (Fig. 9A) and cortical neurons (Fig. 9C). This finding was further corroborated by MFI analysis for both hippocampal (Fig. 9B) and cortical neurons (Fig. 9D). Therefore, cinnamein is capable of upregulating the expression of both TFEB and ADAM10 in cultured hippocampal and cortical neurons.
Fig. 8
Cinnamein treatment upregulates TFEB expression in primary mouse hippocampal and cortical neurons. Hippocampal (A) and cortical (C) neurons isolated from E18 non-transgenic mouse fetus were treated with 50 and 100 μM cinnamein for 18 hours followed by double-labeling of MAP2 and TFEB. Mean fluorescence intensity (MFI) of TFEB was quantified in six hippocampal neurons (C) and cortical neurons (D) from three different experiments. All data, analyzed with Prism, represent the mean±SEM. One-way ANOVA followed by Šìdák’s multiple comparisons test was used for statistical analysis. ***p < 0.001; ns, not significant.
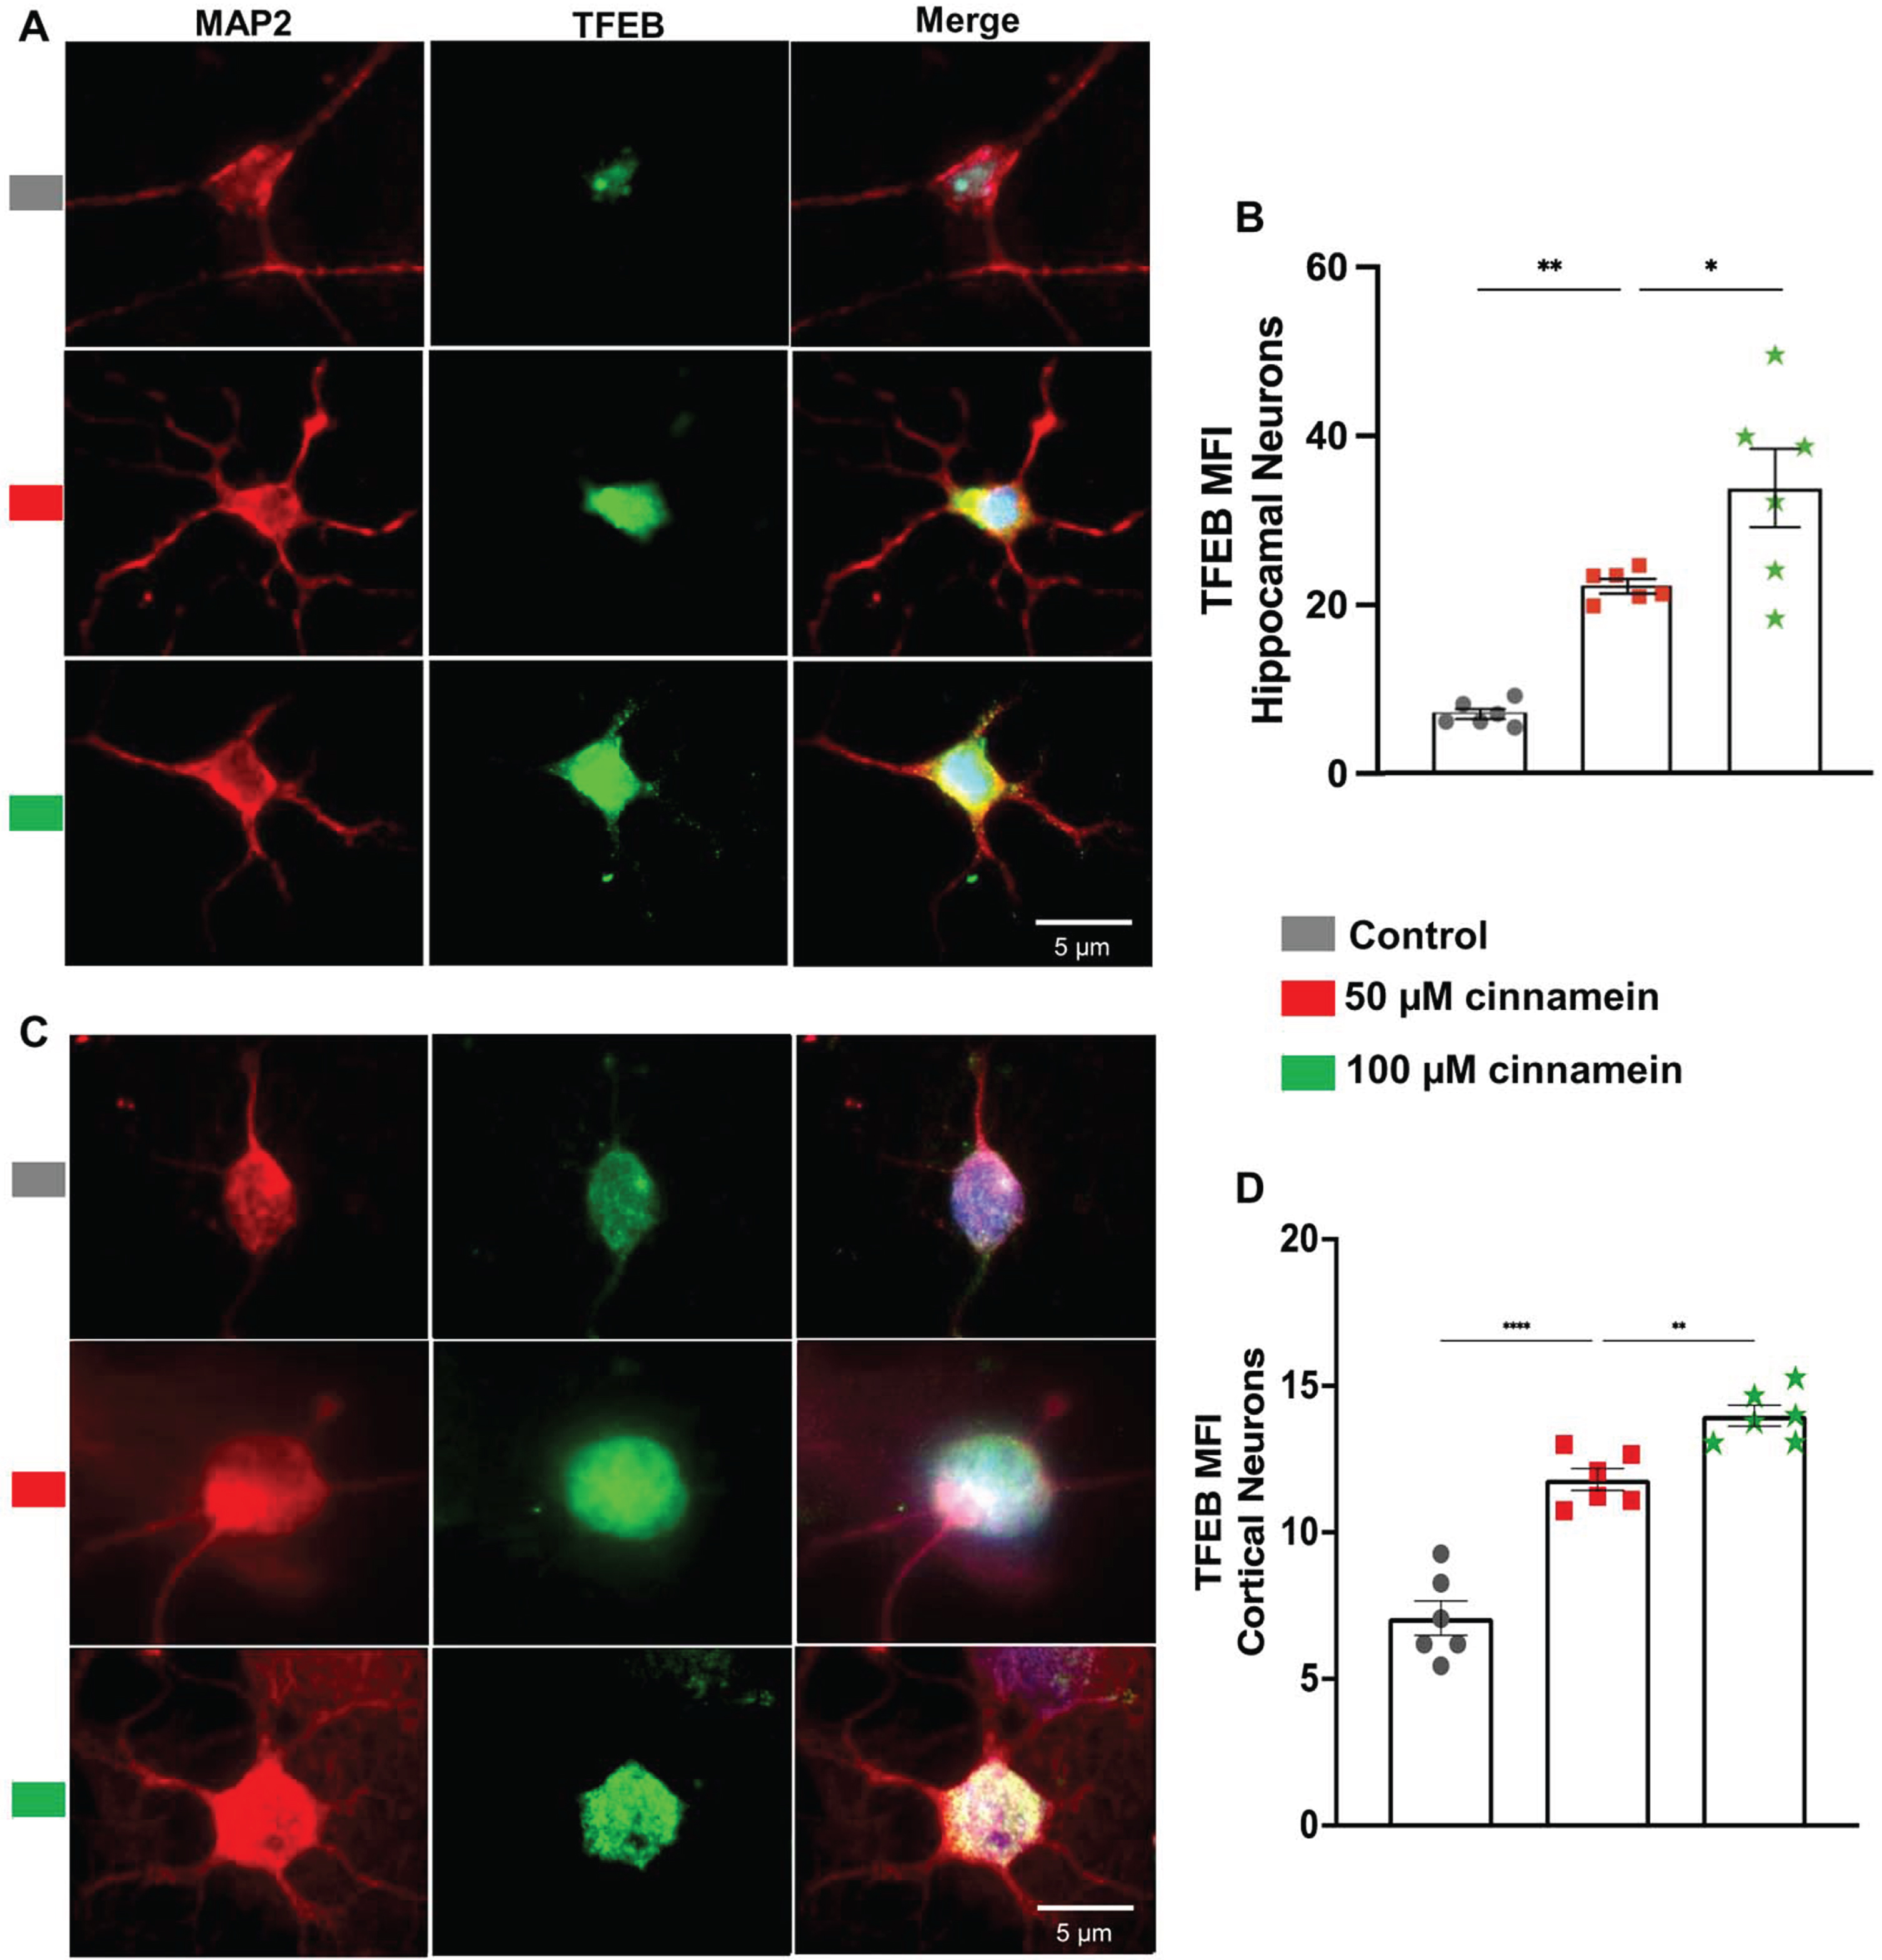
Fig. 9
Cinnamein increases the expression of ADAM10 in primary mouse hippocampal and cortical neurons. Hippocampal (A) and cortical (C) neurons isolated from E18 non-transgenic mouse fetus were treated with 50 and 100 μM cinnamein for 18 hours followed by double-labeling of MAP2 and ADAM10. Mean fluorescence intensity (MFI) of ADAM10 was quantified in six hippocampal neurons (C) and cortical neurons (D) from three different experiments. All data, analyzed with Prism, represent the mean±SEM. One-way ANOVA followed by Šìdák’s multiple comparisons test was used for statistical analysis. ***p < 0.001; ns, not significant.
Oral administration of cinnamein amplifies TFEB and ADAM10 expression in vivo in mouse neurons through PPARα
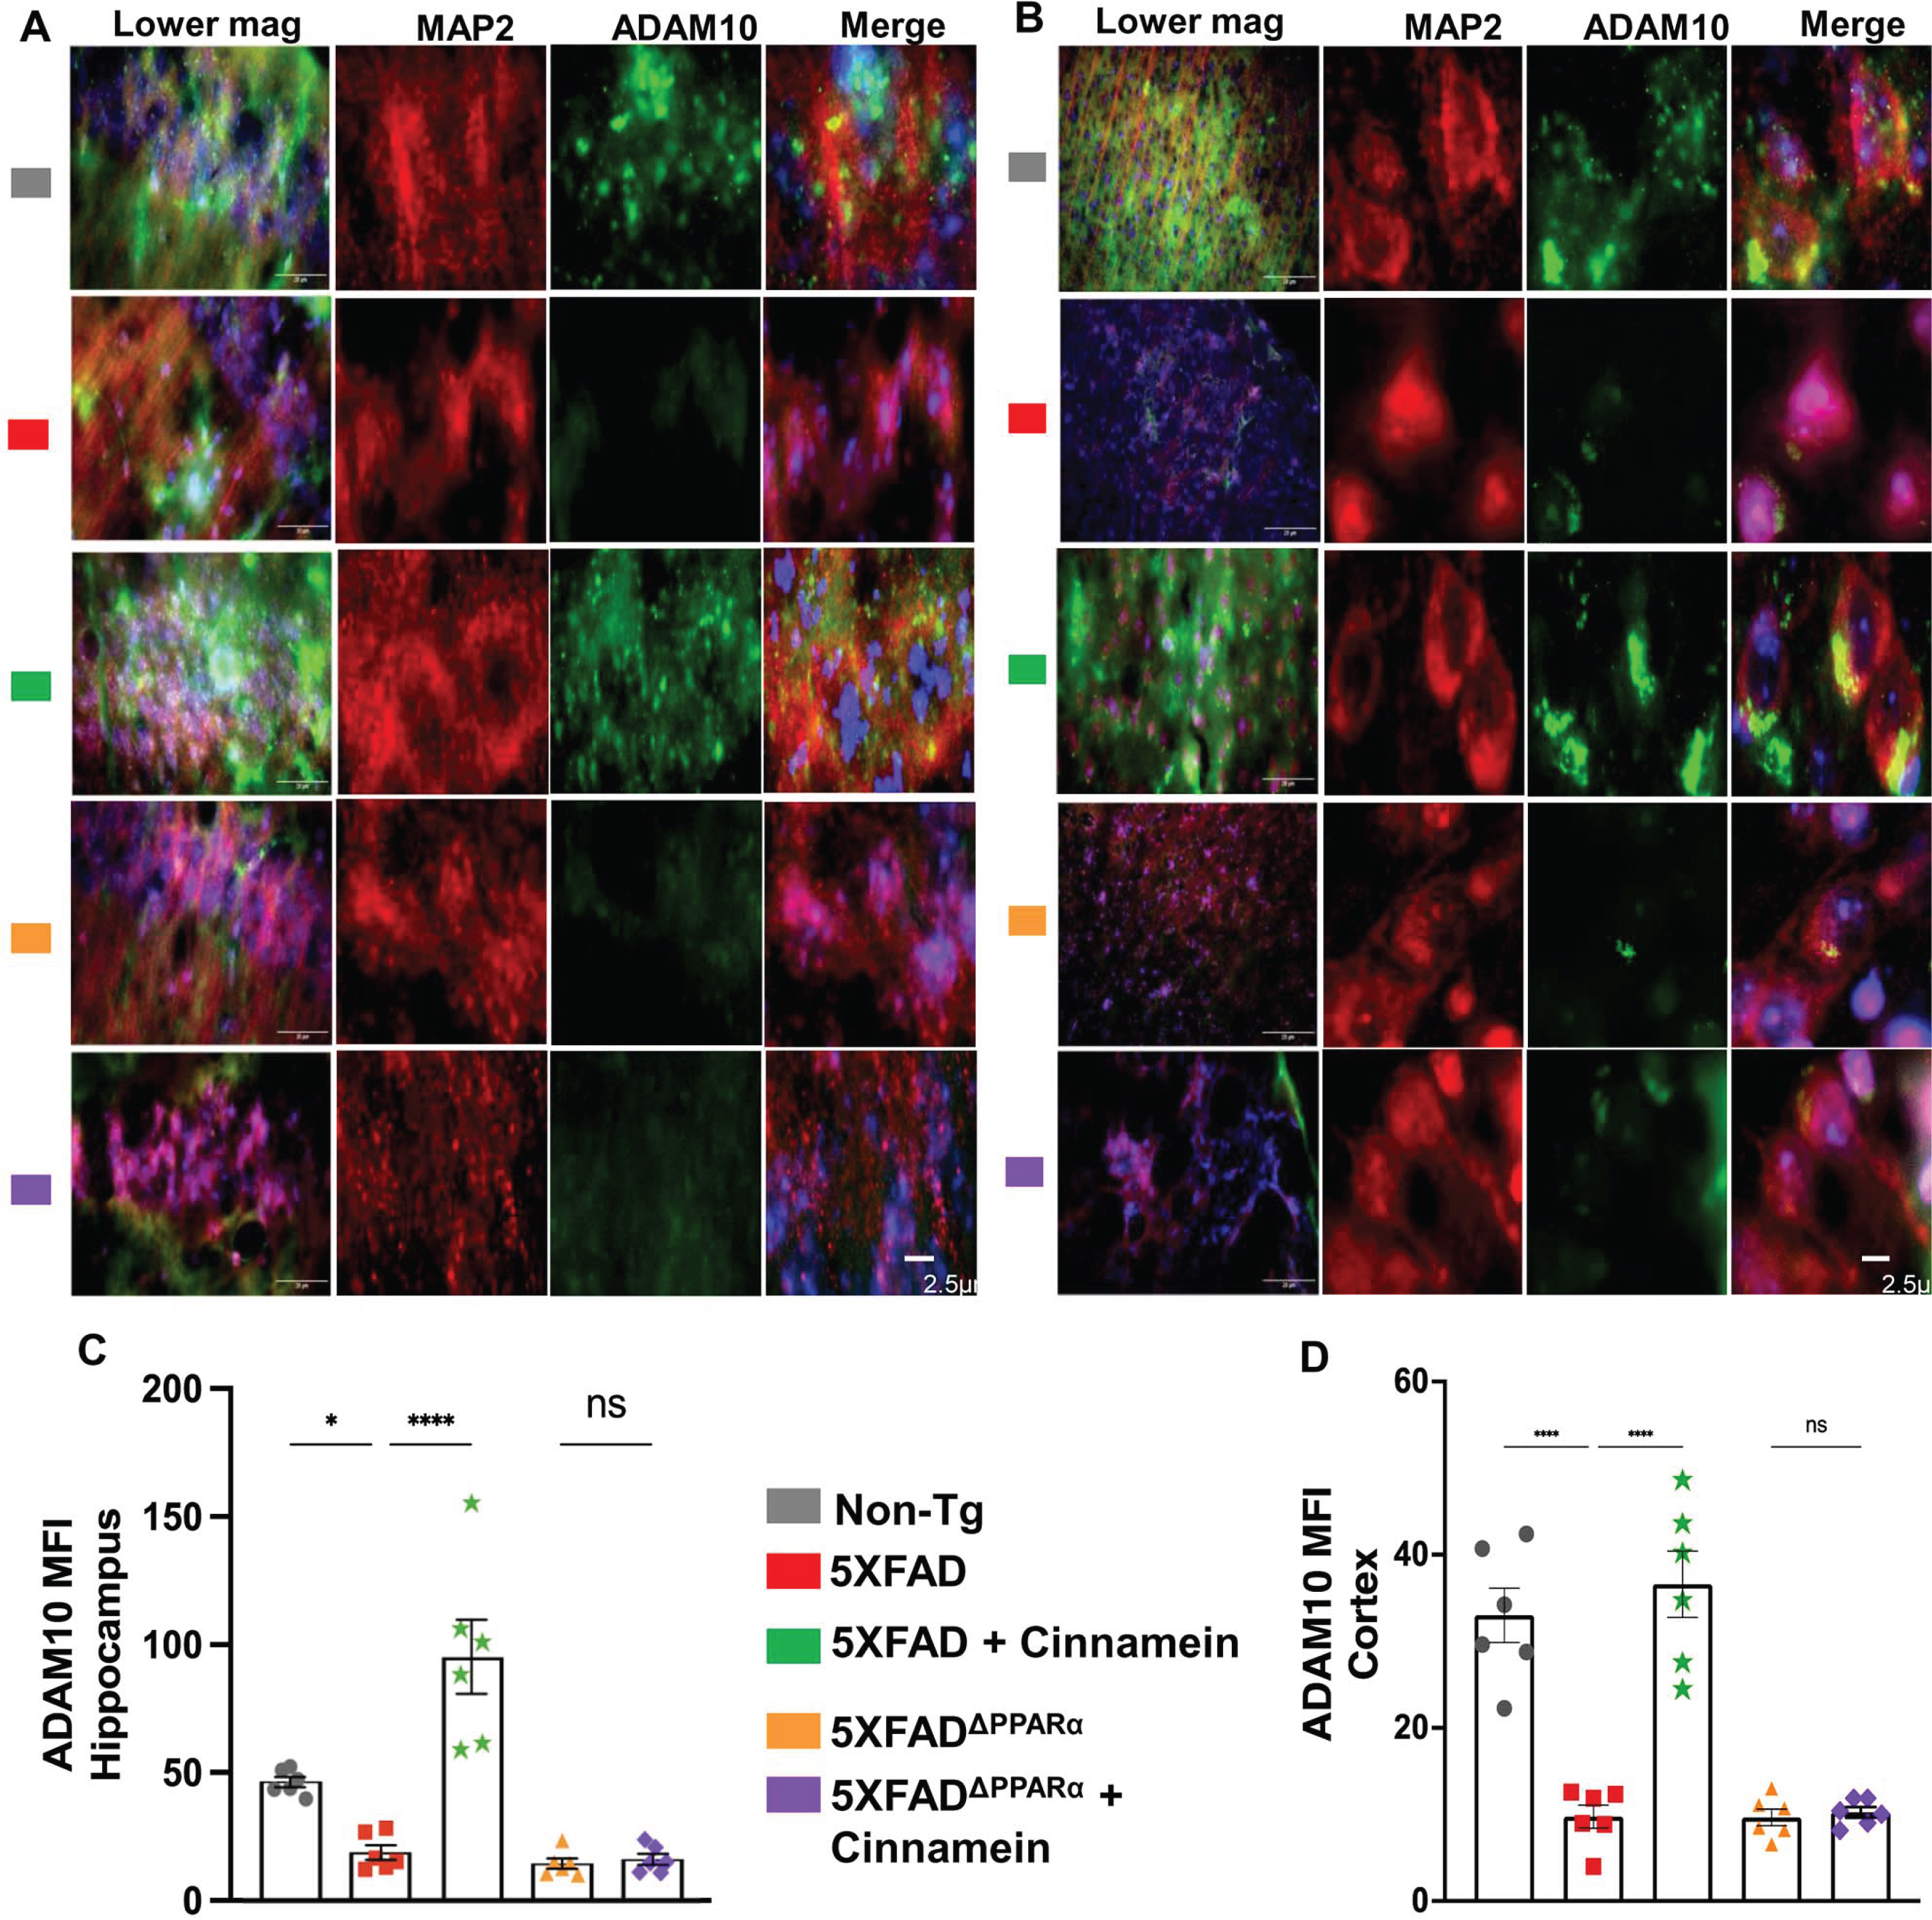
Since cinnamein upregulated TFEB and ADAM10 in cultured hippocampal and cortical neurons, we investigated whether oral cinnamein was capable of doing so in vivo in mouse brain. Leveraging the 5XFAD mouse model, known for its unique genetic profile, we administered cinnamein orally at a dose of 50 mg/kg/day for one-month. As Fig. 10 elucidates, the hippocampal and cortical neurons of treated mice exhibited a significant surge in TFEB expression. Precise immunofluorescent labeling techniques highlighted the expression patterns of MAP2 and TFEB within the hippocampus (Fig. 10A) and cortex (Fig. 10C). Furthermore, the MFI calculations also revealed marked upregulation of TFEB in neurons of both hippocampus (Fig. 10B) and cortex (Fig. 10D). Similarly, following cinnamein administration, 5XFAD mice exhibited pronounced upregulation of ADAM10 in their hippocampal (Fig. 11A) and cortical neurons (Fig. 11C), a finding further ratified by the MFI readings (Fig. 11B, D). To understand whether cinnamein administration also requires the involvement of PPARα to upregulate TFEB and ADAM10 in vivo in the hippocampus and cortex of 5XFAD mice, we also treated 5XFADΔPPARα mice orally with cinnamein. In contrast to the upregulation of TFEB (Fig. 10) and ADAM10 (Fig. 11) in hippocampus and cortex of 5XFAD mice by cinnamein, this molecule remained unable to increase the level of TFEB (Fig. 10) and ADAM10 (Fig. 11) in vivo in hippocampal and cortical neurons of 5XFADΔPPARα mice.
Fig. 10
Oral cinnamein increases the level of TFEB in vivo in the hippocampus and cortex of 5XFAD mice via PPARα. Six-month-old 5XFAD and 5X FADΔPPARα mice (n = 6) were treated with cinnamein orally (50 mg/kg/day) for one month followed by double-labeling of MAP2 and TFEB (A, hippocampus; B, cortex). Mean fluorescence intensity (MFI) of TFEB (C, hippocampus; D, cortex) was quantified in one section of each of six mice per group. All data, analyzed with Prism, represent the mean±SEM. One-way ANOVA followed by Šìdák’s multiple comparisons test was used for statistical analysis. **p < 0.01; ****p < 0.0001; ns, not significant.
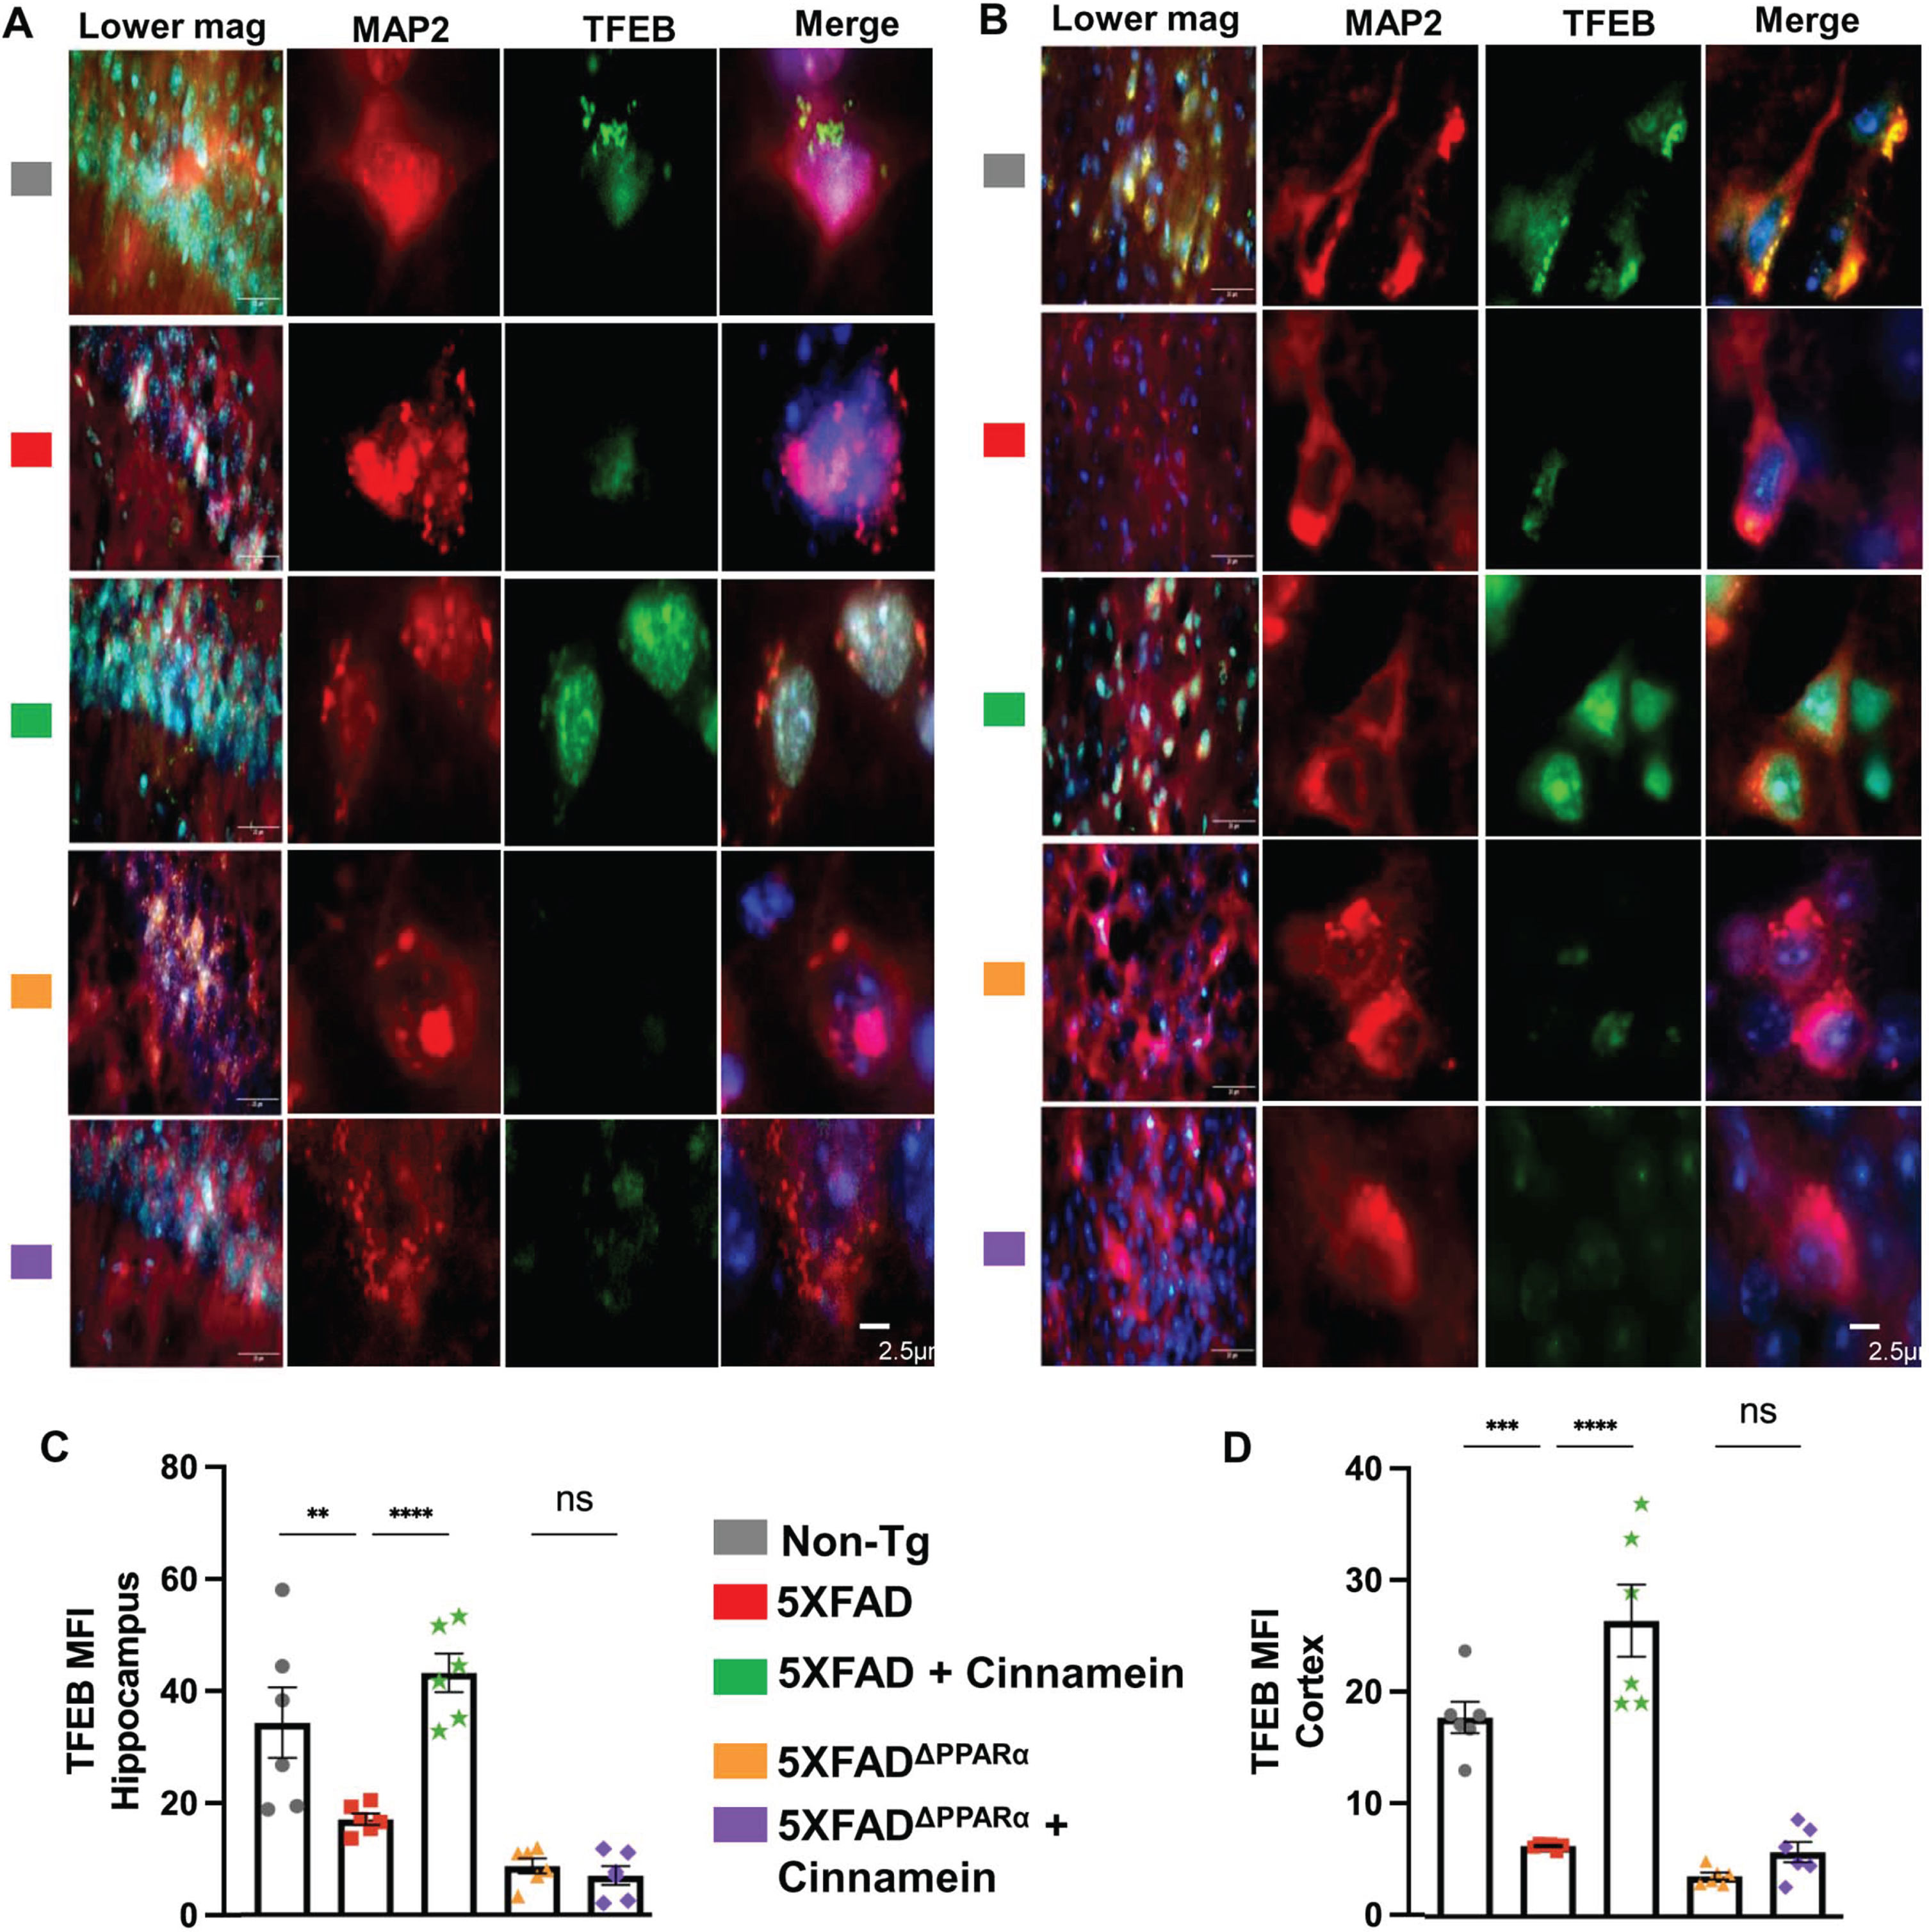
Fig. 11
Oral cinnamein upregulates ADAM10 in vivo in the hippocampus and cortex of 5XFAD mice via PPARα. Six-month-old 5XFAD and 5X FADΔPPARα mice (n = 6) were treated with cinnamein orally (50 mg/kg/day) for one month followed by double-labeling of MAP2 and ADAM10 (A, hippocampus; B, cortex). Mean fluorescence intensity (MFI) of ADAM10 (C, hippocampus; D, cortex) was quantified in one section of each of six mice per group. All data, analyzed with Prism, represent the mean±SEM. One-way ANOVA followed by Šìdák’s multiple comparisons test was used for statistical analysis. *p < 0.05; ****p < 0.0001; ns, not significant.
DISCUSSION
AD stands as a formidable adversary in the vast realm of neurodegenerative conditions, casting a long shadow over millions of lives globally [42, 43]. At its core, this insidious disease is defined by its relentless progressive nature, inexorably chipping away at the cognitive and functional capabilities of those afflicted. As the decades roll on and our global population ages, the prevalence of AD continues to rise, intensifying its status as a significant public health concern [42, 43]. Integral to understanding AD’s enigma is the amyloid cascade hypothesis [44, 45]. This widely-accepted theory postulates that an intricate interplay of biochemical events, resulting in an imbalance between the synthesis and clearance of Aβ peptides, culminates in their accumulation. Over time, these peptides aggregate, leading to the formation of the characteristic plaques that wreak havoc on neural pathways [44–46]. And it’s not just AD that grapples with such protein aggregation; this phenomenon is a recurring theme, a shared hallmark across a myriad of neurodegenerative disorders.
Cinnamein being a natural compound is available in Tolu Balsam and Balsam of Peru. It has a long track record for its medicinal use in conditions such as Meniere’s syndrome and tinnitus aurum [47], chronic salpingitis [48], chronic inflammatory lesions of the pelvis [49], trachoma, and corneal opacities [50]. Patients with atherosclerotic lesions were also treated with cinnamein [51]. Here, we delineate that orally administered cinnamein reduces plaque load and restores cognitive functions in 5XFAD mouse model of AD. Since cinnamein is a naturally available non-toxic molecule, our results highlight that oral cinnamein may have therapeutic significance in lowering plaque and improving memory in AD patients.
Current therapeutic paradigms, while representing the zenith of contemporary medical science, frequently offer only fleeting moments of respite. These treatments, though indispensable in today’s clinical landscape, predominantly provide symptomatic relief. They act as momentary bulwarks against the tidal wave of cognitive decline, but they do not arrest the disease’s progression or reverse the damages already inflicted. On top of that the existing treatments exhibit a number of side effects. For example, administration of different inhibitors of cholinesterase such as Aricept, Exelon, Razadyne, Cognex, etc. has been the standard treatment for symptomatic relief in AD patients [52]. However, it is often associated with a number of side effects and unsatisfactory outcomes. While aducanumab has been approved in USA against AD, it is not authorized in Canada because of poor clinical benefit and detrimental side effects for patients [53]. In contrast, there are several advantages of cinnamein. First, cinnamein is fairly nontoxic and has been used for long time as a part of Tolu Balsam and Balsam of Peru. During the course of the treatment of 5XFAD mice, oral cinnamein did not cause any side effects like bacterial/viral infection, decrease in body weight, loss of hair, or any unusual behavior, etc. Second, cinnamein can be taken orally, the least painful route. Third, as compared to other existing anti-AD therapies, cinnamein is very economical. Therefore, from the extrapolation of dose (50 mg/kg body wt/d) from the mouse model, it is possible that oral administration of cinnamein at a dose of 3 gm/adult/day may be beneficial for AD patients without displaying any toxic effects.
Reduction of plaques from the brain is regulated at the two steps—plaque formation and degradation of existing plaques. While the increase in ADAM10-driven nonamyloidogenic pathway hinders the formation of amyloid plaques in neurons [15], upregulation of TFEB-driven lysosome-autophagy pathway results in the degradation of amyloid plaques [16]. Interestingly, cinnamein is capable of increasing the expression of both TFEB and ADAM10 in cultured hippocampal and cortical neurons. As expected, the levels of TFEB and ADAM10 were less in hippocampal and cortical neurons in vivo in the brain of 5XFAD mice as compared to that of non-Tg mice. However, after oral administration of cinnamein, hippocampal and cortical neurons of 5XFAD mice expressed greater levels of TFEB and ADAM10, suggesting that cinnamein is endowed with the property of upregulating the non-amyloidogenic pathway as well as promoting the lysosomal biogenesis-autophagy pathway.
How does cinnamein upregulate ADAM10 and TFEB? Being a lipid-lowering transcription factor, peroxisome proliferator-activated receptor alpha (PPARα) is known to reduce the level of free fatty acids and triglycerides via upregulation of peroxisomal β-oxidation pathway [54–56]. Therefore, liver is rich in PPARα. However, we have demonstrated the presence of PPARα in different regions of the brain including the hippocampus [19, 20, 37]. Among other newly-described functions in the brain, this PPARα plays a key role in controlling both plaque formation and plaque degradation [17, 18]. While in one hand, activation of PPARα stimulates the nonamyloidogenic pathway via transcriptional upregulation of ADAM10 [17], activated PPARα has also been shown to increase in lysosomal biogenesis and autophagy via transcriptional stimulation of TFEB [18, 57]. We have also seen that cinnamein remained unable to stimulate the levels of ADAM10 and TFEB in the brain of 5XFAD mice lacking PPARα, indicating an essential role of PPARα in cinnamein-mediated upregulation of ADAM10 and TFEB.
How does cinnamein employ PPARα for the upregulation of ADAM10 and TFEB pathways? It is not known whether cinnamein is a ligand of PPARα and capable of binding to the ligand-binding domain (LBD) of PPARα. Since the ligand-binding domain (LBD) of PPARα is quite large with a pocket size of 1400 A° wide, it allows lipophilic compounds such as medium and long chain fatty acids and certain derivatives of these fatty acids to be docked inside [58]. On the other hand, a catalytic triad of Ser280, Tyr314 and His440 maintains a small polar environment that ultimately allows small polar compounds to be docked inside. It is believed that these three key residues of PPARα LBD stabilize the docking of partially polar compounds via the formation of H-bonds [58]. Cinnamein or benzyl cinnamate is a negatively charged polar molecule and as evident from our in silico analysis, it forms hydrogen bonds with the catalytic triad of PPARα LBD. In addition, cinnamein also forms an H-bond with Tyr464 of PPARα, indicating strong binding of cinnamein with the PPARα LBD. This strong binding was also evident from the interaction of cinnamein with PPARα by different biophysical approaches such as time-resolved FRET and protein thermal shift assay.
In summary, cinnamein, a balsam component, binds to the LBD of PPARα and after oral administration, it clears plaques and improves spatial learning and memory in an animal model of AD via PPARα. Therefore, against the backdrop of often insufficient AD treatments, cinnamein may emerge as a putative option of hope. Its botanical origin renders it non-toxic, making it a natural, safer alternative. However, as with any scientific breakthrough, further rigorous research is imperative to truly gauge its long-term impact and clinical viability.
AUTHOR CONTRIBUTIONS
Kalipada Pahan (Conceptualization; Funding acquisition; Project administration; Software; Supervision; Writing – review & editing); Mary McKay (Data curation; Formal analysis; Validation; Visualization; Writing – original draft); Sukhamoy Gorai (Data curation; Software; Validation; Visualization; Writing – original draft); Ramesh K. Paidi (Data curation; Resources); Susanta Mondal (Data curation; Formal analysis).
ACKNOWLEDGMENTS
The authors have no acknowledgments to report.
FUNDING
This study was supported by merit awards (1I01BX005002 and I01BX005613) from US Department of Veterans Affairs and grants from NIH (AT10980 and AG050431). Moreover, Dr. Pahan is the recipient of a Research Career Scientist Award (1IK6 BX004982) from the Department of Veterans Affairs. However, the views expressed in this article are those of the authors and do not necessarily reflect the position or policy of the Department of Veterans Affairs or the United States government.
CONFLICT OF INTEREST
The authors have no conflict of interest to report.
DATA AVAILABILITY
The raw data supporting the conclusions of this article will be made available by the corresponding author upon request.
REFERENCES
[1] | Querfurth HW , LaFerla FM ((2010) ) Alzheimer’s disease. N Engl J Med 362: , 329–344. |
[2] | Yoon SY , Kim DH ((2016) ) Alzheimer’s disease genes and autophagy. Brain Res 1649: , 201–209. |
[3] | Avila J , Perry G ((2021) ) A multilevel view of the development of Alzheimer’s disease. Neuroscience 457: , 283–293. |
[4] | Nussbaum RL , Ellis CE ((2003) ) Alzheimer’s disease and Parkinson’s disease. N Engl J Med 348: , 1356–1364. |
[5] | Hardy J , Duff K , Hardy KG , Perez-Tur J , Hutton M ((1998) ) Genetic dissection of Alzheimer’s disease and related dementias: Amyloid and its relationship to tau. Nat Neurosci 1: , 355–358. |
[6] | Tanzi RE , Bertram L ((2005) ) Twenty years of the Alzheimer’s disease amyloid hypothesis: A genetic perspective. Cell 120: , 545–555. |
[7] | Mawuenyega KG , Sigurdson W , Ovod V , Munsell L , Kasten T , Morris JC , Yarasheski KE , Bateman RJ ((2010) ) Decreased clearance of CNS beta-amyloid in Alzheimer’s disease. Science 330: , 1774. |
[8] | Nicolai S , Wegrecki M , Cheng TY , Bourgeois EA , Cotton RN , Mayfield JA , Monnot GC , Le Nours J , Van Rhijn I , Rossjohn J , Moody DB , de Jong A ((2020) ) Human T cell response to CD1a and contact dermatitis allergens in botanical extracts and commercial skin care products. Sci Immunol 5: , eaax5430/. |
[9] | Allen LV Jr. ((2013) ) Basics of compounding with balsams. Int J Pharm Compd 17: , 490–495. |
[10] | Jana A , Modi KK , Roy A , Anderson JA , van Breemen RB , Pahan K ((2013) ) Up-regulation of neurotrophic factors by cinnamon and its metabolite sodium benzoate: Therapeutic implications for neurodegenerative disorders. J Neuroimmune Pharmacol 8: , 739–755. |
[11] | Pahan K ((2011) ) Immunomodulation of experimental allergic encephalomyelitis by cinnamon metabolite sodium benzoate. Immunopharmacol Immunotoxicol 33: , 586–593. |
[12] | Pahan K ((2015) ) Prospects of cinnamon in multiple sclerosis. J Mult Scler (Foster City) 2: , 1000149. |
[13] | Goldman M , Lodhi I ((2016) ) A real-world evidence study evaluating a treatment for nappy rash. Br J Nurs 25: , 432–439. |
[14] | Pahan S , Raha S , Dasarathi S , Pahan K ((2023) ) Cinnamein inhibits the induction of nitric oxide and proinflammatory cytokines in macrophages, microglia and astrocytes. J Clin Exp Immunol 8: , 520–529. |
[15] | Lichtenthaler SF , Tschirner SK , Steiner H ((2022) ) Secretases in Alzheimer’s disease: Novel insights into proteolysis of APP and TREM2. Curr Opin Neurobiol 72: , 101–110. |
[16] | Gu Z , Cao H , Zuo C , Huang Y , Miao J , Song Y , Yang Y , Zhu L , Wang F ((2022) ) TFEB in Alzheimer’s disease: From molecular mechanisms to therapeutic implications. Neurobiol Dis 173: , 105855. |
[17] | Corbett GT , Gonzalez FJ , Pahan K ((2015) ) Activation of peroxisome proliferator-activated receptor alpha stimulates ADAM10-mediated proteolysis of APP. Proc Natl Acad Sci U S A 112: , 8445–8450. |
[18] | Ghosh A , Jana M , Modi K , Gonzalez FJ , Sims KB , Berry-Kravis E , Pahan K ((2015) ) Activation of peroxisome proliferator-activated receptor alpha induces lysosomal biogenesis in brain cells: Implications for lysosomal storage disorders. J Biol Chem 290: , 10309–10324. |
[19] | Roy A , Jana M , Corbett GT , Ramaswamy S , Kordower JH , Gonzalez FJ , Pahan K ((2013) ) Regulation of cyclic AMP response element binding and hippocampal plasticity-related genes by peroxisome proliferator-activated receptor alpha. Cell Rep 4: , 724–737. |
[20] | Roy A , Jana M , Kundu M , Corbett GT , Rangaswamy SB , Mishra RK , Luan CH , Gonzalez FJ , Pahan K ((2015) ) HMG-CoA reductase inhibitors bind to PPARalpha to upregulate neurotrophin expression in the brain and improve memory in mice. Cell Metab 22: , 253–265. |
[21] | Modi KK , Roy A , Brahmachari S , Rangasamy SB , Pahan K ((2015) ) Cinnamon and its metabolite sodium benzoate attenuate the activation of p21rac and protect memory and learning in an animal model of Alzheimer’s disease. PLoS One 10: , e0130398. |
[22] | Dutta D , Jana M , Paidi RK , Majumder M , Raha S , Dasarathy S , Pahan K ((2023) ) Tau fibrils induce glial inflammation and neuropathology via TLR2 in Alzheimer’s disease-related mouse models. J Clin Invest 133: , e161987. |
[23] | Paidi RK , Raha S , Roy A , Pahan K ((2023) ) Muscle-building supplement beta-hydroxy beta-methylbutyrate binds to PPARalpha to improve hippocampal functions in mice. Cell Rep 42: , 112717. |
[24] | Dutta D , Jana M , Majumder M , Mondal S , Roy A , Pahan K ((2021) ) Selective targeting of the TLR2/MyD88/NF-kappaB pathway reduces alpha-synuclein spreading in vitro and in vivo. Nat Commun 12: , 5382. |
[25] | Dutta D , Paidi RK , Raha S , Roy A , Chandra S , Pahan K ((2022) ) Treadmill exercise reduces alpha-synuclein spreading via PPARalpha. Cell Rep 40: , 111058. |
[26] | Paidi RK , Jana M , Mishra RK , Dutta D , Pahan K ((2021) ) Selective inhibition of the interaction between SARS-CoV-2 Spike S1 and ACE2 by SPIDAR peptide induces anti-inflammatory therapeutic responses. J Immunol 207: , 2521–2533. |
[27] | Paidi RK , Jana M , Mishra RK , Dutta D , Raha S , Pahan K ((2021) ) ACE-2-interacting domain of SARS-CoV-2 (AIDS) peptide suppresses inflammation to reduce fever and protect lungs and heart in mice: Implications for COVID-19 therapy. J Neuroimmune Pharmacol 16: , 59–70. |
[28] | Paidi RK , Jana M , Raha S , Mishra RK , Jeong B , Sheinin M , Pahan K ((2023) ) Prenol, but not vitamin C, of fruit binds to SARS-CoV-2 spike S1 to inhibit viral entry: Implications for COVID-19. J Immunol 210: , 1938–1949. |
[29] | Paidi RK , Jana M , Raha S , McKay M , Sheinin M , Mishra RK , Pahan K ((2021) ) Eugenol, a component of holy basil (Tulsi) and common spice clove, inhibits the interaction between SARS-CoV-2 spike S1 and ACE2 to induce therapeutic responses. J Neuroimmune Pharmacol 16: , 743–755. |
[30] | Roy A , Kundu M , Jana M , Mishra RK , Yung Y , Luan CH , Gonzalez FJ , Pahan K ((2016) ) Identification and characterization of PPARalpha ligands in the hippocampus. Nat Chem Biol 12: , 1075–1083. |
[31] | Patel D , Roy A , Kundu M , Jana M , Luan CH , Gonzalez FJ , Pahan K ((2018) ) Aspirin binds to PPARalpha to stimulate hippocampal plasticity and protect memory. Proc Natl Acad Sci U S A 115: , E7408–E7417. |
[32] | Patel D , Roy A , Raha S , Kundu M , Gonzalez FJ , Pahan K ((2020) ) Upregulation of BDNF and hippocampal functions by a hippocampal ligand of PPARalpha. JCI Insight 5: , e136654. |
[33] | Chandra S , Jana M , Pahan K ((2018) ) Aspirin induces lysosomal biogenesis and attenuates amyloid plaque pathology in a mouse model of Alzheimer’s disease via PPARalpha. J Neurosci 38: , 6682–6699. |
[34] | Chandra G , Roy A , Rangasamy SB , Pahan K ((2017) ) Induction of adaptive immunity leads to nigrostriatal disease progression in MPTP mouse model of Parkinson’s disease. J Immunol 198: , 4312–4326. |
[35] | Jana A , Pahan K ((2004) ) Human immunodeficiency virus type 1 gp120 induces apoptosis in human primary neurons through redox-regulated activation of neutral sphingomyelinase. J Neurosci 24: , 9531–9540. |
[36] | Roy A , Modi KK , Khasnavis S , Ghosh S , Watson R , Pahan K ((2014) ) Enhancement of morphological plasticity in hippocampal neurons by a physically modified saline via phosphatidylinositol-3 kinase. PLoS One 9: , e101883. |
[37] | Roy A , Pahan K ((2015) ) PPARalpha signaling in the hippocampus: Crosstalk between fat and memory. J Neuroimmune Pharmacol 10: , 30–34. |
[38] | Rangasamy SB , Jana M , Dasarathi S , Kundu M , Pahan K ((2023) ) Treadmill workout activates PPARalpha in the hippocampus to upregulate ADAM10, decrease plaques and improve cognitive functions in 5XFAD mouse model of Alzheimer’s disease. Brain Behav Immun 109: , 204–218. |
[39] | Rangasamy SB , Jana M , Roy A , Corbett GT , Kundu M , Chandra S , Mondal S , Dasarathi S , Mufson EJ , Mishra RK , Luan CH , Bennett DA , Pahan K ((2018) ) Selective disruption of TLR2-MyD88 interaction inhibits inflammation and attenuates Alzheimer’s pathology. J Clin Invest 128: , 4297–4312. |
[40] | Chandra S , Roy A , Patel DR , Pahan K ((2019) ) PPARalpha between aspirin and plaque clearance. J Alzheimers Dis 71: , 389–397. |
[41] | Raha S , Ghosh A , Dutta D , Patel DR , Pahan K ((2021) ) Activation of PPARalpha enhances astroglial uptake and degradation of beta-amyloid. Sci Signal 14: , eabg4747. |
[42] | Knopman DS , Amieva H , Petersen RC , Chetelat G , Holtzman DM , Hyman BT , Nixon RA , Jones DT ((2021) ) Alzheimer disease. Nat Rev Dis Primers 7: , 33. |
[43] | Masters CL , Bateman R , Blennow K , Rowe CC , Sperling RA , Cummings JL ((2015) ) Alzheimer’s disease. Nat Rev Dis Primers 1: , 15056. |
[44] | Karran E , De Strooper B ((2022) ) The amyloid hypothesis in Alzheimer disease: New insights from new therapeutics. Nat Rev Drug Discov 21: , 306–318. |
[45] | Panza F , Lozupone M , Logroscino G , Imbimbo BP ((2019) ) A critical appraisal of amyloid-beta-targeting therapies for Alzheimer disease. Nat Rev Neurol 15: , 73–88. |
[46] | Hampel H , Hardy J , Blennow K , Chen C , Perry G , Kim SH , Villemagne VL , Aisen P , Vendruscolo M , Iwatsubo T , Masters CL , Cho M , Lannfelt L , Cummings JL , Vergallo A ((2021) ) The amyloid-beta pathway in Alzheimer’s disease. Mol Psychiatry 26: , 5481–5503. |
[47] | Scal JC ((1946) ) Benzyl cinnamate in treatment of Meniere’s syndrome and tinnitus aurum; a clinical report. Eye Ear Nose Throat Mon 25: , 150. |
[48] | Eisenstein MI , Bendo GJ ((1947) ) Treatment of chronic salpingitis with benzyl cinnamate ester (Jacobson’s solution). Am J Surg 74: , 200–204. |
[49] | Jacobson J ((1951) ) Mode of action of benzyl cinnamate solution in chronic inflammatory lesions of the pelvis. Am Pract Dig Treat 2: , 699–700. |
[50] | Shah MA , Awan GM ((1952) ) A note on the treatment of trachoma and corneal opacities with benzyl cinnamate. Rev Int Trach 29: , 44–48. |
[51] | Ellis HL , Jacobson J ((1960) ) Benzyl cinnamate (Jacobson’s solution) with vitamin A. A one-year experience in the treatment of cerebrovascular lesions. Harlem Hosp Bull (N Y) 1: , 97–102. |
[52] | Atri A ((2011) ) Effective pharmacological management of Alzheimer’s disease. Am J Manag Care 17 Suppl 13: , S346–355. |
[53] | Avgerinos KI , Ferrucci L , Kapogiannis D ((2021) ) Effects of monoclonal antibodies against amyloid-beta on clinical and biomarker outcomes and adverse event risks: A systematic review and meta-analysis of phase III RCTs in Alzheimer’s disease. Ageing Res Rev 68: , 101339. |
[54] | Pahan K ((2006) ) Lipid-lowering drugs. Cell Mol Life Sci 63: , 1165–1178. |
[55] | Marcus SL , Miyata KS , Zhang B , Subramani S , Rachubinski RA , Capone JP ((1993) ) Diverse peroxisome proliferator-activated receptors bind to the peroxisome proliferator-responsive elements of the rat hydratase/dehydrogenase and fatty acyl-CoA oxidase genes but differentially induce expression. Proc Natl Acad Sci U S A 90: , 5723–5727. |
[56] | Schoonjans K , Peinado-Onsurbe J , Lefebvre AM , Heyman RA , Briggs M , Deeb S , Staels B , Auwerx J ((1996) ) PPARalpha and PPARgamma activators direct a distinct tissue-specific transcriptional response via a PPRE in the lipoprotein lipase gene. EMBO J 15: , 5336–5348. |
[57] | Ghosh A , Pahan K ((2016) ) PPARalpha in lysosomal biogenesis: A perspective. Pharmacol Res 103: , 144–148. |
[58] | Xu HE , Lambert MH , Montana VG , Plunket KD , Moore LB , Collins JL , Oplinger JA , Kliewer SA , Gampe RT Jr. , McKee DD , Moore JT , Willson TM ((2001) ) Structural determinants of ligand binding selectivity between the peroxisome proliferator-activated receptors. Proc Natl Acad Sci U S A 98: , 13919–13924. |


