
Curve Walking Reveals More Gait Impairments in Older Adults with Mild Cognitive Impairment than Straight Walking: A Kinect Camera-Based Study
Abstract
Background:
Mild cognitive impairment (MCI) can be an early sign of Alzheimer’s disease and other types of dementia detectable through gait analysis. Curve walking, which demands greater cognitive and motor skills, may be more sensitive in MCI detection than straight walking. However, few studies have compared gait performance in older adults with and without MCI in these conditions.
Objective:
To compare the capability of curve and straight walking tests for the detection of MCI among older adults.
Methods:
We employed a Kinect v.2 camera to record the gait of 55 older adults (30 healthy controls, 25 with MCI) during single-task straight and curve walking tests. We examined 50 gait markers and conducted statistical analyses to compare groups and conditions. The trail was approved with protocol No. IR.SEMUMS.REC.1398.237 by the ethics committee of Semnan University of Medical Sciences in Iran.
Results:
Older adults with MCI exhibited more compromised gait performance, particularly during curve walking. Curve walking outperformed straight walking in MCI detection, with several gait markers showing significant differences between healthy controls and MCI patients. These markers encompass average velocity, cadence, temporal markers (e.g., gait cycle subphase durations), spatial markers (e.g., foot position changes during gait subphases), and spatiotemporal markers (e.g., step and stride velocities).
Conclusions:
Our study suggests curve walking as a more informative and challenging test for MCI detection among older adults, facilitating early diagnosis using non-invasive, cost-effective tools like the Kinect v.2 camera, complementing cognitive assessments in early diagnosis, and tracking MCI progression to dementia.
INTRODUCTION
Alzheimer’s disease (AD) is the leading cause of neurodegenerative dementia, estimated to affect 6.5 million Americans aged 65 or older in 2022, and this figure is predicted to increase to 12.7 million by the year 2050 [1]. AD is also a leading cause of morbidity and mortality, being the sixth most prevalent cause of death in the United States [2]. AD typically manifests as a decline in cognitive function with a gradual decline in an individual’s ability to perform daily activities such as walking [3, 4]. Although factors such as aging, genetics, lifestyle, and environment have been reported to increase the risk of AD, accurate and early clinical detection remains a challenge. Although no cure exists, early diagnosis of AD is essential to start symptomatic and disease-modifying medications that may slow the progression [5].
Mild cognitive impairment (MCI) is defined as an early stage of cognitive decline greater than expected for normal cognitive aging and is often the earliest detectable sign of AD [6]. Individuals with MCI due to AD are characterized by the presence of biomarkers of AD pathology and are at a high risk of progression to AD with an annual rate of 10 to 15% [7]. The standard office evaluation for MCI includes a detailed history, comprehensive physical and neurological examination, cognitive testing, blood work, and brain imaging [8]. However, depending on the clinical setting, these methods can be time-consuming, costly, and outside some clinicians’ comfort level. Thus, new tools like quantitative analysis of physical activities such as gait and balance have been suggested as non-invasive, low-cost tools for detecting these at-risk having MCI and AD [9].
There is emerging evidence that gait and balance tests demonstrate significant differences between healthy control older adults (HC) without cognitive impairment and those with MCI or AD [10–12]. Most of the literature recorded gait tests in a straight path, and often with the addition of a cognitive or motor task to increase the sensitivity of gait tests for MCI detection [13]. Straight walking is a rhythmic and simpler activity than curve walking. Walking on a curving path requires a transition time for changing the direction of walking and correction of balance [14]. Comprehensive analysis of curve walking may provide more information for detecting MCI among older adults than straight walking because curved path walking requires prediction of direction and postural control [14, 15]. However, to our knowledge, no study has quantitatively compared the performance of HC versus MCI in straight and curve walking.
Therefore, in this study, we aim to fill this gap by using a novel system to record the gait of HC and MCI using a non-invasive, low-cost, non-wearable, and easy-setting Kinect v.2 camera that can detect and track 25 joints of body movement. We separately extract a comprehensive collection of gait markers from the recorded signals for both straight and curve walking tests. We hypothesize that curve walking will be more sensitive to detecting MCI among older adults than straight walking.
This study makes several significant contributions. First, it provides a comprehensive quantitative analysis of gait performance by comparing straight and curved walking using the detailed assessment provided by the Kinect v.2 camera. Second, we examine 50 markers, including macro and micro markers, derived from overall performance and subphases of gait cycles. This comprehensive approach enhances the understanding of gait characteristics. Third, our findings suggest that curve walking offers greater challenges and valuable insights for detecting MCI than straight walking. Moreover, the study demonstrates the feasibility and accessibility of using the Kinect v.2 camera for curve walking assessment, which can complement cognitive assessments and aid in early diagnosis and management of MCI. The impact of this study extends to clinical practice and research, providing improved methods for MCI screening and monitoring in older adults that can be easily replicated with minimal costs and time in the clinic setting.
MATERIALS AND METHODS
Participants
A total of 55 participants, comprising 30 HC individuals and 25 individuals with MCI, were recruited for the study. Participants were selected following a comprehensive analysis of volunteers who were clients of the Iran Dementia and Alzheimer’s Association (IDAA) or had responded to notices and announcements about the study. The individuals with MCI were diagnosed by the IDAA based on a comprehensive evaluation, including brain imaging, electroencephalography (EEG), neuropsychological assessments, and physical examinations. The HC participants underwent a similar evaluation but were without any cognitive impairment. The Persian version of the Montreal Cognitive Assessment (MoCA) and Mini-Mental State Examination (MMSE) were utilized to assess cognitive status. Additionally, the Geriatric Depression Scale (GDS) was employed to measure depression symptoms.
Exclusion criteria for this study included individuals who were diagnosed with moderate to severe depression, were taking medication that could interfere with testing, had undergone surgery such as knee or hip replacement, or had experienced a stroke. All participants could perform the physical tests independently, and none had any visual or hearing impairments that could interfere with the tests. We obtained informed consent from all participants before the start of the study, and they were free to withdraw at any time if they wished. The ethics committee of Semnan University of Medical Sciences in Iran approved the study under Protocol No. IR.SEMUMS.REC.1398.237 and date of approval 2019.12.17 and performed in line with the Declaration of Helsinki.
Gait measurement
A Kinect v.2 camera (a depth camera from Microsoft corporation) was used to record the participants’ gait while performing two different walking tests: a straight and a curved walking test. Each test covered a distance of 10 meters, a recognized standard for reliable gait assessment across populations, including MCI subjects [16–18]. For each participant, three trials were conducted on both straight and curved paths, with the mean of these trials calculated to ensure robust gait analysis. Median values of gait markers were also used to depict the most consistent walking conditions for individuals. The curve walking test involved walking around an oval path, while the straight walking test was conducted on a straight path.
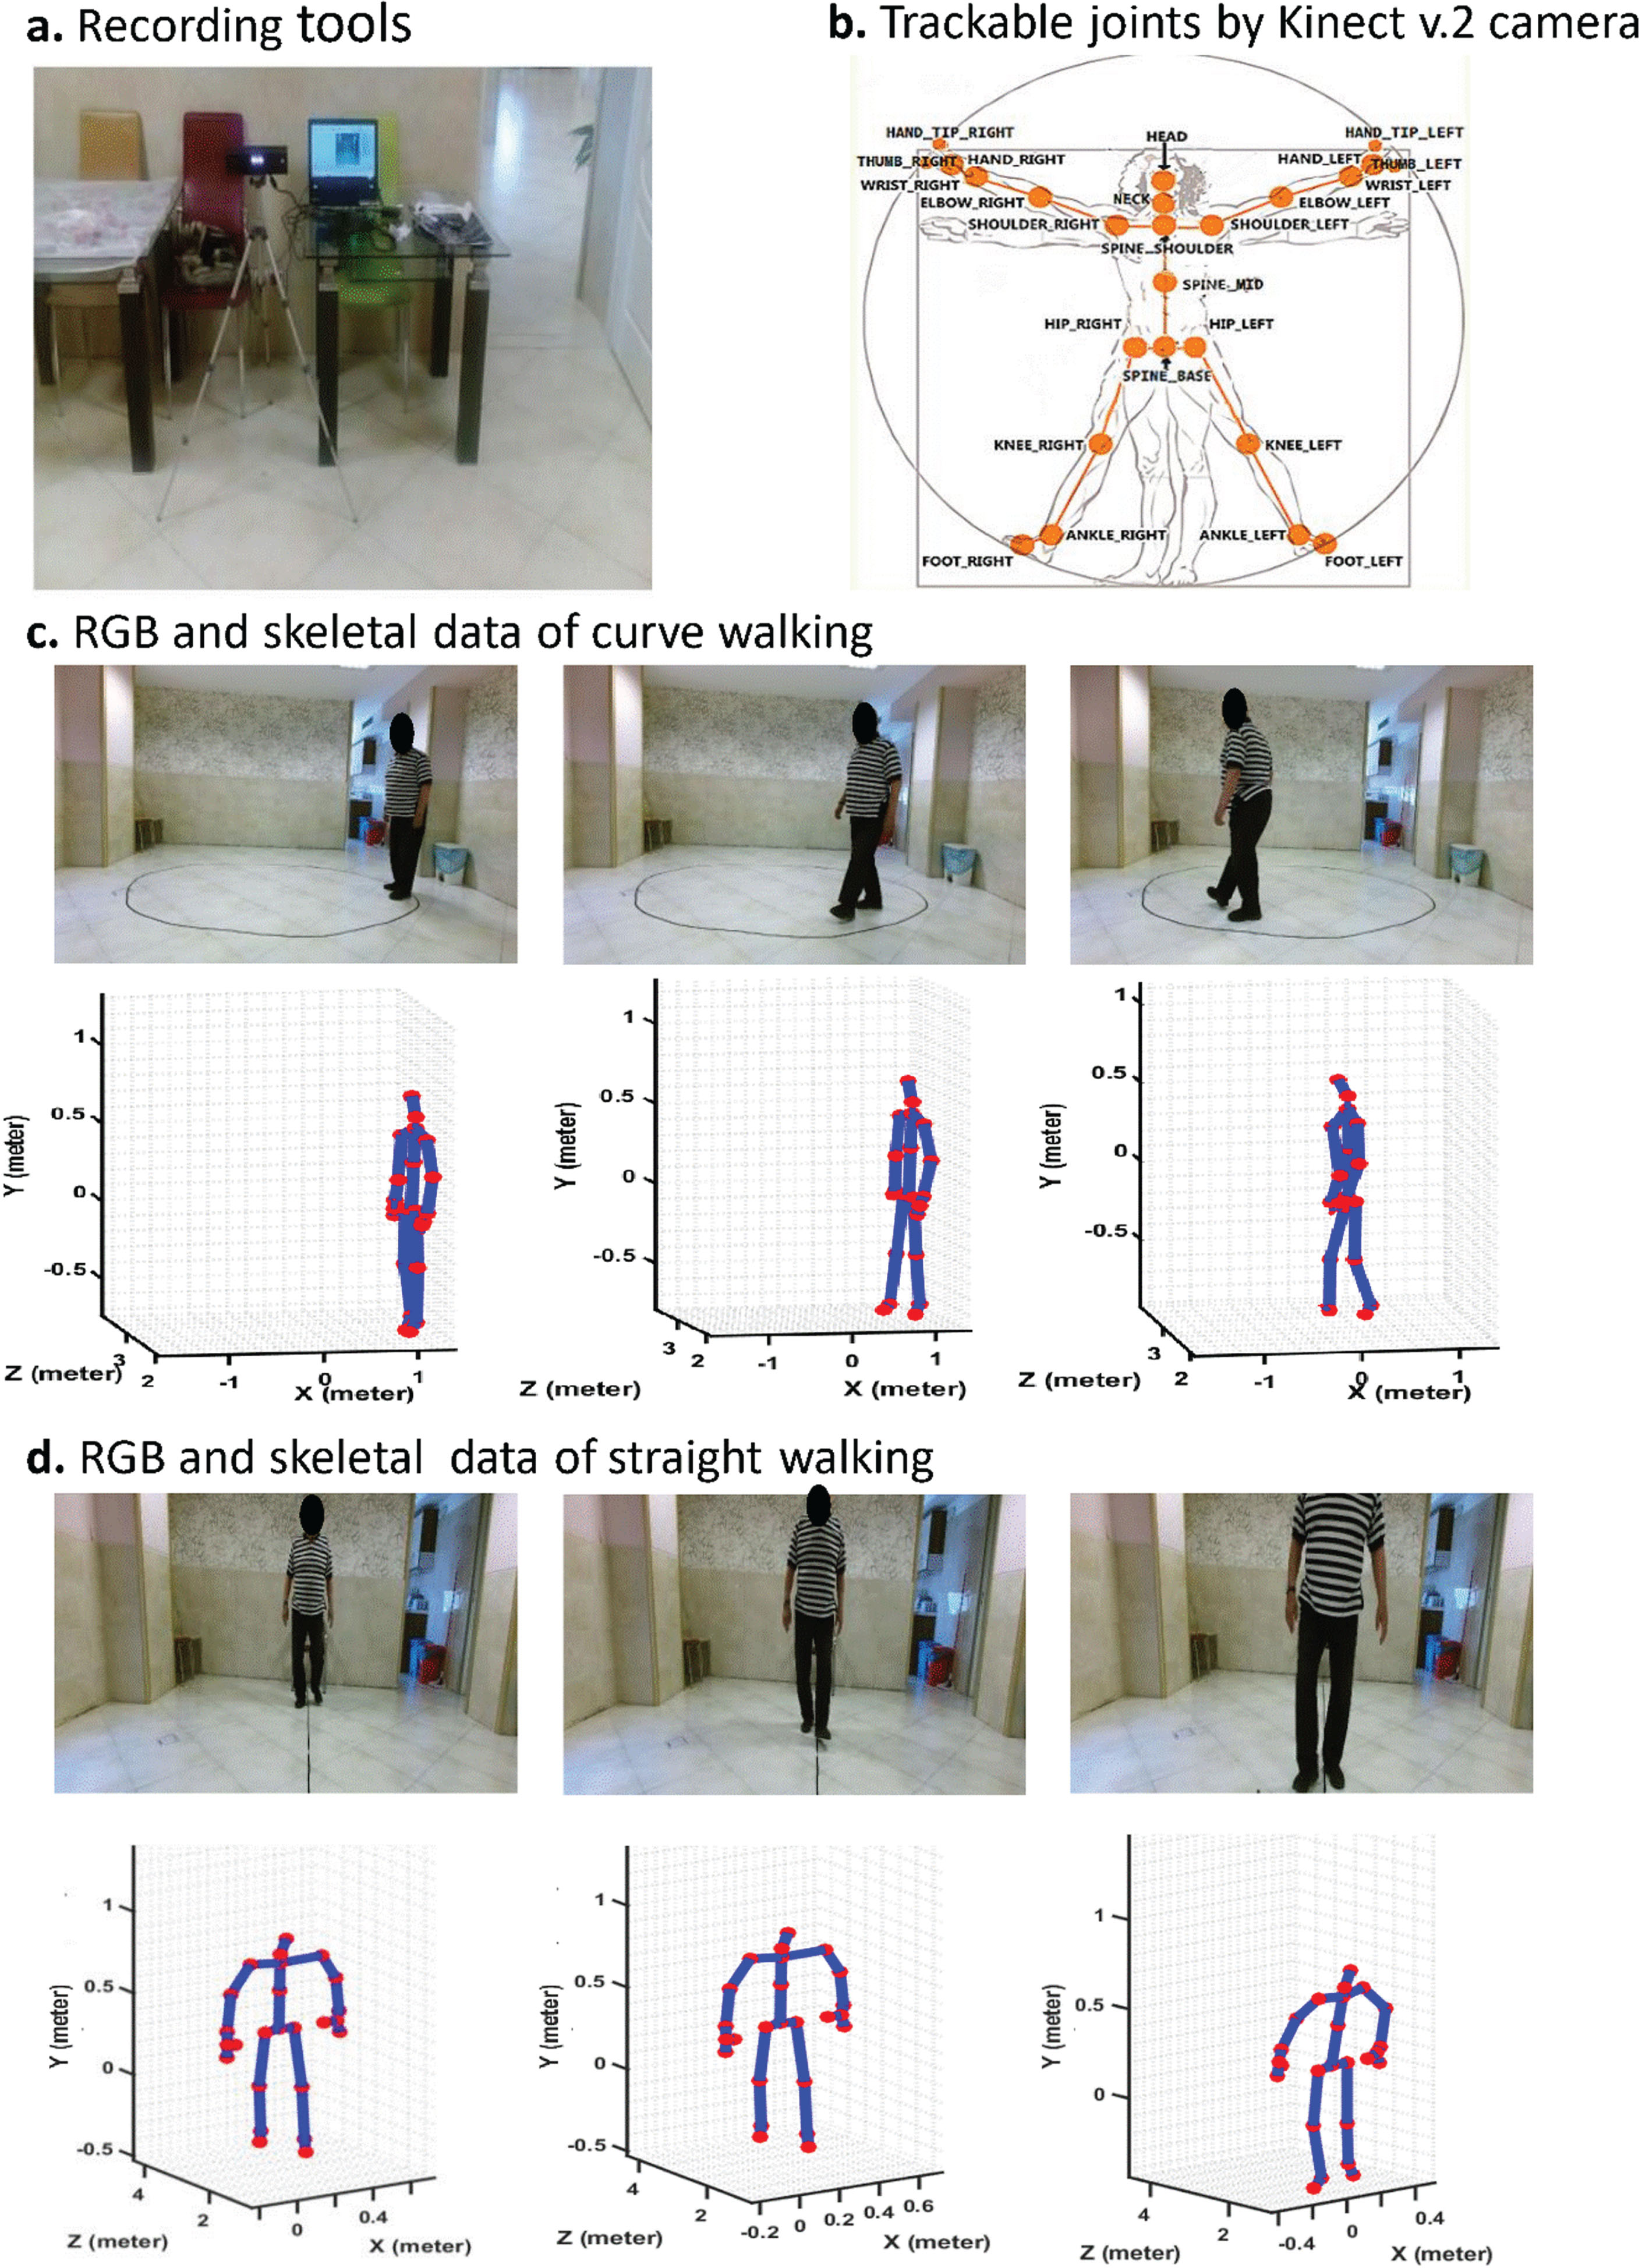
The Kinect v.2 camera was mounted on a tripod and connected to a laptop. We used a Graphical User Interface (GUI) programmed in MATLAB 2019 to control the data recording. The Kinect v.2 camera can detect and track 25 joints of the subject’s body [19, 20]. Figure 1 shows the tools of recording, trackable joints of the body, and recorded samples of straight and curved paths walking beside the skeletal data (locations of body joints). The skeletal data was plotted using the position of the detected and tracked body joints using Kinect v.2 in MATLAB 2019.
Fig. 1
a. Recording tools and setup, b. Map of joints can be tracked by Kinect v.2 camera, c. a participant performing curve walking beside Kinect v.2 records movement signals from 25 body joints, and d. Performing straight walking and recorded signals of his body joints in the form of skeleton by Kinect v.2 camera.
Data preprocessing
The Kinect v.2 camera signals were preprocessed before extracting the gait markers. We applied a six-order Butterworth filter with a cutoff frequency of 3 Hz to remove noise from the recorded signals of body joints during performing the walking tests [21].
Gait marker extraction
A comprehensive collection of 50 gait markers for each test separately was extracted from the preprocessed signals. These markers included two macro markers (average velocity and cadence), 24 micro temporal markers (duration of feet for various sub-phases of the gait cycle, such as stance, swing, step, and stride phases), 18 micro spatial markers (location changes of feet for various sub-phases of the gait cycle), and six micro spatiotemporal markers (velocity of feet for various sub-phases of the gait cycle). These markers provided detailed information on the functional performance of the participants during the gait tests. A detailed description of the extracted gait markers can be found in the corresponding reference [22].
This study emphasizes spatio-temporal gait markers using Kinect v.2 for better validity [19, 20]. Also, evidence shows the predictive value of spatio-temporal gait markers for kinematic parameters [23–25], making them a practical proxy. Clinically, spatio-temporal parameters, assessed with tools like GAITRite, offer easy interpretation and group comparison [26, 27].
Statistical analysis
Descriptive statistical analyses were used to compare the clinical and demographic information and the walking markers between the two study groups using the MATLAB 2019 software. We checked the normality of the data using the Shapiro-Wilk test [28]. For normally distributed data, unpaired t-tests were used to compare the gait markers of the two groups, while for non-normally distributed data, Mann-Whitney U tests were used to compare the gait markers of the two groups [29, 30]. For categorical data, such as gender, we used chi-square tests to compare the proportions of the two groups. ANCOVA (Analysis of Covariance) was used to adjust the extracted gait markers for the confounding variables of BMI, years of education, and GDS scores, which showed significant differences between the two groups [31]. This approach addressed the potential sources of bias and variability in our data analysis. We reported the results as mean±standard deviation (SD) for continuous variables. A p-value of less than 0.05 was considered statistically significant for all analyses (p-value <0.05).
RESULTS
The demographic and clinical characteristics of the participants are shown in Table 1. There were no significant differences in age and gender distribution between the two groups. However, the two groups had significant differences in body mass index (BMI), years of education, and GDS scores. Participants with MCI had a higher BMI, lower levels of education, and higher GDS scores than HCs. The extracted gait markers were adjusted for these confounding factors in the analysis, as they may impact physical test performance. As expected, the MCI group had lower scores on the MoCA and MMSE tests than the HC group.
Table 1
Demographic and clinical information of participants
| Characteristic | HC (n = 30) | MCI (n = 25) | p |
| mean±SD | mean±SD | ||
| Age (y) | 68.33±2.15 | 69.76±6.45 | 0.091 |
| Female gender, n (%) | 18 (60) | 19 (76) | 0.216 |
| BMI (kg/m2) | 24.51±2.67 | 26.67±2.62 | <0.001* |
| Years of education | 13.53±3.05 | 11.56±3.00 | 0.008* |
| MMSE | 28.50±1.17 | 25.60±1.29 | <0.001* |
| MoCA | 27.13±2.05 | 22.76±1.69 | <0.001* |
| GDS | 1.43±1.33 | 3.52±1.29 | <0.001* |
Mean± Standard deviation was shown. n, number of subjects; HC, healthy cognitive control group; MCI, mild cognitive impairment; AD, Alzheimer’s disease; BMI, body mass index; MMSE, Mini-Mental State Examination (maximum score, 30); MoCA, Montreal Cognitive Assessment (maximum score, 30); GDS, Geriatric Depression Scale (maximum score, 15); *Significant difference at p-value <0.05.
We analyzed gait performance in both conditions to investigate the sensitivity of curve walking compared to straight walking for detecting MCI among older adults. We extracted 50 gait markers from the recorded signals for each condition, controlling for confounding factors such as BMI, years of education, and GDS scores. These markers were classified into four categories: macro, micro temporal, micro spatial, and micro spatiotemporal. Table 2 presents the mean, standard deviation, and p-value of each marker for both groups and conditions.
Table 2
Extracted markers from straight and curve walking and their comparison results
| Feature | Straight Walking | Curve Walking | |||||
| Type | Name | HC | MCI | p | HC | MCI | p |
| Macro | Velocity (cm/s) | 50.13±27.92 | 47.39±9.80 | 0.780 | 45.90±8.89 | 39.27±10.09 | 0.007* |
| Cadence (steps/min) | 68.22±10.55 | 68.90±9.70 | 0.247 | 62.02±9.73 | 55.00±11.67 | 0.018* | |
| Micro Temporal | Stance T. me (s) | 0.78±0.24 | 0.83±0.34 | 0.716 | 0.57±0.15 | 0.64±0.22 | 0.138 |
| Stance T. var (%) | 18.15±20.91 | 23.48±26.30 | 0.993 | 49.91±18.75 | 73.08±20.27 | <0.001* | |
| Stance T. med (s) | 0.78±0.24 | 0.84±0.33 | 0.729 | 0.53±0.17 | 0.52±0.23 | 0.384 | |
| Swing T. me (s) | 0.71±0.15 | 0.72±0.16 | 0.841 | 0.54±0.04 | 0.52±0.07 | 0.211 | |
| Swing T. var (%) | 12.41±16.09 | 19.83±13.89 | 0.053 | 26.10±8.00 | 32.89±11.12 | 0.018* | |
| Swing T. med (s) | 0.69±0.15 | 0.72±0.16 | 0.742 | 0.51±0.05 | 0.48±0.06 | 0.001* | |
| DS T. me (s) | 0.21±0.11 | 0.25±0.14 | 0.323 | 0.21±0.04 | 0.31±0.09 | <0.001* | |
| DS T. var (%) | 69.63±38.82 | 80.65±26.45 | 0.407 | 80.16±22.57 | 91.91±21.54 | 0.072 | |
| DS T. med (s) | 0.13±0.08 | 0.17±0.10 | 0.080 | 0.17±0.05 | 0.23±0.05 | <0.001* | |
| SS T. me (s) | 0.53±0.16 | 0.52±0.15 | 0.498 | 0.40±0.08 | 0.35±0.09 | 0.014* | |
| SS T. var (%) | 37.30±23.06 | 45.14±25.72 | 0.196 | 49.00±13.07 | 48.56±11.29 | 0.896 | |
| SS T. med (s) | 0.57±0.18 | 0.55±0.18 | 0.496 | 0.36±0.09 | 0.34±0.10 | 0.158 | |
| Step T. me (s) | 0.77±0.13 | 0.78±0.11 | 0.331 | 0.88±0.13 | 1.05±0.27 | 0.012* | |
| Step T. var (%) | 18.05±16.60 | 27.13±11.29 | 0.042* | 34.08±17.07 | 40.51±10.50 | 0.017* | |
| Step T. med (s) | 0.76±0.09 | 0.77±0.10 | 0.606 | 0.83±0.09 | 0.94±0.20 | 0.013* | |
| Step T. sym me | 0.64±0.08 | 0.64±0.06 | 0.680 | 0.83±0.03 | 0.84±0.03 | 0.207 | |
| Step T. sym var (%) | 24.22±20.21 | 34.77±14.35 | 0.035* | 14.64±5.93 | 14.45±5.27 | 0.899 | |
| Step T. sym med | 0.68±0.08 | 0.70±0.08 | 0.452 | 0.87±0.03 | 0.88±0.03 | 0.019* | |
| Stride T. me (s) | 1.55±0.30 | 1.54±0.22 | 0.254 | 1.77±0.26 | 2.08±0.53 | 0.016* | |
| Stride T. var (%) | 13.66±14.58 | 19.61±9.54 | 0.049* | 26.12±12.36 | 29.41±10.98 | 0.261 | |
| Stride T. med (s) | 1.57±0.30 | 1.58±0.25 | 0.496 | 1.67±0.18 | 1.92±0.42 | 0.024* | |
| Stride T.reg me | 0.94±0.06 | 0.77±0.12 | <0.001* | 0.76±0.09 | 0.74±0.09 | 0.414 | |
| Stride T. reg var (%) | 0.37±2.35 | 5.73±10.14 | 0.118 | 21.75±14.39 | 18.65±9.16 | 0.729 | |
| Stride T. reg med | 0.94±0.06 | 0.77±0.12 | <0.001* | 0.75±0.11 | 0.74±0.11 | 0.676 | |
| Micro Spatial | Step L. me (cm) | 35.75±5.53 | 31.06±6.74 | 0.003* | 37.58±4.97 | 32.91±3.46 | <0.001* |
| Step L. var (%) | 21.21±18.29 | 32.65±19.51 | 0.016* | 37.01±9.97 | 41.84±9.57 | 0.075 | |
| Step L. med (cm) | 37.63±5.12 | 30.99±9.19 | <0.001* | 40.16±5.76 | 34.22±4.90 | <0.001* | |
| Step L. sym me | 0.80±0.17 | 0.74±0.19 | 0.106 | 0.70±0.10 | 0.66±0.11 | 0.114 | |
| Step L. sym var (%) | 22.16±31.41 | 21.88±15.86 | 0.174 | 34.87±12.43 | 38.87±13.25 | 0.255 | |
| Step L. sym med | 0.83±0.18 | 0.75±0.19 | 0.025* | 0.75±0.13 | 0.67±0.16 | 0.030* | |
| Step W. me (m) | 0.12±0.03 | 0.13±0.03 | 0.919 | 0.21±0.04 | 0.17±0.03 | 0.002* | |
| Step W. var (%) | 30.91±12.54 | 23.10±11.13 | 0.013* | 56.82±12.33 | 67.09±13.87 | 0.011* | |
| Step W. med (m) | 0.13±0.03 | 0.13±0.03 | 0.912 | 0.21±0.06 | 0.16±0.04 | 0.022* | |
| Step H. me (m) | 0.11±0.04 | 0.08±0.04 | 0.003* | 0.12±0.02 | 0.13±0.02 | 0.069 | |
| Step H. var (%) | 28.56±12.18 | 39.24±14.15 | 0.012* | 38.65±14.60 | 46.29±11.20 | 0.004* | |
| Step H. med (m) | 0.11±0.04 | 0.08±0.05 | 0.020* | 0.11±0.02 | 0.12±0.02 | 0.114 | |
| Stride L. me (cm) | 74.02±11.16 | 63.62±14.92 | 0.006* | 75.84±10.44 | 65.91±6.83 | <0.001* | |
| Stride L. var (%) | 11.82±14.75 | 21.45±13.08 | 0.013* | 27.84±11.09 | 30.83±12.33 | 0.393 | |
| Stride L. med (cm) | 74.36±12.32 | 63.88±15.35 | 0.002* | 76.46±11.61 | 65.10±9.50 | <0.001* | |
| Stride L. reg me | 0.96±0.06 | 0.79±0.13 | <0.001* | 0.68±0.12 | 0.70±0.12 | 0.657 | |
| Stride L. reg var (%) | 2.44±2.72 | 6.60±14.42 | 1.00 | 23.37±15.17 | 24.66±14.71 | 0.666 | |
| Stride L. reg med | 0.96±0.06 | 0.79±0.13 | <0.001* | 0.68±0.13 | 0.71±0.15 | 0.369 | |
| Micro Spatiotemporal | Step V. me (cm/s) | 47.26±7.04 | 45.62±13.01 | 0.574 | 46.41±8.05 | 37.17±8.08 | <0.001* |
| Step V. var (%) | 30.75±19.45 | 52.01±21.87 | <0.001* | 47.66±9.92 | 53.47±14.37 | 0.083 | |
| Step V. med (cm/s) | 47.65±8.28 | 41.67±12.88 | 0.139 | 46.88±9.48 | 35.08±9.92 | <0.001* | |
| Stride V. me (cm/s) | 48.08±7.22 | 43.65±12.81 | 0.177 | 45.51±7.91 | 35.47±8.51 | <0.001* | |
| Stride V. var (%) | 14.47±14.88 | 28.80±13.21 | 0.001* | 37.78±11.52 | 38.89±10.05 | 0.704 | |
| Stride V. med (cm/s) | 48.13±7.97 | 43.16±12.73 | 0.165 | 46.35±8.48 | 34.15±10.06 | <0.001* | |
Data are shown as mean±standard deviation; p-value is reported for comparison between two study groups; *Significant difference at p-value <0.05. HC, healthy control without cognitive impairment; MCI, mild cognitive impairment; T, time; L, length; W, width; H, height; V, velocity; me, mean; var, variability; sym, symmetry; reg, regularity; DS, double support; SS, single support.
Curve Walking (CW) test
In the CW test, we observed significant differences between the HC and MCI groups in 27 out of the 50 extracted markers. Among these markers, two were macro markers, namely average velocity, and cadence, while the remaining 25 were micro markers. The micro markers comprised 12 micro temporal markers, 9 micro spatial markers, and 4 micro spatiotemporal markers.
Straight Walking (SW) test
Conversely, the SW test revealed significant differences in 20 out of the 50 extracted markers. None of these markers were macro markers; instead, they consisted of 5 micro temporal markers, 13 micro spatial markers, and 2 micro spatiotemporal markers.
Comparison of CW and SW markers
Comparing the markers with significant differences between CW and SW, we found that 19 out of the 27 significant markers in CW were unique and did not show significant differences in SW. On the other hand, 12 markers in SW were unique and exhibited significant differences only in SW. Additionally, 8 markers were common in both CW and SW conditions, showing significant differences in both tasks.
Unique significant markers in CW
In CW, the unique significant markers included 2 macro markers (velocity and cadence), 11 temporal markers (mean and median of double support time (DST), single support time (SST), step time, and stride time, variability of stance and swing time, as well as symmetry of step time), 2 spatial micro markers (mean and median of step width), and 4 spatiotemporal markers (mean and median of step and stride velocity).
Unique significant markers in SW
For SW, the unique significant markers comprised 4 micro temporal markers (variability of stride time and step time symmetry, as well as mean and median of stride time regularity), 6 micro spatial markers (mean and median of step height, and stride length regularity, as well as the variability of step and stride length), and 2 micro spatiotemporal markers (variability of step and stride velocity).
Common significant markers in CW and SW
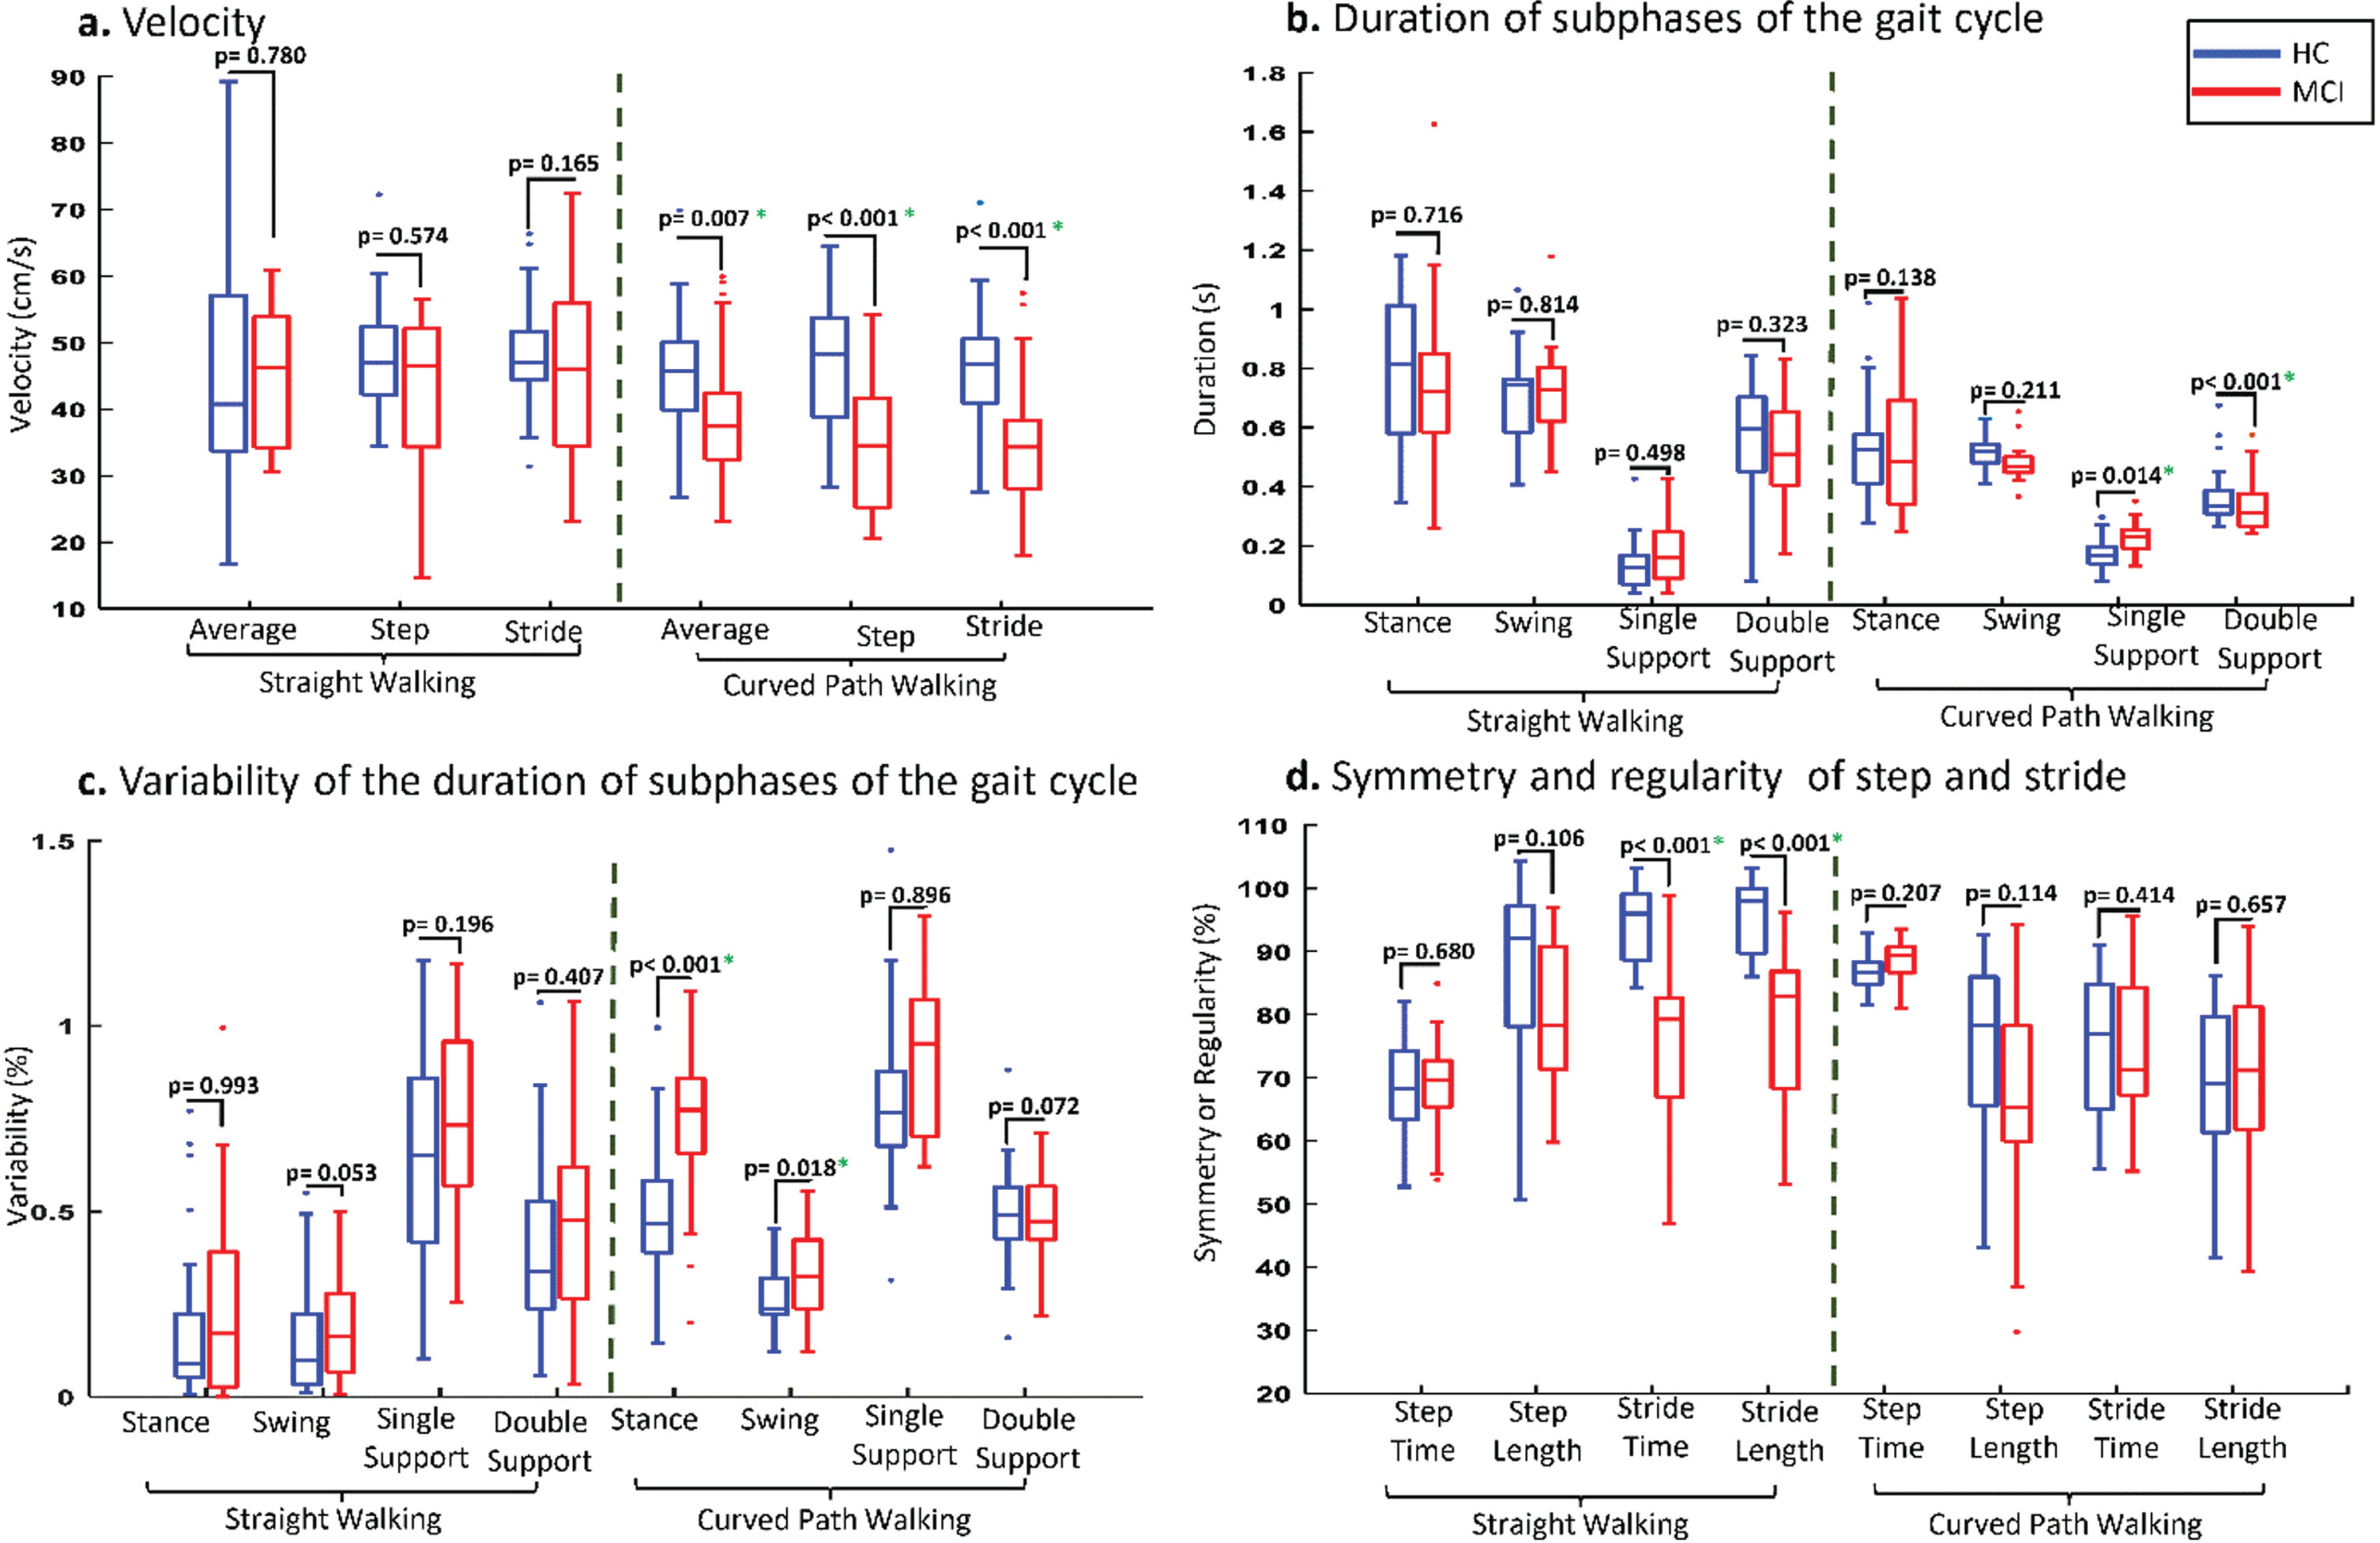
The common markers between CW and SW conditions consisted of 1 temporal marker (step time variability) and 7 micro spatial markers (mean of step and stride length, median of step length, step length symmetry, and stride length regularity, as well as variability of step length and step height). Figure 2 provides a visual representation of the performance comparison between the HC and MCI subjects in CW and SW conditions. In straight walking, older adults with MCI exhibited lower average velocity (47.39±9.80 mean±SD), step velocity (45.62±13.01), and stride velocity (43.65±12.81) compared to HC (50.13±27.92, 47.26±7.04, and 48.08±7.22, respectively). In CW, average velocity, step velocity, and stride velocity significantly decreased among MCIs to 39.27±10.09, 37.17±8.08, and 35.47±8.51 (cm/s), respectively (Fig. 2a). The values listed in Table 2 have been adjusted for BMI, in line with findings from Zhou et al. (2020) [32]. In contrast, the higher values reported by Zancan et al. (2021) did not account for such confounders [33].
Fig. 2
Comparison of gait markers between two study groups in straight and curve walking conditions.
Temporal and spatial markers
The changes in mean and median values of micro temporal and spatial markers were not consistently in the same direction. Double support, step time, and stride time increased among study groups, especially in MCIs, while stance, swing, and single support time decreased in CW. For example, step time increased to 1.05±0.27 seconds (s) for MCIs and 0.88±0.13 (s) for HCs in CW, while these markers were only 0.78±0.11 (s) and 0.77±0.13 (s) for both groups in the SW condition (Fig. 2b). In comparison, stance time changed from 0.83±0.34 (s) to 0.64±0.22 (s) for MCIs when transitioning from straight to curve walking (Fig. 2b).
Variability of gait cycle subphases
The variability of subphases of the gait cycle differed between SW and CW. In CW, the variability of subphases such as stance, swing, double and single support, step, and stride as micro temporal features increased, and these changes were more pronounced among MCIs. Figure 2c illustrates the changes in the variability of different subphases of gait cycles between the two study groups across different walking tests. For instance, the variability of stance and swing time increased from 23.48±26.30% and 19.83±13.89% to 73.08±20.27% and 32.89±11.12% for MCIs, and from 18.15±20.91% and 12.41±16.09% to 49.91±18.75% and 26.10±8.00% for HCs when transitioning from straight to curve walking. Similar changes were observed for the variability of micro spatial markers, where the variability of step width and height increased from 23.10±11.13% and 39.24±14.15% to 67.09±13.87% and 46.29±11.20% for MCIs, while these markers increased from 30.91±12.54% and 28.56±12.18% to 56.82±12.33% and 38.65±14.60% for HCs with the transition from straight walking to curve walking.
Symmetry and regularity markers
A total of 12 markers related to symmetry and regularity were extracted from step and stride, including their mean, median, and variability. Among these markers, mean and median values generally decreased from SW to CW for both study groups, except for the mean and median of step time. However, for variability, the variability of step and stride time symmetry decreased to 14.45±5.27% and 18.65±9.16% for MCIs, and to 14.64±5.93% and 21.75±14.39% for HCs, respectively. In contrast, the variability of step and stride length symmetry and regularity increased when transitioning from SW to CW (Fig. 2d).
Effect of curve path on subject’s walking
To examine the impact of changing the walking test from straight walking to curve walking on MCI and HC participants, the costs of the walking test were calculated. Our results showed that the gait of MCI older adults was affected more than HCs when the walking test changed from SW to CW. The costs of 31 out of 50 gait markers (62%) were greater for MCI than HCs when the walking tests changed from SW to CW, and 13 marker costs showed significant differences between the two study groups. Figure 3 shows the changes for different types of gait markers were more significantly affected when the walking test changed from SW to CW among HC and MCI participants (these markers had lower p-values for the cost comparison of MCI versus HCs). The cadence of the MCI group decreased from 68.90±9.70 (steps/minute) to 55.00±11.67 (steps/minute), while it only changed from 68.22±10.55 (steps/minute) to 62.02±9.73 (steps/minute) for HCs (Fig. 3a).
Fig. 3
Effect of changing from straight to curve walking on the performance of MCI and HC participants.
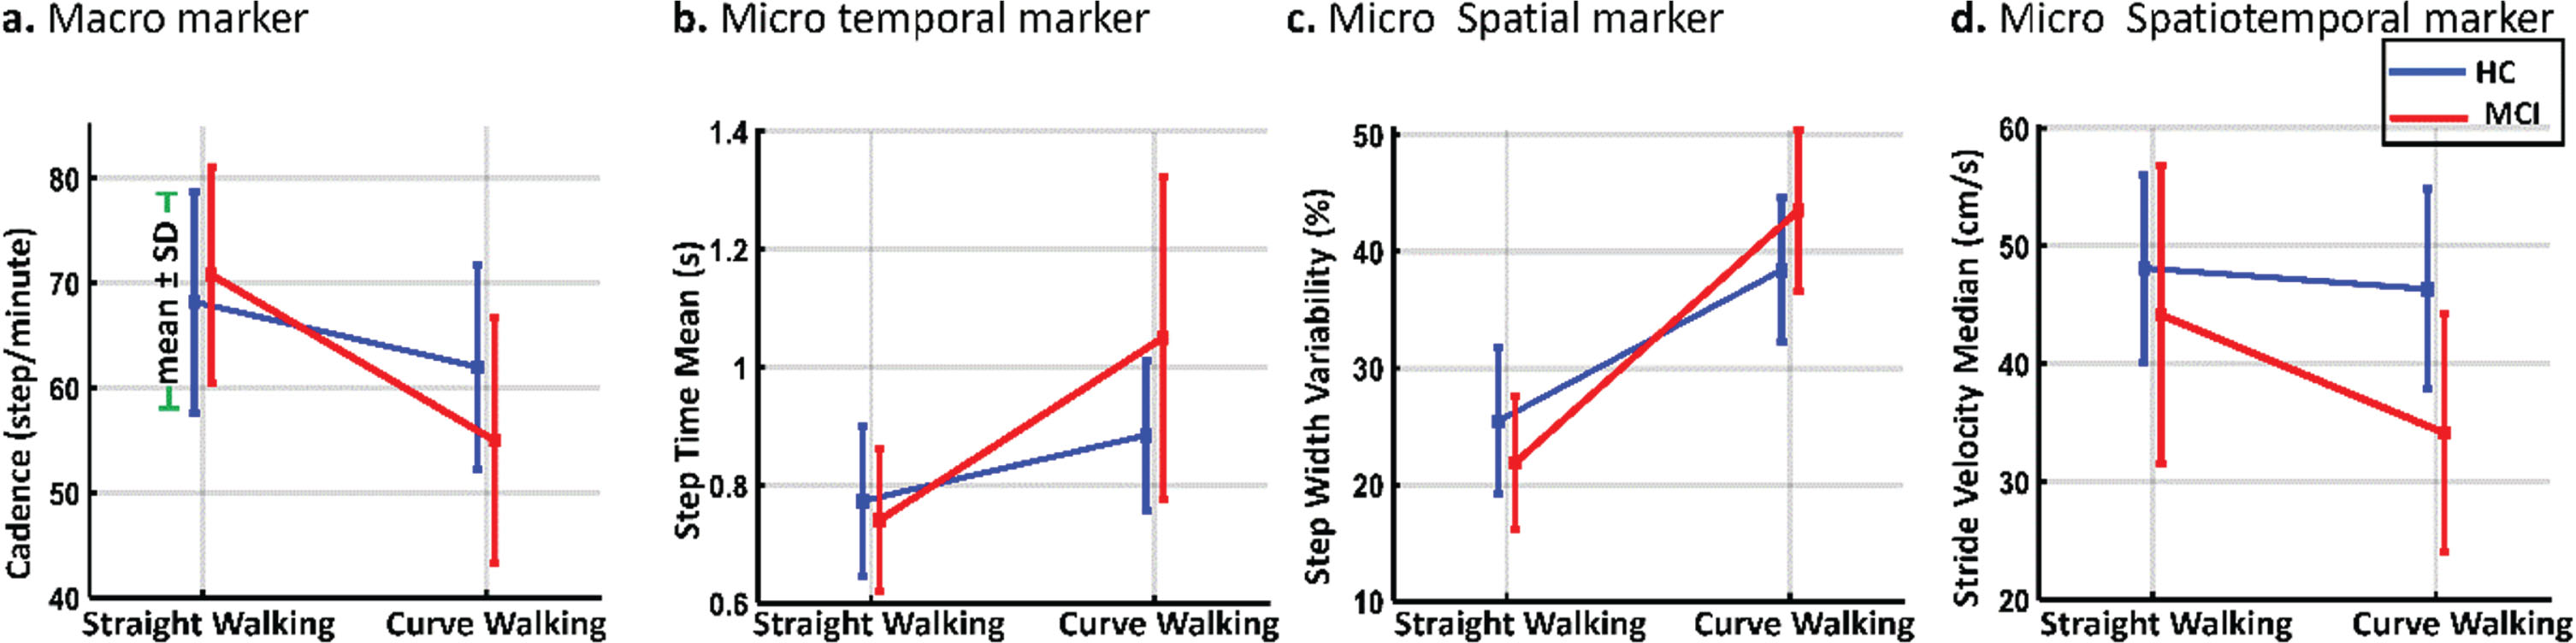
For micro temporal gait markers of step time mean, it increased from 0.78±0.11 (s) to 1.05±0.27 (s) for MCI participants versus 0.77±0.13 (s) to 0.88±0.13 (s) for HCs (Fig. 3b). Also, the micro spatial marker of the step width variability (Fig. 3c) significantly rose among MCIs (from 23.10±11.13% to 67.09±13.87%). The micro spatiotemporal marker of stride velocity median had the highest changes among spatiotemporal markers, costing 22.27%. The stride velocity median decreased from 43.16±12.73 to 34.15±10.06 (cm/s) for MCIs versus 48.13±7.97 to 46.35±8.48 (cm/s) for HCs (Fig. 3d).
The performance of participants was studied for different areas of the oval path, referred to as different sections of curved path walking. Participants’ performance for other gait markers changed in different areas. Figure 4 shows the curve path with eight different areas (A1 to A8 presents the center of each area) beside the mean±SD of two gait markers for MCI and HC subjects. As seen in Fig. 4a, the step velocity of walking was lower among MCI than HCs in most areas, and significant differences were observed between the two study groups.
Fig. 4
Comparison of gait markers between two study groups in various areas of curved path walking. This figure illustrates the comparative analysis of various gait markers between the two study groups across distinct sections of the curved path, labeled as sections A1 through A8. Each section represents a specific segment along the curved trajectory. *Shows the significant difference for p-value <0.05 and ‡shows the significant difference for p-value <0.005.
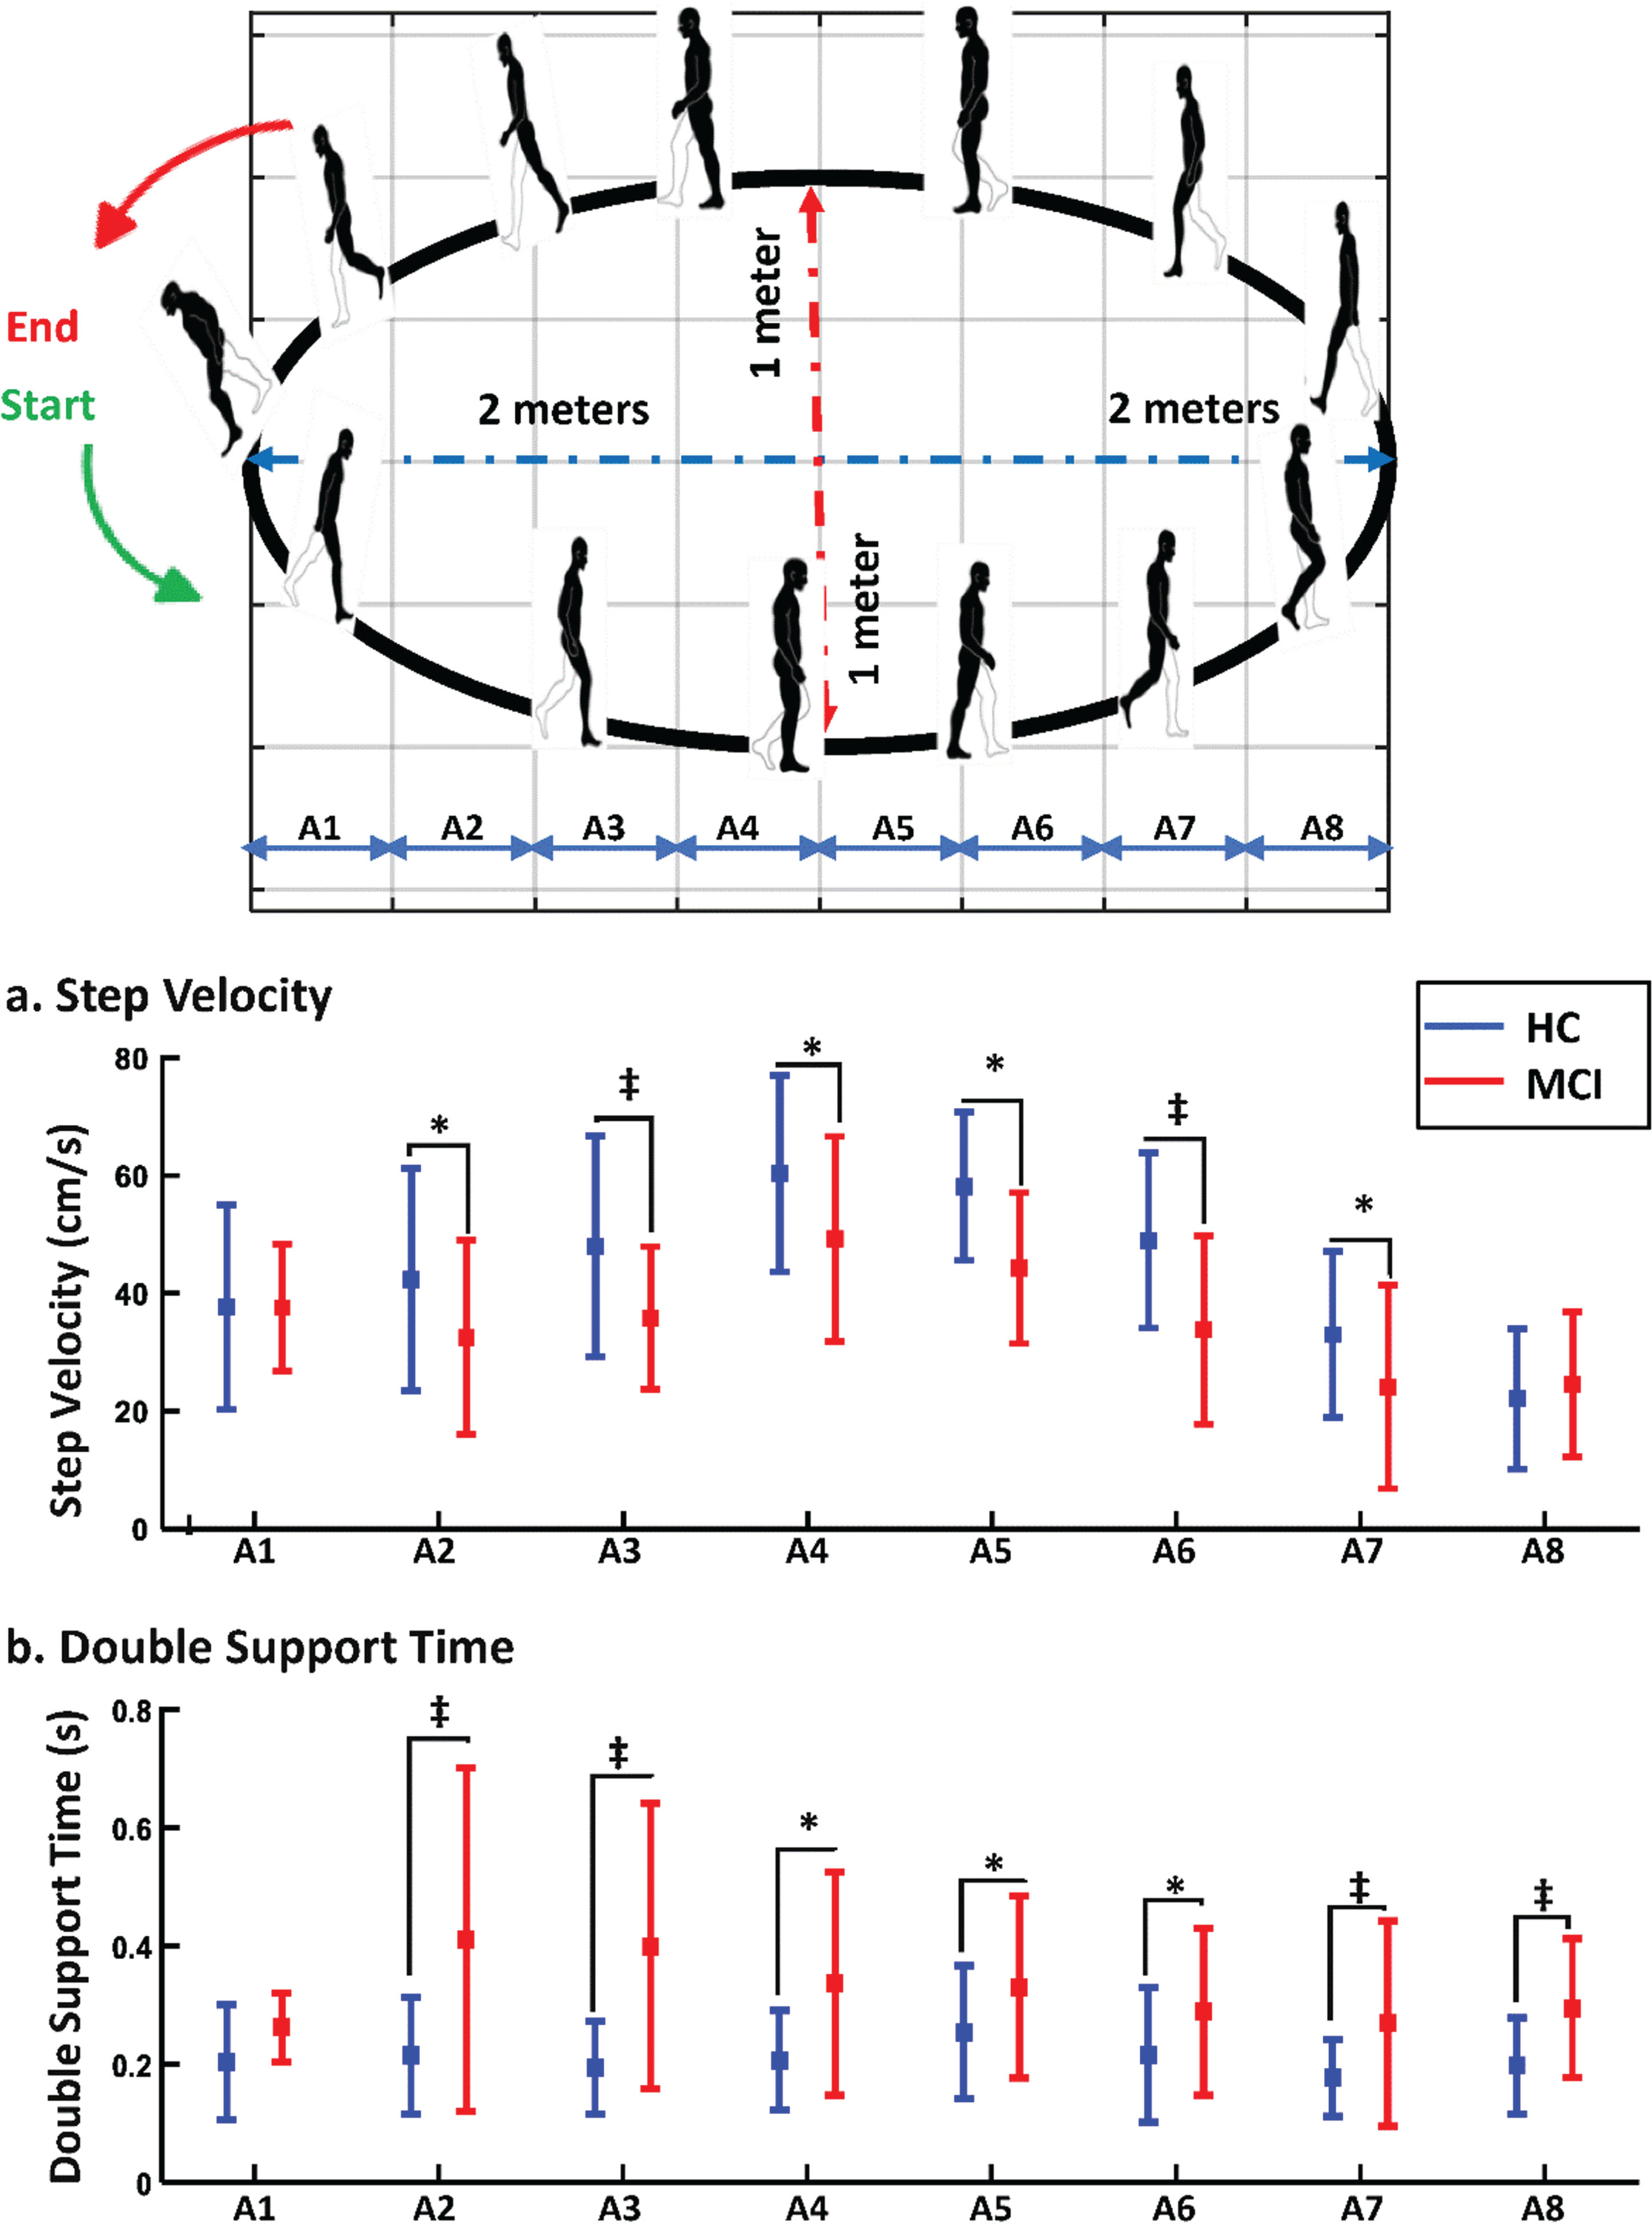
In the A1 and A2 areas, during the starting or ending the walking and turning on the right corner of the path, no significant difference was observed between the two study groups, and both study groups had approximately the same step velocity. In comparison, there were significant differences in step velocity for A2 to A7 areas, and the differences were even much more significant in A3 and A6 areas, where the subjects started to change their walking from a curve pattern to a straight pattern or vice versa. In addition, when HC participants were in the middle of the walking path (A4 to A5), their step velocity increased as the path was approximately straight, and this rise was less among MCIs.
We also examined the double support time as a micro temporal marker of gait that shows the balance of people during walking for various areas of the curve path (Fig. 4b). Older adults with MCI needed more double support time than HCs. The double support time increased among MCIs in different areas significantly, while it changed slightly among HCs in various areas of the curve path. MCI participants spent considerably more time for double support of the gait cycle when they needed to change their walking directions (A2, A3, and A7 areas of the curve path) and during turning on the right corner of the curve path (A8 area of the curve path). During the transition sections A2 and A3, from curved to straight paths, MCI participants demonstrated a wider range of DST values than those in the HC group. This increased variability in the MCI group may be due to factors such as adjusting walking speed for path shape changes, balance maintenance, and decision-making during directional shifts.
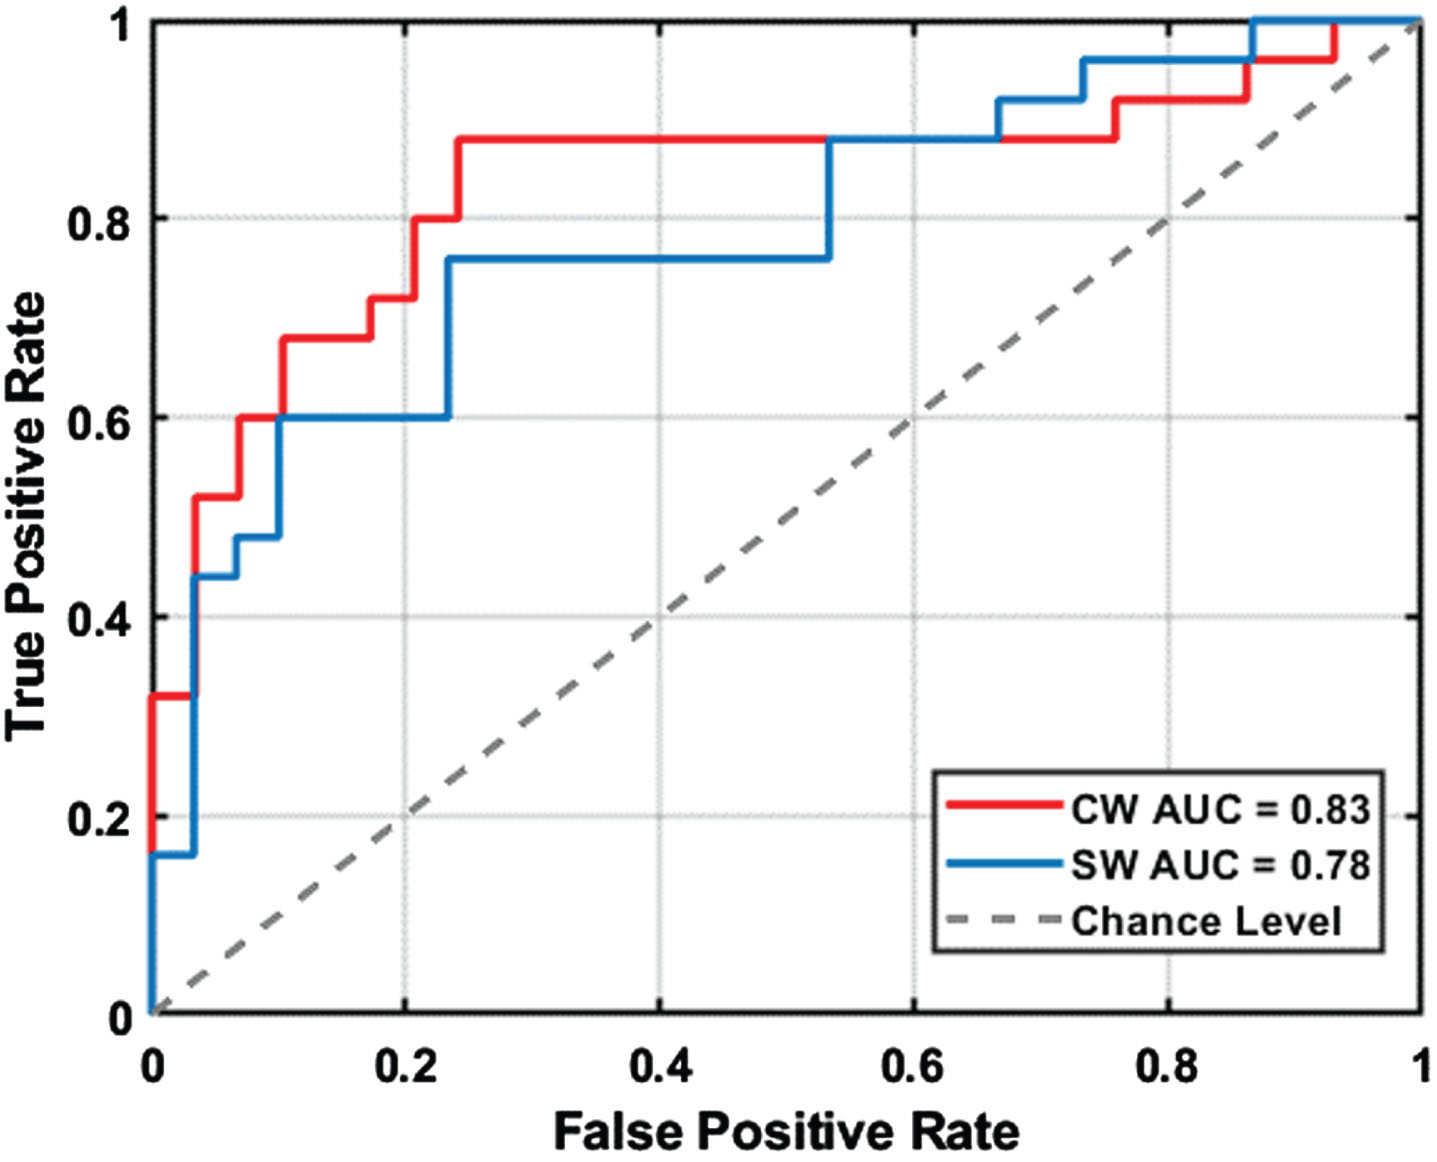
To assess the potential of curved path walking as a diagnostic tool for MCI, we conducted receiver-operating characteristic (ROC) analysis. This analysis utilized significant gait markers to determine their effectiveness in differentiating MCI individuals from the normal elderly population in both curved and straight walking scenarios. Figure 5 displays the ROC curves for MCI detection using these significant gait markers. The results showed that the area under the curve (AUC) for curved path walking (0.83) was significantly higher than for straight path walking (0.78), highlighting curved path walking’s enhanced ability to identify MCI.
Fig. 5
Receiver operating characteristic (ROC) curves comparing the diagnostic performance of curved walking (CW) and straight walking (SW) in discriminating between mild cognitive impairment (MCI) and healthy control (HC) participants. AUC: area under the curve.
DISCUSSION
Detecting MCI is crucial due to its potential association with AD and other forms of dementia [34]. Early identification, particularly in MCI related to AD, offers an opportunity for timely intervention with amyloid-β monoclonal antibodies. Early detection also facilitates lifestyle adjustments, cognitive rehabilitation, and proactive planning, potentially delaying cognitive decline progression and improving the overall quality of life [35]. Swift medical attention is imperative upon observing cognitive changes or MCI symptoms.
Clinical methods for assessing cognitive impairment, like cognitive tests and brain imaging, have limitations in accuracy, cost, and accessibility [36]. Gait analysis emerges as a valuable, non-invasive complement to these evaluations, providing critical insights into the functional abilities of older adults [37]. Commonly used in clinical settings, gait and balance tests typically focus on straight path walking, often incorporating cognitive or motor tasks [13]. Our study, however, ventures into the realm of curved path walking—a more natural yet complex activity that demands trajectory prediction and enhanced postural control [14]. This approach is particularly effective in detecting subtle gait impairments that are often prevalent in the early stages of cognitive decline, such as MCI. We have compared the gait performance of older adults with and without MCI under both straight and curved walking conditions, utilizing the Kinect v.2 camera, an affordable and non-intrusive method for gait signal capture. The study included 55 older adults, 25 with MCI and 30 HC, who performed single-task walking tests on straight and oval paths. The signals from 25 body joints were processed to extract 50 gait markers for each test, and these markers were compared between the two groups using descriptive statistical analyses.
This study revealed that older adults with MCI exhibited reduced walking performance compared to HC. Notably, the differences in gait markers were more pronounced during curved path walking as opposed to straight walking, suggesting a heightened sensitivity of curved path conditions in detecting gait impairments associated with MCI. As illustrated in Fig. 2, the MCI group exhibited a notably lower average velocity and cadence during curve walking, coupled with higher variability across most micro-gait markers. Additionally, this group demonstrated diminished symmetry and regularity in both step and stride lengths for curved walking. Interestingly, certain gait markers, such as average velocity, did not show significant deviations during straight walking. The differential impact of curved walking on the MCI group compared to the HC group is further highlighted by the cost of the gait markers, as depicted in Fig. 3. Specifically, the MCI group faced more challenges during curved walking, necessitating extended double support time in various areas, especially while changing direction. This was accompanied by a reduction in step velocity in these areas, as illustrated by Fig. 4. Supporting our findings, previous clinical research indicates that individuals with MCI, during curve walking, undergo an elevated cognitive load [38, 39]. This heightened cognitive demand results in extended adjustment times for directional changes and balance control [40, 41]. Furthermore, apprehensions regarding potential falls compromised spatial awareness, and intricate motor planning may lead MCI patients to adopt a more cautious approach during curved walking [42, 43]. Taken together, our findings, supported by prior clinical evidence, underscore the heightened sensitivity of gait markers in response to the challenges introduced by curve walking. These markers offer promising potential as early indicators of cognitive impairment.
Our comprehensive literature review found no study directly comparing straight and curved path walking, specifically in older adults with MCI. While some investigations have delved into straight walking among MCI patients or curved walking in conditions like Parkinson’s disease, a direct comparison remains largely unexplored. Our observations of weaker performance in MCI individuals compared to HC align with prior studies [11, 44]. Specifically, we noted no significant deviations between MCI and HC groups during straight walking when assessing macro gait markers such as average velocity and cadence. This corroborates findings from earlier works [45–48]. Intriguingly, curved walking illuminated notable disparities between our study groups, even for these macro gait markers. Further diving into micro gait markers, our data, in conjunction with prior studies [48], revealed distinct changes in components extracted from gait subphases during curved walking, such as swing time, double support time, and step time. These nuances suggest that a comprehensive analysis of curved walking could provide richer insights into MCI detection than a sole emphasis on macro markers or straight walking. Expanding our scope, our results align with research that has evaluated curved walking across diverse groups. Specifically, the challenges of Parkinson’s disease patients became evident when analyzing their straight walking and a 90° left turn [14]. Through gait analysis and motion capture, these patients displayed decreased walking speed, more steps, and reduced head-trunk coordination during turns. These curved walking challenges are believed to stem from the compromised high-level neural systems commonly found in Parkinson’s disease.
This study underscores the potential of curved path walking as a valuable tool for early MCI detection, a crucial step in enhancing patient care and intervention strategies. Despite previous research highlighting dual-task walking’s importance in dementia [49, 50], some studies found no significant difference in MCI detection using dual-task straight walking [51, 52]. Our findings suggest curved path walking may be more sensitive for MCI detection, indicating that integrating cognitive tasks with curved walking could improve diagnostic accuracy. Future research will explore this by comparing dual-task curved walking with single-task variants and other gait assessments like the Timed Up and Go test.
While this study primarily emphasized MCI and HC participants and did not incorporate dual-task walking tests or biomarker verification for MCI diagnoses, it lays the foundational groundwork for expansive research in the domain. Our future endeavors will build on this study’s insights and identified areas for enhancement. Planned developments encompass a standardized protocol for curve walking testing (e.g., defining optimal length, shape, and trial count), probing into the underlying gait impairment mechanisms via concurrent gait-EEG assessments, broadening participant diversity and sample sizes, integrating dual-task walking tests, and harnessing machine learning methodologies. Through these comprehensive approaches, we aim to foster advancements in the field, refine assessment techniques, and deepen the understanding of gait discrepancies in MCI and associated cognitive disorders.
AUTHOR CONTRIBUTIONS
Mahmoud Seifallahi (Data curation; Formal analysis; Investigation; Methodology; Software; Visualization; Writing – original draft); James E Galvin (Conceptualization; Methodology; Supervision; Validation; Writing – review & editing); Behnaz Ghoraani (Conceptualization; Funding acquisition; Investigation; Methodology; Resources; Supervision; Validation; Visualization; Writing – review & editing).
ACKNOWLEDGMENTS
We appreciate the Iran Dementia and Alzheimer’s Association (IDAA) for aiding data collection.
FUNDING
Data analysis was supported by the National Science Foundation, grant number 1942669 (Dr. Behnaz Ghoraani, PI).
CONFLICT OF INTEREST
The authors have no conflict of interest to report.
DATA AVAILABILITY
Data supporting the findings of this study are available from the corresponding author on reasonable request.
SUPPLEMENTARY MATERIAL
[1] The supplementary material is available in the electronic version of this article: https://dx.doi.org/10.3233/ADR-230149.
REFERENCES
[1] | ((2022) ) 2022 Alzheimer’s disease facts and figures. Alzheimers Dement 18: , 700–789. |
[2] | Apostolova LG ((2016) ) Alzheimer disease. Continuum 22: , 419–434. |
[3] | Breijyeh Z , Karaman R ((2020) ) Comprehensive review on Alzheimer’s disease: Causes and treatment. Molecules 25: , 5789–5816. |
[4] | Jan MT , Moshfeghi S , Conniff JW , Jang J , Yang K , Zhai J , Rosselli M , Newman D , Tappen R , Furht B ((2022) ) Methods and tools for monitoring driver’s behavior. 2022 International Conference on Computational Science and Computational Intelligence (CSCI), December 14–16, 2022, Las Vegas, USA, pp. 1269–1273. |
[5] | Mirzaei G , Adeli H ((2022) ) Machine learning techniques for diagnosis of Alzheimer disease, mild cognitive disorder, and other types of dementia. Biomed Signal Process Control 72: , e103293. |
[6] | Knopman DS , Petersen R C ((2014) ) Mild cognitive impairment and mild dementia: A clinical perspective. Mayo Clinic Proc 89: , 1452–1459. |
[7] | Shigemizu D , Akiyama S , Higaki S , Sugimoto T , Sakurai T , Boroevich KA , Sharma A , Tsunoda T , Ochiya T , Niida S , Ozaki K ((2020) ) Prognosis prediction model for conversion from mild cognitive impairment to Alzheimer’s disease created by integrative analysis of multi-omics data. Alzheimers Res Ther 12: , 1–12. |
[8] | Langa KM , Levine DA ((2014) ) The Diagnosis and management of mild cognitive impairment: A clinical review. JAMA 312: , 2551–2561. |
[9] | Ardle RM , Morris R , Wilson J , Galna B , Thomas AJ , Rochester L ((2017) ) What can quantitative gait analysis tell us about dementia and its subtypes? A structured review. J Alzheimers Dis 60: , 1295–1312. |
[10] | Ghoraani B , Boettcher LN , Hssayeni MD , Rosenfeld A , Tolea MI , Galvin JE ((2021) ) Detection of mild cognitive impairment and Alzheimer’s disease using dual-task gait assessments and machine learning. Biomed Signal Process Control 64: , 1–7. |
[11] | Fuentes-Abolafio IJ , Stubbs B , Pérez-Belmonte LM , Bernal-López MR , Gómez-Huelgas R , Cuesta-Vargas A ((2021) ) Functional objective parameters which may discriminate patients with mild cognitive impairment from cognitively healthy individuals: A systematic review and meta-analysis using an instrumented kinematic assessment. Age Ageing 50: , 380–393. |
[12] | Seifallahi M , Mehraban AH , Galvin JE , Ghoraani B ((2022) ) Alzheimer’s disease detection using comprehensive analysis of Timed Up and Go test via Kinect V.2 camera and machine learning. IEEE Trans Neural Syst Rehabil Eng 30: , 1589–1600. |
[13] | Bishnoi A , Hernandez ME ((2021) ) Dual task walking costs in older adults with mild cognitive impairment: A systematic review and meta-analysis. Aging Mental Health 25: , 1618–1629. |
[14] | Crenna P , Carpinella I , Rabuffetti M , Calabrese E , Mazzoleni P , Nemn R , Ferrarin M ((2007) ) The association between impaired turning and normal straight walking in Parkinson’s disease. Gait Posture 26: , pp. 172–178. |
[15] | Lee HS , Shim SR , Kim JH , Mansoo K ((2022) ) Effects of curved path walking compared to straight path walking in older adults with cognitive deficits: A systematic review and network meta-analysis. Physiother Res Int 27: , e1935. |
[16] | Chan WL , Pin TW ((2019) ) Reliability, validity and minimal detectable change of 2-minute walk test, 6-minute walk test and 10-meter walk test in frail older adults with dementia. Exp Gerontol 115: , 9–18. |
[17] | Cheng FY , Chang Y , Cheng SJ , Shaw JS , Lee CY , Chen PH ((2021) ) Do cognitive performance and physical function differ between individuals with motoric cognitive risk syndrome and those with mild cognitive impairment? BMC Geriatr 21: , 1–9. |
[18] | Windham BG , Parker SB , Zhu X , Gabriel KP , Palta P , Sullivan KJ , Parker KG , Knopman DS , Gottesman RF , Griswold ME , Mosley Jr. TH ((2022) ) Endurance and gait speed relationships with mild cognitive impairment and dementia. Alzheimers Dement (Amst) 14: , e12281. |
[19] | Springer S , Seligmann GY ((2016) ) Validity of the Kinect for gait assessment: A focused review. Sensors (Basel) 16: , 1–13. |
[20] | Geerse D , Coolen B , Kolijn D , Roerdink M ((2017) ) Validation of foot placement locations from ankle data of a Kinect v2 Sensor. Sensors (Basel) 17: , e2301. |
[21] | Ma M , Proffitt R , Skubic M ((2018) ) Validation of a Kinect V2 based rehabilitation. PLoS One 13: , 1–15. |
[22] | Seifallahi M , Soltanizadeh H , Mehraban AH , Khamseh F ((2020) ) Alzheimer’s disease detection using skeleton data recorded with Kinect camera. Cluster Comput 23: , 1469–1481. |
[23] | Lelas JL , Merriman GJ , Riley PO , Kerrigan DC ((2003) ) Predicting peak kinematic and kinetic parameters from gait speed. Gait Posture 17: , 106–112. |
[24] | Kwon JW , Son SM , Lee NK ((2015) ) Changes of kinematic parameters of lower extremities with gait speed: A 3D motion analysis study. J Phys Ther Sci 27: , 477–479. |
[25] | Hanlon M , Anderson R ((2006) ) Prediction methods to account for the effect of gait speed on lower limb angular kinematics. Gait Posture 24: , 280–287. |
[26] | De Cock AM , Fransen E , Perkisas S , Verhoeven V , Beauchet O , Vandewoude M , Remmen R ((2019) ) Comprehensive quantitative spatiotemporal gait analysis identifies gait characteristics for early dementia subtyping in community dwelling older adults. Front Neurol 10: , 313. |
[27] | Rucco R , Agosti V , Jacini F , Sorrentino P , Varriale P , De Stefano M , Milan G , Montella P , Sorrentino G ((2017) ) Spatio-temporal and kinematic gait analysis in patients with Frontotemporal dementia and Alzheimer’s disease through 3D motion capture. Gait Posture 52: , 312–317. |
[28] | Ghasemi A , Zahediasl S ((2012) ) Normality tests for statistical analysis: A guide for non-statisticians. Int J Endocrinol Metab 10: , 486–489. |
[29] | Niroumand H , Zain M , Jamil M ((2013) ) Statistical methods for comparison of data sets of construction methods and building evaluation. Procedia Soc Behav Sci 89: , 218–221. |
[30] | McHugh ML ((2013) ) The Chi-square test of independence. Biochem Med (Zagreb) 23: , 143–149. |
[31] | Pourhoseingholi M , Baghestani A , Vahedi M ((2012) ) How to control confounding effects by statistical analysis. Gastroenterol Hepatol Bed Bench 5: , 79–83. |
[32] | Zhou H , Park C , Shahbazi M , York , M K , Kunik ME , Naik AD , Najafi B ((2022) ) Digital biomarkers of cognitive frailty: The value of detailed gait assessment beyond gait speed. Gerontology 68: , 224–233. |
[33] | Zancan A , Sozzi S , Schieppati M ((2021) ) Basic spatiotemporal gait variables of young and older healthy volunteers walking along a novel figure-of-8 path. Front Neurol 12: , 698160. |
[34] | Petersen RC ((2004) ) Mild cognitive impairment as a diagnostic entity. J Intern Med 256: , 183–194. |
[35] | Chen W , Wang H ((2013) ) Mild cognitive impairment: A concept useful for early detection and intervention of dementia. Shanghai Arch Psychiatry 25: , 119–120. |
[36] | Alberdi A , Aztiria A , Basarab A ((2016) ) On the early diagnosis of Alzheimer’s disease from multimodal signals: A survey. Artif Intell Med 71: , 1–29. |
[37] | Montero-Odasso M , Verghese J , Beauchet O , Hausdorff JM ((2012) ) Gait and cognition: A complementary approach to understanding brain function and the risk of falling. J Am Geriatr Soc 60: , 2127–2136. |
[38] | Lowry KA , Brach JS , Nebes RD , Studenski SA , VanSwearingen JM ((2021) ) Contributions of cognitive function to straight- and curved-path walking in older adults. Arch Phys Med Rehabil 93: , 802–807. |
[39] | Possin KL ((2010) ) Visual spatial cognition in neurodegenerative disease. Neurocase 16: , 466–487. |
[40] | Herman T , Giladi N , Gurevich T , Hausdorff JM ((2005) ) Gait instability and fractal dynamics of older adults with a “cautious” gait: Why do certain older adults walk fearfully? Gait Posture 21: , 178–185. |
[41] | Tosserams A , Wit L , Sturkenboom IH , Nijkrake MJ , Bloem BR , Nonnekes J ((2021) ) Perception and use of compensation strategies for gait impairment by persons with Parkinson disease. Neurology 97: , 1404–1412. |
[42] | Godi M , Giardini M , Schieppati M ((2019) ) Walking along curved trajectories. Changes with age and Parkinson’s disease. Hints to rehabilitation. Front Neurol 10: , 1–11. |
[43] | Odonko CA , Thomas JC , Holt N , Latham N , Swearingen JV , Brach JS , Leveille SG , Jette A , Bean J ((2013) ) A Comparison of straight- and curved-path walking tests among mobility-limited older adults. J Gerontol A Biol Sci Med Sci 68: , 1532–1539. |
[44] | Montero-Odasso M , Sarquis-Adamson Y , Kamkar N , Pieruccini-Faria F , Bray N , Cullen S , Mahon J , Titus J , Camicioli R , Borrie MJ , Bherer L , Speechley M ((2020) ) Dual-task gait speed assessments with an electronic walkway and a stopwatch in older adults. A reliability study. Exp Gerontol 142: , 1–7. |
[45] | Gillain S , Warzee E , Lekeu F , Wojtasik V , Maquet D , Croisier JL , Salmon E , Petermans J ((2009) ) The value of instrumental gait analysis in elderly healthy, MCI or Alzheimer’s disease subjects and a comparison with other clinical tests used in single and dual-task conditions. Ann Phys Rehabil Med 52: , 453–474. |
[46] | Muir SW , Speechle M , Wells J , Borrie M , Gopaul K , Montero-Odasso M ((2012) ) Gait assessment in mild cognitive impairment and Alzheimer’s disease: The effect of dual-task challenges across the cognitive spectrum. Gait Posture 35: , 96–100. |
[47] | Beauchet O , Allali G , Launay C , Herrmann FR , Annweiler C ((2013) ) Gait variability at fast-pace walking speed: A biomarker of mild cognitive impairment? J Nutr Health Aging 17: , 235–239. |
[48] | Lindh-Rengifo M , Jonasson SB , Ullén S , Stomrud E , Palmqvist S , Mattsson-Carlgren N , Hansson O , Nilsson MH ((2022) ) Components of gait in people with and without mild cognitive impairment. Gait Posture 93: , 83–89. |
[49] | Oh C ((2021) ) Single-task or dual-task? gait assessment as a potential diagnostic tool for Alzheimer’s dementia. J Alzheimers Dis 84: , 1183–1192. |
[50] | Salazar RD , Ren X , Ellis TD , Toraif N , Barthelemy OJ , Neargarder S , Cronin-Golomb A ((2017) ) Dual tasking in Parkinson’s disease: Cognitive consequences while walking. Neuropsychology 31: , 613–623. |
[51] | Bovonsunthonchai S , Vachalathiti R , Hiengkaew V , Bryant MS , Richards J , Senanarong V ((2022) ) Quantitative gait analysis in mild cognitive impairment, dementia, and cognitively intact individuals: A cross-sectional case–control study. BMC Geriatr 22: , 767. |
[52] | Nascimbeni A , Caruso S , Salatino A , Carenza M , Rigano M , Raviolo A , Ricci R ((2015) ) Dual task-related gait changes in patients with mild cognitive impairment. Funct Neurol 30: , 59–65. |


