
Factors Influencing Change in Brain-Predicted Age Difference in a Cohort of Healthy Older Individuals
Abstract
Background:
There is considerable variability in the rate at which we age biologically, and the brain is particularly susceptible to the effects of aging.
Objective:
We examined the test-retest reliability of brain age at one- and three-year intervals and identified characteristics that predict the longitudinal change in brain-predicted age difference (brain-PAD, defined by deviations of brain age from chronological age).
Methods:
T1-weighted magnetic resonance images were acquired at three timepoints from 497 community-dwelling adults (73.8±3.5 years at baseline, 48% were female). Brain age was estimated from whole brain volume, using a publicly available algorithm trained on an independent dataset. Linear mixed models were used, adjusting for sex, age, and age2.
Results:
Excellent retest reliability of brain age was observed over one and three years. We identified a significant sex difference in brain-PAD, where a faster rate of brain aging (worsening in brain age relative to chronological age) was observed in men, and this finding replicated in secondary analyses. The effect size, however, was relatively weak, equivalent to 0.16 years difference per year. A higher score in physical health related quality of life and verbal fluency were associated with a faster rate of brain aging, while depression was linked to a slower rate of brain aging, but these findings were not robust.
Conclusion:
Our study provides consistent evidence that older men have slightly faster brain atrophy than women. Given the sparsity of longitudinal research on brain age in older populations, future prospective studies are needed to confirm our findings.
INTRODUCTION
Aging is an inevitable biological process, characterized by the gradual accumulation of cellular and tissue damage, and subsequent attenuation of sensory, motor, and cognitive functions [1, 2]. The brain is particularly susceptible to the effects of aging, undergoing many structural and functional changes over the lifespan. Progressive age-related brain atrophy (i.e., loss of brain tissue volume) [3] has been associated with a decline in cognitive performance [4] and a greater risk of neurodegenerative disorders [5]. There is, however, considerable interindividual variability in the rate of brain aging and disease risk, which is influenced by genetic and environmental factors [6]. As such, some individuals will remain relatively healthy in later life, while others will experience a severe decline in cognitive function, independence, and quality of life.
Interindividual differences in the progression of biological brain changes can be investigated through the construct of ‘brain age’. Brain age is a neuro-imaging-based biomarker created for its correlation with chronological age. An older brain age relative to chronological age is considered a sign of advanced brain aging (i.e., greater age-related changes, including the loss of brain tissue volume), and has been linked to poor health [7] and cognitive decline [8]. A number of structural brain age models have been developed and examined in community-dwelling older populations [9–11]. This includes the algorithm developed by Cole and colleagues [6] that uses voxel-level analyses of grey and white matter volume, and cerebrospinal fluid to provide a single estimate of brain age, taken from across the whole brain. The difference between chronological and brain age is referred to as brain-PAD (the brain-predicted age difference). We have found a brain-PAD representing an older brain age relative to chronological age is associated with a lower cognitive performance [12], and others have shown brain-PAD to predict dementia and mortality risk [6, 13].
A growing body of evidence supports the contributing role of sociodemographic, physical, and psychological health and wellbeing in interindividual differences in brain structure. For example, a weaker grip strength in midlife have been linked to a smaller whole brain volume in later life (aged 69–71 years) [14], while greater brain atrophy has been identified in people with depression or poor metabolic health [15, 16]. The protective effect of a higher educational attainment on brain volume has also been identified in older individuals cross-sectionally [17, 18] and may be an initial advantage that carries into later life [18, 19]. Brain age studies report similar patterns of association in the general population, through which an older brain age relative to chronological age was found to be cross-sectionally associated with poor grip strength and cardiometabolic health [6, 20, 21]. Some cross-sectional studies have linked depression to advanced brain aging, though there remain inconsistencies among studies that primarily relate to symptomatic patient populations [22–24]. Single estimates of brain age have been found to be higher in women than men [25–28], though the findings are somewhat inconsistent. Conversely, cross-sectional studies link a younger brain age relative to chronological age to meditation [29], musical attainment [30], more years of formal education, and physical activity [31].
An important consideration for improving later-life health, and resilience to age is to determine whether these sociodemographic, physical, and psychological factors can change brain-PAD over time (e.g., could a stronger grip strength delay the process of brain aging over time). While some have investigated brain age longitudinally, most such studies relate to early life factors [32–34] or involve small samples of young adults [35–38], or patient populations [39–41]. For this reason, there is a need for longitudinal studies that measure brain age at multiple timepoints, and which investigate the influence of a range of factors on the change in brain-PAD in older community dwelling adults. The aim of this study was firstly to assess the test-retest reliability of brain age estimation using serial magnetic resonance images (MRIs) collected over a three-year period in older community dwelling adults. Secondly, we sought to determine whether baseline factors relating to sociodemographic, health, mood, quality of life, and physical and cognitive function are associated with the change in brain-PAD in older community dwelling adults.
MATERIALS AND METHODS
Study design
This study utilized neuroimaging data from ASPREE-NEURO (NEURO) [42], a sub-study of the ASPirin in Reducing Events in the Elderly (ASPREE) clinical trial [43]. ASPREE is a double-blind, randomized, placebo-control trial aimed to determine whether daily treatment of low dose aspirin (100 mg) could extend disability free life in older adults from Australia and the US [43]. Full eligibility criteria for ASPREE have been published elsewhere [43]. In brief, Australian participants were eligible if aged 70 years and over at study entry; were without major cognitive impairments (i.e., none reported a diagnosis of dementia, or had a Modified-Mini-Mental State (3MS) examination score≤77) [44]. They were free of any previous cardiovascular event, including atrial fibrillation, and were not taking antithrombotic therapy; they were also devoid of any serious illness that was a high risk of major bleeding or was likely to cause death within 5 years of randomization [43].
NEURO recruited 572 ASPREE participants residing in Melbourne and nearby regional Victoria, of whom 497 completed a baseline MRI scan and one or more follow-up scans, and comprise our study sample. Of these participants, 430 completed a brain scan at each timepoint, while the remaining 67 attended scanning at baseline and the one- (n = 57) or three-year follow-up (n = 10). Fifty-two NEURO participants were excluded as they had only attended scanning at baseline (n = 34), year one (n = 8), year three (n = 3), or both the one- and three-year follow-up (n = 7). A further 23 individuals were excluded as they had no estimate of brain age at any timepoint. Relative to the included sample, the excluded group had a lower mean score on cognitive tasks assessing psychomotor speed, and episodic memory (Table 1). Although these individuals were comparable in chronological age and sex, a greater proportion were obese, and had a slow gait speed, depression, diabetes, or hypertension (Table 1).
Table 1
Baseline participant characteristics for included (n = 497) and excluded study participants (n = 75)
| Characteristics | aIncluded | bExcluded | p |
| Chronological age (y), median (IQR) | 72.4 (71.2–75.3) | 72.9 (71.3–76.6) | 0.22 |
| Female, n (%) | 238 (47.9) | 46 (61.3) | 0.14 |
| Race, n (%): | |||
| White | 484 (97.6) | 72 (96.0) | 0.43 |
| Other | 12 (2.4) | 3 (4.0) | |
| Low education (< 12 y), n (%) | 188 (37.8) | 35 (46.7) | 0.14 |
| SES (< median percentile), n (%) | 236 (47.5) | 39 (52.0) | 0.47 |
| 3MS, median (IQR) | 95.0 (92.0–97.0) | 94.0 (92.0–96.0) | 0.07 |
| COWAT, mean (SD) | 12.4 (4.5) | 12.1 (4.6) | 0.62 |
| SDMT, mean (SD) | 39.5 (8.8) | 34.9 (8.5) | < 0.0001 |
| HVLT-R, delayed recall, median (IQR) | 8.0 (6.0–10.0) | 8.0 (5.0–9.0) | 0.02 |
| Depression, n (%) | 46 (9.3) | 14 (18.7) | 0.01 |
| Physical HRQoL, median (IQR) | 51.3 (44.4–55.1) | 48.6 (41.8–53.5) | 0.05 |
| Mental HRQoL, median (IQR) | 57.2 (52.8–60.1) | 56.3 (50.2–60.2) | 0.30 |
| Body mass index (kg/m2), n (%): | |||
| < 24 | 136 (27.5) | 13 (17.3) | < 0.0001 |
| 25–29 | 228 (46.2) | 21 (28.0) | |
| 30+ | 130 (26.3) | 41 (54.7) | |
| Weak grip strength, n (%) | 91 (18.5) | 20 (27.0) | 0.08 |
| Slow gait speed (3m/s), n (%) | 89 (18.0) | 23 (30.7) | 0.01 |
| Pre-frail/Frail, n (%) | 142 (28.6) | 27 (36.0) | 0.19 |
| Diabetes, n (%) | 54 (10.9) | 18 (24.0) | 0.001 |
| Dyslipidaemia, n (%) | 285 (57.3) | 52 (69.3) | 0.05 |
| Hypertensive, n (%) | 344 (69.2) | 62 (82.7) | 0.02 |
| Aspirin treatment, n (%) | 249 (50.1) | 37 (49.3) | 0.90 |
aNumber of total participants who are missing from race (n = 1), SDMT (n = 2), HVLT-R (n = 1), body mass index (n = 3), weak grip strength(n = 4), and slow gait speed (n = 3). bNumber of total participants who are missing from SDMT (n = 1) and weak grip strength (n = 1). COWAT, Controlled Oral Word Association Test; HRQoL, Health-related quality of life; HVLT-R, Hopkins Verbal Learning Test-Revised, delayed memory recall; SDMT, Symbol-Digit Modalities Test; SES, socioeconomic status; 3MS, Modified-Mini-Mental State examination.
For scanning purposes, participants were free of contraindications to MRI, including foreign bodies and metallic or electronic implants unsafe at 3T, and claustrophobia [42]. All participants provided written informed consent to both ASPREE and NEURO, and study procedures were conducted in accordance with institutional guidelines. ASPREE is registered with the International Standard Randomized Controlled Trial Number Register (ISRCTN83772183) and Clinicaltrials.gov (NCT01038583). NEURO is registered with the Australian and New Zealand Clinical Trial Registry (ACTRN12613001313729). The current study was approved by the Monash University Human Research and Ethics Committee (Project ID: 29311).
Baseline participant characteristics
Participants completed a number of questionnaires and assessments at baseline, and those relevant to the current study are detailed below [45]. Socioeconomic status (SES) was derived using the Index of Relative Socio-Economic Advantage and Disadvantage percentile score (SEIFA) [46] and divided into binary groups using a median split. For the purpose of this analysis, education status was defined as less than 12 years of education (i.e., did not complete all years of secondary education in Australia), or 12 or more years of education (i.e., completed secondary or higher years of education in Australia) [47].
Participants having diabetes mellitus were those receiving treatment for diabetes, or who had a fasting blood glucose of at least 126 mg per deciliter (≥7 mmol per liter), or who provided a self-reported diagnosis. Dyslipidemia was defined by the participant being prescribed cholesterol lowering medication; having serum cholesterol levels of at least 212 mg per deciliter (≥5.5 mmol per liter), or a low density lipoprotein (LDL) level of more than 160 mg per deciliter (≥4.1 mmol per liter). Hypertension was defined by a systolic and/or diastolic blood pressure (BP) more than 140/90 at trial entry, or by participants who had previously received advice that treatment for hypertension was appropriate [45].
Physical function was assessed using measures of grip strength and gait speed. These were quantified as the average of three trials of grip strength, using the dominant hand, and mean time to complete a 3-meter walk (in seconds), respectively [45]. Weak grip strength was defined as the lowest quintile after adjusting for sex and weight. Slow gait speed was defined as the lowest quintile after adjusting for sex and height.
Frailty was defined using modified Fried Frailty criteria, which includes having a low body mass index (< 20 kg/m2); weak grip strength and slow gait speed (as described above); self-reported exhaustion using questions from the Center for Epidemiologic Studies Depression (CES-D) scale [48], and low physical activity (i.e., defined using self-reports of no walking outside the home, or walking for less than 10 minutes without rest in the past two weeks) [49]. Participants were categorized as ‘prefrail’ and ‘frail’ if they satisfied 1–2 or 3 + criteria, respectively [49]. For our analysis we combined prefrail and frail participants as there were only three people identified as frail. Depressive symptoms were defined as a score of≥8 on the CES-D, which identifies people with more severe depressive symptoms than participants scoring < 8 [48]. Summary measures of physical and mental health-related quality of life (HRQoL) were derived from items from the Short-Form-12 (SF-12) [50], as described previously [51]. A higher score in either measure represents better well-being.
Cognitive function was measured using a battery of tests that assessed phonological verbal fluency (Controlled Oral Word Association Test [COWAT], using the single letter ‘F’) [52], psychomotor speed (Symbol-Digit Modalities Test [SDMT]) [53], delayed verbal memory recall (Hopkins Verbal Learning Test-Revised [HVLT-R]) [54], and global cognition (3MS) [44]. A lower test score indicates a poorer cognitive performance for each of these measures except for SDMT, on which a higher score indicates a faster performance.
Neuroimaging data collection and quality control
Structural MRI data was acquired at three timepoints: baseline and the one- and three-year follow-ups (a median duration of 14 [IQR = 11–20], 355 [IQR = 349–381], and 1,085 [IQR = 1,071–1,106] days after the assessment of participant baseline characteristics), using a 3 Tesla Siemens Skyra MR scanner (Siemens Erlangen, German) with a 32-channel head and neck coil, located at Monash Biomedical Imaging in Melbourne Australia. High resolution 3D magnetization prepared rapid gradient-echo (MPRAGE) images were acquired in the sagittal orientation, with 1mm isotropic resolution (192 slices, FOV = 256×240 mm2, TR = 2300 ms, TE = 2.07 ms, TI = 900, flip angle = 9°).
Image quality was assessed using the MRI Quality Control toolbox (MRIQC) [55]. An empirical criterion was used to identify outliers (> 1.5 inter-quartile range) on one or more metrics of image quality, followed by a visual inspection by three study investigators (JW, PW, IHH), as previously described [12]. A total of 26 images at baseline; 13 at year one, and 21 at year three received a poor image quality rating and were excluded from this study.
Brain age prediction
Estimates of brain age were derived from raw T1-weighted MR images using Cole and colleague’s software (https://github.com/james-cole/brainageR) [6]. All images were pre-processed using the Statistical Parametric Mapping (SPM12) toolbox (Univer-sity College London, London, UK). This includes segmentation into grey matter, white matter, and cerebrospinal fluid, followed by normalization to the Montreal Neurological Institute (MNI) space using a non-linear (DARTEL) registration [56]. Tissue volume at each voxel was retained through scaling of the normalized tissue maps by the Jacobian determinant of the deformation [57]. Images were resampled to a voxel size of 1.5 mm and smoothed using a Gaussian spatial smoothing kernel of 4 mm at full-width-half-maximum [56].
Normalized tissue maps were combined and divided into 435 principal components previously identified for a training cohort of 3,377 healthy adults (aged 18–92 years), sourced from seven publicly available datasets that cover a range of geographical locations (including Australia, the US, and UK), scanner strengths and data acquisitions (refer to https://github.com/james-cole/brainageR for further details). Components covering 80% of the total variance of chronological age were input into a Gaussian process algorithm, and the resulting rotation matrix used to predict brain age for the NEURO participants. Brain-PAD was defined as the difference between brain age and chronological age. A positive value (i.e., older brain age relative to one’s chronological age) is considered a sign of accelerated brain aging; while negative values (i.e., younger brain age relative to chronological age) reflect decelerated brain aging.
Statistical analysis
The mean (standard deviation [SD]) are reported for continuous data, or as the median (interquartile range [IQR]) if the distribution was skewed. Categorical data is summarized by the frequency and percentage. Intraclass correlation coefficients (ICC) were employed to assess the reliability of brain age and brain-PAD over the one- and three-year follow-up. ICCs and their respective 95% confidence intervals were calculated based on a single-rating, consistent-agreement, using a two-way mixed effects model [58]. Reliability was interpreted as poor (< 0.5), moderate (0.5–0.75), good (0.75–0.9), and excellent (> 0.9) [59]. Minimal detectable change (MDC), representing the least amount of change necessary to exceed measurement noise [60], was calculated using the following formula: 1.96 * SEM *
Linear mixed modelling was used to investigate the association between baseline participant characteristics (‘exposures’) and the baseline, and rate of change in brain-PAD (‘outcome’). Models included fixed effects of time (i.e., annual visits of 0 [baseline], 1 and 3 years, treated as a continuous variable) and exposures, along with the interaction between time and exposures, and a random intercept and slope. To account for potential age bias and sex, multivariable models were adjusted for age, age2, and sex [37]. A polynomial for age was included given prior knowledge regarding brain-PAD and age bias [63], and its contribution to our model variance in baseline random effects. Results are reported using unstandardized coefficients of the baseline intercept, and interaction, alongside their respective confidence intervals.
Given that the availability of only three repeated measures may limit the reliability of estimates from a linear mixed model, we conducted additional analyses to assess the robustness of our main findings [64]. This involved classifying participants by the overall pattern of change in brain-PAD over three years, which we defined as ‘accelerate’, ‘decelerate’, and ‘stable’, and was dependent on the change in brain-PAD increasing (i.e., a numerically positive change that represents greater brain atrophy), or decreasing (i.e., a negative change indicating preserved brain aging) by two or more years, or had otherwise remained relatively stable (irrespective of direction, change in brain-PAD was less than two years) over the three year follow-up. Multinomial logistic regression models were used to determine which baseline exposures predicted the likelihood of being in one of these groups, with the stable group treated as the reference for all models. The change in brain-PAD of two years was chosen to define groups as this exceeds our cohorts mean change of 0.47 years over the three-year follow-up, therefore attenuating the likelihood of selecting participants by measurement noise alone. All analyses were performed using Stata software, release 16 (Statacorp, TX).
RESULTS
Study participants
The median chronological age of participants at baseline was 72 years, more than half had more than 12 years of formal education, and 48% were female. Although they were recruited as a relatively healthy cohort without major illness at baseline, participants had a range of chronic conditions including obesity, hypertension, diabetes and depression (Table 1).
Reliability of brain age and the brain-predicted age difference
The mean brain age at baseline, year one and three are summarized in Fig. 1. Mean baseline brain age was very similar to the mean chronological age, collected at the time of scanning (72.2 versus 73.8 years). The mean change in brain age from baseline to year 1 was 1.4 years (n = 487, 95% CI = 1.19, 1.56, p < 0.0001) and from baseline to year 3 was 3.4 years (n = 440, 95% CI = 3.17, 3.64, p < 0.0001). This was similar to the mean one- and three-year chronological age of 74.8 and 76.7 years, collected a median of 0.9 (IQR = 0.92–0.99), and 2.9 (IQR = 2.90–2.97) years after the baseline scan, respectively. Excellent test-retest reliability for brain age was found for both timepoints (Fig. 2). Chronological age was significantly correlated with brain age at baseline (rho = 0.44), indicating moderate accuracy of prediction, which remained at the one (rho = 0.42) and three-year (rho = 0.43, all p < 0.0001) follow-ups. This is further supported by a MAE of 4.97 years at baseline and was relatively consistent at each follow-up (one-year = 4.84 years; three-year = 4.74 years).
Fig. 1
Dot plots presenting the mean and standard deviation of brain age (a) and brain-PAD (b) measured at baseline, year one and three. Orange line represents the mean; red and green lines define the standard deviation.
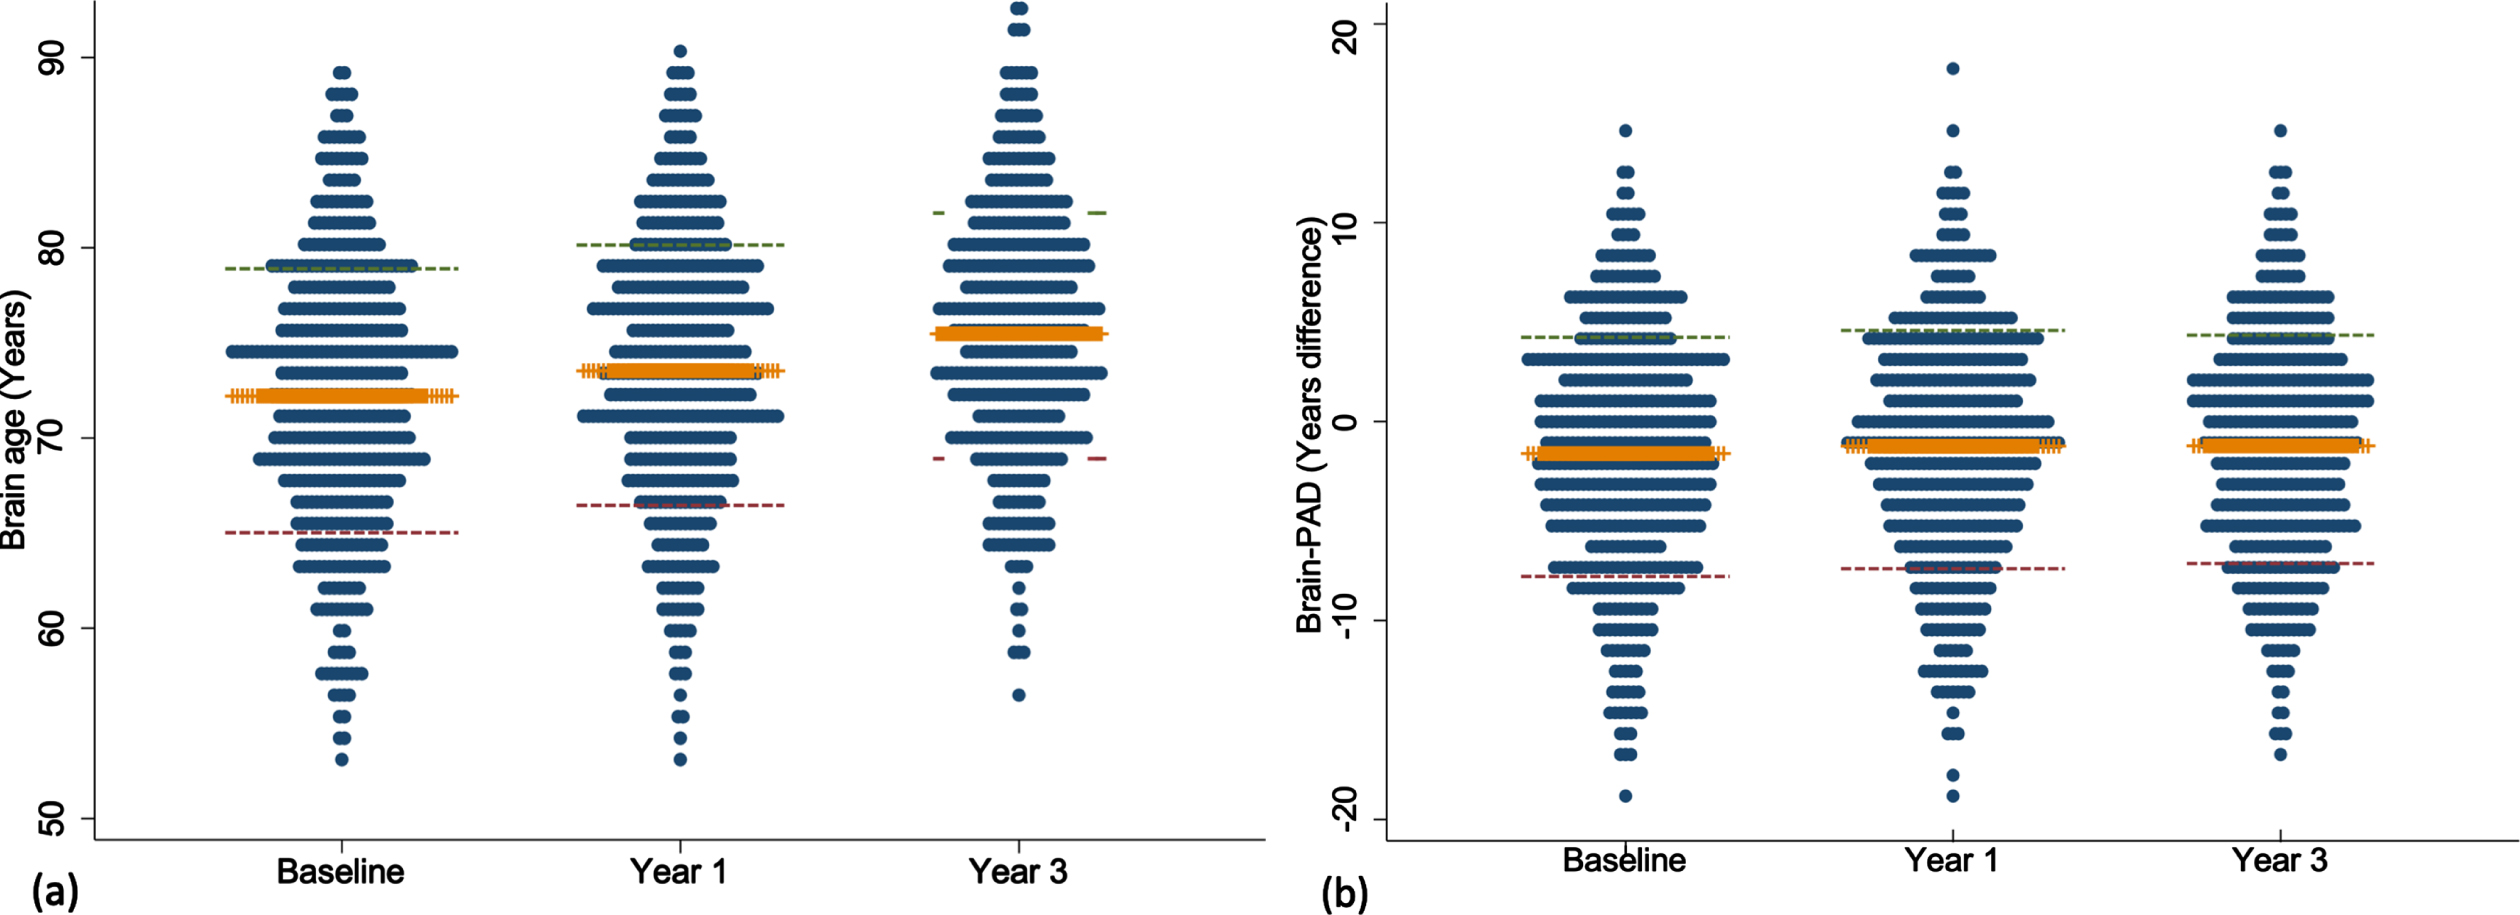
Fig. 2
Scatter and Bland-Altman plots showing test-retest reliability of brain age over 1 (a, b) and 3 years (c, d). The limits of agreement are represented by values above and below the dotted red line (images b, d).
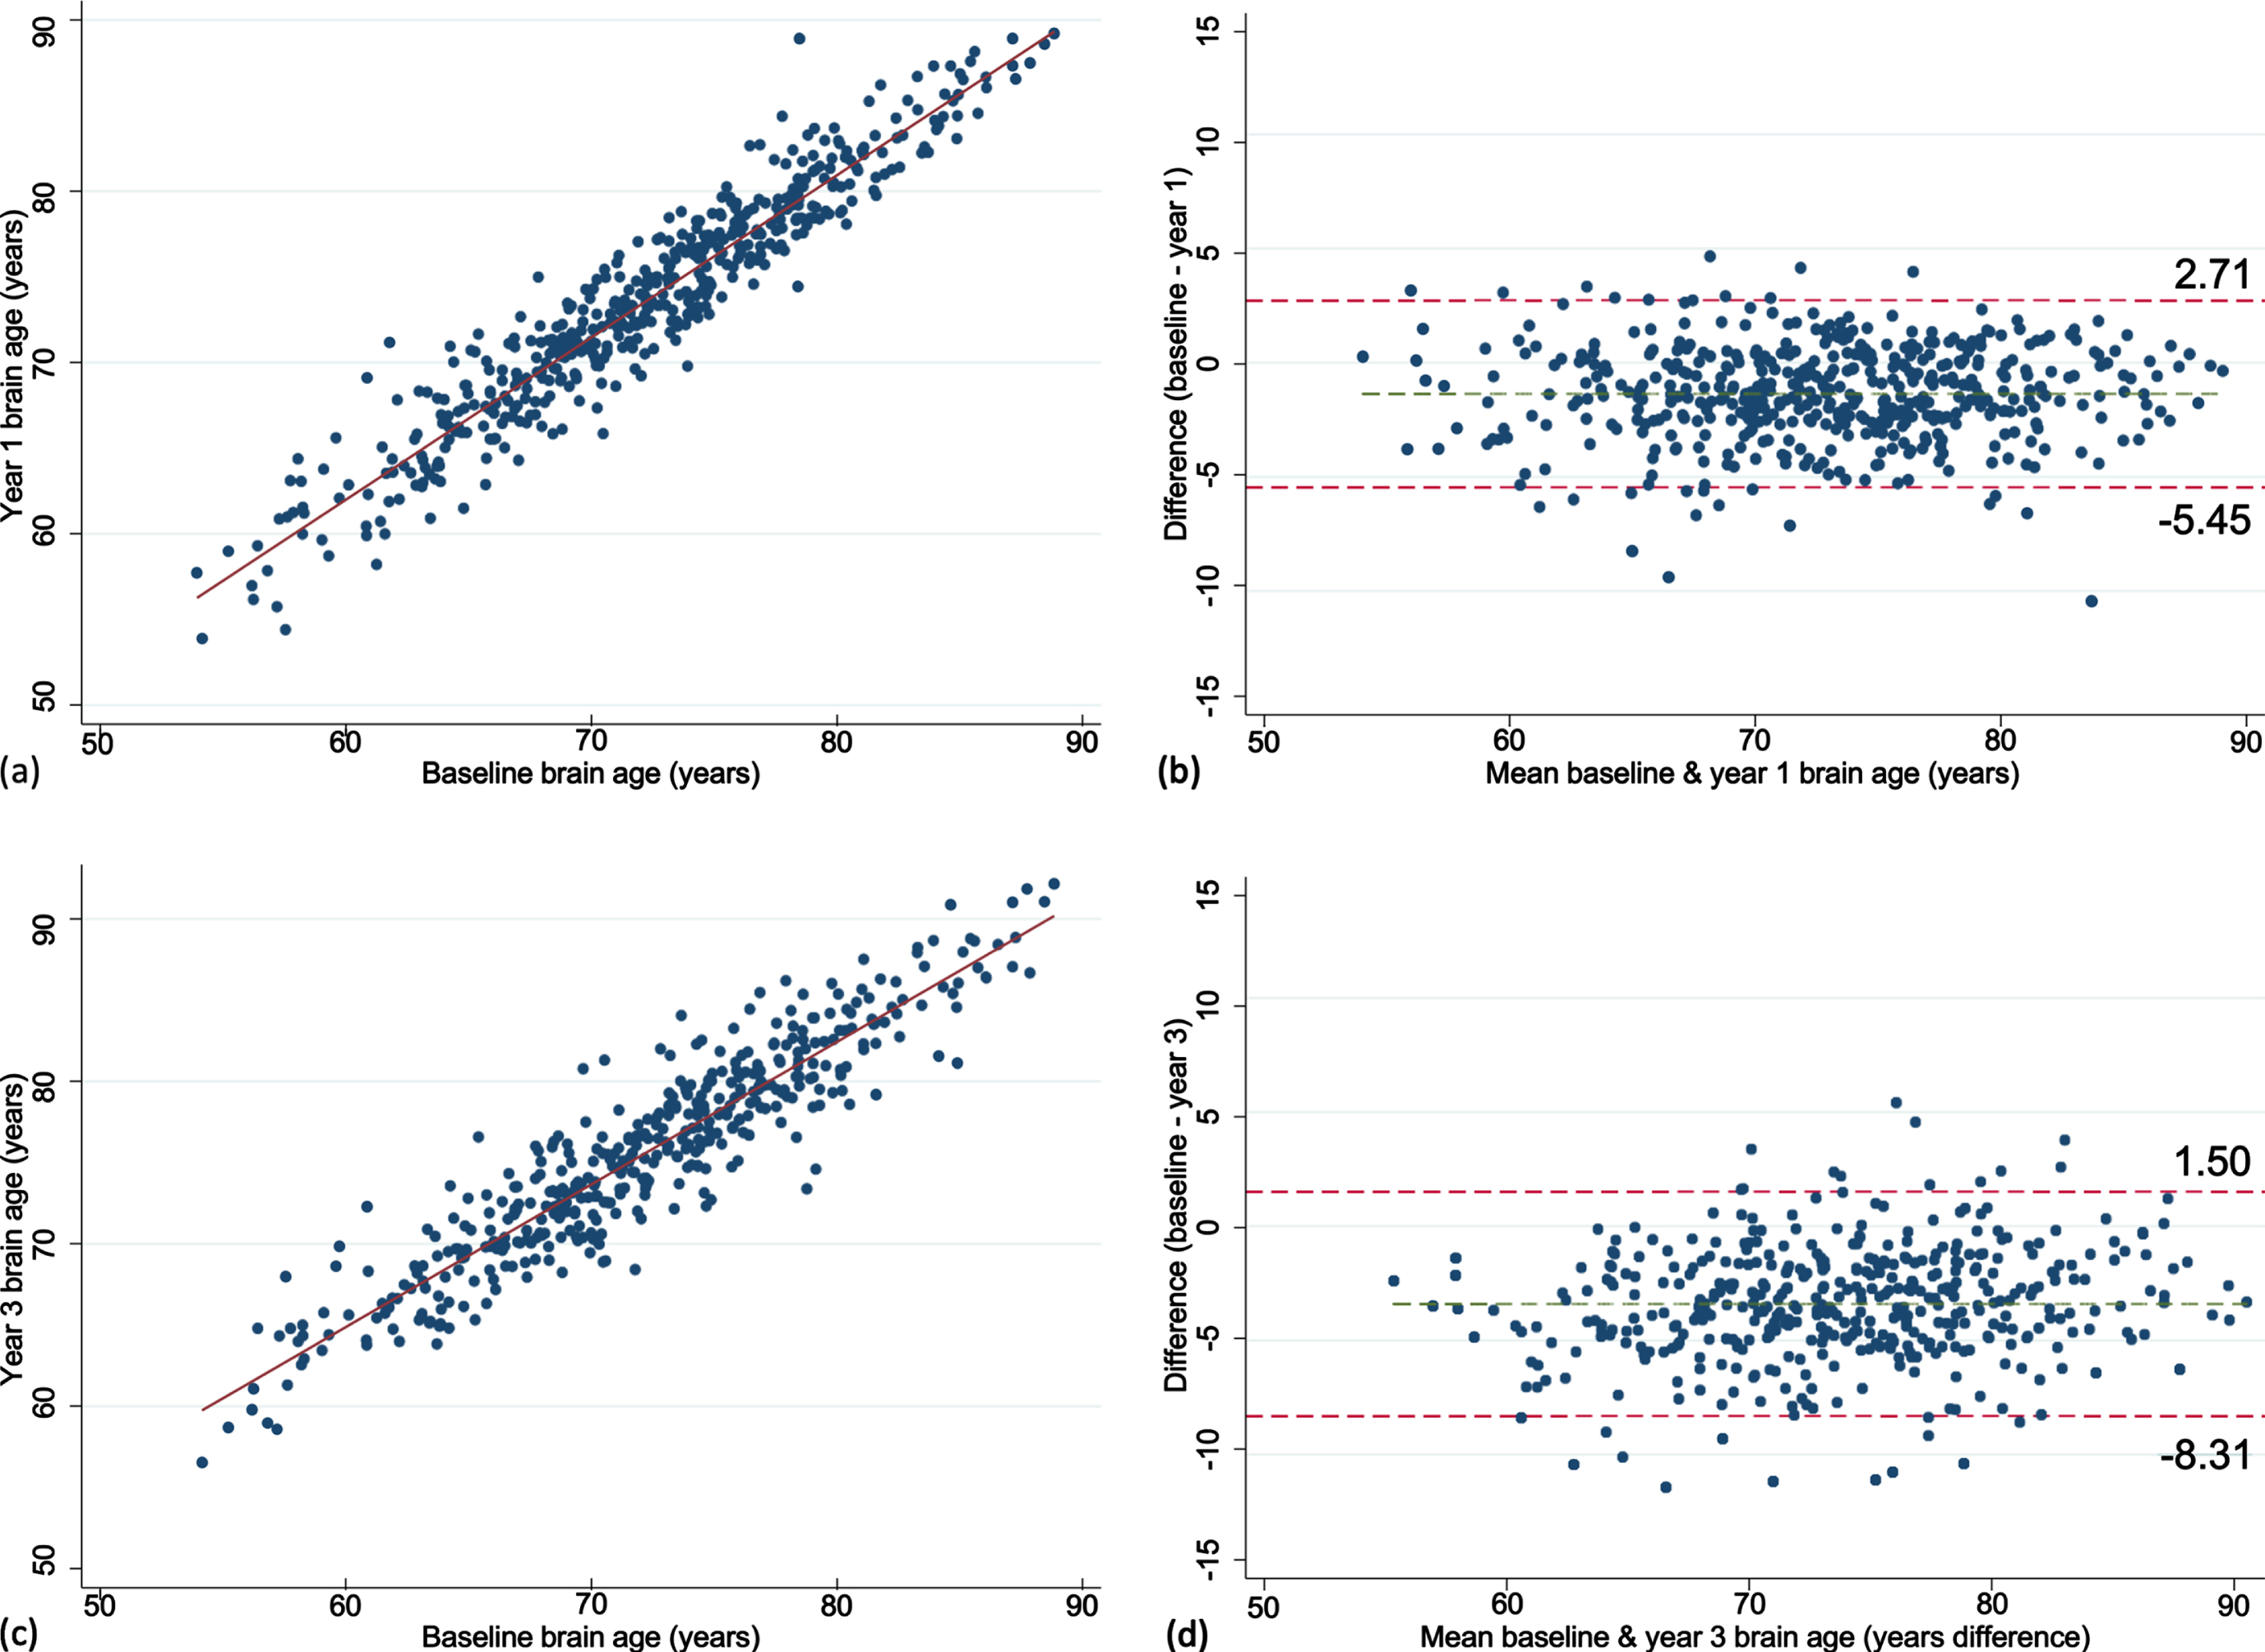
Participants individual brain-PAD trajectories are summarized in Supplementary Figure 1. Mean baseline brain-PAD was –1.6 years (SD of 6.0) indicating that the sample, on average, had a slightly younger brain age relative to their chronological age (Fig. 1). There was a statistically significant increase in brain-PAD over one (0.40 [2.1]) and three years (0.47 [2.5]; both p < 0.0001), respectively. No significant association was observed between chronological age and baseline brain-PAD (rho = –0.02, p = 0.60), suggesting no age bias in the prediction of brain-PAD. This was consistent at one (rho = –0.04, p = 0.39) and three years (rho = –0.02, p = 0.75). The MDC was small for baseline-year 1 and increased with a longer follow-up (baseline-year 3; Table 2).
Table 2
Test-retest reliability measures for brain age and brain-PAD
| Measure | n | aICC (95% CI) | SEM | MDC | Cohen’s d (95% CI) |
| Year one | |||||
| Brain age | 487 | 0.95 (0.94, 0.96) | 1.52 | 4.21 | 0.66 (0.43, 0.89) |
| Brain-PAD | 0.94 (0.93, 0.95) | 1.47 | 4.07 | 0.19 (–0.04, 0.43) | |
| Year three | |||||
| Brain age | 440 | 0.93 (0.92, 0.94) | 1.83 | 5.06 | 1.36 (1.13, 1.60) |
| Brain-PAD | 0.91 (0.89, 0.92) | 1.80 | 4.99 | 0.19 (–0.05, 0.42) |
ICCs (intraclass correlation coefficient) and their respective 95% confidence intervals were calculated based on a single-rating, consistent-agreement, using a two-way mixed effects model [58]. MDC, minimal detectable change; SEM, standard error of measurement.
Associations between baseline participant characteristics and the change in brain-PAD
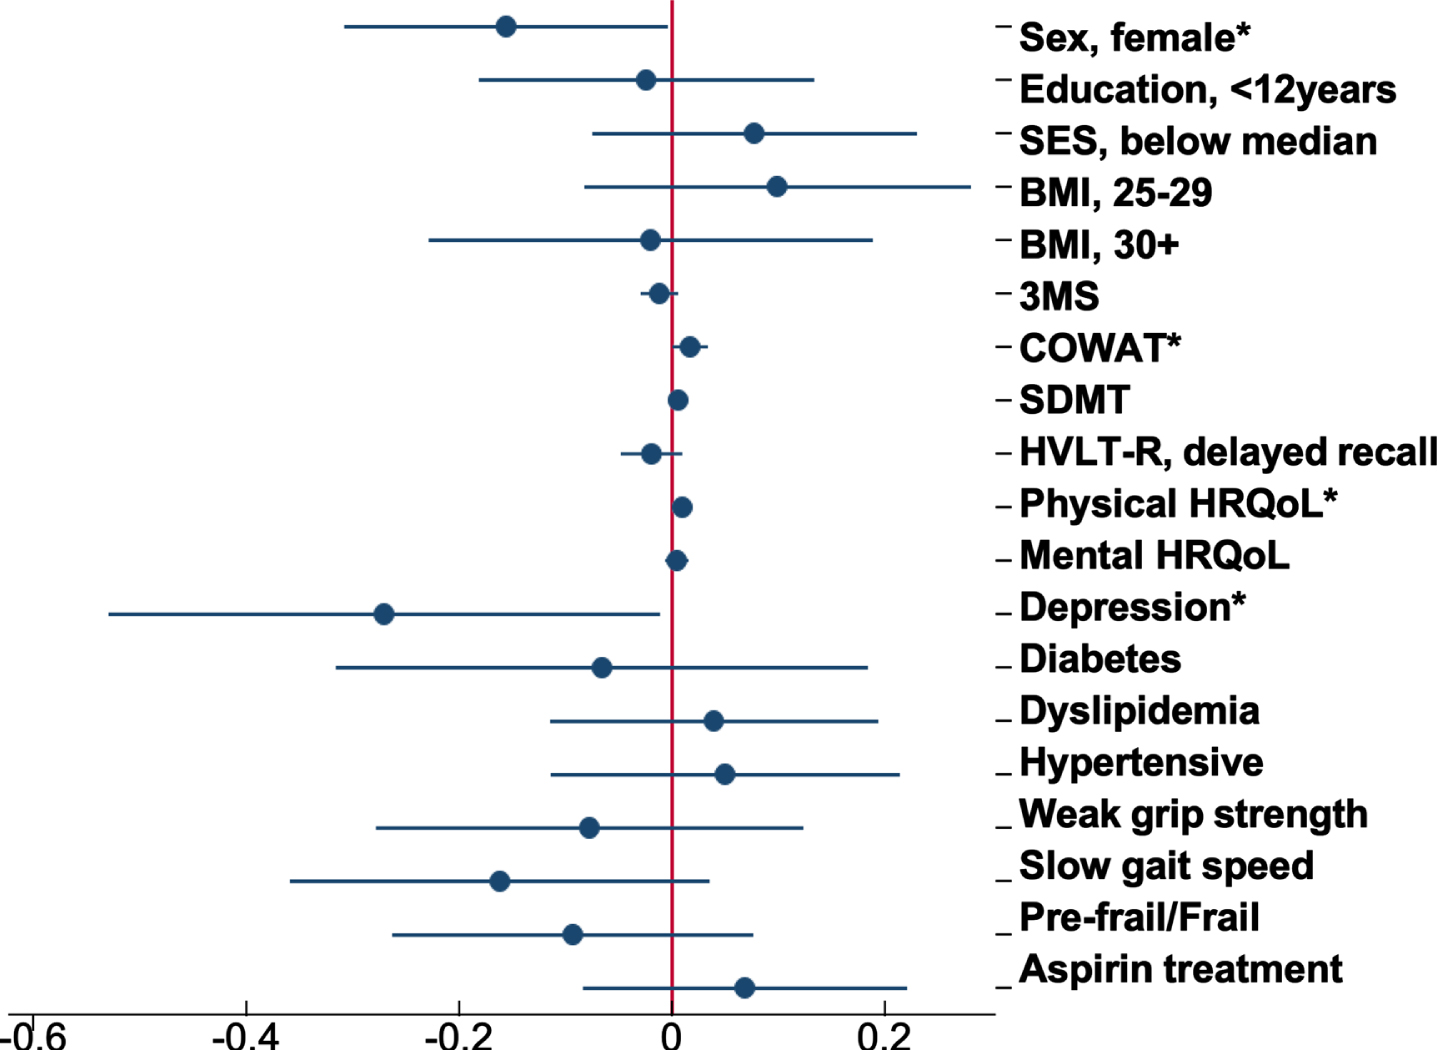
Of all the characteristics examined, COWAT (a measure of verbal fluency whereby a lower score represents a poor cognitive performance) was negatively associated with brain-PAD at baseline (Supplementary Table 1), but with a faster rate of change in brain-PAD (i.e., greater change in brain age relative to chronological age) over time (Supplementary Figure 2a). Other characteristics associated with the rate of change in brain-PAD were sex (Fig. 3), depression, and physical HRQoL (i.e., interaction term was significant) (Supplementary Figure 2b, c). The sex differences are shown in Fig. 3, where males have a statistically significant faster rate of change in brain-PAD over time, compared to females. Depression was linked to a slower rate of change in brain-PAD (i.e., lesser change in brain age relative to chronological age) (Supplementary Figure 2b), while higher scores of physical HRQoL (i.e., better physical well-being) were associated with a faster rate of change in brain-PAD (Supplementary Figure 2c). Given participants were from the ASPREE trial, we assessed the effects of aspirin but found no association with baseline or the rate of change in brain-PAD over three years. This, in addition to all other interactive effects are summarized in Fig. 4. When treated as a covariate, aspirin had little to no effect on the prior significant findings (Sex: –0.16 [–0.31, –0.004], p = 0.04; COWAT, baseline brain-PAD: –0.12 [–0.24, –0.003], p = 0.044; COWAT: 0.02 [0.001, 0.03], p = 0.042; physical HRQoL: 0.01 [0.0004, 0.02], p = 0.041; depression: –0.27 [–0.54, –0.01], p = 0.041). Given that 18 characteristics were examined, and a 5% significance level, we would anticipate at least one of these associations would be significant by chance alone.
Fig. 3
Marginal plot comparing the change in brain-PAD between males and females (n = 497). This plot represents the predictive margins and 95% CI for males (baseline = 259; 1 year = 253; 3 year = 230) and females (baseline = 238; 1 year = 234; 3 year = 210), taken from linear mixed models adjusting for age and age2.
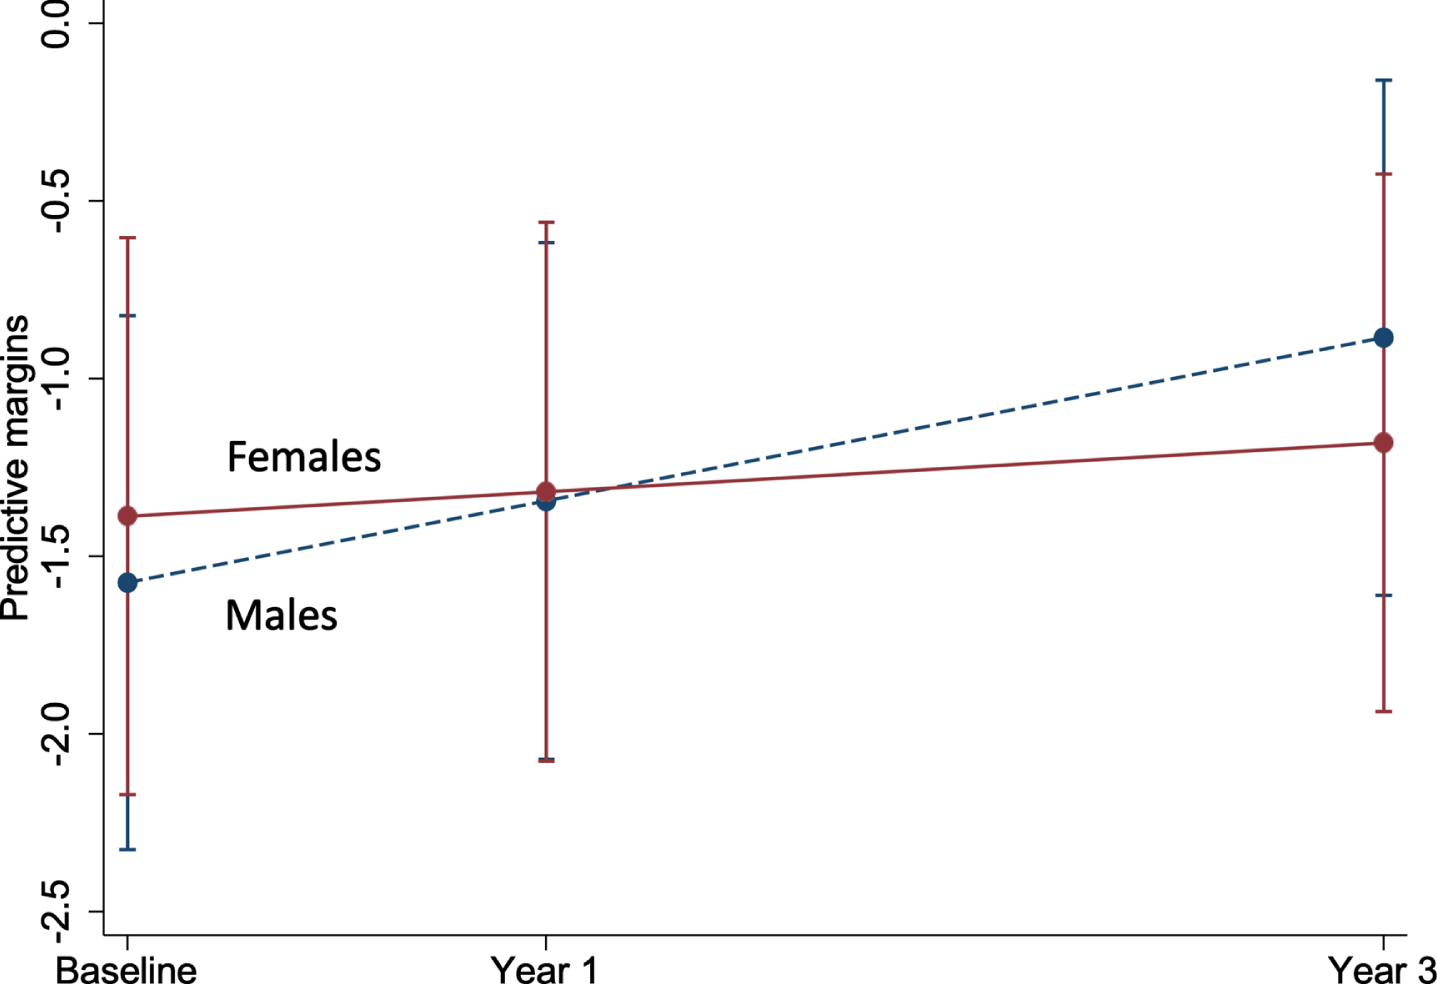
Fig. 4
Forest plot of the association between baseline participant characteristics and the change in brain-PAD. Dots are the unstandardized beta coefficients representing the interaction between baseline characteristics and time; bars display the 95% confidence interval. Models adjusted for sex, age, and age2 *p < 0.05.
Additional analyses were performed classifying participants based on whether the change in brain-PAD remained stable (n = 274), decelerated (n = 61), or accelerated from baseline to year 3 (n = 105). Participants who decelerated had a median chronological age of 74.2 years (IQR = 71.8–77.1), which was older than individuals in the stable (72.4 [71.2–75.4]) or accelerate groups (71.6 [70.9–74.0]). Brain-PAD measured at baseline was significantly different between the three groups (p < 0.0001), with the accelerate group having a more negative brain-PAD (i.e., younger brain age relative to chronological age) than the stable (mean difference = –2.65 [95% CI = –4.21, –1.08], p < 0.0001), or decelerate groups (mean difference = –4.57 [95% CI = –6.76, –2.37], p < 0.0001). At year 3, the decelerate group had a lower brain-PAD than the accelerate group (mean difference = –2.50 [95% CI = –0.34, –4.66], p = 0.02). The accelerate group had a mean positive brain-PAD of 3.7 years (SD of 1.6), which equates to an older brain age relative to chronological age.
Multinomial logistic regression analyses, adjusting for baseline brain-PAD, sex, and chronological age, were performed to examine whether baseline factors predicted the outcome of accelerate or decelerate, with the stable group as the reference. From these we found women had a statistically significant lower risk (50%) of being in the accelerate versus stable groups (Supplementary Table 2). A higher 3MS score (i.e., representing a better global cognitive performance) was associated with a 6% lower risk of brain-PAD accelerating, while a lower SES was associated with a statistically significant higher risk (66%) of brain-PAD accelerating than remaining stable. Despite the associations described above, no association was observed with depression, COWAT, and physical HQRoL, or any other characteristic.
DISCUSSION
In a cohort of community-dwelling older adults from the ASPREE NEURO study (aged 70 years and above), we investigated the test-retest reliability of ‘brain age’, estimated from a widely-used algorithm [6]. We found excellent test-retest reliability of brain age longitudinally from baseline over one and three years, which highlights the robustness of this measure over the short and medium-term. We then examined whether factors relating to sociodemographic, health and wellbeing, and physical and cognitive function were associated with the three-year change in brain aging. We identified an association with sex, whereby a faster rate of change in brain aging (i.e., representing a greater increase, and therefore worsening of brain age relative to chronological age) was observed in men. We also found a weak, and somewhat paradoxical evidence for an association between depression and slower rates of change in brain aging (i.e., lesser change in brain age relative to chronological age), and associations between a faster rate of change in brain aging with both higher verbal fluency, and with greater physical HRQoL.
Among the determinants investigated in this study, the most consistent was the faster rate of brain aging, and thus cortical atrophy, occurring in men compared with women, although the effect sizes were small. While this finding of greater brain atrophy in men aligns with some longitudinal neuroimaging studies [65, 66], evidence from other studies is specific to certain brain regions, and relatively mixed [67, 68]. Other sex differences include a higher frequency of white matter hyperintensities in women, and cortical infarctions in men [69], and this is considered a possible explanation for some reports that women have a higher incidence of Alzheimer’s disease (AD) [70], although this remains inconclusive [71]. In terms of brain age, two small studies (n = 14 and 20) have investigated brain age prospectively, but in younger community dwelling adults [36, 72]. Of these studies, only one had examined sex differences, but this was in relation to the female menstrual cycle [36]. Findings from some cross-sectional studies indicate that women have a higher brain age than men, and thus greater age-related brain changes [25–28, 73]. Conversely, other studies report an older brain age relative to chronological age in men compared to women [6, 7, 74], which aligns with our longitudinal finding of greater brain atrophy in men.
Although it remains inconclusive, sex differences may be linked to the involvement of sex hormones, including exposure to natural estrogen and testosterone over the lifetime, which are considered to have neuroprotective effects [75]. Declines in estrogen have been considered partially responsible for the greater loss of brain tissue volume observed in postmenopausal women, and later onset of AD in women compared to men [76], though these findings remain inconsistent [77–79]. They also do not corroborate some findings from observational studies on hormone therapies, which suggest no beneficial effects of estrogen for older women [80]. Conversely, given its primary role in males, declines in testosterone are considered an important risk factor for AD in men [81–83], and could partly explain the accelerated brain atrophy in our study cohort, though the evidence remains inconsistent [84, 85]. Few neuroimaging studies have examined sex differences in circulating testosterone, with one cross-sectional study reporting an association between higher levels of testosterone and lower cerebral amyloid burden in older women (mean age of 73 years), and a larger hippocampal volume in men (mean age of 72 years) [86]. In older men with prostate cancer, the prolonged use of androgen deprivation therapy (ADT) has been found to be cross-sectionally associated with a smaller grey matter volume [87], while a longitudinal study reports a decline in grey matter volume over 6 months of ADT [88]. Sex differences in these hormones have also been identified from brain tissue, whereby lower levels of testosterone were found in men (aged 60–79 years), and older women with AD (80 years and above), while lower levels of estrogen were identified in women with AD (aged 61–91 years), but not men (aged 60–89 years) [89].
The other findings in our study, with regards to depression, physical HRQoL, and verbal fluency, were not robust to the secondary analysis, and do not align with the limited number of studies undertaken in this area. For example, in the mixed models we found that depression was associated with a slower rate of change in brain aging, suggesting few age-related brain changes occurred over three years, but the small number of cross-sectional brain age studies, to date, have reported no association in small and larger cohorts of community dwelling adults [90–92]. Further, regarding our findings on depression, we could also not rule out the possibility of a ‘regression to the mean’, where an extremely negative, or positive baseline value is followed by a three-year estimate that is closer to the subjects mean brain-PAD [93]. Our finding of a faster rate of change in brain aging, and thus greater brain atrophy in people with better cognitive function and physical HRQoL at baseline, contradicts the well-established description of age-related declines in physical and cognitive function [94, 95]. There have been a few cross-sectional brain age studies that mostly report a statistically significant negative association with verbal fluency [26, 56]. Our prior cross-sectional analysis of verbal fluency and brain-PAD involved participants overlapping with this study and showed no association [12]. Overall, longitudinal evidence from neuroimaging studies is relatively sparse, inconsistent, and limited to regional brain volumes. Our findings are a unique contribution to the current literature, which highlight the need for further investigation.
Strengths and limitations
This study has a number of strengths. Firstly, we estimated brain age using a publicly sourced model that has been previously validated using an independent test cohort [6], and images underwent rigorous quality assessments. We assessed the test-retest reliability of this brain age algorithm over periods of 1 and 3 years, which provides strong evidence for the validity and robustness of this measure. We conducted a prospective investigation of brain age using data from a large community-based cohort of older, cognitively unimpaired participants, and thus focused on an important stage of life which is characterized by brain atrophy, and heterogeneity of aging trajectories.
Several limitations must also be considered. A high proportion of participants were white, from a higher SES percentile, and had completed 12 or more years of formal education. Participants were also generally healthy at inclusion, which limits the generalizability of these findings. In addition, dropouts between years of follow-up may have included individuals with greater brain atrophy, poor cognitive function, or physical health, which further limits these study findings. Despite the longitudinal nature of this study, our findings are limited to a three-year follow-up period. Although we observed statistical significance for some of the baseline exposures, the overall effects were small, and given the number of tests, we would expect at least one significant association by chance alone.
The moderate fit of the brain age model to predict chronological age for our study cohort was weaker than achieved in the training sample used to develop the model (n = 857, r = 0.973, MAE = 3.93 years), and the independent validation cohort (n = 611, r = 0.947, MAE = 4.90 years) [6], and may partially explain our null findings. This may relate to the narrow age range of our study sample, which is in contrast to the broad age-range used to train and validate the model (18 to 92, and 90 years, respectively), and is further supported by the difference between the mean absolute errors when adjusting for age range (0.05 and 0.07 years for the test and validation dataset vs. the 0.27 to 0.28 years identified for our study cohort). Such discrepancies may have introduced a measure of noise into our estimates, alongside true individual variability. In this regard, we cannot rule out the possibility that our select cut-off value of two-years, that was used to define participants as accelerate, decelerate and stable, may be based on measurement noise, rather than true interindividual differences.
While not a statistically significant, the weak negative correlation between brain-PAD and chronological age may point to an age bias (i.e., statistical phenomenon whereby the model underestimates brain age in older populations), that could partially explain the negative mean brain-PAD observed for our study cohort and may confound findings with other age-related exposures [37]. In attempt to overcome this limitation, we include chronological age as a covariate in all mixed models [96]. Finally, though estimates of brain age were derived from local tissue volume (i.e., grey and white matter volumes) from across the whole brain, which change with aging [3], they can provide no evidence on associations with the change in regional brain aging.
Conclusions
This was the first study to prospectively examine the association between a range of participant characteristics and the rate of change in the brain-PAD. Here we present consistent yet weak evidence that older men have faster brain atrophy than women. None of the other baseline characteristics were consistently associated with brain aging. Given the sparsity of longitudinal research on brain age in older community dwelling populations, future prospective studies are needed to confirm our findings.
ACKNOWLEDGMENTS
We would like to thank the participants of the Australian ASPREE and NEURO studies for volunteering their time, and to the general practitioners and medical clinics who supported participants during the trial. The authors would also like to acknowledge the hard work of all ASPREE field staff, and those at the Monash Biomedical Imaging facility.
FUNDING
ASPREE received funding from the National Institute on Aging and the National Cancer Institute at the National Institutes of Health (U01AG029824), Monash University, the Victorian Cancer Agency, and the Australian National Health and Medical Research Council (NHMRC, grant numbers 334047 and 1127060). NEURO received funding from NHMRC (1086188) and support from Monash Biomedical Imaging. Jo Wrigglesworth is the recipient of a Research Training Program stipend, awarded by Monash University and the Australian government. Ian H. Harding is supported by a NHMRC Fellowship (APP1106533). John J. McNeil receives an investigator grant funded through a NHMRC Leadership Fellowship (APP1173690). Joanne Ryan is funded by a NHMRC Dementia Research Leader Fellowship (APP1135727). Funders did not direct the conduction of this study, nor the decision to publish these findings.
CONFLICT OF INTEREST
Stephanie Ward received payment from the pharmaceutical industry company Roche Holdings AG to attend an advisory meeting on Alzheimer’s disease. All other authors declare no competing interests.
SUPPLEMENTARY MATERIAL
[1] The supplementary material is available in the electronic version of this article: https://dx.doi.org/10.3233/ADR-220011.
REFERENCES
[1] | Lopez-Otin C , Blasco MA , Partridge L , Serrano M , Kroemer G ((2013) ) The hallmarks of aging. Cell 153: , 1194–1217. |
[2] | World Health Organization (2015) World Report on Aging and Health, World Health Organization. |
[3] | Grajauskas LA , Siu W , Medvedev G , Guo H , D’Arcy RCN , Song X ((2019) ) MRI-based evaluation of structural degeneration in the ageing brain: Pathophysiology and assessment. Ageing Res Rev 49: , 67–82. |
[4] | Cabeza R , Albert M , Belleville S , Craik FIM , Duarte A , Grady CL , Lindenberger U , Nyberg L , Park DC , Reuter-Lorenz PA , Rugg MD , Steffener J , Rajah MN ((2018) ) Maintenance, reserve and compensation: The cognitive neuroscience of healthy ageing. Nat Rev Neurosci 19: , 701–710. |
[5] | Coupe P , Manjon JV , Lanuza E , Catheline G ((2019) ) Lifespan changes of the human brain in Alzheimer’s disease. Sci Rep 9: , 3998. |
[6] | Cole JH , Ritchie SJ , Bastin ME , Valdes Hernandez MC , Munoz Maniega S , Royle N , Corley J , Pattie A , Harris SE , Zhang Q , Wray NR , Redmond P , Marioni RE , Starr JM , Cox SR , Wardlaw JM , Sharp DJ , Deary IJ ((2018) ) Brain age predicts mortality. Mol Psychiatry 23: , 1385–1392. |
[7] | Franke K , Gaser C , Manor B , Novak V ((2013) ) Advanced BrainAGE in older adults with type 2 diabetes mellitus. Front Aging Neurosci 5: , 90. |
[8] | Elliott ML , Belsky DW , Knodt AR , Ireland D , Melzer TR , Poulton R , Ramrakha S , Caspi A , Moffitt TE , Hariri AR ((2019) ) Brain-age in midlife is associated with accelerated biological aging and cognitive decline in a longitudinal birth cohort. Mol Psychiatry 26: , 3829–3838. |
[9] | Dinsdale NK , Bluemke E , Smith SM , Arya Z , Vidaurre D , Jenkinson M , Namburete AIL ((2021) ) Learning patterns of the ageing brain in MRI using deep convolutional networks. Neuroimage 224: , 117401. |
[10] | Franke K , Ziegler G , Kloppel S , Gaser C , Alzheimer’s Disease Neuroimaging I ((2010) ) Estimating the age of healthy subjects from T1-weighted MRI scans using kernel methods: Exploring the influence of various parameters. Neuroimage 50: , 883–892. |
[11] | Liem F , Varoquaux G , Kynast J , Beyer F , Kharabian Masouleh S , Huntenburg JM , Lampe L , Rahim M , Abraham A , Craddock RC , Riedel-Heller S , Luck T , Loeffler M , Schroeter ML , Witte AV , Villringer A , Margulies DS ((2017) ) Predicting brain-age from multimodal imaging data captures cognitive impairment. Neuroimage 148: , 179–188. |
[12] | Wrigglesworth J , Yaacob N , Ward P , Woods RL , McNeil J , Storey E , Egan G , Murray A , Shah RC , Jamadar SD , Trevaks R , Ward S , Harding IH , Ryan J , ASPREE investigator group ((2022) ) Brain-predicted age difference is associated with cognitive processing in later-life. Neurobiol Aging 109: , 195–203. |
[13] | Biondo F , Jewell A , Pritchard M , Mueller C , Steves CJ , Cole J ((2020) ) Brain-age predicts subsequent dementia in memory clinic patients: Neuroimaging/optimal neuroimaging measures for early detection. Alzheimers Dement 16: , e037378. |
[14] | Dercon Q , Nicholas JM , James S-N , Schott JM , Richards M ((2021) ) Grip strength from midlife as an indicator of later-life brain health and cognition: Evidence from a British birth cohort. BMC Geriatr 21: , 475. |
[15] | Lebedeva A , Sundstrom A , Lindgren L , Stomby A , Aarsland D , Westman E , Winblad B , Olsson T , Nyberg L ((2018) ) Longitudinal relationships among depressive symptoms, cortisol, and brain atrophy in the neocortex and the hippocampus. Acta Psychiatr Scand 137: , 491–502. |
[16] | Walsh EI , Shaw M , Sachdev P , Anstey KJ , Cherbuin N ((2019) ) The impact of type 2 diabetes and body mass index on cerebral structure is modulated by brain reserve. Eur J Neurol 26: , 121–127. |
[17] | Boller B , Mellah S , Ducharme-Laliberté G , Belleville S ((2017) ) Relationships between years of education, regional grey matter volumes, and working memory-related brain activity in healthy older adults. Brain Imaging Behav 11: , 304–317. |
[18] | Nyberg L , Magnussen F , Lundquist A , Baare W , Bartres-Faz D , Bertram L , Boraxbekk CJ , Brandmaier AM , Drevon CA , Ebmeier K , Ghisletta P , Henson RN , Junque C , Kievit R , Kleemeyer M , Knights E , Kuhn S , Lindenberger U , Penninx B , Pudas S , Sorensen O , Vaque-Alcazar L , Walhovd KB , Fjell AM ((2021) ) Educational attainment does not influence brain aging. Proc Natl Acad Sci U S A 118: , e2101644118. |
[19] | Barulli D , Stern Y ((2013) ) Efficiency, capacity, compensation, maintenance, plasticity: Emerging concepts in cognitive reserve. Trends Cogn Sci 17: , 502–509. |
[20] | Cole JH ((2020) ) Multimodality neuroimaging brain-age in UK biobank: Relationship to biomedical, lifestyle, and cognitive factors. Neurobiol Aging 92: , 34–42. |
[21] | de Lange AG , Anaturk M , Suri S , Kaufmann T , Cole JH , Griffanti L , Zsoldos E , Jensen DEA , Filippini N , Singh-Manoux A , Kivimaki M , Westlye LT , Ebmeier KP ((2020) ) Multimodal brain-age prediction and cardiovascular risk: The Whitehall II MRI sub-study. Neuroimage 222: , 117292. |
[22] | Amen DG , Egan S , Meysami S , Raji CA , George N ((2018) ) Patterns of regional cerebral blood flow as a function of age throughout the lifespan. J Alzheimers Dis 65: , 1087–1092. |
[23] | Besteher B , Gaser C , Nenadic I ((2019) ) Machine-learning based brain age estimation in major depression showing no evidence of accelerated aging. Psychiatry Res Neuroimaging 290: , 1–4. |
[24] | Han LKM , Schnack HG , Brouwer RM , Veltman DJ , van der Wee NJA , van Tol MJ , Aghajani M , Penninx B ((2021) ) Contributing factors to advanced brain aging in depression and anxiety disorders. Transl Psychiatry 11: , 402. |
[25] | Bittner N , Jockwitz C , Franke K , Gaser C , Moebus S , Bayen UJ , Amunts K , Caspers S ((2021) ) When your brain looks older than expected: Combined lifestyle risk and BrainAGE. Brain Struct Funct 226: , 621–645. |
[26] | Boyle R , Jollans L , Rueda-Delgado LM , Rizzo R , Yener GG , McMorrow JP , Knight SP , Carey D , Robertson IH , Emek-Savas DD , Stern Y , Kenny RA , Whelan R ((2021) ) Brain-predicted age difference score is related to specific cognitive functions: A multi-site replication analysis. Brain Imaging Behav 15: , 327–345. |
[27] | Hwang I , Yeon EK , Lee JY , Yoo RE , Kang KM , Yun TJ , Choi SH , Sohn CH , Kim H , Kim JH ((2021) ) Prediction of brain age from routine T2-weighted spin-echo brain magnetic resonance images with a deep convolutional neural network. Neurobiol Aging 105: , 78–85. |
[28] | Weihs A , Frenzel S , Wittfeld K , Obst A , Stubbe B , Habes M , Szentkiralyi A , Berger K , Fietze I , Penzel T , Hosten N , Ewert R , Volzke H , Zacharias HU , Grabe HJ ((2021) ) Associations between sleep apnea and advanced brain aging in a large-scale population study. Sleep 44: , zsaa204. |
[29] | Luders E , Cherbuin N , Gaser C ((2016) ) Estimating brain age using high-resolution pattern recognition: Younger brains in long-term meditation practitioners. Neuroimage 134: , 508–513. |
[30] | Rogenmoser L , Kernbach J , Schlaug G , Gaser C ((2018) ) Keeping brains young with making music. Brain Struct Funct 223: , 297–305. |
[31] | Steffener J , Habeck C , O’Shea D , Razlighi Q , Bherer L , Stern Y ((2016) ) Differences between chronological and brain age are related to education and self-reported physical activity. Neurobiol Aging 40: , 138–144. |
[32] | Dunas T , Wahlin A , Nyberg L , Boraxbekk CJ ((2021) ) Multimodal image analysis of apparent brain age identifies physical fitness as predictor of brain maintenance. Cereb Cortex 31: , 3393–3407. |
[33] | Reuben A , Elliott ML , Abraham WC , Broadbent J , Houts RM , Ireland D , Knodt AR , Poulton R , Ramrakha S , Hariri AR , Caspi A , Moffitt TE ((2020) ) Association of childhood lead exposure with MRI measurements of structural brain integrity in midlife. JAMA 324: , 1970–1979. |
[34] | Vidal-Pineiro D , Wang Y , Krogsrud SK , Amlien IK , Baare WF , Bartres-Faz D , Bertram L , Brandmaier AM , Drevon CA , Duzel S , Ebmeier K , Henson RN , Junque C , Kievit RA , Kuhn S , Leonardsen E , Lindenberger U , Madsen KS , Magnussen F , Mowinckel AM , Nyberg L , Roe JM , Segura B , Smith SM , Sorensen O , Suri S , Westerhausen R , Zalesky A , Zsoldos E , Walhovd KB , Fjell A ((2021) ) Individual variations in ‘brain age’ relate to early-life factors more than to longitudinal brain change. Elife 10: , e69995. |
[35] | Bjornebekk A , Kaufmann T , Hauger LE , Klonteig S , Hullstein IR , Westlye LT ((2021) ) Long-term anabolic-androgenic steroid use is associated with deviant brain aging. Biol Psychiatry Cogn Neurosci Neuroimaging 6: , 579–589. |
[36] | Franke K , Hagemann G , Schleussner E , Gaser C ((2015) ) Changes of individual BrainAGE during the course of the menstrual cycle. Neuroimage 115: , 1–6. |
[37] | Le TT , Kuplicki RT , McKinney BA , Yeh HW , Thompson WK , Paulus MP , Tulsa I ((2018) ) A nonlinear simulation framework supports adjusting for age when analyzing BrainAGE. Front Aging Neurosci 10: , 317. |
[38] | Luders E , Gingnell M , Poromaa IS , Engman J , Kurth F , Gaser C ((2018) ) Potential brain age reversal after pregnancy: Younger brains at 4-6 weeks postpartum. Neuroscience 386: , 309–314. |
[39] | Egorova N , Liem F , Hachinski V , Brodtmann A ((2019) ) Predicted brain age after stroke. Front Aging Neurosci 11: , 348. |
[40] | McWhinney S , Kolenic M , Franke K , Fialova M , Knytl P , Matejka M , Spaniel F , Hajek T ((2021) ) Obesity as a risk factor for accelerated brain ageing in first-episode psychosis-a longitudinal study. Schizophr Bull 47: , 1772–1781. |
[41] | Richard G , Kolskar K , Ulrichsen KM , Kaufmann T , Alnaes D , Sanders AM , Dorum ES , Monereo Sanchez J , Petersen A , Ihle-Hansen H , Nordvik JE , Westlye LT ((2020) ) Brain age prediction in stroke patients: Highly reliable but limited sensitivity to cognitive performance and response to cognitive training. Neuroimage Clin 25: , 102159. |
[42] | Ward SA , Raniga P , Ferris NJ , Woods RL , Storey E , Bailey MJ , Brodtmann A , Yates PA , Donnan GA , Trevaks RE , Wolfe R , Egan GF , McNeil JJ , on behalf of the ASPREE investigator group ((2017) ) ASPREE-NEURO study protocol: A randomized controlled trial to determine the effect of low-dose aspirin on cerebral microbleeds, white matter hyperintensities, cognition, and stroke in the healthy elderly. Int J Stroke 12: , 108–113. |
[43] | Aspree Investigator Group ((2013) ) Study design of ASPirin in Reducing Events in the Elderly (ASPREE): A randomized, controlled trial. Contemp Clin Trials 36: , 555–564. |
[44] | Teng EL , Chui HC ((1987) ) The Modified Mini-Mental State (3MS) examination. J Clin Psychiatry 48: , 314–318. |
[45] | McNeil JJ , Woods RL , Nelson MR , Murray AM , Reid CM , Kirpach B , Storey E , Shah RC , Wolfe RS , Tonkin AM , Newman AB , Williamson JD , Lockery JE , Margolis KL , Ernst ME , Abhayaratna WP , Stocks N , Fitzgerald SM , Trevaks RE , Orchard SG , Beilin LJ , Donnan GA , Gibbs P , Johnston CI , Grimm RH , ASPREE Investigator Group ((2017) ) Baseline characteristics of participants in the ASPREE (ASPirin in Reducing Events in the Elderly) study. J Gerontol A Biol Sci Med Sci 72: , 1586–1593. |
[46] | Australian Bureau of Statistics (2016) Socio-economic indexes for areas (SEIFA), https://www.abs.gov.au/ausstats/abs@nsf/mf/2033.0.55.001, last updated March 27, 2018, accessed on December 8, 2021. |
[47] | Tunny G (2006) Educational attainment in Australia. Economic Round-up, 1-9. |
[48] | Radloff LS ((1977) ) The CES-D scale: A self-report depression scale for research in the general population. Appl Psychol Meas 1: , 385–401. |
[49] | Wolfe R , Murray AM , Woods RL , Kirpach B , Gilbertson D , Shah RC , Nelson MR , Reid CM , Ernst ME , Lockery J , Donnan GA , Williamson J , McNeil JJ ((2018) ) The aspirin in reducing events in the elderly trial: Statistical analysis plan. Int J Stroke 13: , 335–338. |
[50] | Ware J Jr , Kosinski M , Keller SD ((1996) ) A 12-Item Short-Form Health Survey: Construction of scales and preliminary tests of reliability and validity. Med Care 34: , 220–233. |
[51] | Phyo AZZ , Ryan J , Gonzalez-Chica DA , Woods RL , Reid CM , Nelson MR , Murray AM , Gasevic D , Stocks NP , Freak-Poli R , Group AI ((2021) ) Health-related quality of life and all-cause mortality among older healthy individuals in Australia and the United States: A prospective cohort study. Qual Life Res 30: , 1037–1048. |
[52] | Ross TP ((2003) ) The reliability of cluster and switch scores for the Controlled Oral Word Association Test. Arch Clin Neuropsychol 18: , 153–164. |
[53] | Smith A ((1982) ) Symbol digit modalities test (SDMT) manual (revised), Western Psychological Services. Los Angeles. |
[54] | Brandt J , Benedict RH (2001) Hopkins verbal learning test–revised: Professional manual, Psychological Assessment Resources. |
[55] | Esteban O , Birman D , Schaer M , Koyejo OO , Poldrack RA , Gorgolewski KJ ((2017) ) MRIQC: Advancing the automatic prediction of image quality in MRI from unseen sites. PloS One 12: , e0184661. |
[56] | Cole JH , Leech R , Sharp DJ , Alzheimer’s Disease Neuroimaging Initiative ((2015) ) Prediction of brain age suggests accelerated atrophy after traumatic brain injury. Ann Neurol 77: , 571–581. |
[57] | Ashburner J ((2009) ) Computational anatomy with the SPM software. Magn Reson Imaging 27: , 1163–1174. |
[58] | Koo TK , Li MY ((2016) ) A guideline of selecting and reporting intraclass correlation coefficients for reliability research. J Chiropr Med 15: , 155–163. |
[59] | Portney LG ((2020) ) Foundations of clinical research: Applications to evidence-based practice, FA Davis, Philadelphia. |
[60] | Lewis AF , Myers M , Heiser J , Kolar M , Baird JF , Stewart JC ((2020) ) Test-retest reliability and minimal detectable change of corticospinal tract integrity in chronic stroke. Hum Brain Mapp 41: , 2514–2526. |
[61] | Chiu EC , Yip PK , Woo P , Lin YT ((2019) ) Test-retest reliability and minimal detectable change of the Cognitive Abilities Screening Instrument in patients with dementia. PLoS One 14: , e0216450. |
[62] | Bland JM , Altman DG ((2010) ) Statistical methods for assessing agreement between two methods of clinical measurement. Int J Nurs Stud 47: , 931–936. |
[63] | Smith SM , Vidaurre D , Alfaro-Almagro F , Nichols TE , Miller KL ((2019) ) Estimation of brain age delta from brain imaging. Neuroimage 200: , 528–539. |
[64] | Brauer M , Curtin JJ ((2018) ) Linear mixed-effects models and the analysis of nonindependent data: A unified framework to analyze categorical and continuous independent variables that vary within-subjects and/or within-items. Psychol Methods 23: , 389–411. |
[65] | Armstrong NM , An Y , Beason-Held L , Doshi J , Erus G , Ferrucci L , Davatzikos C , Resnick SM ((2019) ) Sex differences in brain aging and predictors of neurodegeneration in cognitively healthy older adults. Neurobiol Aging 81: , 146–156. |
[66] | Ritchie SJ , Dickie DA , Cox SR , Valdes Hernandez Mdel C , Corley J , Royle NA , Pattie A , Aribisala BS , Redmond P , Munoz Maniega S , Taylor AM , Sibbett R , Gow AJ , Starr JM , Bastin ME , Wardlaw JM , Deary IJ ((2015) ) Brain volumetric changes and cognitive ageing during the eighth decade of life. Hum Brain Mapp 36: , 4910–4925. |
[67] | Raz N , Ghisletta P , Rodrigue KM , Kennedy KM , Lindenberger U ((2010) ) Trajectories of brain aging in middle-aged and older adults: Regional and individual differences. Neuroimage 51: , 501–511. |
[68] | Raz N , Lindenberger U , Rodrigue KM , Kennedy KM , Head D , Williamson A , Dahle C , Gerstorf D , Acker JD ((2005) ) Regional brain changes in aging healthy adults: General trends, individual differences and modifiers. Cereb Cortex 15: , 1676–1689. |
[69] | Fatemi F , Kantarci K , Graff-Radford J , Preboske GM , Weigand SD , Przybelski SA , Knopman DS , Machulda MM , Roberts RO , Mielke MM , Petersen RC , Jack CR Jr, Vemuri P ((2018) ) Sex differences in cerebrovascular pathologies on FLAIR in cognitively unimpaired elderly. Neurology 90: , e466–e473. |
[70] | Li JQ , Tan L , Wang HF , Tan MS , Tan L , Xu W , Zhao QF , Wang J , Jiang T , Yu JT ((2016) ) Risk factors for predicting progression from mild cognitive impairment to Alzheimer’s disease: A systematic review and meta-analysis of cohort studies. J Neurol Neurosurg Psychiatry 87: , 476–484. |
[71] | Mielke MM , Vemuri P , Rocca WA ((2014) ) Clinical epidemiology of Alzheimer’s disease: Assessing sex and gender differences. Clin Epidemiol 6: , 37–48. |
[72] | Le TT , Kuplicki R , Yeh HW , Aupperle RL , Khalsa SS , Simmons WK , Paulus MP ((2018) ) Effect of ibuprofen on BrainAGE: A randomized, placebo-controlled, dose-response exploratory study. Biol Psychiatry Cogn Neurosci Neuroimaging 3: , 836–843. |
[73] | Franke K , Ristow M , Gaser C , Alzheimer’s Disease Neuroimaging Initiative ((2014) ) Gender-specific impact of personal health parameters on individual brain aging in cognitively unimpaired elderly subjects. Front Aging Neurosci 6: , 94. |
[74] | Goyal MS , Blazey TM , Su Y , Couture LE , Durbin TJ , Bateman RJ , Benzinger TL , Morris JC , Raichle ME , Vlassenko AG ((2019) ) Persistent metabolic youth in the aging female brain. Proc Natl Acad Sci U S A 116: , 3251–3255. |
[75] | Zhu D , Montagne A , Zhao Z ((2021) ) Alzheimer’s pathogenic mechanisms and underlying sex difference. Cell Mol Life Sci 78: , 4907–4920. |
[76] | Farrer LA , Cupples LA , Haines JL , Hyman B , Kukull WA , Mayeux R , Myers RH , Pericak-Vance MA , Risch N , van Duijn CM ((1997) ) Effects of age, sex, and ethnicity on the association between apolipoprotein E genotype and Alzheimer disease. A meta-analysis. APOE and Alzheimer Disease Meta Analysis Consortium. JAMA 278: , 1349–1356. |
[77] | Than S , Moran C , Beare R , Vincent AJ , Collyer TA , Wang W , Callisaya ML , Thomson R , Phan TG , Fornito A ((2021) ) Interactions between age, sex, menopause, and brain structure at midlife: A UK Biobank Study. J Clin Endocrinol Metab 106: , 410–420. |
[78] | den Heijer T , Geerlings MI , Hofman A , de Jong FH , Launer LJ , Pols HA , Breteler MM ((2003) ) Higher estrogen levels are not associated with larger hippocampi and better memory performance. Arch Neurol 60: , 213–220. |
[79] | Kim GW , Park K , Jeong GW ((2018) ) Effects of sex hormones and age on brain volume in post-menopausal women. J Sex Med 15: , 662–670. |
[80] | Ryan J , Artero S , Carriere I , Scali J , Maller JJ , Meslin C , Ritchie K , Scarabin PY , Ancelin ML ((2014) ) Brain volumes in late life: Gender, hormone treatment, and estrogen receptor variants. Neurobiol Aging 35: , 645–654. |
[81] | Gillett M , Martins RN , Clarnette R , Chubb S , Bruce D , Yeap B ((2003) ) Relationship between testosterone, sex hormone binding globulin and plasma amyloid beta peptide 40 in older men with subjective memory loss or dementia. J Alzheimers Dis 5: , 267–269. |
[82] | Hogervorst E , Combrinck M , Smith AD ((2003) ) Testosterone and gonadotropin levels in men with dementia. Neuro Endocrinol Lett 24: , 203–208. |
[83] | Moffat SD , Zonderman AB , Metter EJ , Kawas C , Blackman MR , Harman SM , Resnick SM ((2004) ) Free testosterone and risk for Alzheimer disease in older men. Neurology 62: , 188–193. |
[84] | Pennanen C , Laakso MP , Kivipelto M , Ramberg J , Soininen H ((2004) ) Serum testosterone levels in males with Alzheimer’s disease. J Neuroendocrinol 16: , 95–98. |
[85] | Paoletti AM , Congia S , Lello S , Tedde D , Orru M , Pistis M , Pilloni M , Zedda P , Loddo A , Melis GB ((2004) ) Low androgenization index in elderly women and elderly men with Alzheimer’s disease. Neurology 62: , 301–303. |
[86] | Lee JH , Byun MS , Yi D , Choe YM , Choi HJ , Baek H , Sohn BK , Lee JY , Kim HJ , Kim JW , Lee Y , Kim YK , Sohn CH , Woo JI , Lee DY , Group KR ((2017) ) Sex-specific association of sex hormones and gonadotropins, with brain amyloid and hippocampal neurodegeneration. Neurobiol Aging 58: , 34–40. |
[87] | Plata-Bello J , Plata-Bello A , Perez-Martin Y , Fajardo V , Concepcion-Massip T ((2019) ) Androgen deprivation therapy increases brain ageing. Aging (Albany NY) 11: , 5613–5627. |
[88] | Chao HH , Hu S , Ide JS , Uchio E , Zhang S , Rose M , Concato J , Li CS ((2013) ) Effects of androgen deprivation on cerebral morphometry in prostate cancer patients–an exploratory study. PLoS One 8: , e72032. |
[89] | Rosario ER , Chang L , Head EH , Stanczyk FZ , Pike CJ ((2011) ) Brain levels of sex steroid hormones in men and women during normal aging and in Alzheimer’s disease. Neurobiol Aging 32: , 604–613. |
[90] | Cruz-Almeida Y , Fillingim RB , Riley JL , 3rd, Woods AJ , Porges E , Cohen R , Cole J ((2019) ) Chronic pain is associated with a brain aging biomarker in community-dwelling older adults. Pain 160: , 1119–1130. |
[91] | de Lange AG , Kaufmann T , Quintana DS , Winterton A , Andreassen OA , Westlye LT , Ebmeier KP ((2021) ) Prominent health problems, socioeconomic deprivation, and higher brain age in lonely and isolated individuals: A population-based study. Behav Brain Res 414: , 113510. |
[92] | Karim HT , Ly M , Yu G , Krafty R , Tudorascu DL , Aizenstein HJ , Andreescu C ((2021) ) Aging faster: Worry and rumination in late life are associated with greater brain age. Neurobiol Aging 101: , 13–21. |
[93] | Barnett AG , Van Der Pols JC , Dobson AJ ((2005) ) Regression to the mean: What it is and how to deal with it. Int J Epidemiol 34: , 215–220. |
[94] | Brett CE , Dykiert D , Starr JM , Deary IJ ((2019) ) Predicting change in quality of life from age 79 to 90 in the Lothian Birth Cohort 1921. Qual Life Res 28: , 737–749. |
[95] | Salthouse TA ((2019) ) Trajectories of normal cognitive aging. Psychol Aging 34: , 17–24. |
[96] | Butler ER , Chen A , Ramadan R , Le TT , Ruparel K , Moore TM , Satterthwaite TD , Zhang F , Shou H , Gur RC , Nichols TE , Shinohara RT ((2021) ) Pitfalls in brain age analyses. Hum Brain Mapp 42: , 4092–4101. |


