
Nasal Extracts from Patients with Alzheimer’s Disease Induce Tau Aggregates in a Cellular Model of Tau Propagation
Abstract
Background:
Emerging evidence indicates that the misfolded tau protein can propagate aggregates between cells in a prion-like manner. This prion activity has been typically studied in brain extracts of patients with Alzheimer’s disease (AD), but not in the olfactory region that can be a potential biomarker in AD.
Objective:
To investigate the prion seeding activity of tau in nasal mucosa tissues using a cell culture model of tau propagation.
Methods:
Brain and nasal mucosa homogenates were added to HEK293T cells expressing three repeat or four-repeat domains of tau with the L266V, V337M (3RD*VM) and P301L and V377M mutations (4RD*LM) fused to the enhanced green fluorescence protein (EGFP) respectively. We also measured the level of phosphorylated tau (p-tau), total tau (t-tau), and p-tau/t-tau ratio and performed correlation analysis between tau prion activity and the level of tau.
Results:
We found that brain and nasal tissue homogenates from patients with AD significantly induced tau aggregation in HEK293T cells either expressing tau 3RD*VM-EGFP or 4RD*LM-EGFP compared with control brain and nasal tissue homogenates. The levels of p-tau and p-tau/t-tau ratio were significantly increased in the brain of patients with AD; however, no significant difference was found in nasal tissue compared with their respective control tissue homogenates.
Conclusion:
These results suggest that the nasal tissues contain tau seeds, similar to the brain, albeit without changes in the levels of p-tau and t-tau. Therefore, a cellular bioassay using nasal tissues would have great potential as an AD biomarker because of the usefulness of nasal tissue biopsy.
INTRODUCTION
According to the protein-only hypothesis, the conformational change from a normal isoform of a prion protein (PrPC) to a protease-resistant pathogenic form called scrapie-type prion protein (PrPSc) results in prion disease [1–3]. The common neuropathological feature of prion diseases is the predominantly extracellular accumulation of PrPSc in the central nervous system [4]. PrPSc can propagate from cell to cell (in vitro) and region to region in the brain (in vivo) via the conversion of PrPC to PrPSc [5, 6].
Tau is a microtubule-associated protein that forms aggregates in the brain in a range of neurodegenerative diseases that are collectively known as tauopathies. Previous studies have shown that tau aggregates can propagate in a hierarchical manner between synaptically connected neurons in the brain, similar to a prion-like propagation [7–9]. A variety of tau seeds have been employed to study tau propagation, e.g., brain extracts from patients with tauopathy [10, 11] or tau transgenic mice [12, 13], and cell lysates [14] or conditioned media [15, 16] from cells bearing tau aggregates and recombinant tau fibrils [17, 18]. Thus, the studies of tau propagation highlighted the use of cellular and animal models for providing a platform to develop diagnostic and therapeutic procedures [19].
We recently reported a significantly elevated level of phosphorylated tau (p-tau) in nasal smears of patients with Alzheimer’s disease (AD) compared with age-matched, cognitively normal individuals [20]. Phosphorylation is a major posttranslational modification of tau and a key process in the formation of tau aggregates [21–23]. Therefore, it is likely that tau seeds with the ability to propagate tau aggregation exist in the nasal tissues of these patients. However, it is difficult to verify this hypothesis using biochemical approaches, such as enzyme-linked immunosorbent assay (ELISA). Conversely, cellular bioassays such as the cellular models of tau propagation would help verify the existence of tau seeds in the nasal cavity of patients with AD. Here, we investigated the prion seeding activity of the extracts from the nasal autopsy tissues of patients with AD. The results of this study suggest that a cellular bioassay using nasal tissues has a great potential as an AD biomarker because of the usefulness of nasal tissue biopsy.
MATERIALS AND METHODS
Human postmortem tissues
This study complies with the Declaration of Helsinki and was approved by the Ethics Committee of Shiga University of Medical Science (reference number, R2019-102). Postmortem nasal mucosa and brain tissues from patients with Pick’s disease (PiD) (n = 1), patients with AD (n = 10), and normal subjects (n = 10) were obtained from the Fukushimura Brain Bank, Choju Medical Institute of Fukushimura Hospital, Toyohashi, Japan. The tissues were collected with patient consent and protocols were appr-oved by the Ethics Committee of Fukushimura Hospital. The Braak stage and demographic information of the postmortem tissues used in this study are summarized in Table 1.
Table 1
Braak stage and demographic data of control subjects and patients with AD
| Characteristics | Control | AD | PiD |
| n | 10 | 10 | 1 |
| Sex | Male 7 | Male 2 | |
| Female 3 | Female 8 | Female | |
| Age (y)* | 77.6±9.2 | 81.9±4.29 | 75 |
| Braak stage | I–II | VI | – |
*mean±SEM.
Preparation of tissue homogenates
Fresh tissues were cut, weighed, and homogenized in calcium- and magnesium-free DPBS (Nacalai Tesque, Kyoto, Japan) (40 mL/g of wet weight) using a hand-held micro homogenizer (model, NS-310EII; Microtec, Chiba, Japan), aliquoted at 50μL/tube, and kept at −80°C until use. Prior to the cell aggregation assay, the brain homogenate was sonicated on ice for 60 s using a sonicator (model, XL2020; Misonix, New York, NY, USA) and diluted with DPBS to a concentration of 6%.
Plasmid construction
Full-length tau (0N3R/0N4R) was cloned into the pcDNA3.1 vector from the human neuroblastoma cell line SH-SY5Y cDNA. Two site-directed mutations were introduced in the construct encoding the three repeat domains (3RD) of tau (amino acids 243 to 274 and 306 to 375, corresponding to 2N4R tau) and four-repeat domains (4RD) of tau (amino acids 243 to 375, corresponding to 2N-4R tau) using a QuikChange Lightning Multi Site-Directed Mutagenesis Kit (Agilent Technologies, CA, USA). The primers employed to introduce the mutations were designed using the website provided (www.agilent.com/genomics/qcpd); the primer details as listed in Table 2. The 3RD of tau construct with the L266V and V337M mutations (3RD*VM) and 4RD of tau construct with the P301L and V337M mutations (4RD*LM) was then fused to the enhanced green fluorescence protein (EGFP) at the C terminus using a 20-amino-acid flexible linker (KKIETHKSTVPRARDPPVAT). This construct was then introduced into the pIRESpuro3 vector (Clontech, CA, USA) and was termed 3RD*VM-EGFP and 4RD*LM-EGFP.
Table 2
Sequences of the primers used to introduce mutations in the tau 3RD and 4RD gene
| Primer sequence (site of mutation was bold) | Mutation |
| 5′-gctccactgagaacg tgaagcaccagccg-3′ | Leucine (L) to Valine (V): ctg to gtg |
| 5′-tatcaaacacgtcct gggaggcggcagtg-3′ | Proline (P) to leucine (L): ccg to ctg |
| 5′-aaccaggaggtggccaga tggaagtaaaatctgag-3′ | Valine (V) to Methionine (M): gtg to atg |
Development of stable cell lines
HEK293T cells were cultured in Dulbecco’s Modified Eagle’ Medium (DMEM; Nacalai Tesque) supplemented with 10%(vol/vol) fetal bovine serum (FBS; Hyclone, UT, USA) and 1%(vol/vol) penicillin/streptomycin (Nacalai Tesque); this culture medium was termed complete culture medium (CCM). Cultures were maintained in a humidified atmosphere of 5%(vol/vol) CO2 at 37°C. Cells were plated in a 24-well plate at a density 1×10⁵. After 24 h of culture, cells were transfected with the 3RD*VM-EGFP or 4RD*LM-EGFP plasmid using Lipofectamine 2000 (Invitrogen, MA, USA). At 48 h post-transfection, cells were trypsinized and transferred to a 10 cm2 culture dish, followed by the selection of stable polyclonal cells in CCM containing 1μg/mL puromycin (Nacalai Tesque) for 7 days. Monoclonal cells were generated via limiting dilution of the polyclonal cell population in a 96-well plate.
Validation of protein expression in HEK293T cells stably expressing tau 3RD*VM-eGFP
Stable monoclonal cells cultured in 6-well plates were washed with cold DPBS twice. Cells were scraped with 100μL of RIPA buffer (Nacalai Tesque) and the cell lysates were transferred to a new microcentrifuge tube. The tube was incubated on ice for 30 min and centrifuged at 10,000×g for 10 min at 4°C. The supernatant was collected into a new tube and protein concentration was determined using a BCA Protein Assay Kit (Nacalai Tesque). Proteins (10μg) in 4 × sample buffer and 10 × reducing buffer (Life Technologies, MA, USA) were denatured at 95°C for 10 min, applied to the lanes of precast 15%polyacrylamide gels (Wako Pure Chemicals, Osaka, Japan), electrophoresed, and transferred to polyvinylidene difluoride membranes (Immobilon-P; Merck Millipore, MA, USA). The membranes were blocked with 5%skim milk in Tris-buffered saline containing 1%Tween 20 (TBST) at room temperature for 1 h, followed by incubation at 4°C with the following primary antibodies: 3 days with a mouse monoclonal antibody against the tau three-repeat or four-repeat isoform (clone 8E/C11 or clone 1E1/A6; 1:1000; Merck Millipore), overnight with a mouse monoclonal antibody against β-actin (1:5000; Santa Cruz Biotechnology, CA USA), and overnight with a rabbit polyclonal anti-GFP antibody (1:1000; Merck Millipore). The membranes were washed three times with TBST (10 min each time) and then incubated at room temperature for 1 h with the following secondary antibodies: goat anti-mouse IgG or goat anti-rabbit IgG labeled with horseradish peroxidase (1:20000; Jackson ImmunoResearch Laboratories, PA, USA). After three further washes with TBST, the membranes were reacted with an enhanced chemiluminescent substrate (SuperSignal West Pico, Thermo Fischer Scientific, MA, USA), and proteins were then detected using an ImageQuant LAS 4000 mini system (GE Healthcare Life Science, Chicago, IL, USA).
Cell aggregation assay
Cells were plated onto 96-well plates with a clear bottom and black polystyrene walls (Greiner, Kremsmunster, Austria) at a density 25,000 cells per well using CCM containing 0.1μg/mL Hoechst 33258 (Life Technologies). Cells were incubated overnight at 37°C in a humidified atmosphere of 5%CO2, to allow adherence to the plate. Brain homogenates (10%final volume) were premixed with Lipofectamine 2000 (2%final volume) (Invitrogen) in Opti-MEM (88%final volume) (Gibco, Life Technologies) at room temperature for 2 h, followed by the addition of 10μL of the brain homogenates to the cells. Plates were then incubated at 37°C in a humidified atmosphere of 5%CO2 for 4 days. The prion seeding activity of the extracts was measured by fluorescence intensity using a microplate reader (Tecan Infinite M200, Mannedorf, Switzerland) at an excitation wavelength of 385 nm and an emission wavelength of 530 nm and normalized with the number of cells. The percentage of cells with aggregates was calculated from the image at five different regions for each sample. Cell imaging was performed on an inverted fluorescence microscope (model, IX83; Olympus, MA, USA) using the channels of both the DAPI (excitation: 352 nm; emission: 461 nm) and FITC (excitation: 495 nm; emission: 519 nm).
Immunocytochemistry
ELISA
For ELISA analysis, brain and nasal tissues were homogenized in a 50-fold homogenization buffer (50 mM Tris HCL buffer, pH 8.0, 8 M guanidine HCl, 200 mM NaCl, 2 mM EDTA, and 0.05%n-dodecyl-β-d-maltoside for 1 min using a homogenizer (Physcotron NS-310E11; Microtec) and were stored at −80°C until use. The homogenates were thawed and mixed well, and then centrifuged at 14,000×g for 20 min at 25°C. Subsequently, the supernatants (90μl) were filtered with Sephadex G-10 (GE Healthcare Life Science) set in a Bio-Spin Chromatography Column (Bio-Rad Laboratories) by centrifugation at 800×g for 1 min at 25°C, to remove guanidine HCl. After the total protein concentration was determined using a Pierce BCA Protein Assay Kit (ThermoFisher Scientific), total tau (t-tau) and phosphorylated tau (pT181) were measured in triplicate using commercially available kits (KHB0042 and KHO0631, respectively; ThermoFisher Scientific), according to manufacturer’s instructions. Optical density at 450 nm in each well was measured using a microplate reader (Infinite M200; Tecan, Männedorf, Switzerland).
Statistical analysis
Data pertaining to fluorescence/cells or %cells with aggregates are presented as the mean±SEM. The values represent the average of 10 patient samples per group, with the exception of the AD Nasal group, which included nine patients (five images of the samples of each patient were averaged). Data collected from ELISA also presented as mean±SEM. The values represent the averages of 10 patient samples per group. Statistical comparisons between two groups were performed using Student’s t-test for single comparisons and the Kruskal−Wallis test followed by Dunn’s test for multiple comparisons. Pairs of nonparametric variables (fluorescence/cell, %cells with aggregates, and p-tau/t-tau ratio) were then tested using a Spearman linear correlation model. Statistical analyses were performed using the PRISM 8 software (GraphPad Software, CA, USA). The statistical significance of all tests was set at p < 0.05.
RESULTS
Development of a cellular bioassay using the stable cell model expressing tau 3RD*VM-EGFP or 4RD*LM-EGFP
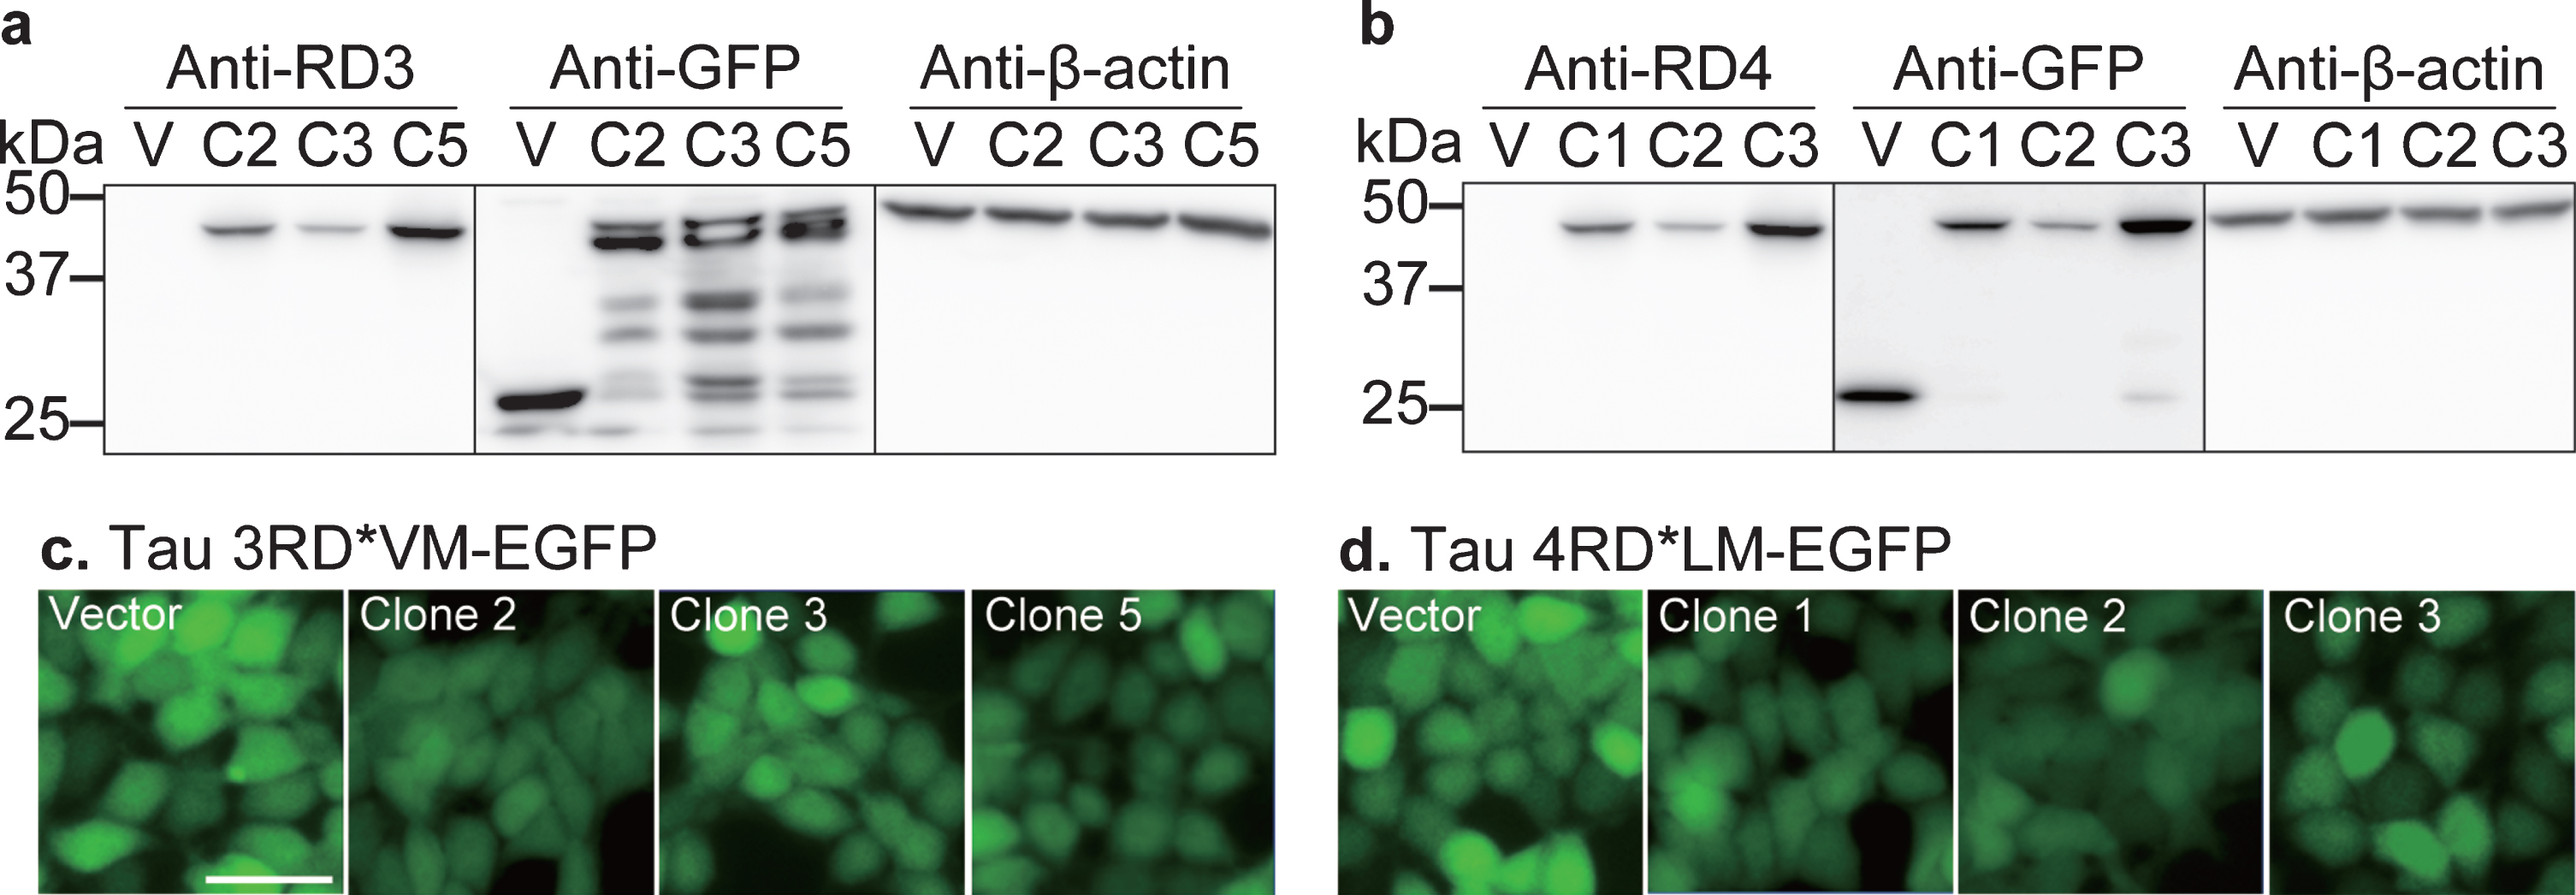
The present cellular bioassay system was developed for the determination of prion seeding activity in the brain and nasal tissue homogenates from control subjects and patients with AD. In this study, we developed a stable cell line expressing tau 3RD*VM-EGFP or 4RD*LM-EGFP. Several clones were selected to validate the protein expression of tau 3RD or 4RD in this cell line. Western blot data showed a significant protein band between 37 and 50 kDa corresponding to tau 3RD tagged EGFP in clones 2, 3, and 5 which represent the HEK293T cell line transfected with the 3RD*VM-EGFP plasmid (Fig. 1a). A significant protein band between 37 and 50 kDa corresponding to tau 4RD tagged EGFP in clones 1, 2, and 3 was also expressed in HEK293T cells expressing 4RD*LM-EGFP (Fig. 1b); whereas the HEK293T cell line transfected with vector plasmid (EGFP without tau) showed only a protein band for GFP at 25 kDa, with no protein band for tau 3RD or 4RD (Fig 1a, b), suggesting that the transfection of 3RD*VM-EGFP or 4RD*LM-EGFP constructs into HEK293T cells increased tau 3RD or 4RD tagged EGFP expression.
Fig. 1
Development of a cellular model of tau propagation. Validation of (a) 3RD*VM-EGFP and (b) 4RD*LM-EGFP expression. Stable cells transfected with vector plasmid (V) and three stable selected clones (clone 2 (C2), clone 3 (C3), and clone 5 (C5) in 3RD*VM-EGFP and C1, C2, and C3 in 4RD*LM-EGFP) were probed with anti-tau three- or four-repeat isoforms (3RD or 4RD), anti-GFP, and anti-β-actin antibodies on separate membranes. A protein ladder (M) was used as a size reference. Representative images of HEK 293T cells expressing (c) 3RD*VM-EGFP and (d) 4RD*LM-EGFP. Scale bar = 20μm.
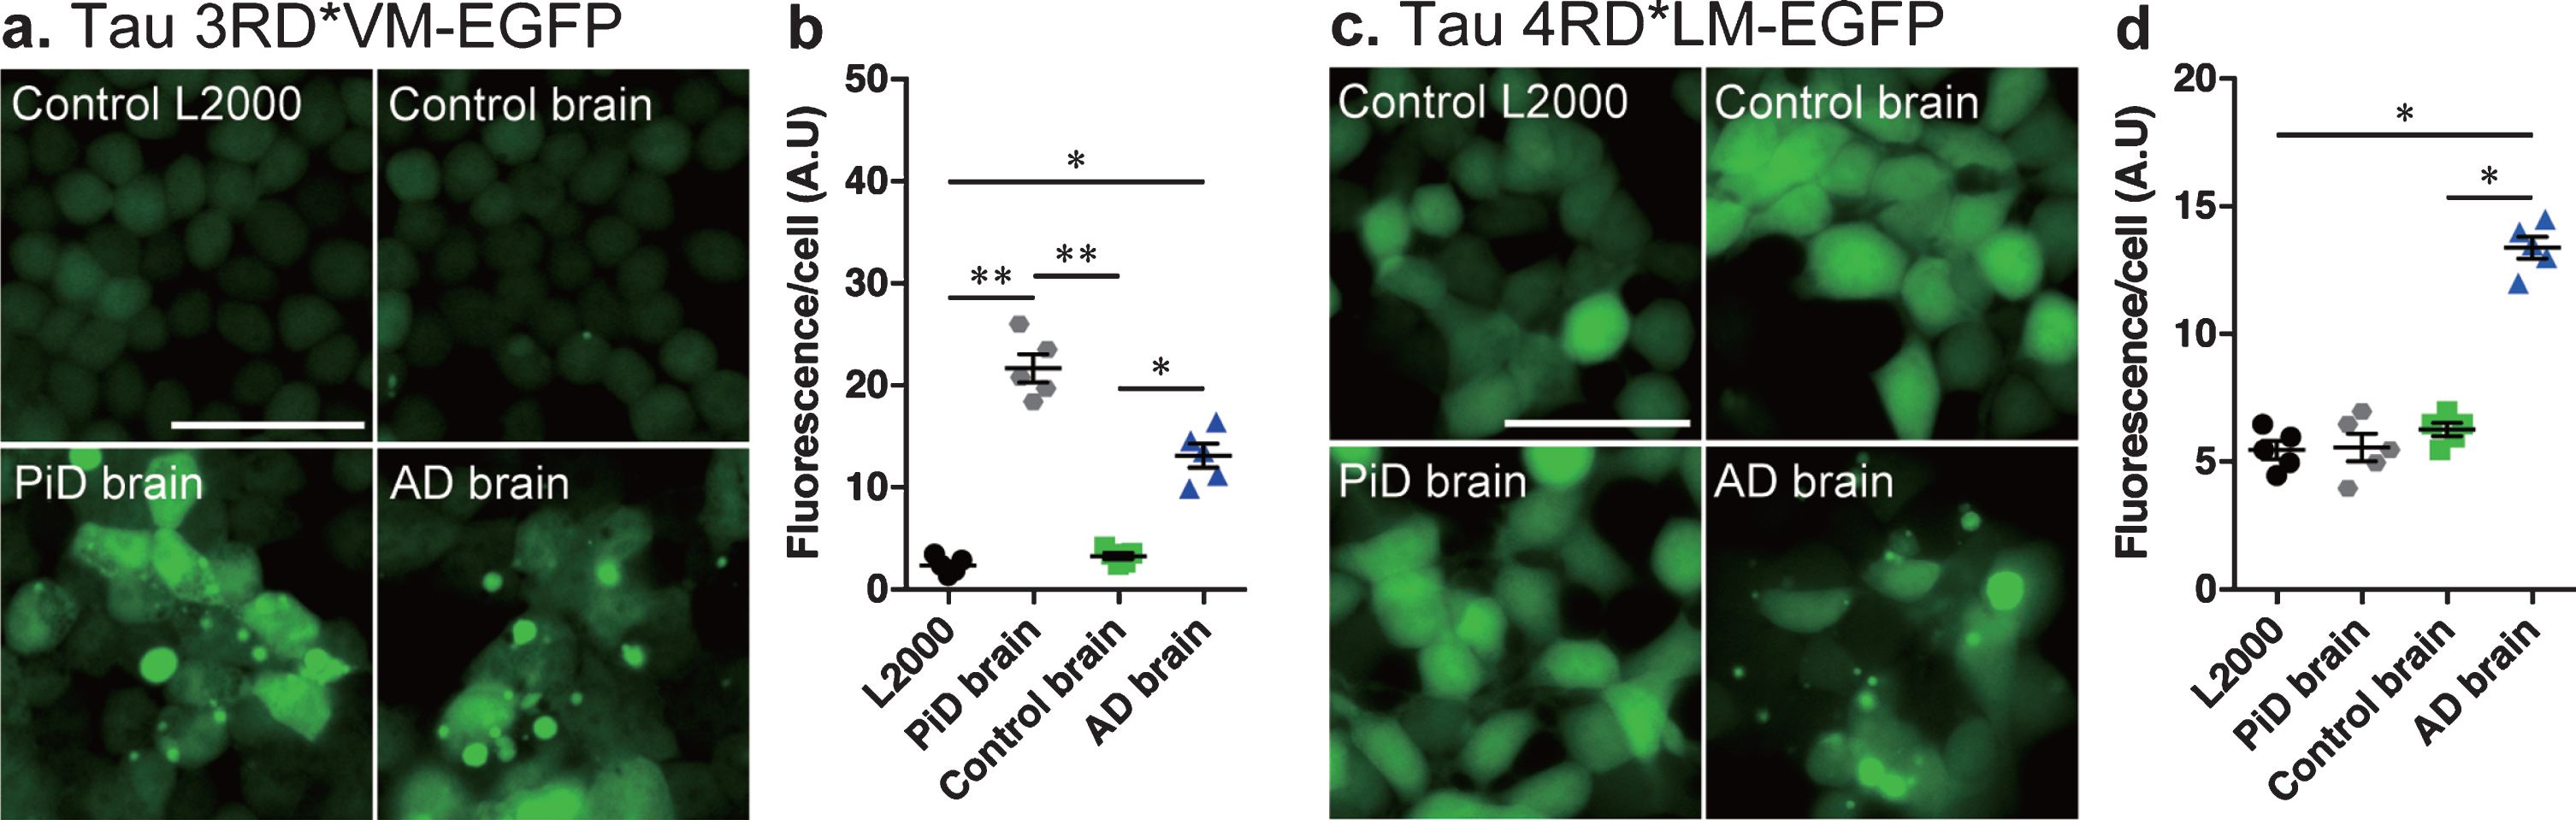
The cell culture system was then tested using tau seeds from brain tissue homogenates isolated from control and patient with AD or PiD. The res-ults showed that both AD and PiD brain tissue homogenates induced significant tau aggregation (Fig. 2a) and showed increased fluorescence per cell compared to control L2000 and control brain homogenates in cells expressing tau 3RD*VM-EGFP (Fig. 2b). However, only brain tissue homogenates from AD patients showed significant tau aggregation (Fig. 2c) and increased in fluorescence per cell compared to control L2000 and control brain homogenates in cells expressing tau 4RD*LM-EGFP (Fig. 2d). The same method was then used to examine the tau prion activity in the nasal tissue homogenates.
Fig. 2
Development of tau seed assay in cellular model of tau propagation. Representative images of HEK 293T cells expressing (a) 3RD*VM-EGFP and (c) 4RD*LM-EGFP incubated with L2000 or seeded with crude brain homogenates from control, AD, and PiD subjects for 4 days. Scale bar = 50μm. Quantification of tau aggregation (fluorescence/cell) in HEK293T cells expressing (b) 3RD*VM-EGFP and (d) 4RD*LM-EGFP. Data are presented as the mean±SEM measured from five replicates for each group (one sample per group). *p < 0.05, **p < 0.001.
Tau prion activity was significant in the brain and nasal tissue homogenates from patients with AD in HEK 293T cells expressing 3RD*VM-EGFP or 4RD*LM-EGFP
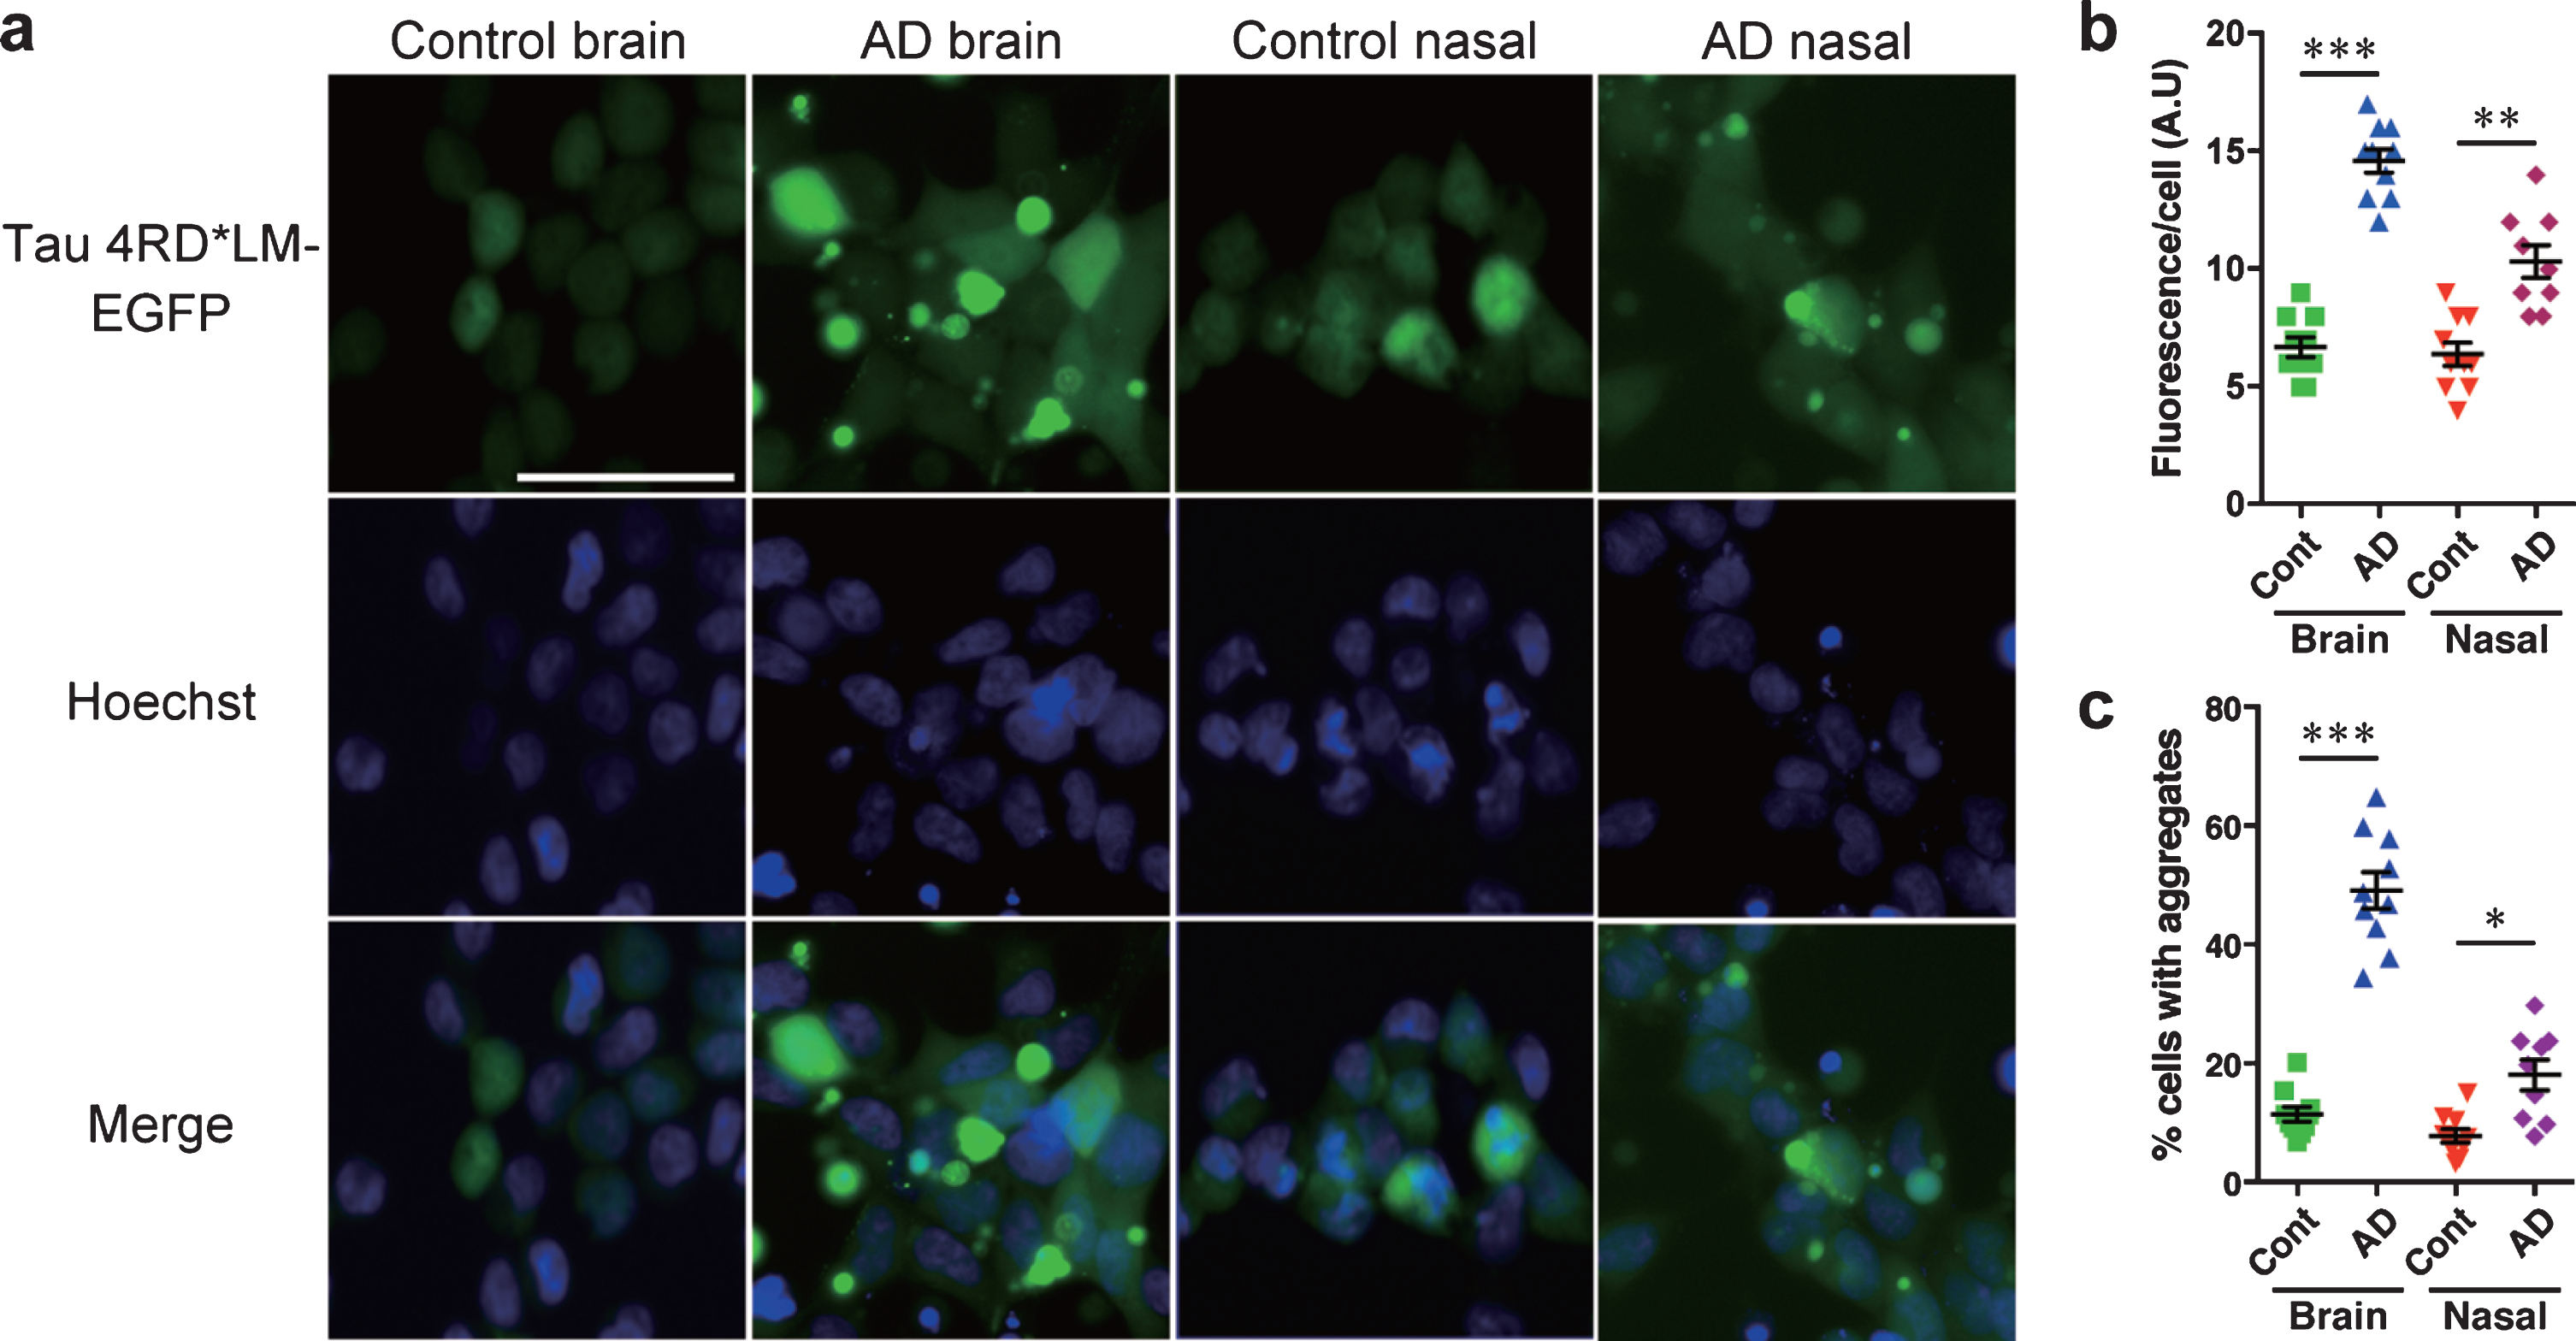
To test the tau prion activity, cells expressing tau 3RD*VM-EGFP or 4RD*LM-EGFP were seeded with the brain or nasal tissue homogenates from controls and patients with AD. We found that brain and nasal tissue homogenates isolated from patients with AD significantly induced tau aggregate formation in HEK293T cells expressing tau 3RD*VM-EGFP (Fig. 3a). Statistical analysis showed that the brain and nasal tissue homogenates from samples of patients with AD significantly increased the fluorescence per cell compared with the brain and nasal tissue homogenates from control samples (Fig. 3b). The percentage of cells with aggregates also significantly increased when seeded with the brain and nasal tissue homogenates from samples from AD patients compared with the brain and nasal tissue homogenates from control samples (Fig. 3c). A similar observation was also apparent in HEK 293T cells expressing tau 4RD*LM-EGFP (Fig. 4a-c). These results suggest that both brain and nasal tissue homogenates from patients with AD contain tau prions.
Fig. 3
HEK 293T cells stably expressing tau 3RD*VM-EGFP detect tau prions in the brain and nasal tissue homogenates from patients with AD. Brain and nasal tissue homogenates from control and AD patient samples were diluted in DPBS and incubated for 4 days with 3RD*VM-EGFP-expressing cells. a) Representative images of HEK 293T cells expressing 3RD*VM-EGFP seeded with the brain and nasal tissue homogenates from control individuals and patients with AD. Scale bar = 50μm. Quantification of tau aggregation by (b) fluorescence per cell. Data are presented as the mean±SEM measured from 10 samples per group, with the exception of AD nasal homogenates, for which nine samples were used, and (c) percentage of cells with aggregates. Data are presented as the mean±SEM measured from five images for each sample. *p < 0.05, **p < 0.001, ****p < 0.0001.
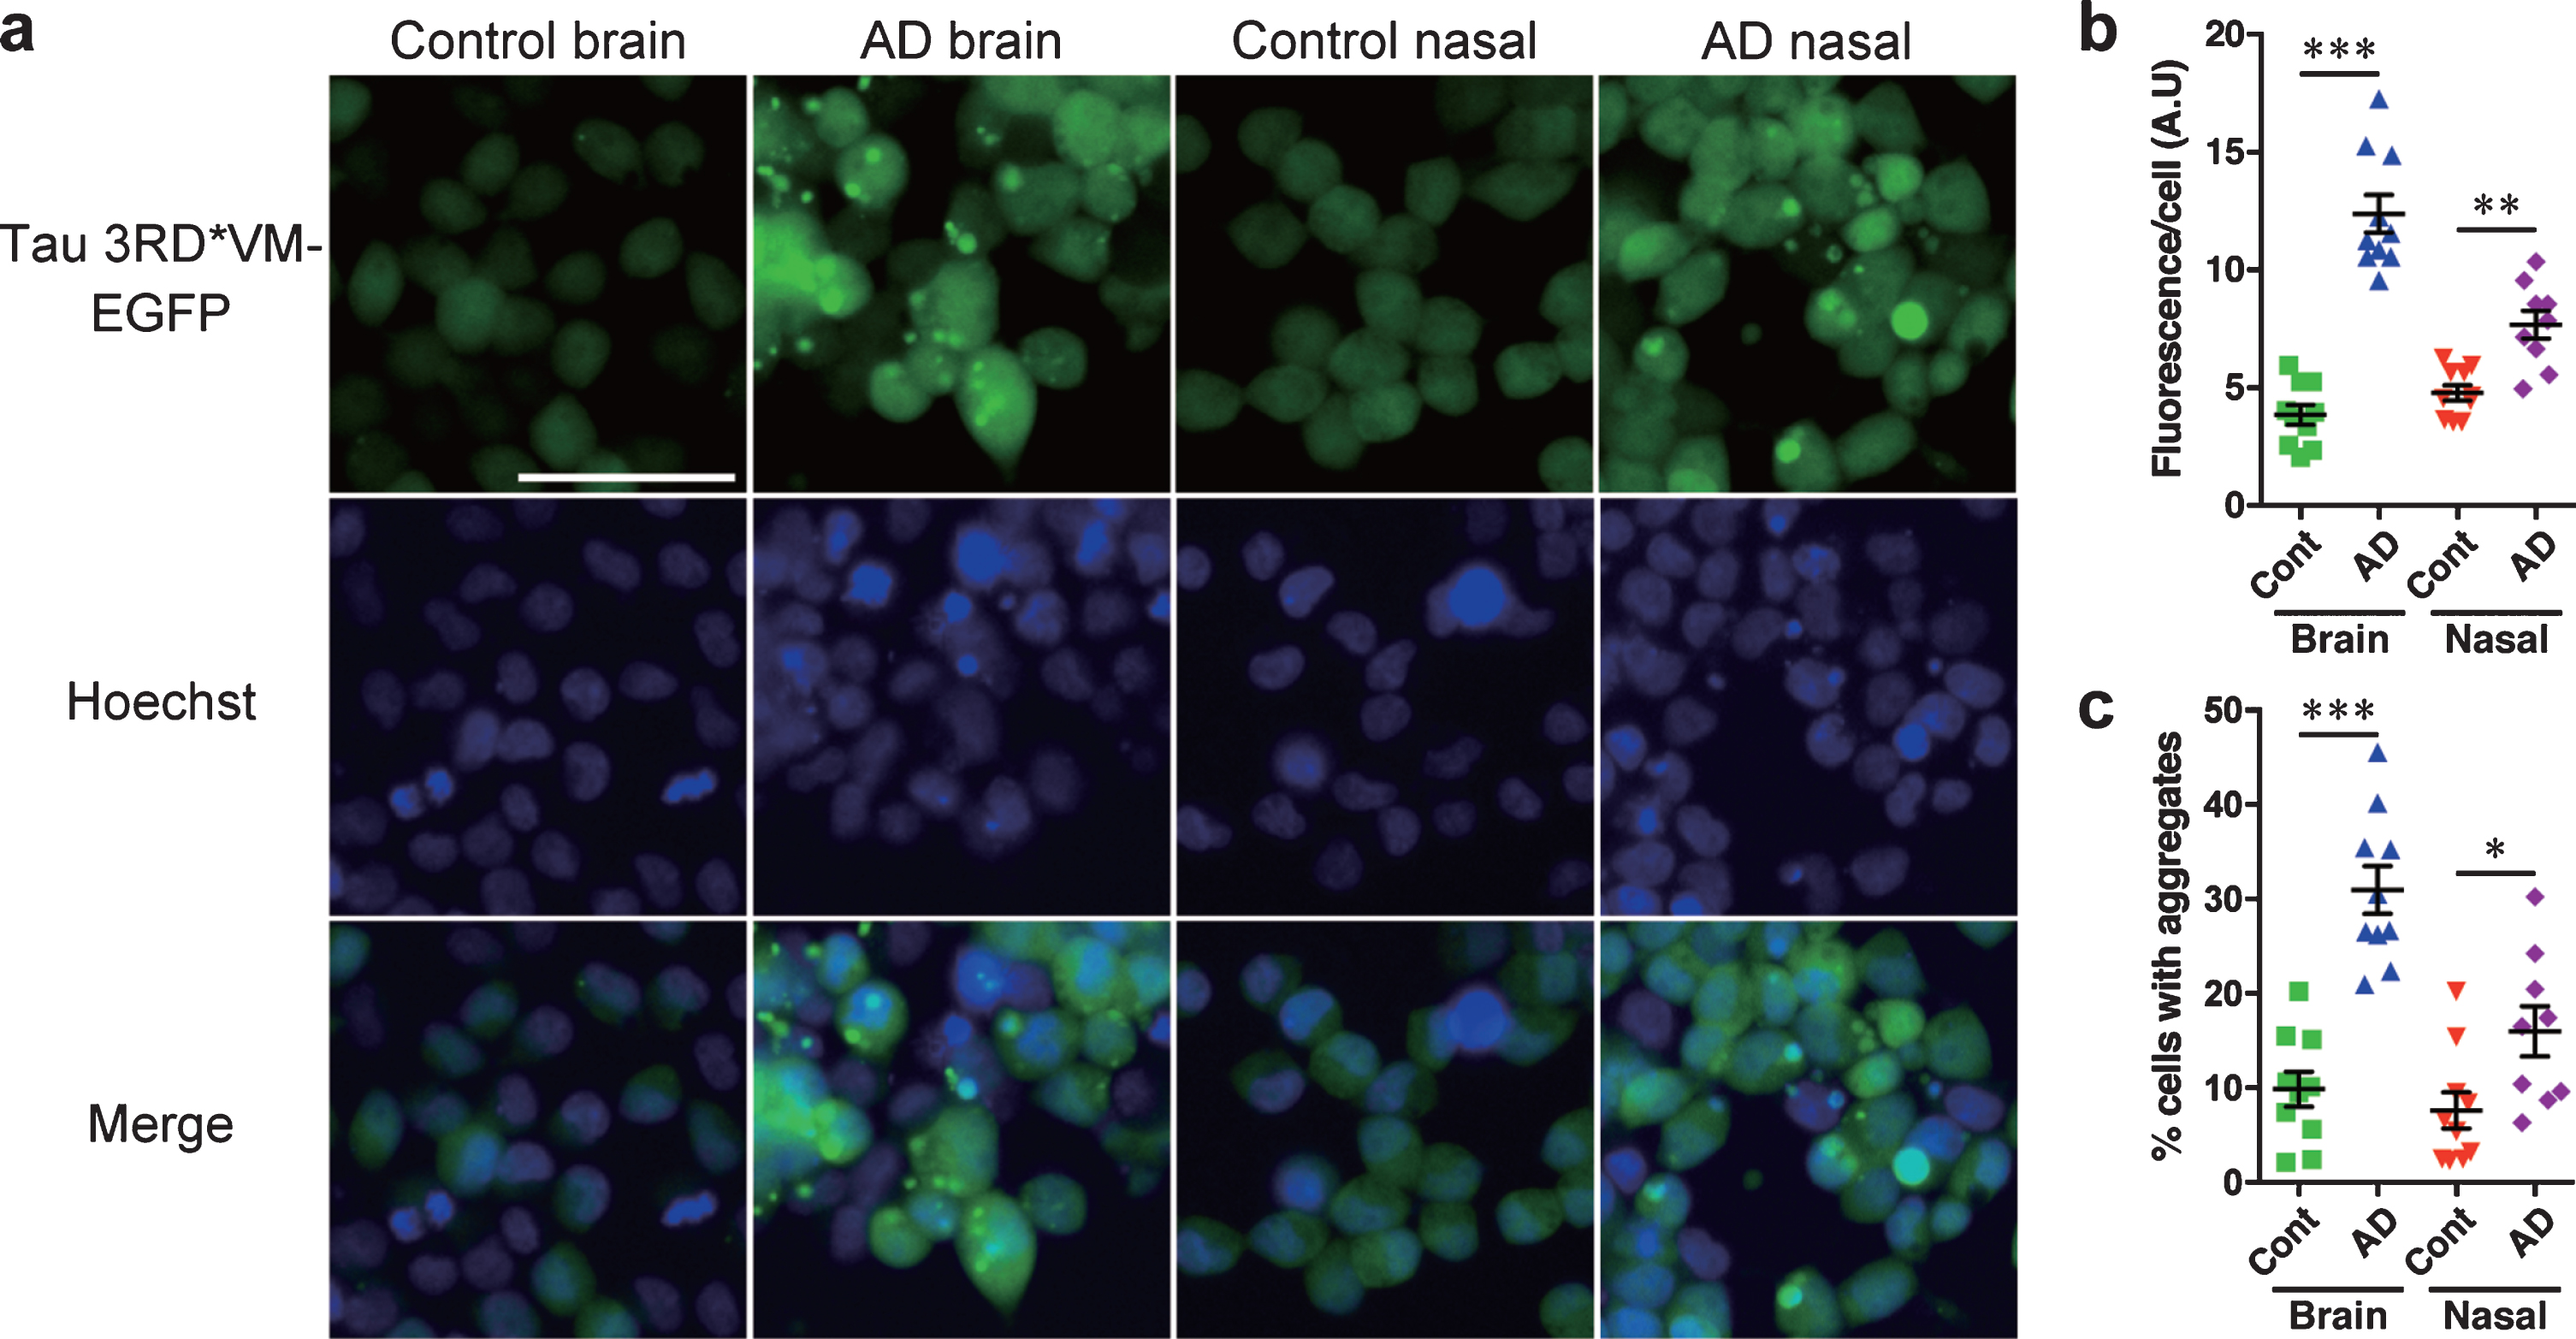
Fig. 4
HEK 293T cells stably expressing tau 4RD*LM-EGFP detect tau prions in the brain and nasal tissue homogenates from patients with AD. The same methods were applied as those described for HEK293T cells stably expressing tau 3RD*VM-EGFP. a) Representative images of HEK 293T cells expressing 4RD*LM-EGFP seeded with the brain and nasal tissue homogenates from control individuals and patients with AD. Scale bar = 50μm. Quantification of tau aggregation by (b) fluorescence per cell. Data are presented as the mean±SEM measured from ten samples per group, with the exception of AD nasal homogenates, for which nine samples were used, and (c) percentage of cells with aggregates. Data are presented as the mean±SEM measured from five images for each sample. **p < 0.001, ****p < 0.0001.
The level of phosphorylated tau was increased and the level of total tau was decreased in the brain tissue homogenates, with no changes observed in the nasal tissue homogenates of patients with AD
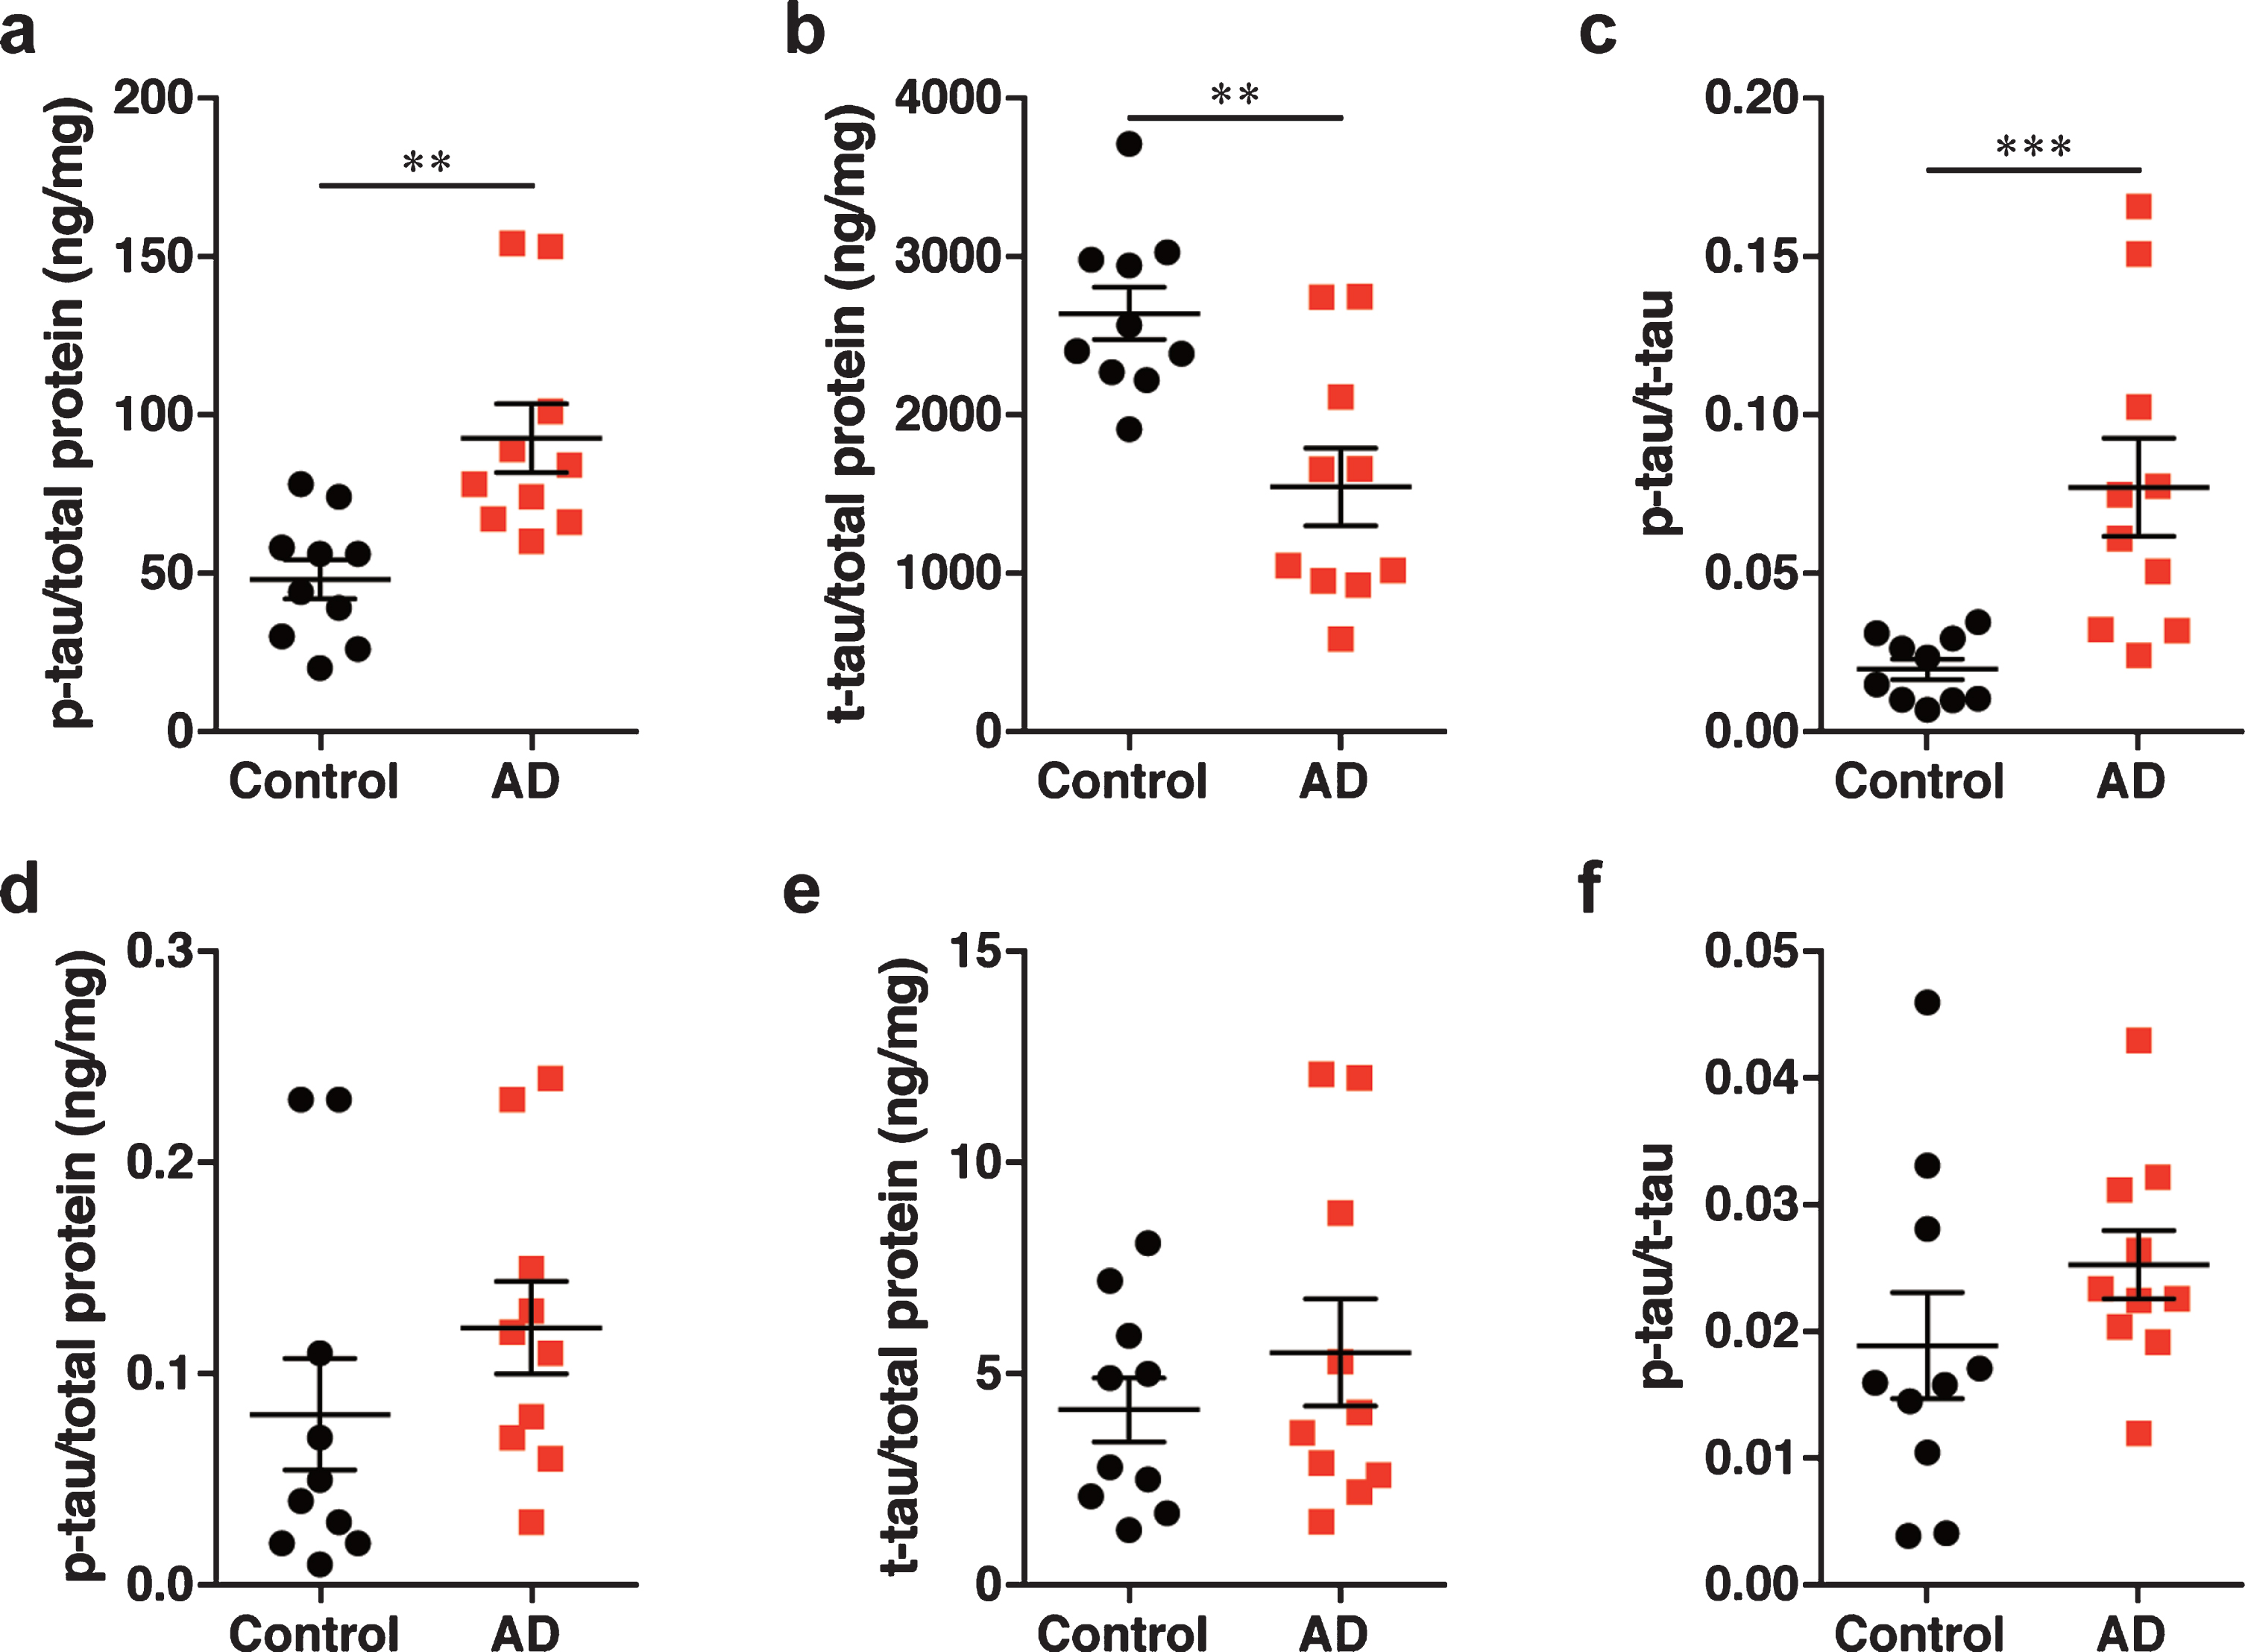
To validate the dependency of prion activity in the brain and nasal tissue homogenates on the level of p-tau, total tau (t-tau), an ELISA was carried out. We found that the levels of p-tau and t-tau in the brain tissue homogenates of patients with AD were significantly increased and decreased compared with control brain tissue homogenates respectively; therefore, the ratio of p-tau to t-tau (p-tau/t-tau ratio) in the brain tissue homogenates of patients with AD was significantly increased (Fig. 5a-c). In contrast, there was no significant difference in the levels of p-tau and t-tau and in the p-tau/t-tau ratio between the nasal tissue homogenates from patients with AD and controls (Fig. 5d-f). These results suggest that, although the nasal tissues exhibited prion activity, similar to the brain tissues, no changes observed in the levels of p-tau and t-tau in the nasal tissues.
Fig. 5
Determination of the levels of (a, d) p-tau and (b, e) t-tau and (c, f) the p-tau/t-tau ratio by ELISA in (a–c) the brain homogenates and (d–f) the nasal homogenates. Data are presented as the mean±SEM measured from triplicate experiments for each sample, with 10 samples per group. **p < 0.01, ***p < 0.001.
The tau prion activity in the nasal tissue homogenates was not associated with the tau prion activity in the brain tissue homogenates
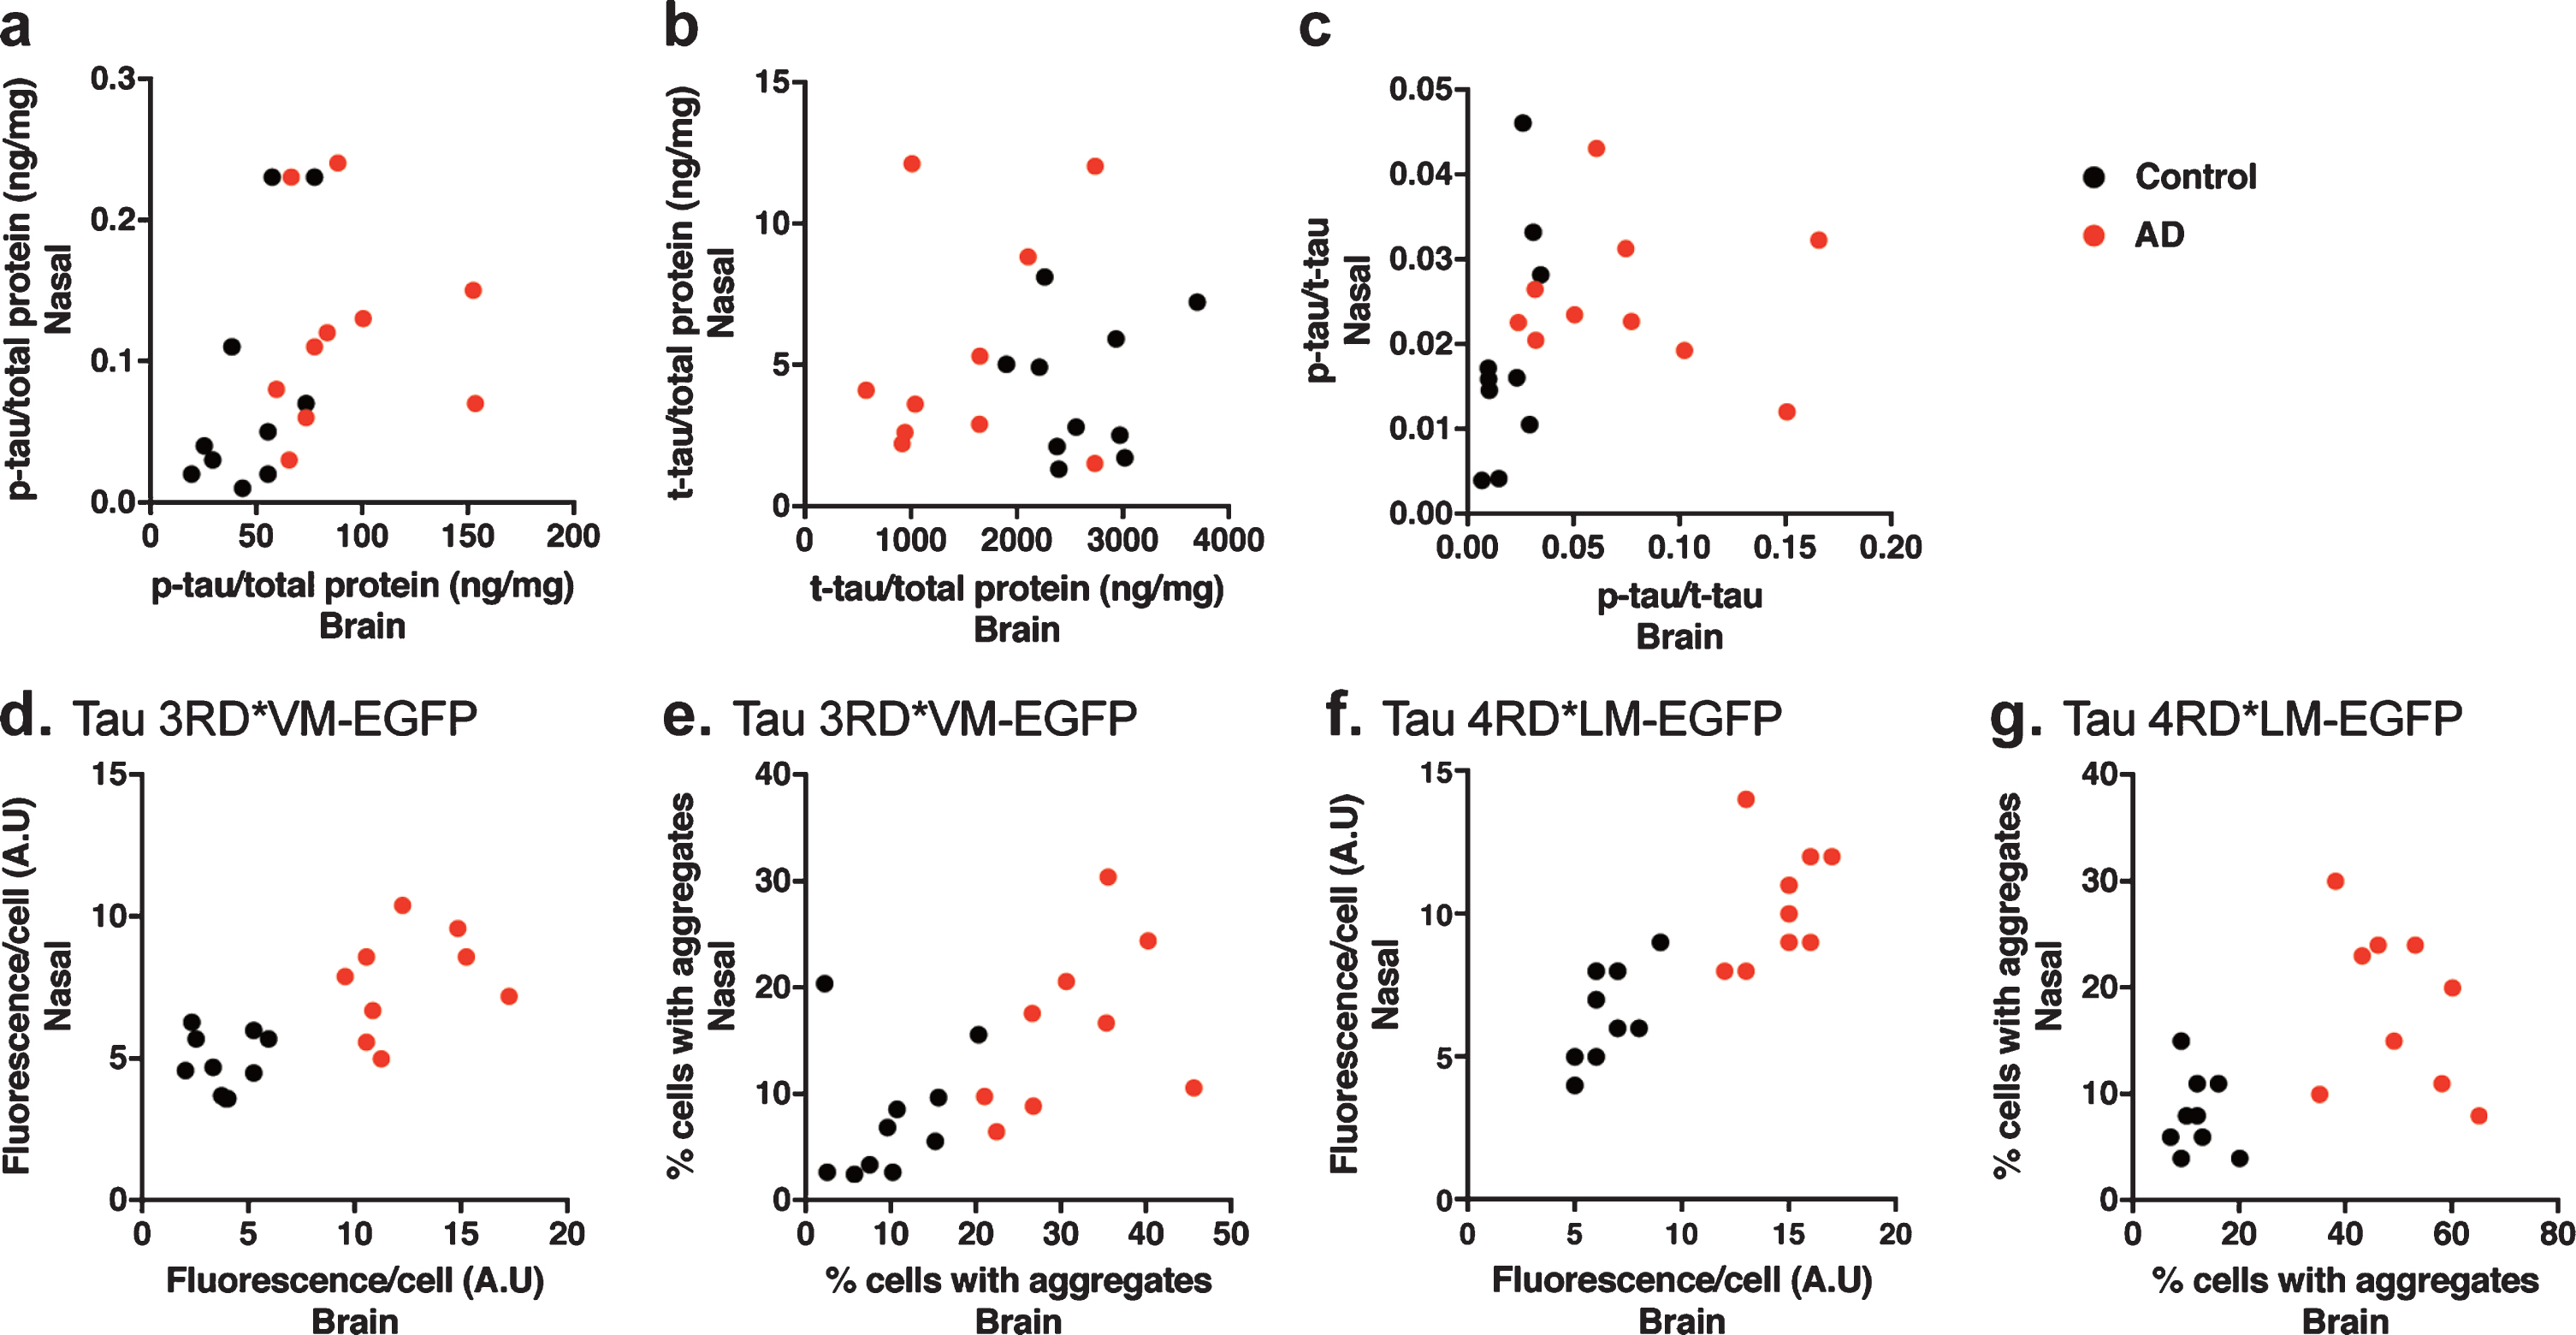
To determine the relationship between the tau prion activity in the nasal and brain tissue homogenates, we performed a correlation analysis. We found no significant correlation between the level of p-tau, t-tau, or p-tau/t-tau in the brain tissue homogenates and the level of p-tau, t-tau or p-tau/t-tau in the nasal tissue homogenates (Fig. 6a-c). Moreover, we also observed no significant correlation between the tau prion activity in the brain tissue homogenates and the tau prion activity in the nasal tissue homogenates in 3RD*VM-EGFP (Fig. 6d, e) or 4RD*LM-EGFP (Fig. 6f, g), measured by the fluorescence per cell or percentage of cells with aggregates.
Fig. 6
Correlation analysis to determine the dependency of the measured parameters in the brain and nasal samples. a) Correlation analysis of the level of p-tau. b) Correlation analysis of the level of t-tau. c) Correlation analysis of the p-tau/t-tau ratio. d, e) Correlation analysis of the prion seeding activity measured as fluorescence per cell or percentage of cells with aggregates in HEK 293T cells stably expressing tau 3RD*VM-EGFP. f, g) Correlation analysis of the prion seeding activity measured as fluorescence per cell or percentage of cells with aggregates in HEK 293T cells stably expressing tau 4RD*LM-EGFP. There were no correlations in the changes of tau levels and prion seeding activity between the brain and nasal tissue homogenates.
The tau prion activity was associated with the p-tau/t-tau ratio in the brain tissue homogenates
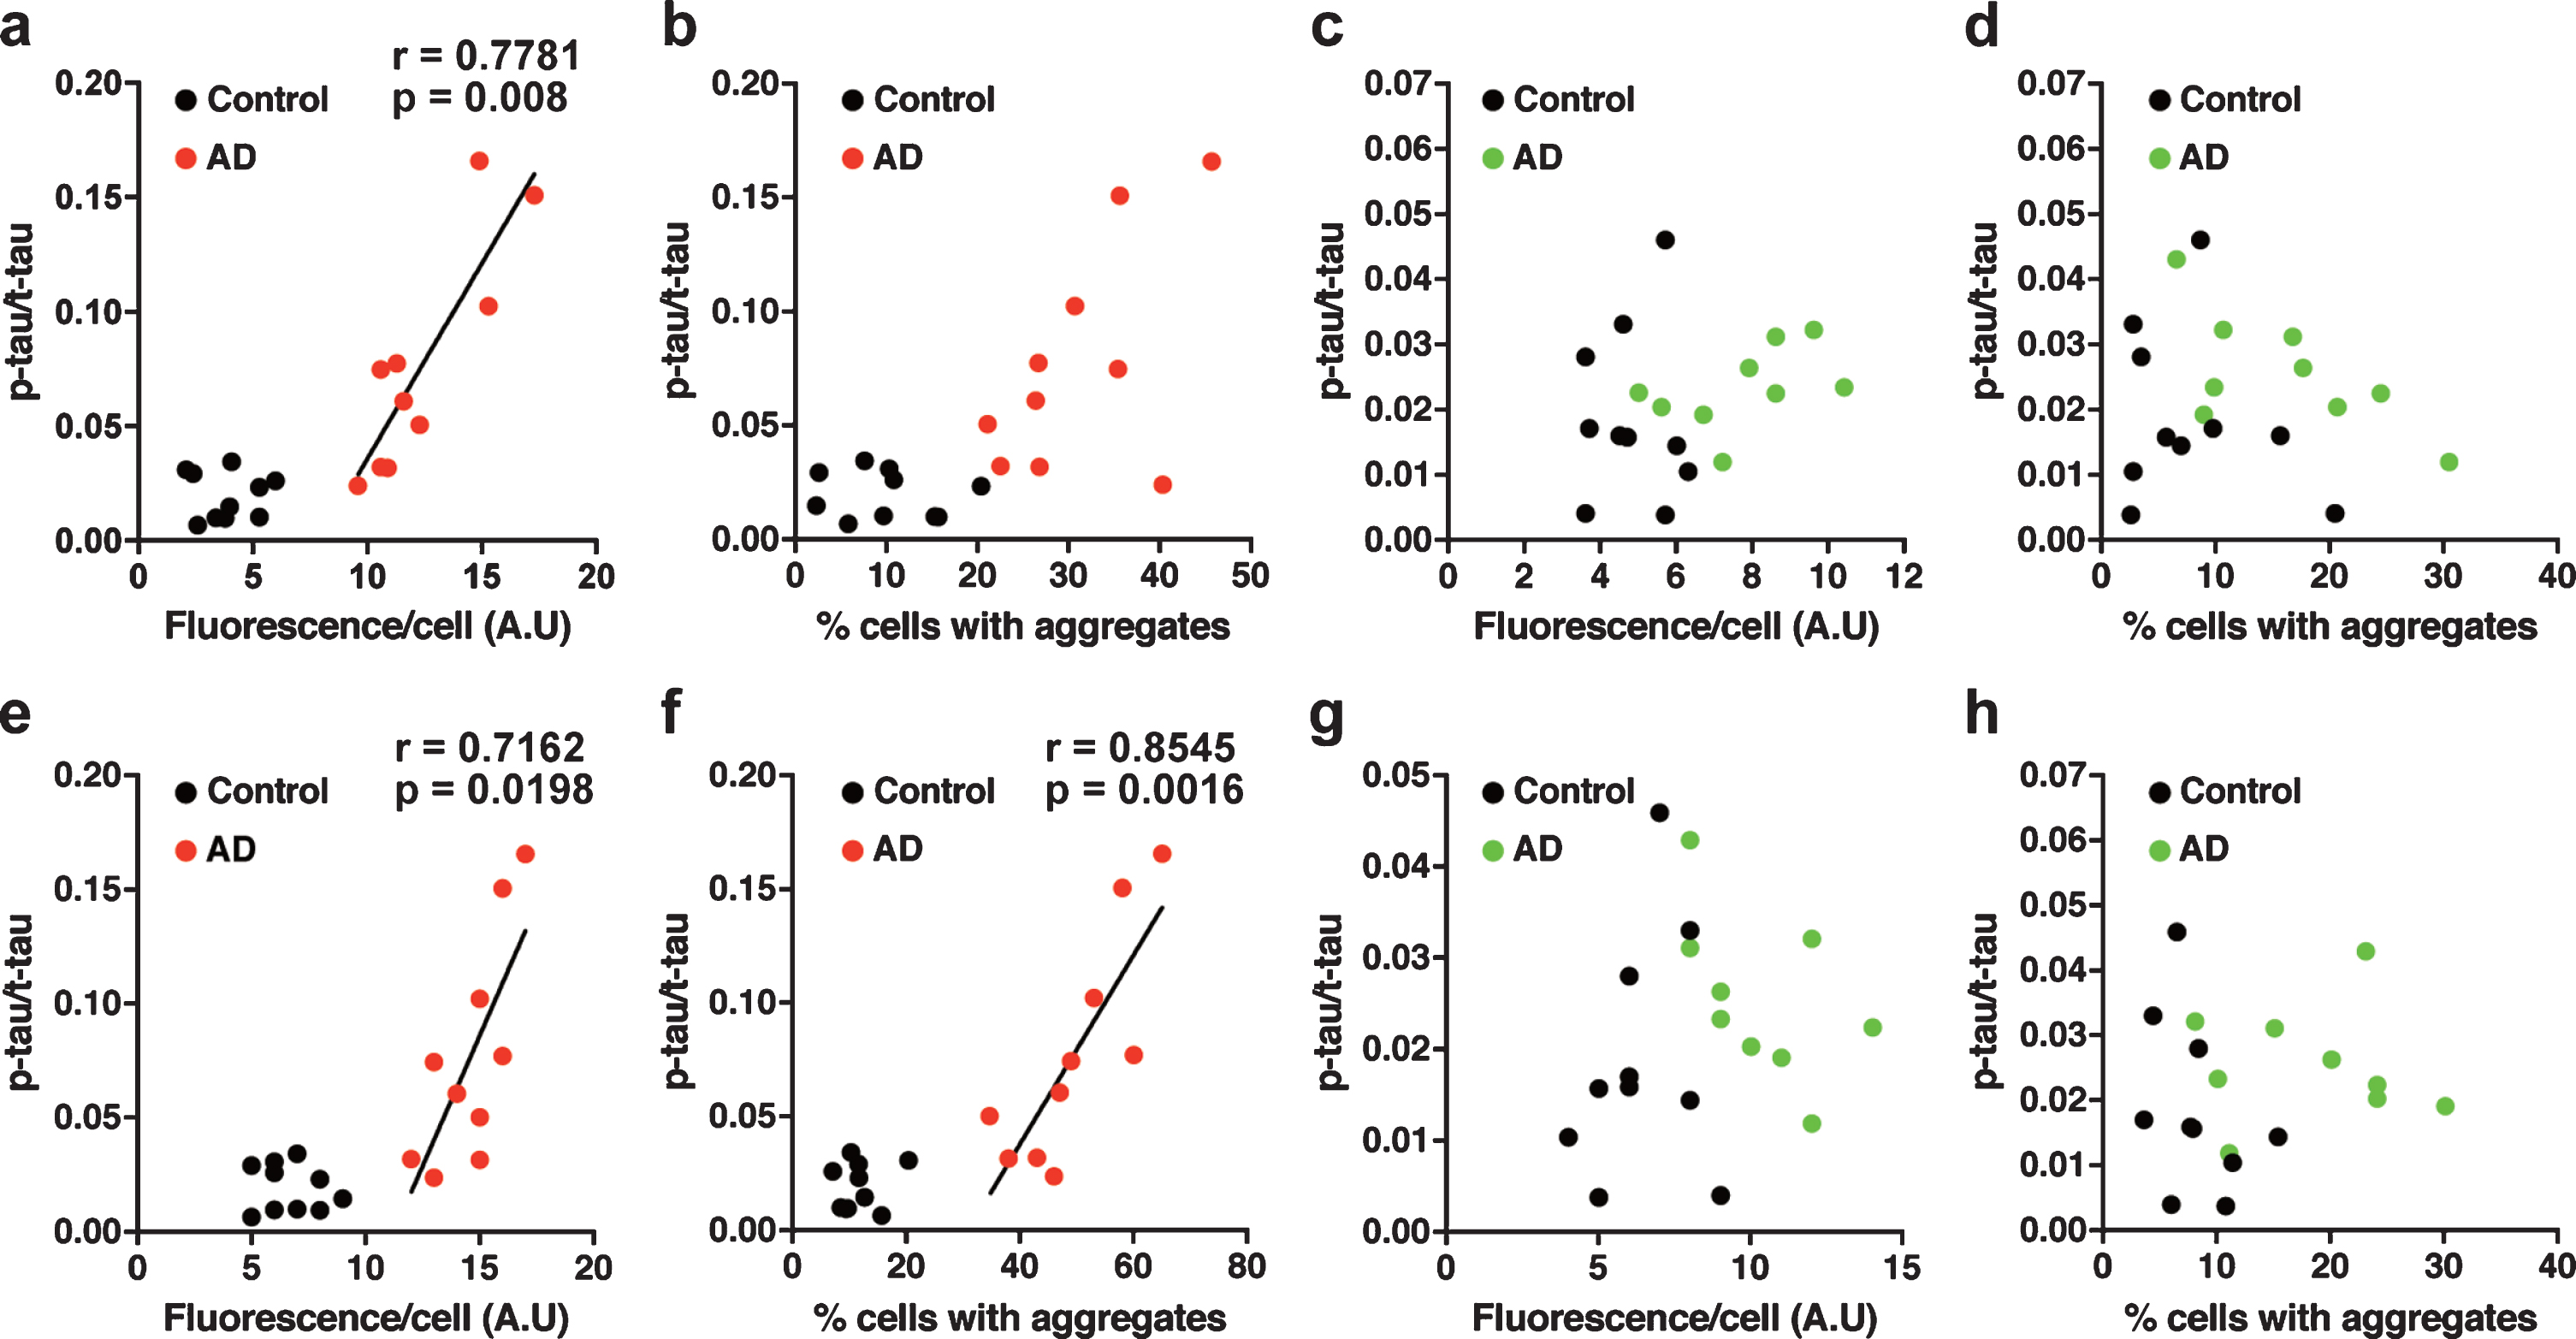
We further examined our data by performing a correlation analysis between tau prion activity and the level of tau in the nasal or brain tissue homogenates. In tau 3RD*VM-EGFP-expressing cells seeded with the brain samples, the tau prion activity (measured by fluorescence per cell) was strongly positively correlated with the p-tau/t-tau ratio levels in the AD group (Pearson’s r = 0.7781, p = 0.0080) (Fig. 7a). However, the prion activity (measured by percentage of cells with aggregates) did not show correlation with the p-tau/t-tau ratio (Fig. 7b). There was no correlation between the tau prion activity measured by fluorescence per cell or percentage of cells with aggregates and the level of p-tau/t-tau ratio in tau 3RD*VM-EGFP-expressing cells seeded with the nasal samples (Fig. 7c, d). Similar results were found for the tau 4RD*LM-EGFP-expressing cells seeded with the brain samples from patients with AD. The tau prion activity measured by fluorescence per cell (Pearson’s r = 0.7162, p = 0.0198) and percentage of cells with aggregates (Pearson’s r = 0.8545, p = 0.0016) had positive correlations with the p-tau/t-tau ratio (Fig. 7e, f). No correlation was observed between the tau prion activity and the p-tau/t-tau in tau 4RD*LM-EGFP-expressing cells seeded with the nasal samples (Fig. 7g, h). These results suggest that an imbalance between p-tau and t-tau, indicated by the high ratio of p-tau/t-tau, may predict an increase in tau prion activity in the brain but not in the nasal tissues of AD patients. Nevertheless, our study shows that the nasal tissues contain tau seeds and was propagated in the tau model of cellular bioassay in a similar way to the brain tissues from AD patients.
Fig. 7
Correlation analysis in HEK 293T cells stably expressing tau (a–d) 3RD*VM-EGFP and (e–h) 4RD*LM-EGFP for the determination of the dependency of the prion seeding activity measured as fluorescence per cell or percentage of cells with aggregates and the level of p-tau/t-tau ratio in the (a, b, e, f) brain samples and (c, d, g, h) nasal samples. The prion seeding activity measured as fluorescence per cell was significantly correlated with the p-tau/t-tau ratio only in the brain samples.
DISCUSSION
This study investigated the prion seeding activity of the nasal tissue homogenates using cell culture model of tau propagation. The nasal tissue homogenates, as well as the brain tissue homogenates, from patients with AD significantly induced the aggregation of tau compared with control tissue homogenates. In contrast, there was no significant difference in the levels of p-tau, t-tau and in the p-tau/t-tau ratio between the nasal tissue homogenates from patients with AD and control subjects. These results suggest that cellular bioassay using nasal tissues has great potential as an AD biomarker because of the usefulness of nasal tissue biopsy.
Initially, we developed HEK293T cells stably expressing tau 3RD*VM-EGFP or 4RD*LM-EGFP as cellular bioassay system and tested both cell types using the brain samples from control, AD, and PiD subjects, to establish the method. The results of this experiment showed that the AD and PiD brain samples alone induced tau aggregates in HEK293T cells stably expressing tau 3RD*VM-EGFP, indicating that both the AD and PiD brain samples contained tau prions. However, only brain samples from AD patients significantly induced tau aggregation in HEK 293T cells stably expressing tau 4RD*LM-EGFP. Previous studies showed that the Pick bodies that are present in PiD typically consist of the three repeat (3R) tau isoform [24], whereas the neurofibrillary tangles observed in AD exhibit aggregation of both the 3R and four repeat (4R) isoforms [25, 26]. Similar to our result, Woerman et al. [11] also demonstrated that the tau seeds extracted from a PiD brain infected HEK293T cells expressing tau 3RD*VM tagged with the yellow fluorescence protein (YFP), as indicated by the formation of tau aggregates. However, the tau seeds extracted from an AD brain were unable to infect the same cells or cells expressing tau 4RD*LM-YFP; rather, tau aggregation occurred only in HEK293T cells expressing tau (3RD*VM,4RD*LM)-YFP [11]. In contrast, Sanders et al. [14] showed that the tau seeds extracted from PiD or AD brains were able to infect HEK293T cells expressing tau 4RD(wild type)-YFP. The discrepancy of these findings may be due to the differences in the methods used. The crude homogenates and not the specific tau fibrils isolated from the brain and cell system in expressing only the repeat domains of tau, not the full length of tau, was used to test the tau prion seeding activity in the present study. Conclude that different samples with the same disease might contain distinct 3R and 4R prions and that different panel of cells might have different sensitivity regarding the detection of the presence of tau prions.
Based on the same experimental approach, we then tested the cell system developed in this study using the brain and nasal samples from patients with AD. We found that the nasal tissue homogenates from patients with AD induced tau aggregation in HEK293T cells stably expressing tau 3RD*VM-EGFP or 4RD*LM-EGFP, similar to the brain tissue homogenates from the same patient samples, thus indicating the presence of tau prion activity in the nasal and brain tissue homogenates from patients with AD. However, the levels of p-tau and the p-tau/t-tau ratio, as assessed by ELISA, were significantly elevated in the brain tissue homogenates but remained unchanged in the nasal tissue homogenates compared with their respective controls. In contrast with our findings, a previous preliminary study of 25 AD subjects among whom 20 individuals exhibited an olfactory impairment reported that the levels of t-tau and p-tau in the nasal secretion were significantly higher compared with the control [27]. Our previous study of 25 AD subjects also showed significant changes in the t-tau and p-tau levels, and, consequently, a high p-tau/t-tau ratio in the nasal cavity compared with age-matched controls when measured using methods with high sensitivity, such as pre-treatment of the nasal samples with guanidine-n-dodecyl-beta-d-maltoside (PGD) prior to detection by ELISA [20]. The significant changes in the level of tau in nasal samples were not observed in our study, probably because of differences in the properties of the samples used here, as the nasal mucosa was obtained from autopsy rather than biopsy. The difference in the sample processing prior to ELISA would also contribute to these discrepancies. The small number of samples (n = 10) and low sensitivity of the ELISA method used here might also have contributed to this poor level of significant differences. Nevertheless, the cellular bioassay confirmed the presence of tau prions in the nasal homogenates, similar to the brain, thus suggesting an alternative potential method for measuring AD biomarkers using nasal tissue biopsy.
In the present study, we prepared brain extracts using a unique method that was optimized for the nasal swab in our previous study [20], which showed that there are decreased levels of total tau in the AD brain. A number of studies have reported the levels of total tau in AD brains; however, discrepancies exist among the results of these studies. For example, decreased levels of total tau were observed in detergent-free extracts of AD brains [28, 29], whereas several studies have reported increased levels of total tau in the extracts with and without detergents from AD brains [30–32]. Furthermore, other studies have reported differences in changes of the levels of total tau between the brain regions of AD brains [33–35]. According to these findings, it is likely that the levels of total tau in the AD brain would depend on the extraction procedures and the brain regions, which might seem puzzling. In the last decade, most cases of AD were associated with olfactory dysfunction, which is characterized as an early marker of AD [36]. A study of 60 patients with AD reported that the olfactory dysfunction was correlated with the cognitive levels and, thus, might be an indicator of pathological cognitive decline [37]. In addition, the olfactory bulb and olfactory projection area in patients with AD were associated with the neurotic changes of the tau protein [38]; moreover, the olfactory tau was highly significantly correlated with neuritic Braak staging in the brain [38, 39]. These findings led us to raise the question of whether a relationship exists between the tau level or tau prions detected in the brain and the nasal mucosa of patients with AD. However, we failed to observe any relationship between these parameters, perhaps because of the small sample size. Nevertheless, we found a significant relationship between the tau prions activity and the p-tau/t-tau ratio in the brain, indicating that tau prions might be predictive on the imbalance between p-tau and t-tau.
In addition to the small number of samples, this study had other limitations. First, the cell system used in this study was focused on cells expressing either the tau 3R or 4R isoform. The cell system co-expressing both 3R and 4R was not measured. This may provide a better reflection of the cellular bioassay system as the AD brain exhibits aggregation of both tau isoforms. Second, crude homogenates, and not the specific tau fibrils isolated from the brain, were used to test the tau prion seeding activity. Third, the tau aggregation measured in this study was limited to the fluorescence intensity and the counting of cells with tau puncta in the cell imaging with no further validation of the biochemical properties of the tau aggregates formed in the cells. This is because the cell system in this study was expressing only the repeat domains of tau, not the full length of tau. There are limited available antibodies that recognize p-tau within the repeat domains of tau; therefore, these cell systems are not validated to quantify tau aggregation in living cells. Finally, characterization of the nasal-induced aggregates is a critical issue to validate prion activity in the nasal tissues; however, further characterization of nasal prions is left for future work.
In conclusion, our results suggest that a cellular bioassay using nasal tissues has great potential as an AD biomarker because of the usefulness of nasal tissue biopsy and would provide an important contribution to the development of ex vivo diagnosis method for AD using the nasal tissues.
CONFLICT OF INTEREST
This research was supported by Daiichi Sankyo Co. Ltd.
ACKNOWLEDGMENTS
This research was supported by Daiichi Sankyo Co. Ltd, and JSPS KAKENHI Grant Number JP20K20588 (I.T.). We thank staffs of Central Research Laboratory, Shiga University of Medical Science for their technical assistance.
REFERENCES
[1] | Collinge J , Sidle KCL , Meads J , Ironside J , Hill AF ((1996) ) Molecular analysis of prion strain variation and the aetiology of “new variant” CJD. Nature 383: , 685–690. |
[2] | Borchelt DR , Scott M , Taraboulos A , Stahl N , Prusiner SB ((1990) ) Scrapie and cellular prion proteins differ in their kinetics of synthesis and topology in cultured cells. J Cell Biol 110: , 743–752. |
[3] | Caughey B , Raymond GJ ((1991) ) The scrapie-associated form of PrP is made from a cell surface precursor that is both protease- and phospholipase-sensitive. J Biol Chem 266: , 18217–18223. |
[4] | Reiniger L , Lukic A , Linehan J , Rudge P , Collinge J , Mead S , Brandner S ((2011) ) Tau, prions and Aβ: The triad of neurodegeneration. Acta Neuropathol 121: , 5–20. |
[5] | Castilla J , Saá P , Hetz C , Soto C ((2005) ) In vitro generation of infectious scrapie prions. Cell 121: , 195–206. |
[6] | Büeler H , Aguzzi A , Sailer A , Greiner RA , Autenried P , Aguet M , Weissmann C ((1993) ) Mice devoid of PrP are resistant to scrapie. Cell 73: , 1339–1347. |
[7] | Braak H , Braak E ((1991) ) Neuropathological stageing of Alzheimer-related changes. Acta Neuropathol 82: , 239–259. |
[8] | Saito Y , Ruberu NN , Sawabe M , Arai T , Tanaka N , Kakuta Y , Yamanouchi H , Murayama S ((2004) ) Staging of argyrophilic grains: An age-associated tauopathy. J Neuropathol Exp Neurol 63: , 911–918. |
[9] | McKee AC , Stern RA , Nowinski CJ , Stein TD , Alvarez VE , Daneshvar DH , Lee H-S , Wojtowicz SM , Hall G , Baugh CM , Riley DO , Kubilus CA , Cormier KA , Jacobs MA , Martin BR , Abraham CR , Ikezu T , Reichard RR , Wolozin BL , Budson AE , Goldstein LE , Kowall NW , Cantu RC ((2013) ) The spectrum of disease in chronic traumatic encephalopathy. Brain 136: , 43–64. |
[10] | Varghese M , Santa-Maria I , Ho L , Ward L , Yemul S , Dubner L , Ksieżak-Reding H , Pasinetti GM ((2016) ) Extracellular tau paired helical filaments differentially affect tau pathogenic mechanisms in mitotic and post-mitotic cells: Implications for mechanisms of tau propagation in the brain. J Alzheimers Dis 54: , 477–496. |
[11] | Woerman AL , Aoyagi A , Patel S , Kazmi SA , Lobach I , Grinberg LT , McKee AC , Seeley WW , Olson SH , Prusiner SB ((2016) ) Tau prions from Alzheimer’s disease and chronic traumatic encephalopathy patients propagate in cultured cells. Proc Natl Acad Sci U S A 113: , E8187–E8196. |
[12] | Clavaguera F , Tolnay M , Goedert M ((2017) ) The prion-like behavior of assembled tau in transgenic mice. Cold Spring Harb Perspect Med 7: , a024372. |
[13] | Falcon B , Cavallini A , Angers R , Glover S , Murray TK , Barnham L , Jackson S , O’Neill MJ , Isaacs AM , Hutton ML , Szekeres PG , Goedert M , Bose S ((2015) ) Conformation determines the seeding potencies of native and recombinant Tau aggregates. J Biol Chem 290: , 1049–1065. |
[14] | Sanders DW , Kaufman SK , DeVos SL , Sharma AM , Mirbaha H , Li A , Barker SJ , Foley AC , Thorpe JR , Serpell LC , Miller TM , Grinberg LT , Seeley WW , Diamond MI ((2014) ) Distinct tau prion strains propagate in cells and mice and define different tauopathies. Neuron 82: , 1271–1288. |
[15] | Kfoury N , Holmes BB , Jiang H , Holtzman DM , Diamond MI ((2012) ) Trans-cellular propagation of Tau aggregation by fibrillar species. J Biol Chem 287: , 19440–19451. |
[16] | Wu JW , Hussaini SA , Bastille IM , Rodriguez GA , Mrejeru A , Rilett K , Sanders DW , Cook C , Fu H , Boonen RACM , Herman M , Nahmani E , Emrani S , Figueroa YH , Diamond MI , Clelland CL , Wray S , Duff KE ((2016) ) Neuronal activity enhances tau propagation and tau pathology in vivo. Nat Neurosci 19: , 1085–1092. |
[17] | Matsumoto G , Matsumoto K , Kimura T , Suhara T , Higuchi M , Sahara N , Mori N ((2018) ) Tau fibril formation in cultured cells compatible with a mouse model of tauopathy. Int J Mol Sci 19: , 1497. |
[18] | Guo JL , Buist A , Soares A , Callaerts K , Calafate S , Stevenaert F , Daniels JP , Zoll BE , Crowe A , Brunden KR , Moechars D , Lee VMY ((2016) ) The dynamics and turnover of tau aggregates in cultured cells: Insights into therapies for tauopathies. J Biol Chem 291: , 13175–13193. |
[19] | Takeda S ((2019) ) Tau propagation as a diagnostic and therapeutic target for dementia: Potentials and unanswered questions. Front Neurosci 13: , 1274. |
[20] | Liu Z , Kameshima N , Nanjo T , Shiino A , Kato T , Shimizu S , Shimizu T , Tanaka S , Miura K , Tooyama I ((2018) ) Development of a high-sensitivity method for the measurement of human nasal Aβ42, tau, and phosphorylated tau. J Alzheimers Dis 62: , 737–744. |
[21] | Li B , Chohan MO , Grundke-Iqbal I , Iqbal K ((2007) ) Disruption of microtubule network by Alzheimer abnormally hyperphosphorylated tau. Acta Neuropathol 113: , 501–511. |
[22] | Alonso AC , Zaidi T , Grundke-Iqbal I , Iqbal K ((1994) ) Role of abnormally phosphorylated tau in the breakdown of microtubules in Alzheimer disease. Proc Natl Acad Sci U S A 91: , 5562–5566. |
[23] | Iqbal K , Grundke-Iqbal I , Zaidi T , Merz PA , Wen GY , Shaikh SS , Wisniewski HM , Alafuzoff I , Winblad B ((1986) ) Defective brain microtubule assembly in Alzheimer’s disease. Lancet 2: , 421–426. |
[24] | Delacourte A , Robitaille Y , Sergeant N , Buée L , Hof PR , Wattez A , Laroche-Cholette A , Mathieu J , Chagnon P , Gauvreau D ((1996) ) Specific pathological tau protein variants characterize Pick’s disease. J Neuropathol Exp Neurol 55: , 159–168. |
[25] | Goedert M , Klug A , Crowther RA ((2006) ) Tau protein, the paired helical filament and Alzheimer’s disease. J Alzheimers Dis 9: , 195–207. |
[26] | Schmidt M , Zhukareva V , Newell K , Lee V , Trojanowski J ((2001) ) Tau isoform profile and phosphorylation state in dementia pugilistica recapitulate Alzheimer’s disease. Acta Neuropathol 101: , 518–524. |
[27] | Passali GC , Politi L , Crisanti A , Loglisci M , Anzivino R , Passali D ((2015) ) Tau protein detection in anosmic Alzheimer’s disease patient’s nasal secretions. Chem Percept 8: , 201–206. |
[28] | Ksiezak-Reding H , Binder LI , Yen SH ((1988) ) Immunochemical and biochemical characterization of tau proteins in normal and Alzheimer’s disease brains with Alz 50 and Tau-1. J Biol Chem 263: , 7948–7953. |
[29] | Khatoon S , Grundke-Iqbal I , Iqbal K ((1994) ) Levels of normal and abnormally phosphorylated tau in different cellular and regional compartments of Alzheimer disease and control brains. FEBS Lett 351: , 80–84. |
[30] | Wood JG , Mirra SS , Pollock NJ , Binder LI ((1986) ) Neurofibrillary tangles of Alzheimer disease share antigenic determinants with the axonal microtubule-associated protein tau (tau). Proc Natl Acad Sci U S A 83: , 4040–4043. |
[31] | Khatoon S , Grundke-Iqbal I , Iqbal K ((1992) ) Brain levels of microtubule-associated protein tau are elevated in Alzheimer’s disease: A radioimmuno-slot-blot assay for nanograms of the protein. J Neurochem 59: , 750–753. |
[32] | Gourmaud S , Shou H , Irwin DJ , Sansalone K , Jacobs LM , Lucas TH , Marsh ED , Davis KA , Jensen FE , Talos DM ((2020) ) Alzheimer-like amyloid and tau alterations associated with cognitive deficit in temporal lobe epilepsy. Brain 143: , 191–209. |
[33] | Tremblay C , Pilote M , Phivilay A , Emond V , Bennett DA , Calon F ((2007) ) Biochemical characterization of Abeta and tau pathologies in mild cognitive impairment and Alzheimer’s disease. J Alzheimers Dis 12: , 377–390. |
[34] | Mukaetova-Ladinska EB , Abdel-All Z , Mugica ES , Li M , Craggs LJL , Oakley AE , Honer WG , Kalaria RN ((2015) ) Tau proteins in the temporal and frontal cortices in patients with vascular dementia. J Neuropathol Exp Neurol 74: , 148–157. |
[35] | Han P , Serrano G , Beach TG , Caselli RJ , Yin J , Zhuang N , Shi J ((2017) ) A quantitative analysis of brain soluble tau and the tau secretion factor. J Neuropathol Exp Neurol 76: , 44–51. |
[36] | Escada PA , Lima C , da Silva JM ((2009) ) The human olfactory mucosa. Eur Arch Otorhinolaryngol 266: , 1675–1680. |
[37] | Lian T-H , Zhu W-L , Li S-W , Liu Y-O , Guo P , Zuo L-J , Hu Y , Yu S-Y , Li L-X , Jin Z , Yu Q-J , Wang R-D , Zhang W ((2019) ) Clinical, structural, and neuropathological features of olfactory dysfunction in patients with Alzheimer’s disease. J Alzheimers Dis 70: , 413–423. |
[38] | Attems J , Jellinger KA ((2006) ) Olfactory tau pathology in Alzheimer disease and mild cognitive impairment. Clin Neuropathol 25: , 265–271. |
[39] | Tsuboi Y , Wszolek ZK , Graff-Radford NR , Cookson N , Dickson DW ((2003) ) Tau pathology in the olfactory bulb correlates with Braak stage, Lewy body pathology and apolipoprotein epsilon4. Neuropathol Appl Neurobiol 29: , 503–510. |


