
Neural Mechanisms of Motor Dysfunction in Mild Cognitive Impairment and Alzheimer’s Disease: A Systematic Review
Abstract
Background:
Despite the prevalence of motor symptoms in mild cognitive impairment (MCI) and Alzheimer’s disease (AD), their underlying neural mechanisms have not been thoroughly studied.
Objective:
This review summarizes the neural underpinnings of motor deficits in MCI and AD.
Methods:
We searched PubMed up until August of 2021 and identified 37 articles on neuroimaging of motor function in MCI and AD. Study bias was evaluated based on sample size, availability of control samples, and definition of the study population in terms of diagnosis.
Results:
The majority of studies investigated gait, showing that slower gait was associated with smaller hippocampal volume and prefrontal deactivation. Less prefrontal activation was also observed during cognitive-motor dual tasking, while more activation in cerebellar, cingulate, cuneal, somatosensory, and fusiform brain regions was observed when performing a hand squeezing task. Excessive subcortical white matter lesions in AD were associated with more signs of parkinsonism, poorer performance during a cognitive and motor dual task, and poorer functional mobility. Gait and cognitive dual-tasking was furthermore associated with cortical thickness of temporal lobe regions. Most non-gait motor measures were only reported in one study in relation to neural measures.
Conclusion:
Cross-sectional designs, lack of control groups, mixing amnestic- and non-amnestic MCI, disregard of sex differences, and small sample sizes limited the interpretation of several studies, which needs to be addressed in future research to progress the field.
INTRODUCTION
The most prevalent and well-known symptoms of Alzheimer’s disease (AD) and its precursor amnestic mild cognitive impairment (aMCI) [1] are cognitive deficits, specifically memory problems. A substantial number of studies have shown that motor behavioral deficits are common in aMCI and AD as well [2]. These motor deficits include slowing of gait [3], declines in functional mobility [4], reduced grip strength [5], poor balance [6], slower finger tapping speed [7], and poor manual dexterity [8]. Such motor problems are relatively common, with gait dysfunction occurring in over 30% of individuals with aMCI [9]. Furthermore, studies in healthy older adults show that slow gait and balance are related to biomarkers of AD, including increased amyloid burden [10, 11] and smaller hippocampal volume [12–14], which suggests that motor dysfunction in MCI and AD may be directly related to AD pathology. Longitudinal studies have indicated that motor dysfunction predicts incident dementia [15] and can precede cognitive deterioration [16]. As such, motor measures could be early predictors of aMCI and AD that could augment the diagnostic process or be used to enrich clinical trials [17].
Despite the prevalence of motor symptoms in aMCI and AD, their underlying neural mechanisms have not been thoroughly studied. Most research that applies neuroimaging methods to investigate the relationship between neural and motor differences in AD use single-domain motor measures and relate motor outcomes to just one neuroimaging modality (e.g., gray matter volume, or white matter lesions (WML)). Given the paucity of literature that have comprehensively studied brain-motor relationships, the current review might begin to reveal recurring patterns of these relationships. For instance, such a review could help in understanding if motor deficits are linked to one or more specific types of neuropathology (e.g., gray matter atrophy, small vessel disease, or amyloid deposition), if this pathology is a global phenomenon or is manifested regionally (e.g., hippocampal atrophy versus atrophy of the primary motor cortex), and if the associations rely on the type and subtype of motor behavior (e.g., grip force strength versus gait speed versus gait swing time). Contrasting such knowledge to what is already known about the neural mechanisms of memory and executive dysfunction could further help us to understand if cognitive and motor dysfunction in aMCI and AD is an expression of the same underlying neuropathology, or if these deficits are (partly) independent phenomena.
In this systematic review, research was summarized that reported on the association between measures spanning the breadth of motor behavior and neural structural and functional measures obtained by magnetic resonance imaging (MRI), functional near-infrared spectroscopy (fNIRS), and positron emission tomography (PET) to provide an overview of the neural mechanisms that underlie motor deficits in MCI and AD. Studying the link between motor deficits and neural degeneration may begin to identify if cognitive and motor deterioration are different symptoms of the same neuropathological substrate. Providing a better understanding of this relationship will aid in selecting candidate measures that have a high likelihood to be early independent markers of MCI and AD which would have value in clinical and research settings.
METHODS
Search methods
PubMed was searched on August 26, 2021 for articles in the English language. A search query was built to extract articles that combine research on a) MCI and/or AD (keywords: MCI, “mild cognitive impairment”, and Alzheimer); b) motor behavioral assessments (keywords: “muscle strength”, “grip strength”, “isokinetic strength”, “vertical jump”, “motor speed”, “tapping speed”, “motor coordination”, dexterity, bimanual, “finger tapping”, “foot tapping”, “motor skill”, “motor function”, “motor performance”, “motor adaptation”, “Purdue pegboard”, “grooved pegboard”, “Archimedes spiral”, gait, walk, “timed up and go”, TUG, “walking while talking”, “dual task”, mobility, balance, Romberg, “sensory organization”, “sensory organisation”, vestibular, “motor sequence learning”, “motor learning”, “serial reaction time task”, stride); and c) neuroimaging (keywords: PET, “positron emission tomography”, “magnetic resonance imaging”, MRI, fMRI, fcMRI, “functional connectivity”, “diffusion weighted imaging”, DWI, “diffusion tensor imaging”, DTI, “near infrared spectroscopy”, NIRS, fNIRS, “brain structure”, “brain function”, “brain volume”, “volumetric”). The exact search query can be found in Supplementary Material 1. Note that we focused only on objectively measured motor performance and not on self-report measures such as questionnaires on activities of daily living.
Study selection
Author VK reviewed all results from the PubMed query. Studies were selected that reported on group (i.e., MCI and/or AD versus control participants) by brain (measures of brain structure/function) interaction on motor behavior (see Fig. 1A). Describing these interactions can improve our understanding of the potential causal role of Alzheimer’s neuropathology such as hippocampal degeneration on motor dysfunction.
Fig. 1
Schematic overview of analysis models of studies for which motor behavioral data and brain structural or functional data were collected from individuals with AD pathology. Here we review studies that report on the interaction between group and brain structure/function on motor behavior (A). We also report on studies that collected data on an MCI/AD and a control group but report the association between brain volume on motor performance stratified by group (B), and studies that report the association between brain volume on motor performance in MCI/AD participants without including a control group (C). We do not include studies that collected data on an MCI/AD and a control group, but only report the association between brain volume on motor performance for the entire sample combined (D), or studies that report group differences in (E) motor behavior and (F) brain structure/function without describing their association.
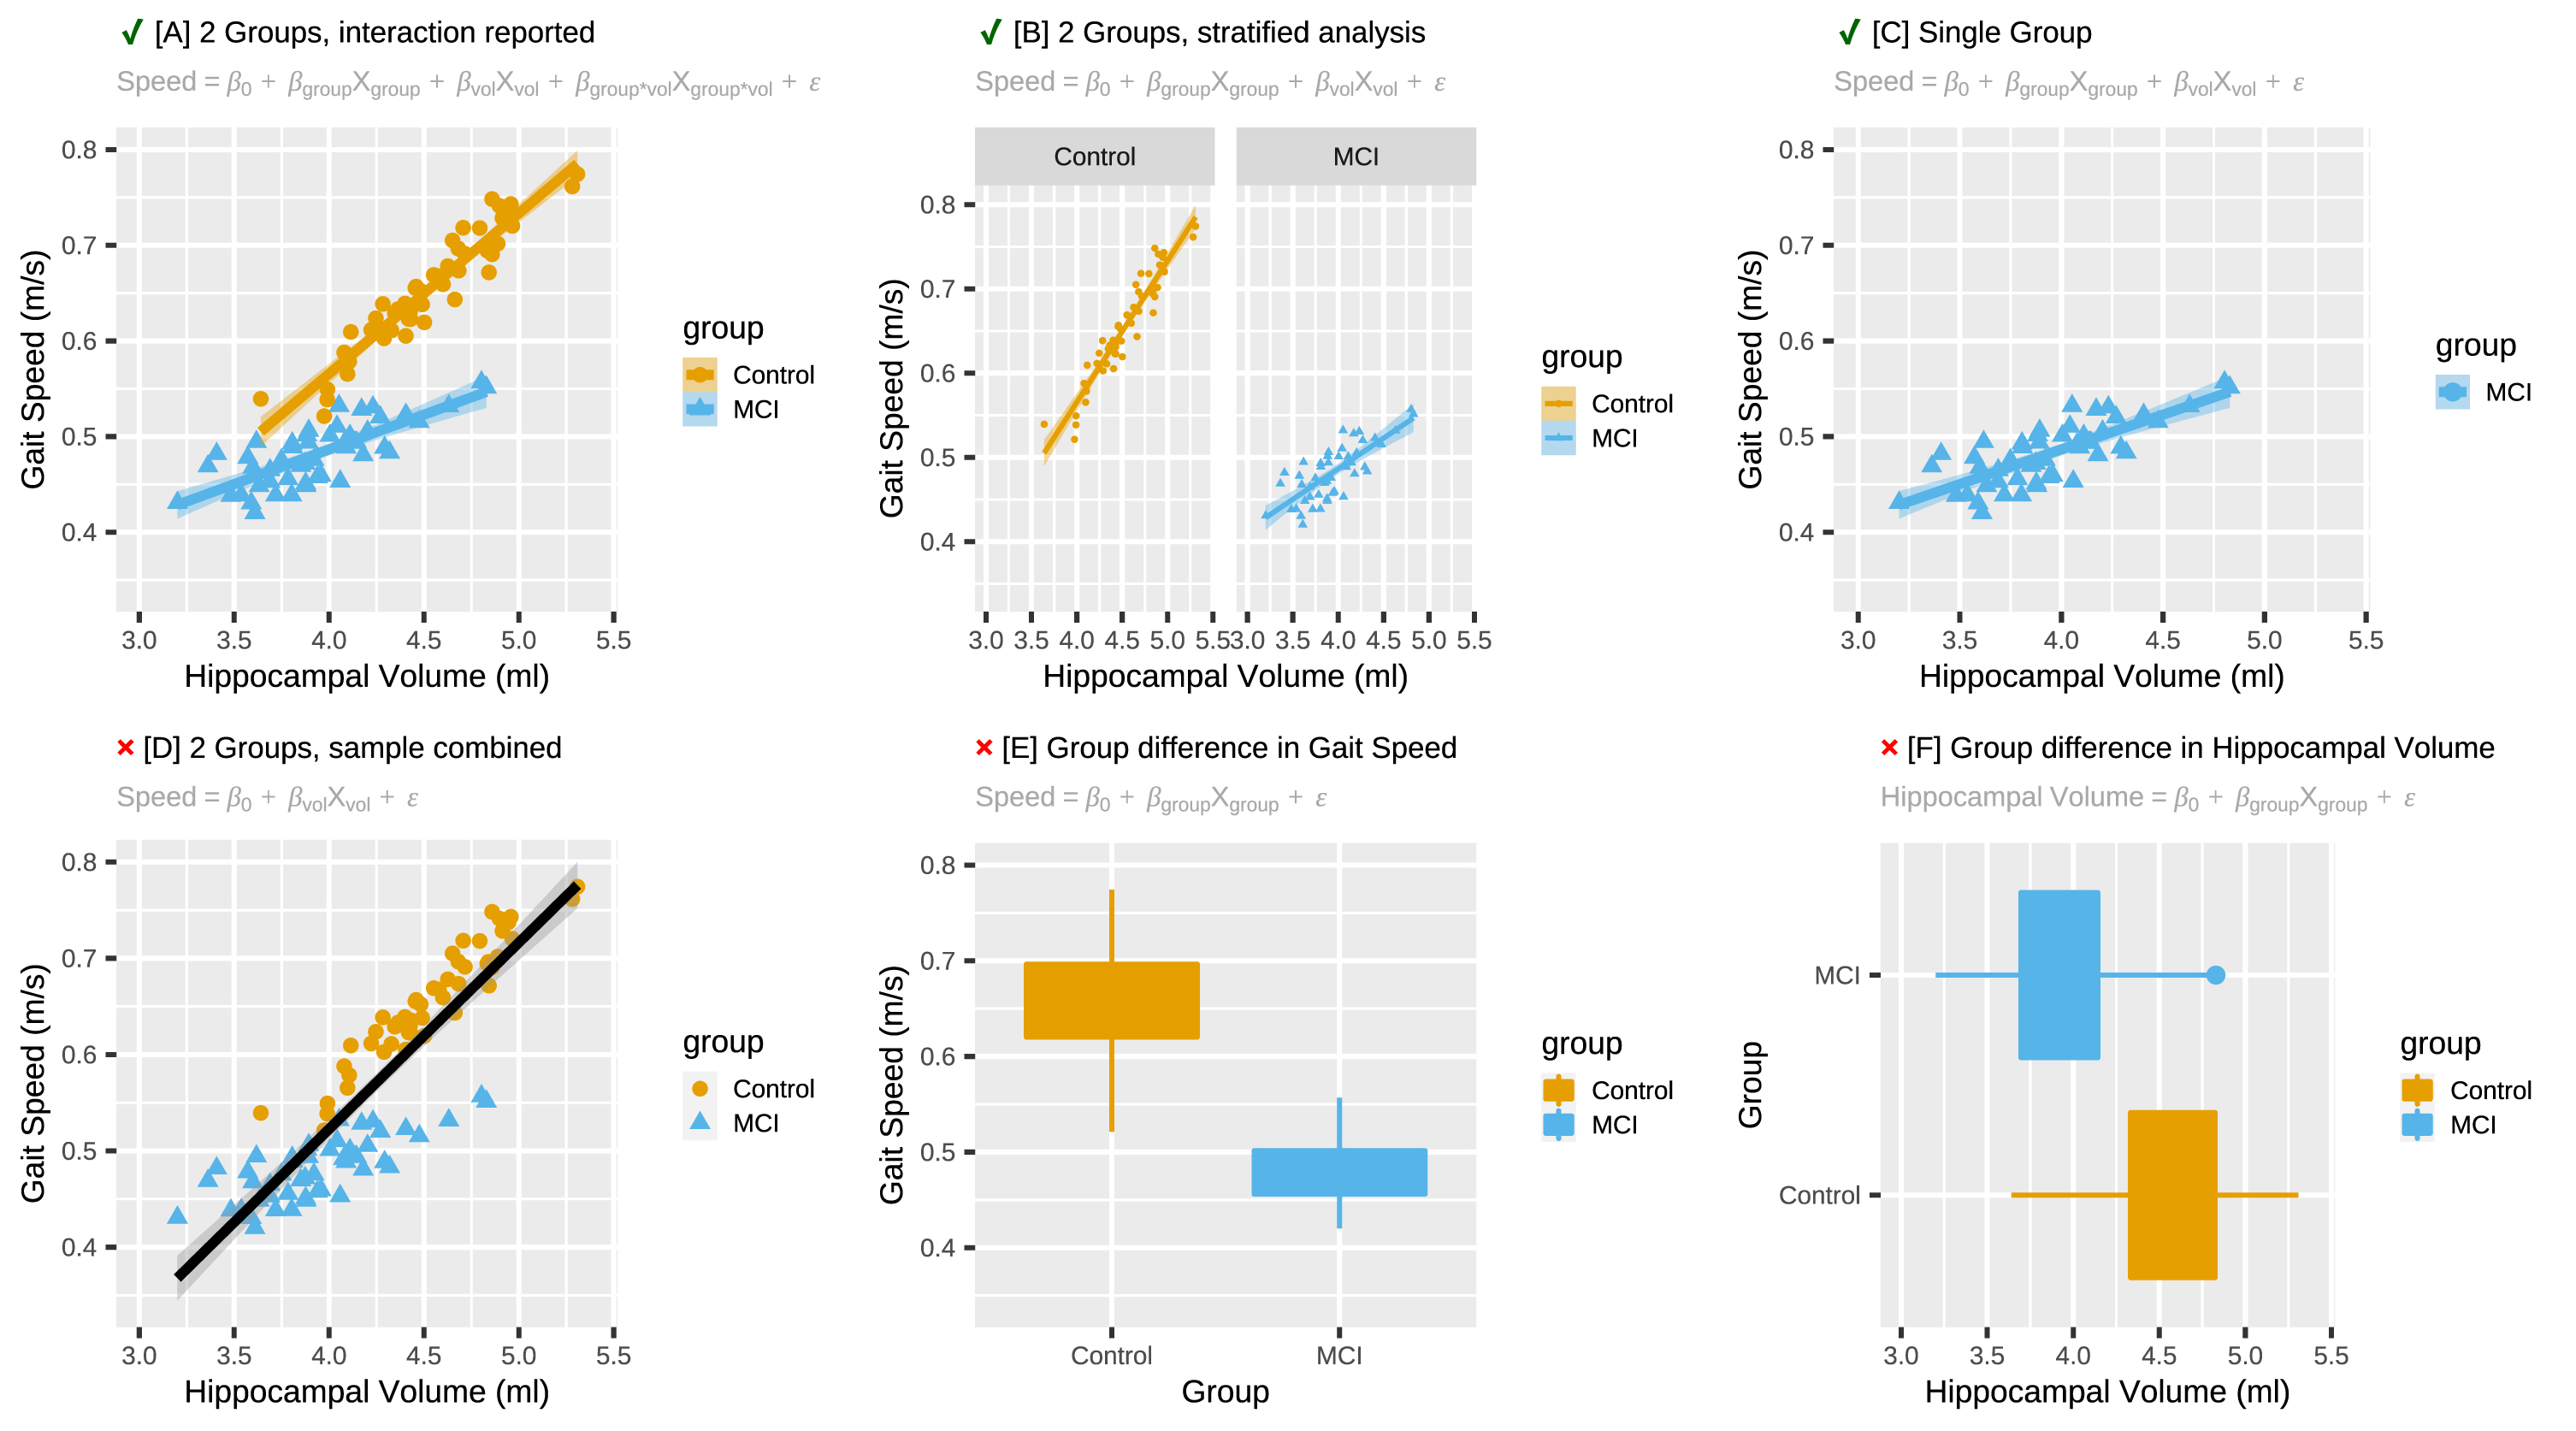
During our literature search, we also encountered studies which report on brain-behavioral associations for MCI/AD and controls separately without statistically testing the interaction effect (Fig. 1B), and studies which did not include a control group and thus were not able to compare this association to that in individuals without AD pathology (Fig. 1C). We will report on these brain-behavioral associations because their outcomes can inform future studies on selecting regions of interest for brain-motor behavioral relationships in AD pathology. Studies that only reported brain-behavioral associations within a combined sample of MCI/AD and controls (Fig. 1D), and studies that reported on group differences in motor behavior (Fig. 1E) and group differences in brain structure or function (Fig. 1F), but which did not report on brain-behavioral associations were excluded from this review. For an overview of this metric of quality assessment see Supplementary Table 1.
With respect to MCI populations, we were particularly interested in amnestic MCI (aMCI) as compared to non-amnestic MCI (naMCI), because aMCI is more likely to progress into AD [18]. When studies did specify the MCI subtypes, only the aMCI results were included. When studies did not specify the MCI subtype (e.g., mix of aMCI and naMCI), all MCI results were included. However, since aMCI tends to be a more common subtype than naMCI [19], the mixed sample of all MCI participants likely includes mostly aMCI. With respect to dementia, we review only populations in which AD is the primary diagnosis for dementia, and not because of other types of dementia such as frontotemporal dementia, or dementia with Lewy bodies. Considering that AD commonly presents with additional neuropathology such as vascular changes [20], it is to be expected that this mixed pathology will also be reflected in the samples we review here.
Supplementary Table 1 provides an overview of the definition of the study population, the samples sizes, and the design of the studies that we included here. Studies with preferable designs (e.g., large samples, well defined experimental groups, longitudinal designs, and inclusion of a control group) have been highlighted. It is noteworthy that the studies with preferred study designs generally had smaller sample sizes than the studies that only reported correlational results within MCI or AD samples.
Table 1
Studies reporting association between motor performance, neuroimaging in participants with MCI or AD diagnosis when compared to healthy controls
| Author | Title | Year | Controls | MCI | AD | Mean Age | % Female | Study Design | Motor Measure(s) | Neural Measure | Imaging | Summary |
| Beauchet [27] | Hippocampal volume, early cognitive decline, and gait variability: Which association? | 2015 | 47 | 43 (undifferentiated) | NA | Controls: 69.7 SD (3.6) MCI: 70.2 SD (3.7) | Controls: 48.9 MCI: 62.8 | Cross-sectional | Spatio-temporal gait parameters (stride time, swing time, stride width) | ROI: Hippocampal Volume | 1.5 T Siemens Magnetom Avanto MRI | Patients with MCI had a significantly higher stride time variability and lower absolute hippocampal volume, but not relative volume, when compared with controls. Results showed that there was an association between higher stride time variability and larger hippocampal volume in controls, but not in MCI. |
| Crockett [32] | Head over heels but I forget why: Disruptive functional connectivity in older adult fallers with mild cognitive impairment. | 2019 | 16 | 19 (undifferentiated) | NA | Controls: 74.1 MCI: 74.3 | Controls: 75 MCI: 68 | Cross-sectional | Finger tapping (left and right) | ROI: Functional connectivity (fMRI) within and between the default mode network, frontoparietal network, and sensorimotor network, measured while performing a finger tapping task | 3.0 T Philips Intera Achieva MRI | No significant differences were observed between control and MCI subjects within or between any of the networks. |
| Grijalva [30] | Dual-task performance is associated with brain MRI Morphometry in individuals with mild cognitive impairment | 2021 | 9 | 12 (undifferentiated) | NA | Controls: 74.3 (3.5) MCI: 79.3 (8.8) | Controls: 56 MCI: 67 | Cross-sectional | Motor cognitive dual-tasking where the motor task consisted of an elbow flexion-extension test and the cognitive test was counting backward by one starting from a random number. | Regional volume (gray matter, CSF, ventricles), cortical surface area, cortical thickness | 3.0 T Siemen’s Skyra MRI | Volume of the inferior temporal gyrus, volume of the inferior lateral ventricle, and cortical thickness of the inferior parietal lobule, inferior temporal gyrus, and middle temporal gyrus were significantly more strongly associated with dual-task performance in MCI than in controls. Larger ventricles, smaller brain volume, and a thinner cortex were related to worse performance. |
| Holtzer [26] | Mild Cognitive Impairments Attenuate Prefrontal Cortex Activations during Walking in Older Adults | 2020 | 71 | 11 (undifferentiated) | NA | Controls: 76.8 SD (6.2) MCI: 78.3 SD (4.3) | Controls: 50.7 MCI: 45.5 | Cross-Sectional | Gait Speed during single task and cognitive dual-task (reciting alternate letters of the alphabet) | ROI: Functional Near-Infrared Spectroscopy (fNRIS) of the prefrontal cortex | fNIRS | MCI was associated with slower gait speed under both single and dual task conditions. |
| The decline in brain activation over single task trials was greater in MCI than in controls. MCI had less increase in brain activation from single to dual tasking compared to control subjects. The decline in brain activation from dual task trial 1 to trial 2 was attenuated in participants with MCI compared to controls, and brain activation declined from trial 1 to 3 in control subjects but increased over these time points in MCI. | ||||||||||||
| Liu[21] | Correlation Between Gait and Near-Infrared Brain Functional Connectivity Under Cognitive Tasks in Elderly Subjects With Mild Cognitive Impairment | 2021 | 17 | 20 (undifferentiated) | Controls: 64.4 SD (5.5) MCI: 62.4 SD (5.0) | NA | Not reported | Cross-Sectional | Four different gait-symmetry indices were calculated (1. symmetry of the left and right leg gaits by time phase of the gait cycle; 2. step symmetry in the Cartesian coordinates; 3. step symmetry in polar coordinates; and 4. the asymmetry index of the single support phase of the left and right leg) for four 10-minute gait paradigms: 1) normal walking; 2) counting backward while walking; 3) naming animals while walking; and 4) calculating while walking. | Based on fNIRS, functional connectivity between fifteen pairs of cortical regions were calculated: LPFC–RPFC, LPFC–LMC, LPFC–RMC, LPFC–LOL, LPFC–ROL, RPFC–LMC, RPFC–RMC, RPFC–LOL, RPFC–ROL, LMC–RMC, LMC–LOL, LMC–ROL, RMC–LOL, RMC–ROL, and LOL–ROL (left prefrontal cortex (LPFC), right prefrontal cortex (RPFC), left motor cortex (LMC), right motor cortex (RMC), left occipital leaf cortex (LOL), and right occipital leaf cortex (ROL) | 14-Channel fNIRS | Functional connectivity between the LPFC and the ROL during walking while counting backwards and while naming animals was stronger in MCI than in controls. Functional connectivity between the LFPC and the LMC was stronger in MCI than in controls during the walking while naming animals task. |
| Nadkarni [24] | Gait and Subcortical Hyperintensities in Mild Alzheimer’s Disease and Aging | 2009 | 33 | NA | 42 | Controls: 73 SD (8) AD: 74 SD (8) | Controls: 47 AD: 60 | Cross-sectional | Gait Speed, Stride Length, Cadence, and Step Width, Timed up-and-go, UPDRS score, Tinetti gait score | ROI: Subcortical White Matter Lesions | 1.5 T GE Healthcare Signa MRI | Control subjects with low WML load had faster gait speed, longer stride length, and faster cadence than AD regardless of WML load. AD with high WML load had more Parkinsonian symptoms than AD with low WML load and controls, regardless of lesion load. Control subjects with low WML load were faster on the timed up-and-go than AD, regardless of lesion load. No differences were observed in stride width or Tinetti gait score (i.e., an overall measure of gait) between the groups. |
| Nadkarni [25] | Impact of Subcortical Hyperintensities | 2012 | 20 | NA | 24 | Controls: 72 SD (8) AD: 75 SD (9) | Controls: 47 AD: 60 | Cross-sectional | Gait Speed, Timed up-and-go, UPDRS score, Tinetti gait score, Cognitive-Motor Dual Tasking. Dual tasking consisted of performing an n-back task while walking at comfortable gait speed with cadence as motor outcome measure. | ROI: Subcortical White Matter Lesions | 1.5 T GE Healthcare Signa MRI | Control subjects with low WML load had faster gait speed than AD regardless of WML load. AD with high WML load were slower on the timed up-and-go than controls, regardless of lesion load. AD with high WML had more Parkinsonian symptoms than AD with low WML load or control subjects regardless of WML load. No differences were observed in Tinetti gait score (i.e., an overall measure of gait) between the groups. Relative to normal walking, all groups except for the AD with high WML load increased their cadence during dual tasking. |
| Rosso [23] | Slowing Gait and Risk for Cognitive Impairment | 2017 | 89 | 69 (undifferentiated) | 35 (unspecified dementia) | Controls: 72.4 SD (2.4) Cognitively Impaired: 72.9 SD (2.7) | Controls: 53.9 Cognitively Impaired: 60.6 | Prospective Cohort | Gait Speed | ROI: Hippocampus, anterior cingulate, posterior cingulate, primary motor cortex, supplementary motor cortex, posterior parietal lobe, middle frontal lobe, caudate, putamen, and pallidum gray matter volumes | 3.0 T Siemens Tim Trio MRI | ndividuals with MCI and dementia were combined in a single group of cognitive impaired subjects. Gait slowing was associated with cognitive impairment after 14 years of follow-up. The right hippocampus was the only region that was associated with gait slowing and cognitive impairment. Adjusting the association between gait slowing and cognitive impairment for hippocampal volume attenuated said association by 23% |
| Vidoni [31] | Evidence of Altered Corticomotor System Connectivity in Early-Stage Alzheimer’s Disease | 2012 | 10 | NA | 9 | Controls: 73.6 SD (6.3) AD: 69.0 SD (7.2) | Controls: 70 AD: 22 | Cross-sectional | Hand Squeeze Task | Whole Brain Voxel-Wise Analysis: fMRI Brain Activation | 3.0 T Siemens Allegra MRI | AD had increased activation in the premotor cortex and supplementary motor area during the hand squeeze task. Psychophysiological interaction analysis with the primary motor cortex (M1) as seed region was used to identify regions where brain activity correlates with brain activity of M1 during the squeeze task, and specifically, where that differs between the two groups. |
| This analysis revealed that the AD group exhibited significant expanded recruitment of parts of the fusiform gyrus (BA 19), the middle cingulate gyrus (BA 23 and 31), the sensorimotor cortex (BA 3 and 4), the anterior cerebellum (lobule I-IV), and the cuneus (BA 19). |
Findings to be reported
Here we review studies that report how brain differences between healthy control participants and participants with MCI/AD are related to motor behavioral differences between these groups. We report both the presence and absence of these relationships. Reporting the absence of associations between neural and motor behavioral measures will help with defining hypotheses for future research.
Results will be discussed in order of study design: studies reporting brain-behavioral interactions by group (Fig. 1A) will be reported first, followed by studies not reporting brain-behavioral interactions by group (e.g., Fig. 1B and 1C). Results will also be organized according to motor outcome measure, and subsequently by neural outcome (e.g., regional volume or WML volume), starting with more global measures (e.g., total gray matter volume) and ending with regional measures (e.g., hippocampal volume).
RESULTS
A flowchart of our literature search can be seen in Fig. 2. Our search identified 346 studies. Based on the title alone, 176 were excluded, for example because they exclusively used animal models, only studied cognitive disorders not related to AD, or were fundamental studies of AD proteins. Of the remaining 170 studies, we read the abstracts, which resulted in the exclusion of another 94 studies. Of the 76 remaining studies that were read in their entirety, 37 met all criteria for review. Of the selected studies, 9 reported brain by group interactions on motor performance (see Table 1) and 29 reported other types of associations between motor function and neural measures in MCI and AD (see Table 3). Because one study reported both types of associations [21] and is therefore discussed under both headings, the total number of studies in both categories adds up to 38 instead of 37.
Fig. 2
Flowchart overview of the literature search. Note that the total number of articles reviewed here (n = 37) is less than the sum of ‘Studies reporting associations between motor function and brain measures in MCI or AD relative to a control group’ (n = 9) and ‘Studies reporting associations between motor function and brain measures in MCI or AD without a control group’ (n = 29). This is due to the fact that one study reported both types of associations and is therefore counted twice.
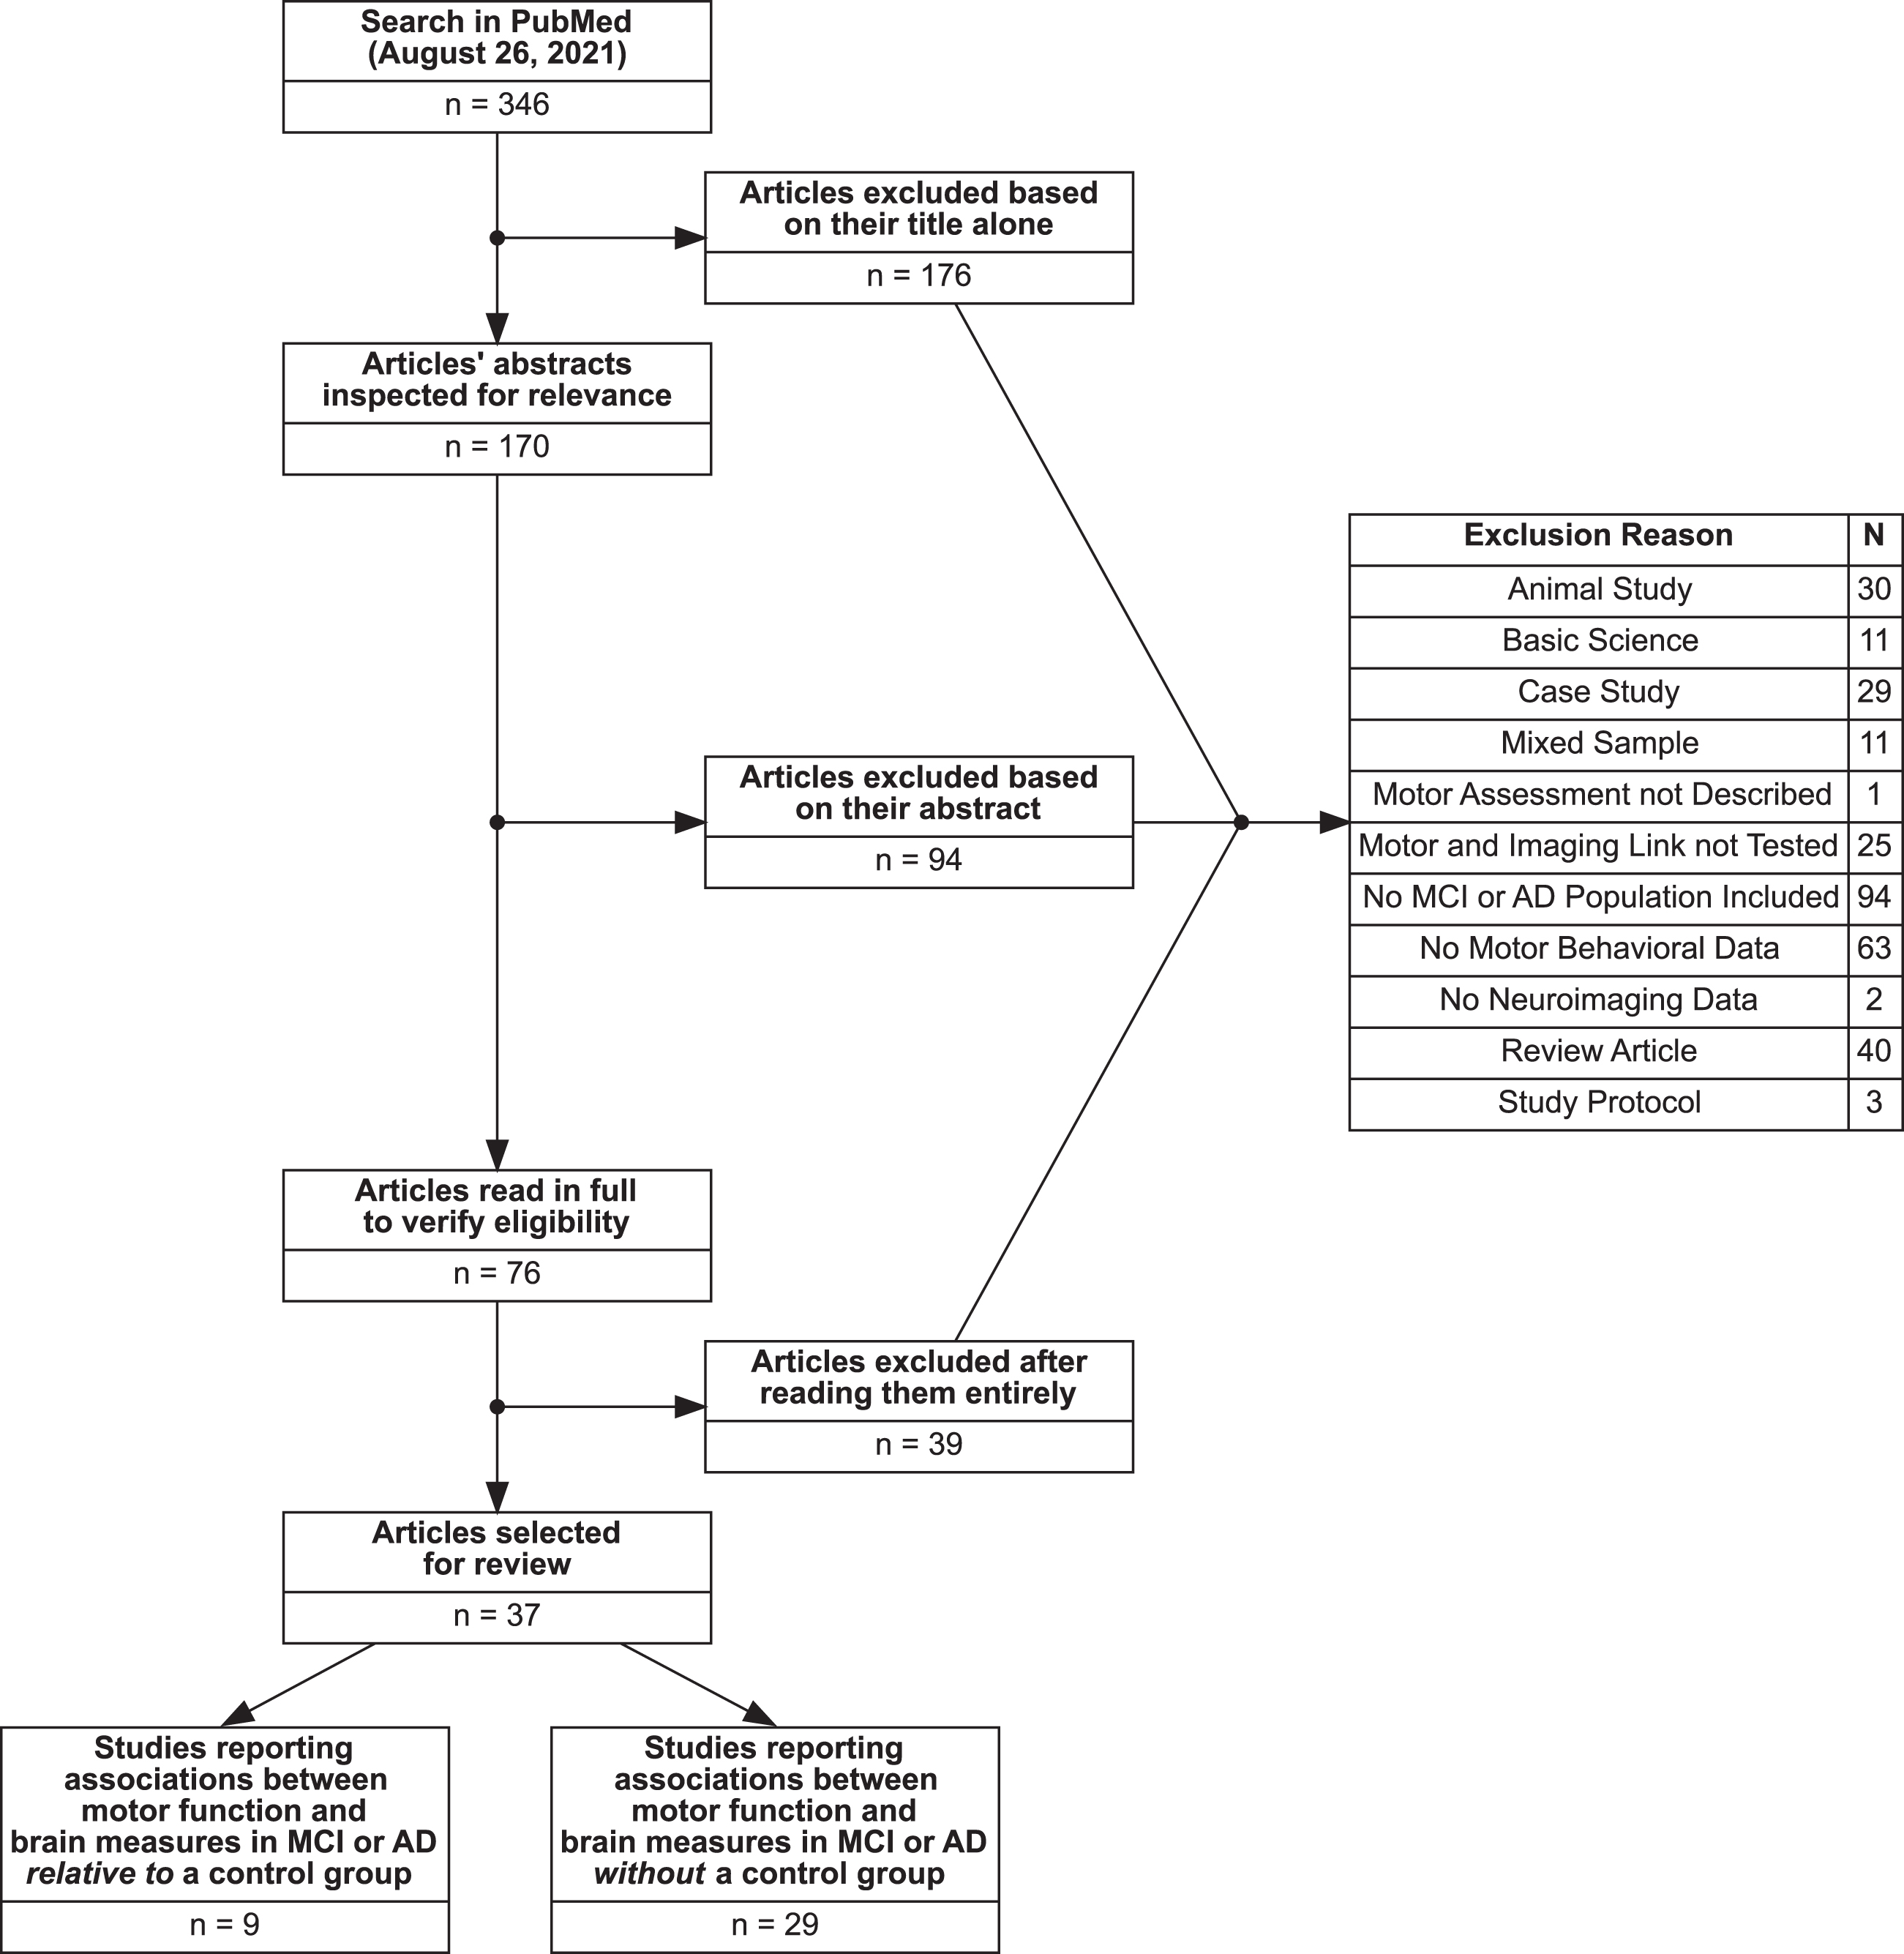
Table 3
Studies reporting association between motor performance, neuroimaging participants with MCI or AD diagnosis without healthy control comparison
| Author | Title | Year | Controls | MCI | AD | Mean age | % Female | Study design | Motor measure(s) | Neural measure | Imaging | Summary | Study type |
| Allali [53] | Brain Volume changes in Gait Control in patients with mild cognitive impairment compared to cognitively healthy individuals; GAIT study results | 2016 | 80 | 25 (aMCI) 66 (naMCI) | NA | Controls: 69.8 SD (3.5) aMCI: 70.3 SD (4.0) naMCI: 70.6 SD (4.6) | Controls: 43.8 aMCI: 16 naMCI: 36.4 | Cross-sectional | Timed Up and Go Test: imagined (iTUG) and realized (rTUG) trials | ROI: Total white matter, total gray matter, hippocampus, prefrontal cortex, and inferior parietal lobule volumes | 1.5 T Siemens Magnetom Avanto MRI | Longer duration of rTUG was associated with smaller total white and gray matter, and left and right hippocampal volumes in naMCI and with larger right hippocampal volume in control individuals. Longer iTUG completion time in na-MCI individuals was related to smaller gray matter and left premotor cortex volumes. Larger differences between rTUG and iTUG were associated with lager left prefrontal cortex volumes in naMCI patients. Within aMCI, there were no associations between brain volumes and iTUG or rTUG. | B |
| Allali [38] | Structural Brain Volume Covariance Associated with Gait Speed in Patients with Amnestic and Non-Amnestic Mild Cognitive Impairment: A Double Dissociation | 2019 | NA | 41 (aMCI) 130 (naMCI) | NA | aMCI: 71.1 SD (4.3) naMCI: 72.3 SD (5.3) | aMCI: 24.3 naMCI: 40.8 | Cross-sectional | Normal and rapid walking gait speed | Whole Brain Voxel-Wise Analysis: Gray Matter Voxel Based Morphometry | 1.5 T Siemens Magnetom Avanto MRI | Gait speed under the normal walking condition but not the rapid walking condition was associated with gray matter volume in the left inferior orbitofrontal gyrus in aMCI participants. A covariance analysis was conduced to look for brain regions where the gray matter volume significantly covaried with the gray matter volume of the orbitofrontal gyrus indicated. This analysis revealed a covariance network comprising brain regions directly attached to the seed region extending from the left orbitofrontal cortex to the right medial frontal gyrus. | B |
| Allali [55] | Default mode network and the timed up and go in MCI: A structural covariance analysis | 2020 | 156 | 170 (undifferentiated) | NA | Controls: 70.4 SD (3.7) MCI: 72.0 SD (5.1) | Controls: 47.4 MCI: 37.1 | Cross-sectional | Timed up-and-go at self selected pace | Whole Brain Voxel-Wise Analysis: Gray Matter Voxel Based Morphometry | 1.5 T and 3.0 T Siemens Magnetom Avanto MRI | Slower timed up-and-go performance was associated with less gray matter cerebellum lobule VIII (bilateral) and in the left middle cingulate cortex. | B |
| Ali [35] | Associations between gait speed and brain structure in amnestic mild cognitive impairment: a quantitative neuroimaging study | 2021 | 23 | 30 (aMCI) | NA | Controls: 68.2 SD (4) aMCI: 75.3 SD (4) | Controls: 52 aMCI: 26 | Cross-sectional | Comfortable gait speed, stride time variability, and step length variability. | Whole Brain Voxel-Wise Analysis: Gray Matter Voxel Based Morphometry; Surface-wise Cortical Thickness Analysis | 3.0 T Siemens Tim Trio MRI | Brain-behavioral associations were separately tested for controls and aMCI. For aMCI the following associations were observed: smaller regional gray matter volume of the right superior temporal gyrus and the left superior temporal pole was associated with slower gait speed. Cortical thickness of a subregion of the left and right superior temporal gyrus was positively associated with gait speed. | B |
| Step length variability was negatively correlated with gray matter volume within the right middle temporal gyrus, right middle, superior and inferior frontal gyri, right precentral gyrus, left supplementary motor cortex (SMC), precuneus, fusiform, putamen, lingual, parahippocampal gyri and left cerebellum. Step length variability was also negatively correlated with cortical thickness of the right middle frontal caudal and rostral gyri. | |||||||||||||
| Almkvist [61] | White-Matter Hyperintensity and Neuropsychological Functions in Dementia and Healthy Aging | 1992 | 23 | NA | 50 | Controls + WMH: 78.4 SD (1.9) Controls - WMH: 79.3 SD (2.8) AD + WMH: 78.9 SD (6.5) AD - WMH: 72.4 SD (7.7) | Controls + WMH: 25 Controls - WMH: 80 AD + WMH: 36.4 AD - WMH:40 | Cross-sectional | Simple Reaction Time, Left and Right Hand Finger-Tapping | ROI: White Matter Lesions | 0.02 T Acutscan 110, Instru-mentarium AB MRI | Presence of WMH was not related to simple reaction time or finger tapping speed in either controls subjects or AD subjects. | B |
| Annweiler [42] | Slow Gait in MCI is Associated w/ Ventricular Enlargement | 2013 S | NA | 20 (undifferentiated) | NA | 73.5 SD (10.5) | 35 | Cross-Sectional | Gait Speed | ROI: Ventricular volumes and white matter lesions | 3.0 T Siemens MRI | Larger brain ventricle volume was associated with slower gait speed even after adjusting for white matter lesions, age, and lower MMSE scores. Smaller left but not right ventricle volume was associated with slower gait speed. | C |
| Annweiler [34] | Motor cortex and gait in mild cognitive impairment: a magnetic resonance spectroscopy and volumetric imaging study. | 2013 M | NA | 20 (undifferentiated) | NA | 76 IQR (11) | 30 | Cross-Sectional | Single and Dual Gait Speed, and Stride Time Variability | ROI: Primary motor cortex, premotor cortex plus supplementary motor area, somatosensory cortex, hippocampus, frontal lobe cortex, superior parietal lobule, posterior cingulate, thalamus, basal ganglia, and cerebellar cortex volumes | 3.0 T Siemens Tim Trio MRI | Of all regional brain volumes investigated, only that of the primary motor cortex was associated with gait speed in MCI. | C |
| Beauchet [48] | Association of hippocampal volume with gait variability in pre-dementia and dementia stages of Alzheimer Disease: Results from a Cross-Sectional Study | 2019 A | NA | 47 (naMCI) 42 (aMCI) 79 (mild SCI) 68 (moderate/severe SCI) | 35 | naMCI: 71.6SD (4.8) aMCI: 72.8 SD (5.9) mild SCI: 70.2 SD (3.4) moderate/ severe SCI: 71.8 SD (5.2) AD: 78.5 SD (6.1) | naMCI: 31.9 aMCI: 45.2 mild SCI: 39.2 moderate/ severe SCI: 42.6 AD: 57.1 | Cross-Sectional | Coefficient of variation of stride time | ROI: Hippocampal Volume | 1.5 T Siemens Magnetom Avanto &3.0 T Siemens Magnetom Skyra MRI | Within both aMCI and AD subjects, there was a trend for significance (p = 0.085 and p = 0.062) for the negative association between hippocampal volume and stride time variability. These analyses were adjusted for walking speed, total intracranial volume, and white matter abnormalities. | C |
| Beauchet [37] | Brain gray matter volume associations with gait speed and related structural covariance networks in cognitively healthy individuals and in patients with mild cognitive impairment: A cross-sectional study. | 2019 B | 96 | 99 (undifferentiated) | NA | Controls: 69.9 SD (3.7) MCI: 70.7 SD (4.6) | Controls: 43.8 MCI: 30.3 | Cross-Sectional | Usual Gait Speed | Whole Brain Voxel-Wise Analysis: Gray Matter Voxel Based Morphometry | 1.5 T Siemens Magnetom Avanto MRI | Gait speed was positively correlated with volume of the right middle frontal gyrus and precentral gyrus in control subjects, and with volume of the left putamen, left and right caudate nucleus and left insula in MCI subjects. | C |
| Beauchet [54] | Brain Gray Matter Volume Associations With Abnormal Gait Imagery in Patients With Mild Cognitive Impairment: Results of a Cross-Sectional Study. | 2020 | 156 | 170 (undifferentiated) | NA | Controls: 70.4 SD (3.7) MCI: 70.0 SD (5.1) | Controls: 48.1 MCI: 37.1 | Cross-Sectional | Time difference between the realized and imagined timed up-and-go. | Whole Brain Voxel-Wise Analysis: Gray Matter Voxel Based Morphometry | 1.5 T and 3.0 T Siemens Magnetom Avanto MRI | The difference in timed up-and-go speed was not associated with gray matter volume in control subjects, but was significantly associated with gray matter volume of the entorhinal cortex, amygdala, parahippocampal gyrus, insula, and hippocampus in MCI. | B |
| Bennet [52] | Clinical Correlates of High Signal Lesions on Magnetic Resonance Imaging in Alzheimer’s Disease | 1992 | NA | NA | 106 | 71.5 SD (8.2) | 68.9 | Cross-Sectional | Gait Disorder | ROI: Subcortical/ centrum semiovale and Periventricular White Matter Lesions | 0.5 T Technicare super-conductive MRI | Presence or absence of a gait disorder was diagnosed by a neurologist based on observing the participant walking 20 feet. Both subcortical/centrum semiovale white matter lesions and periventricluar lesions were associated with gait disturbance in Alzheimer’s disease. | C |
| Camarda [65] | Mild Parkinson Signs in a Hospital-Based Cohort of Mild Cognitive Impairment Types: A Cross-sectional study | 2019 | NA | 347 aMCI 481 aMCI-md | NA | aMCI: 68.6 SD (3.5) aMCI-md: 71.3 SD (3.2) | aMCI: 55.9 aMCI-md: 56.8 | Cross-Sectional | The motor items of the Unified Parkinson’s Disease Rating scale: tremor, rigidity, bradykinesia, and gait/balance/axial dysfunction. | ROI: Cortical and Subcortical Atrophy, White Matter Lesions, Lacunes, Small Vessel Disease | 1.5 T GE Healthcare Signa MRI | Within single-domain aMCI participants, symptoms of Parkinsonism were related to presence of periventricular WML, lacunes in the basal ganglia, small vessel disease, and cortical atrophy. Within multi-domain aMCI participants, symptoms of Parkinsonism were associated with deep/subcortical and periventricular white matter, and more cortical and subcortical atrophy. | C |
| Cosentino [36] | Association Between Gait, Cognition, and Gray Matter Volumes in Mild Cognitive Impairment and Healthy Controls | 2020 | 43 | 43 (undifferentiated) | NA | MCI: 74.7 SD (6.9) NC: 72.2 SD (6.1) | MCI: 60.5 HC: 41.9 | Cross-Sectional | Gait Speed | Whole Brain Voxel-Wise Analysis: Gray Matter Voxel Based Morphometry | 1.5 T Philips Achieva MRI | A positive correlation was found between gait speed, cadence, stride length, and GM volumes (i.e., the frontal gyrus and the cerebellum) in healthy controls. An association was also found between GM volumes (i.e., superior temporal gyrus, thalamus, and parahippocampal gyrus) and gait speed and stride length in MCI individuals. | B |
| Crockett [45] | Resting State Default Mode Network Connectivity, Dual Task Performance, Gait Speed, and Postural Sway in Older Adults with Mild Cognitive Impairment | 2017 | NA | 35 MCI (undifferentiated) | NA | 76.8 SD (5.8) | 52.5 | Cross-Sectional | Usual gait speed over 4 meters, motor cognitive dual tasking (walking at self-selected pace while subtracting serial sevens), and balance. | Resting State Functional Connectivity a) within the default mode network (DMN); and b) between the DMN and fronto-parietal network, and the DMN and the supplementary motor areas (SMA). | 3.0 T Philips Intera Achieva MRI | Greater within-DMN connectivity was associated with poorer dual task performance. Greater connectivity between the DMN and the SMA was associated with slower gait speed and with poorer balance. | C |
| Doi [41] | Gray Matter Volume and Dual Task Gait Performance | 2017 | NA | 270 (naMCI) 290 (aMCI) | NA | naMCI: 72.9 SD (5.1) aMCI: 72.4 SD (4.5) | naMCI:63.7 aMCI: 45.5 | Cross-Sectional | Single and Dual Task Gait Speed | Whole Brain Voxel-Wise Analysis: Gray matter analysis where clusters of gray matter are derived from principal component analysis | 3.0 T Siemens TIM Trio MRI | Different brain regions were involved in dual-task gait performance between aMCI individuals and naMCI individuals. In naMCI individuals the associated gray matter patterns included the inferior frontal gyrus, medial frontal gyrus, middle frontal gyrus, superior frontal gyrus, and extranuclear and middle temporal gyrus. In aMCI individuals the associated gray matter patterns were made up of the occipital gyrus, parahippocampal gyrus, fusiform, middle temporal gyrus, cuneus, precuneus, and cingulate gyrus. | C |
| Doi [44] | Effect of White Matter Lesions on Trunk Stability During Dual-Task Walking | 2015 | NA | 289 (naMCI) 271 (aMCI) | NA | Non-Severe WML: 72.2 SD (4.7) Severe WML: 75.9 SD(5.6) | Non-Severe WML: 46.3 Severe WML: 46.8 | Cross-Sectional | Gait Speed and Trunk Stability | ROI: White Matter Lesions | 3.0 T Siemens TIM Trio MRI | The harmonic ratio in vertical, mediolateral, and anteroposterior directions derived using an accelerometer and gyroscope were used to determine the smoothness and stability of the trunk during gait. While severe WML burden was associated with gait speed and trunk stability under single and dual-tasking (counting backwards) walking conditions, no significant differences existed between groups after adjustment for covariates. A linear mixed-effects model adjusted for age, sex, medication, MCI subtype, and education did identify significant associations between WML load and trunk instability all directions. | C |
| Hsu [46] | Functional Neural Correlates of Slower Gait | 2019 | NA | 49 (undifferentiated) | NA | 75.4 SD (6.3) | 61.2 | Cross-sectional | Gait Speed | ROI: Network connectivity between the sensorimotor network and frontoparietal network with specific ROIs within these areas | 3.0 T Philips Intera Achieva MRI | Stronger connectivity between the supplementary motor area (SMA) and the frontoparietal network was associated with more variation in gait speed in individuals with MCI. Slower gait in individuals with MCI was related to greater connectivity between the SMA and bilateral ventral visual cortices, bilateral occipital cortices, and the bilateral frontal eye fields. | C |
| Lee [58] | Relationship between postural instability and subcortical volume loss in Alzheimer’s disease. | 2017 | 37 | NA | 107 | Controls: 64.4 SD (6.1) AD: 70.2 SD (8.3) | Controls: 70 AD: 72 | Cross-Sectional | Unilateral stance balance and composite balance performance (performance during balance tests focusing on the visual, vestibular and proprioceptive systems). | ROI: Volume of six subcortical brain regions: amygdala, thalamus, caudate nucleus, putamen, globus pallidus, and nucleus accumbens. | 3.0 T GE Healthcare Signa MRI | Age, gender, and MMSE corrected scores showed that smaller nucleus accumbens volume was associated with poorer balance performance and unilateral stance performance. | C |
| Liu [21] | Correlation Between Gait and Near-Infrared Brain Functional Connectivity Under Cognitive Tasks in Elderly Subjects With Mild Cognitive Impairment | 2021 | 17 | 20 (undifferentiated) | NA | Controls: 64.4 SD (5.5) MCI: 62.4 SD (5.0) | Not reported | Cross-Sectional | Four different gait-symmetry indices were calculated (1. symmetry of the left and right leg gaits by time phase of the gait cycle; 2. step symmetry in the Cartesian coordinates; 3. step symmetry in polar coordinates; and 4. the asymmetry index of the support single support phase of the left and right leg) for four 10-minute gait paradigms: 1) normal walking; 2) counting backward while walking; 3) naming animals while walking; and 4) calculating while walking. | Based on fNIRS, functional connectivity between fifteen pairs of cortical regions were calculated: LPFC–RPFC, LPFC–LMC, LPFC–RMC, LPFC–LOL, LPFC–ROL, RPFC–LMC, RPFC–RMC, RPFC–LOL, RPFC–ROL, LMC–RMC, LMC–LOL, LMC–ROL, RMC–LOL, RMC–ROL, and LOL–ROL (left prefrontal cortex (LPFC), right prefrontal cortex (RPFC), left motor cortex (LMC), right motor cortex (RMC), left occipital leaf cortex (LOL), and right occipital leaf cortex (ROL) | 14-Channel fNIRS | The MCI group displayed stronger functional connectivity than control subjects between the left prefrontal cortex and the right occipital leaf cortex during the walking while naming animals task and the counting dual task. Additionally, stronger connectivity between the left prefrontal cortex and the left motor cortex during was observed in MCI during the animal naming dual task. | B |
| Makizako [40] | The Association Between Decline in Physical Functioning and Atrophy of Medial Temporal Areas in Community-Dwelling Older Adults With Amnestic and Nonamnestic Mild Cognitive Impairment | 2011 | NA | 34 aMCI 58 naMCI | NA | aMCI: 75.4 SD (6.6) naMCI: 73.8 SD (6.1) | aMCI: 44.1 naMCI: 58.6 | Cross-Sectional | Isometric knee extension strength, one-legged standing time, 5-meter walking speed, 6-minute walk test. | Atrophy of the bilateral medial temporal areas including the enthorinal cortex. | 1.5 T Siemens Magnetom Avanto | Within aMCI, age-adjusted regression analysis showed a significant association between atrophy and 6 meter walk test performance (i.e., a measure of exercise capacity), but not with any of the other motor measures. | B |
| Mascalchi [62] | The burden of microstructural damage modulates cortical activation in elderly subjects with MCI and leuko-araiosis. A DTI and fMRI study. | 2014 | NA | 60 (undifferentiated) | NA | Mild WML: 76.0 SD (6.8) Moderate/Severe WML: 74.7 SD (7.1) | Mild WML: 57.1 Moderate/Severe WML: 41.3 | Cross-Sectional | Right hand-tapping | ROI: WML of mild or moderate to severe degree based on the modified Fazekas scale | 1.5 T Philips Intera MRI | Performance on the hand tapping task was not significantly different between the mild or moderate-to-severe WML groups | C |
| Moon [63] | Muscle Strength Is Independently Related to Brain Atrophy in Patients with Alzheimer’s Disease | 2019 | NA | NA | 28 | Probable AD: 76.9 SD (7.6) | Probable AD: 89.3 | Cross-Sectional | Isokinetic knee extension strength | ROI: Hippocampus, amygdala, caudate, putamen, pallidum, thalamus, forebrain parenchyma, cortical gray matter, cerebellum, superior lateral ventricle, inferior lateral ventricle | 3.0 T GE Healthcare Signa HD MRI | Age and MMSE adjusted analyses showed that muscle strength was positively associated with left hippocampal volume. When participants were divided into mild stage AD (clinical dementia rating scale (CDR)=0.5), and moderate stage mild AD (CDR = 1), this association only held for the latter group. | C |
| Nilsson [57] | The Effects of Tau, Amyloid, and White Matter Lesions on Mobility, Dual Tasking, and Balance in Older People | 2020 | 175 | 124 (undifferentiated) | NA | Controls: 72.5 SD (5.6) Undifferentiated MCI: 70.9 SD (5.4) | Controls: 49.1 Undifferentiated MCI: 45.2 | Cross-sectional | Timed Up-and-Go, Timed Up-and-Go + serial subtraction task (dual task), Figure-of-Eight walking balance task | Total white matter lesion volume | 3.0 T Siemens Trio | Within the MCI subjects, analyses adjusted for age and sex showed that total WML volume was related to timed up-and-go performance, but not to the other behavioral outcome measures. | B |
| Olazarán [50] | Clinical and Anatomical Correlates of Gait Dysfunction in Alzheimer’s Disease | 2013 | NA | NA | 65 (volumetric data) 53 (diffusion weighted imaging) | Probable AD: 82.5 SD (6.4) | Probable AD: 86 | Cross-Sectional | Gait dysfunction measured using the Rating Scale for Gait Evaluation in Cognitive Deterioration | Whole Brain Voxel-Wise Analysis: Gray Matter Voxel Based Morphometry and White Matter Diffusion Tensor Imaging | 3.0 T GE Healthcare | Voxel-based morphometry showed that gait dysfunction was associated with less gray matter in clusters in the bilateral primary motor cortices, bilateral medial cingulate gyrus, bilateral insula, and bilateral anterior cerebellum. Smaller volumes indicated poorer gait. Voxel-wise analysis of fractional anisotropy (FA) images derived from the diffusion imaging showed that gait dysfunction was associated with lower FA values in parts of the right corticospinal tract, right cingulum, right splenium, left inferior longitudinal fasciculus, left and right inferior fronto-occipital fasciculus, left forceps minor, left superior longitudinal fasciculus, and right anterior thalamic radiation. | C |
| Onen [56] | Leukoaraiosis and Mobility Decline: a High Resolution Magnetic Resonance Imaging Study in Older People with Mild Cognitive Impairment | 2004 | NA | 23 (undifferentiated) | NA | 73 SD (3) | 43.5 | Cross-Sectional | One-leg standing test, timed up and go test, walking while talking, standing test, gait speed | ROI: White Matter Lesions, Ventricular Volume | 1.5 T MRI | The MCI group was subdivided into a high and low mobility group based on a composite score calculated from performance on various motor measures including walking-while-talking, timed up-and-go, gait speed, and one-leg standing. Lower mobility was correlated with frontal subependymal lesions (p = 0.0005). Higher mobility was associated with the absence of marked ventriculomegaly, any thick caps, deep white matter lesions curved along the ventricular bodies, large deep white matter lesions, and deep gray matter lesions (p = 0.0001). These finding suggest that mobility decline in MCI older adults is caused by impairment of cerebrospinal fluid dynamics with cerebral small vessel disease. | C |
| Onen [43] | Mobility Decline of Unknown Origin in MCI | 2008 | NA | 61 (undifferentiated) | NA | 71.7 SD (5.52) | 54.1 | Cross-Sectional | Falls, one-leg standing test, timed up and go test, walking while talking, standing test, gait speed | ROI: White Matter Lesions | 1.5 T MRI | Participants were subdivided into individuals with (n = 11) and without (n = 50) periventricluar WML. After controlling for older age and larger ventricles with marked, presence of WML was associated with decreased performance on the timed up and go test. A higher frequency of poor TUG performance was observed in MCI individuals with a vascular like profile than an Alzheimer like profile. | C |
| Reeves [59] | The Dopaminergic Basis of Cognitive and Motor Performance in Alzheimer’s Disease | 2009 | NA | NA | 24 | 78.7 SD (6.1) | Not reported | Cross-Sectional | Motor Latency and Grooved Pegboard | ROI: Dopamine-Receptor availability in the striatum and the sensorimotor, associative, and limbic regions of the striatum | 962 Siemens/CTI PET Camera | [11C] raclopride (RAC) binding was used to identify striatal dopamine receptor availability. There was a significant association between [11C] RAC and dopamine receptor binding in the striatum and motor latency (r=-0.42, p = 0.05; i.e., as binding increased, time to respond decreased). When individual subregions of the striatum were examined, motor latency was correlated with [11C] RAC binding and motor latency (r=–0.44, p = 0.04) in the sensorimotor region. No significant correlation between [11C] RAC binding in the striatum and performance on the grooved pegboard task was identified. | C |
| Sakurai [39] | Entorhinal Cortex Volume is Associated W/ Dual Task Gait | 2019 | NA | 40 (undifferentiated) | NA | 74.2 SD (6.0) | 42.5 | Prospective Cohort | Gait speed in single and dual task conditions (single gait, counting gait, serial sevens gait, naming animals gait) | ROI: Hippocampus, parahippocampal gyrus, entorhinal cortex, motor cortex, and lateral frontal cortex volumes | 3.0 T Siemens TIM Trio and 3.0 T Siemens Magnetom Prisma MRI | A smaller left entorhinal cortex volume was significantly associated with slower gait velocities on all three dual tasks and with larger dual task costs for subtracting serial sevens and counting backwards. | C |
| Yoon D. [47] | Physical Frailty and Amyloid-B Deposits | 2018 | NA | 21 (undifferentiated MCI) 27 (cognitive frailty) | NA | Undifferentiated MCI: 74.6 SD (5.65) Cognitive Frailty: 75.5 SD (7.28) | Undifferentiated MCI: 67 Cognitive Frailty: 78 | Cross-Sectional | Gait speed, Timed up and go test, and Short Physical Performance Battery (balance, gait speed, and chair stand tests) | ROI: Amyloid Beta Deposits | 3.0 T Biograph mMR | Cognitive frailty was defined as a clinical dementia rating scale of 0.5 and the absence of concurrent dementia. Standard uptake value ratios (SUVRs) of all brain regions revealed an association between brain amyloid-β accumulation and weakness. Furthermore, global SUVRs (frontal cortex, temporal cortex, parietal cortex, PC/PCC, hippocampus, basal ganglia) were associated with gait parameters. | C |
aMCI, amnestic mild cognitive impairment; naMCI, non-amnestic MCI; AD, Alzheimer’s disease; ROI, region of interest; fMRI, functional magnetic resonance imaging; fNIRS, functional near-infrared spectroscopy; WML, white matter lesions. Study types: B studies looking at brain-behavioral associations where results are stratified by group (e.g., controls and MCI); C, studies looking at brain-behavioral associations which only included an MCI or AD group, but no control group.
Studies in MCI/AD reporting brain by group interactions on motor performance
Studies evaluating gait and non-gait motor function in relation to neuroimaging outcome measures in participants with an MCI or AD diagnosis when compared to healthy controls. Gait speed refers to walking speed at either normal pace, or maximum pace, but without running. Within MCI and AD samples, the association between neural metrics and gait was investigated in 5 out of 9 studies (see Table 2), while non-gait measures were investigated in three studies.
Table 2
Aggregated results for studies reporting association between motor performance, neuroimaging participants with MCI or AD diagnosis when compared to healthy controls
 |
Text inside the cells indicate the first few letters of the first author from the manuscript from which the result is extracted. If necessary, these letters are followed by two numbers indicating the year the study was published to differentiate between different publications that have the same first author. If no side (hemisphere; (L) or (R)) is indicated, studies looked at bilateral regions.  = undifferentiated MCI;
  = MCI + dementia mix;
  = AD; [A] AD exhibit less activation than controls; [R] AD recruit additional regions in these areas that controls do not recruit; OTHER REGIONS 1 = 3rd ventricle, 4th ventricle, Accumbens-area, Amygdala, Banks of the Superior Temporal Sulcus, Brain stem, CSF, Caudal middle frontal gyrus, Cerebellum cortex, Cerebellum white matter, Choroid plexus, Cingulate cortex (caudal anterior, rostral anterior), Corpus callosum (Anterior, Central, Mid-anterior, Mid-posterior, Posterior, Total), Entorhinal cortex, Frontal pole, Fusiform gyrus, Insula, Inferior parietal lobule, Isthmus cingulate, Lateral occipital gyrus, Lateral ventricle, Lingual gyrus, Middle temporal gyrus, Optic chiasm, Orbitofrontal cortex (lateral, medial), Paracentral gyrus, Parahippocampal gyrus, Pars opercularis, Pars orbitalis, Pars triangularis, Pericalcarine gyrus, Precunues, Rostral middle frontal gyrus, Superior frontal gyrus, Superior parietal gyrus, Superior temporal gyrus, Supramarginal gyrus, Temporal pole, Thalamus proper, Transverse temporal, Ventral DC; OTHER REGIONS 2 = Banks of the Superior Temporal Sulcus, Caudal middle frontal gyrus, Cingulate cortex (caudal anterior, rostral anterior, posterior), Cuneus, Entorhinal cortex, Frontal pole, Fusiform gyrus, Insula, Isthmus cingulate, Lateral occipital gyrus, Lingual gyrus, Orbitofrontal cortex (lateral, medial), Paracentral gyrus, Parahippocampal gyrus, Pars opercularis, Pars orbitalis, Pars triangularis, Pericalcarine gyrus, Postcentral gyrus, Precentral gyrus, Precunues, Rostral middle frontal gyrus, Superior frontal gyrus, Superior parietal gyrus, Superior temporal gyrus, Supramarginal gyrus, Temporal pole, Transverse temporal; OTHER REGIONS 3 = Banks of the Superior Temporal Sulcus, Caudal middle frontal gyrus, Cingulate cortex (caudal anterior, rostral anterior, posterior), Cuneus, Entorhinal cortex, Frontal pole, Fusiform gyrus, Inferior temporal gyrus, Inferior parietal lobule, Insula, Isthmus cingulate, Lateral occipital gyrus, Lingual gyrus, Middle temporal gyrus, Orbitofrontal cortex (lateral, medial), Paracentral gyrus, Parahippocampal gyrus, Pars opercularis, Pars orbitalis, Pars triangularis, Pericalcarine gyrus, Postcentral gyrus, Precentral gyrus, Precunues, Rostral middle frontal gyrus, Superior frontal gyrus, Superior parietal gyrus, Superior temporal gyrus, Supramarginal gyrus, Temporal pole, Transverse temporal; OTHER CONNECTIONS = Connections between the LPFC-RPFC, LPFC-RMC, LPFC-LOL, RPFC-LMC, RPFC-RMC, RPFC-LOL, RPFC-ROL, LMC-RMC, LMC-LOL, LMC-ROL, RMC-LOL, RMC-ROL, and LOL-ROL (left prefrontal cortex (LPFC), right prefrontal cortex (RPFC), left motor cortex (LMC), right motor cortex (RMC), left occipital leaf cortex (LOL), and right occipital leaf cortex (ROL)
Gait
Here we discuss studies that report on measures of average gait speed, stride measures, functional mobility, and also walking while completing an independent cognitive task. Overall, these studies reveal that less hippocampal volume, a thinner temporal gyrus, larger lateral ventricles, more subcortical white matter degeneration, and activation changes in the prefrontal cortex explained differences in gait performance between MCI and AD (see the next paragraphs for more detail). This could indicate that changes in hippocampal-frontal networks could be involved in poorer motor function in MCI and AD [22].
Longitudinal research with 14 years of follow up showed that gait speed predicted development of MCI and unspecified dementia in initially cognitively normal individuals [23] (see Table 2). This association was partially explained by volume of the right hippocampus, suggesting that hippocampal volume acts as a shared neural substrate in gait speed and cognitive decline. Slower gait speed in AD is furthermore explained by presence of subcortical white matter lesions. Cognitively normal individuals with a low lesion load had a faster gait than individuals with AD with either a low or a high WML load [24, 25]. This gait speed difference was larger between control participants and participants from the AD group with a high lesion load than between control participants and participants from the AD group with a low lesion load. However, this difference was not statistically significant. Functional imaging using near-infrared spectroscopy (fNIRS) has revealed that brain activation in the prefrontal cortex showed a larger decline in MCI than controls over multiple walking trials [26].
Stride measures comprise aspects of gait including step length (the distance between the left and right toes in a step), stride length (the distance covered during a consecutive left and right step), stride time (the time elapsed between the first contact of two consecutive footsteps), swing time (the amount of time of the swing phase of one leg), step width (the horizontal distance between two steps), and cadence (full gait cycles per unit time, where a gait cycle is the sequence measured from one foot strike to the subsequent foot strike of the same foot). Although MCI was linked to smaller hippocampal volume and a higher normalized variance in stride time compared to cognitively normal participants, the smaller volume did not explain the difference in stride variance [27] (see Table 2).
WML load was not associated with stride measures in AD. Although AD participants with either low or high WML load had shorter stride length and slower cadence than cognitively normal participants with a low WML load, no effect of lesion load on gait between AD participants with low or high lesion load was reported [24]. Later work by the same group did not reveal associations between an overall gait score that combines information from multiple stride measures [28] and WML [25].
Mobility that is part of functional behavior, such as completing an obstacle course, or walking after rising from a chair and before sitting back down is labeled functional mobility. Functional mobility is crucial for successful independent living and is closely related to activities of daily living (ADL) functioning. Subcortical WML have been related to poorer performance of AD participants on a the timed up-and-go test (see Table 2); a test where participants have to stand up from a chair, walk three meters, turn around, and return to a seated position. AD participants with a high WML load were slower on this test than cognitively normal participants with a low WML load [24]. A more recent study from the same lab replicated these results, but also found that AD with a high WML load were slower than the cognitively normal participants with a high WML load [25].
Motor-cognitive dual-tasking cost is the decrease in motor performance under a dual-task condition (i.e., simultaneously performing a motor and a cognitive task), relative to a single-task condition (i.e., performing a motor task only). Dual tasking can be particularly sensitive to AD pathology as it requires both intact motor and cognitive skills [29]. The association between brain measures and performance on a dual task that required simultaneous elbow flexion and counting backwards by a random number were significantly different for MCI participants compared to controls [30] (see Table 2). Specifically, the association between dual task performance and volume and thickness of the inferior temporal gyrus (more gray matter equals better performance), volume of the inferior lateral ventricle (larger ventricles result in worse performance), and cortical thickness of the inferior and middle temporal gyrus (thicker gyri relate to better performance) were stronger in the MCI group than in the control group. Participants with AD with a high lesion load have shown a higher dual tasking cost for cadence (steps per unit time) than control participants with either a low or high WML lesion load during treadmill walking while concurrently completing an n-back working memory task [25]. fNIRS studies have linked dual tasking deficits in MCI to both reductions in brain activation [26] and stronger functional connectivity [21]. Compared to controls, MCI participants exhibited lower brain activation in the prefrontal cortex during a task that involved walking while reciting alternate letters of the alphabet. MCI participants also had a relatively smaller increase in brain activation from single to dual tasking. The task was repeated three times and analyses over trials showed that the decline in brain activation from the first to the second dual-task trial was attenuated in the MCI group, while the brain activation from the first to the third trial decreased in control participants, but increased over these time points in MCI. During other dual tasks, which comprised of walking while counting backwards or naming animals, MCI status was linked to stronger functional connectivity between the left prefrontal cortex and the right occipital cortex. For the animal naming dual task, this was also true for connectivity between the left prefrontal cortex and the left motor cortex.
Manual motor function
Manual motor function comprises strength measures, as well as dexterity measures of the hand and fingers. Functional neuroimaging studies have looked at both brain activation and brain connectivity related to motor function with AD pathology. During a hand squeeze task inside an MRI scanner, AD participants showed less brain activation than control participants in the left supplementary motor area/superior frontal gyrus and the left premotor cortex/middle frontal gyrus [31] (see Table 2). Psycho-physiological interaction analysis with the primary motor cortex as seed region was used to identify regions where brain activity correlates with brain activity of the primary motor cortex during the hand squeeze task. This analysis revealed that relative to the control group, the AD group recruited larger regions of the fusiform gyrus, the middle cingulate gyrus, the sensorimotor cortex, the anterior cerebellum (lobule I-IV), and the cuneus. No significant differences between controls and individuals with MCI were observed in a study on the association finger tapping speed with brain connectivity [32]. In this study, within and between network connectivity of the default mode network, the frontoparietal network, and the sensorimotor network was assessed and tapping of both the left and right hand were studied independently.
Symptoms of parkinsonism
Motor symptoms of parkinsonism in the studies discussed here were assessed using the motor subscale of the Unified Parkinson’s Disease Rating Scale [33]. This clinician-rated tool results in a sum score of assessments of speech, tremor, rigidity, posture, hand movement, gait, leg agility, functional mobility, hypokinesia and bradykinesia. AD participants with a high subcortical WML load had more symptoms of parkinsonism than controls with a low lesion load, controls with a high lesion load, and AD participants with a low lesion load [24] (see Table 2). These results were replicated by the same group in a more recent study [25].
Studies evaluating gait in relation to neuroimaging without healthy control comparison
The studies described below report on the association between brain outcome measures and motor function in MCI/AD, but don’t compare these associations to those in a control group (see Table 3). Although these associations may shed light on the relationship between brain metrics and motor function in MCI/AD, it is not possible to ascribe these associations to the neurodegeneration resulting from MCI/AD because they could be part of normal aging.
Gait speed
Gait measures and specifically gait speed were the most investigated motor behavioral measures. Outcomes of studies investigating gait measures are summarized in Table 4. Overall, slower gait speed was associated with less volume of temporal and frontal brain regions, larger lateral ventricle size, stronger functional connectivity with the supplementary motor area, and larger amyloid depositions throughout the brain (see for details below). This pattern corresponds with associations reported in the section ‘Studies in MCI/AD reporting brain by group interactions on motor performance’.
Table 4
Aggregated results for studies reporting associations between gait motor performance and neuroimaging in participants with MCI or AD diagnosis without healthy control comparison
 |
Text numbers inside the cells indicate the citation number of the manuscript from which the result is extracted. If necessary, these letters are followed by two numbers indicating the year the study was published to differentiate between different publications that have the same first author. If no side (hemisphere; (L), (R), or (U) = unspecified) is indicated, studies looked at bilateral regions.  = Amnestic MCI;
  = undifferentiated MCI;
  = undifferentiated MCI (aMCI +naMCI) or a clinical dementia rating scale score of 0.5 without dementia;
  = AD; * = For normal walking speed, but not for rapid walking speed; X = ROI study that only looked at one side (either left or right). For ROI studies that looked at left and right, both will be presented, but the X distinguishes from Voxel Wise studies that only report one side, but have looked whole brain; Suppl., supplementary.
Gray matter volume, cortical thickness, and atrophy
Within participants with MCI, comfortable self-selected gait speed has been positively associated with volume of the primary motor cortex [34] (see Table 4), regional gray matter volume of the right superior temporal gyrus and the left superior temporal pole, and a thinner left and right superior temporal cortex [35], regional volume spanning the left and right thalamus, left fusiform gyrus, and the right superior temporal gyrus [36], left putamen, left and right caudate nucleus, and left insula [37], and volume of the left orbitofrontal cortex [38] (but see [39, 40]). Two studies which did not directly correlate brain volume with performance, linked gait speed to gray matter volume of spatial maps derived based on covariance techniques. The first study used whole-brain multivariate covariance-based analysis; a technique where the first 12 spatial principal component maps were derived from the gray matter maps and then related to gait speed. Significant associations were observed for regions overlapping with the inferior, medial, and superior frontal gyri, fusiform gyrus, cingulate gyrus (both the anterior and posterior parts), the occipital and middle temporal gyri, supplementary motor cortex, primary motor cortex, and thalamus [41]. The second study calculated which brain regions’ gray matter volume was associated with gray matter volume of a cluster in the orbitofrontal cortex that directly correlated with gait speed [38]. Anatomical regions around the orbitofrontal seed region stretching from the left orbitofrontal cortex to the right medial frontal gyrus covaried with the seed region, and were therefore suggested to play a role in gait speed. Reductions in gray matter and increases in ventricular volume can both represent cerebral atrophy. Reduced gait speed has also been linked to larger lateral cerebral ventricle volume in individuals with MCI [42].
White matter lesions
Three studies related semi-quantitative measures of either subcortical or periventricular white matter lesions to gait speed in MCI participants [42–44] (see Table 4), and one study related WML of five subcortical regions to gait speed in AD participants [24]. None of these studies reported significant associations after adjusting for potentially confounding factors.
Functional network connectivity
Brain functional connectivity can be derived from fMRI resting state scans. Connectivity strength can be assessed between pre-selected regions of interest, within networks where a network is defined as two or more brain regions that show coactivation, or between networks. Two studies within MCI participants showed that faster gait speed was related to stronger connectivity between a) the default mode network and the supplementary motor area [45] (see Table 4); and b) the supplementary motor area with the frontoparietal network, bilateral frontal eye fields, and bilateral superior lateral occipital cortex [46]. The later study also reported that a stronger functional connection between the supplementary motor area and the bilateral ventral visual cortices was predictive of slower gait speed.
Amyloid deposition
Higher global amyloid burden has been related to slower gait speed in a mixed group of individuals with MCI and individuals with physical and cognitive frailty [47] (see Table 4). Subregion analysis showed that slower gait speed was also associated with a higher amyloid burden in the basal ganglia, hippocampus, precuneus/posterior cingulate cortex, parietal cortex, temporal cortex, and frontal cortex.
Stride measures
Five studies related a variety of stride measures to gray matter volume and cortical thickness, while one study reported on the association between stride measures and WML burden. This suggest that widespread gray and white matter degeneration affects multiple aspects of gait, leading to disrupted ambulation in MCI and AD. Step length was inversely related with cortical thickness of the right middle frontal caudal and rostral cortex in aMCI participants [35] (see Table 4). Step length variability was negatively related to regional volume of the right middle temporal gyrus, right middle, superior and inferior frontal gyri, right precentral gyrus, left supplementary motor cortex, precuneus, fusiform, putamen, lingual, parahippocampal gyri and left cerebellum in aMCI participants [35]. In AD participants, stride length negatively correlated with WML severity in subcortical frontal regions and in the basal ganglia [24]. In MCI participants, stride length was positively associated with volume of the right thalamus, right parahippocampal gyrus, and right superior temporal gyrus [36]. Stride time variability was inversely related to volume of the primary motor cortex in MCI participants [34], but was not linked to hippocampal volume in individuals with aMCI, non-amnestic MCI, and AD, although the association in aMCI was marginally significant [48].
Gait disorder
A study in individuals with probable AD used the Rating Scale for Gait Evaluation in Cognitive Deterioration [49] to assess gait dysfunction. It was reported that less gray matter volume in clusters in the bilateral primary motor cortices, bilateral medial cingulate gyrus, bilateral insula, and bilateral anterior cerebellum indicated poorer gait [50] (see Table 4). Diffusion imaging was used in this sample to measure fractional anisotropy (FA); a metric of directionality of water diffusion in tissue. Among others, deterioration of white matter tissue can lead to lower FA values. Gait dysfunction in the sample of probable AD participants was linked to lower FA values in clusters within the right corticospinal tract, bilateral cingulum, left inferior longitudinal fasciculus, bilateral inferior fronto-occipital fasciculus, left forceps minor, left superior longitudinal fasciculus, and right anterior thalamic radiation (anatomical labels for the coordinates reported by Olazaran et al., were obtained from the JHU White-Matter Tractography Atlas [51]). In a different sample of AD participants, expert-rated gait disorder was found to be significantly associated with both WML in the subcortical/centrum semiovale and periventricular WML [52]. However, in an independent study in AD participants, subcortical WML were not associated with gait performance that was measured using the Tinetti gait assessment tool [24, 28].
Functional mobility
The majority of reviewed studies have used the timed up-and-go (TUG) test as a measure of functional mobility. Certain studies differentiated between physically completing the TUG (realized TUG; rTUG) and mentally executing the TUG without physically performing the actions (imaginary TUG; iTUG). The iTUG test allows for assessing higher (brain) level of gait control without the interference of physical limitations [53]. The time difference between iTUG and rTUG (ΔTUG) is a measure of motor functioning corrected for cognitive control. Overall, poorer functional mobility in MCI was associated with less frontal, temporal, and cerebellar volume, periventricular WML, and regional amyloid deposition (see below for details).
In individuals with non-amnestic MCI, rTUG was associated with smaller total white matter, total gray matter, and left and right hippocampal volume [53] (see Table 4). Increased iTUG completion time was related to smaller total gray matter volume and smaller left premotor cortex volume. Increased ΔTUG was associated with greater left prefrontal cortex volumes. No significant correlations were observed in aMCI participants. In a mixed sample of non-amnestic MCI and aMCI, significant correlations were found between ΔTUG and volume of clusters in the entorhinal cortex, amygdala, parahippocampal gyrus, insula, and hippocampus of the right hemisphere [54]. Slower TUG performance has also been associated to smaller gray matter volume of the cerebellum lobule VIII (bilateral) and the left middle cingulate cortex [55]. Post-hoc covariance analysis showed that the gray matter of the this left cerebellar region covaried with gray matter of the bilateral cerebellar regions, right middle cingulate cortex, left middle frontal gyrus, right thalamus and precuneus.
Presence of periventricular WML in individuals with MCI resulted in slower performance on the TUG [43] (see Table 4). In one report, functional mobility was expressed as a composite measure of number of falls in the previous 6 months, the walking-while-talking test, the timed up-and-go test, gait speed, and static balance [56]. Within a group of MCI participants, this outcome was linked to periventricular lesions around the frontal horns, but not to cerebral ventricle size.
Larger amyloid-β accumulation within the basal ganglia and the precuneus/posterior cingulate cortex has been related to slower TUG performance in a combined sample of individuals with MCI and cognitive and physical frailty [47] (see Table 4).
Time to complete the TUG test was related to total volume of WML in MCI [57] (see Table 4). However, in this same sample, performance on a TUG test, during which the cognitive load was increased by adding a serial subtraction task, was not associated with WML load.
Gait and cognition dual tasking
Volumetric and functional connectivity studies suggest that degeneration of the primary motor cortex and temporal lobe, as well as degeneration and activation changes of the default mode network are implied in poorer gait-cognitive dual tasking in MCI. Dual tasking comprised of walking while counting backwards from 100 was related to gray matter volume of regions spanning the right middle temporal gyrus, left and right parahippocampal gyrus, right fusiform gyrus, left inferior temporal gyrus, left and right middle occipital gyrus, left cuneus, right posterior cingulate, left anterior cingulate, left and right precuneus, and left cingulate gyrus [41] (see Table 4). Dual task cost under two conditions (counting backwards from 100 by one; subtracting serial sevens from one hundred) was inversely associated with volume of the left hemispheric entorhinal cortex [39]. Gait velocity during dual tasking (subtracting serial sevens from one hundred) was positively associated with volume of the primary motor cortex [34]. Two studies tested for the associations between deep and subcortical or periventricular WML and dual tasking performance, but no statistically significant findings were observed [43, 44]. Gait speed during walking and simultaneously subtracting serial sevens, relative to normal walking speed, was inversely related to functional connectivity within the default mode network [45].
Studies on non-gait motor function in relation to neuroimaging without healthy control comparison
Balance and trunk stability
Balance and trunk stability refer to the ability to maintain a vertical position during walking and while standing still under different conditions (e.g., one-legged, or with feet in front of one another). The studies reviewed here indicate that increased functional connectivity and degeneration of white matter reflect balance problems in MCI. A composite score of bipedal standing balance performance that comprised measures of visual, vestibular, and proprioceptive contributions to balance, as well as number of falls during a unipedal balance test were related to nucleus accumbens volume in AD [58] (see Table 5). More postural sway was related to greater functional connectivity of the default mode network (DMN) with the supplementary motor area in MCI participants [45]. One legged stance balance performance was related to presence of periventricular WML in a sample of unspecified MCI [43], but was not related to atrophy of the medial temporal lobe in a sample of aMCI participants [40]. Smoothness and stability of trunk movements during a dual tasking walking test (counting back by 7 from 100) was inversely related with subcortical and deep or periventricular WML load in MCI participants [44]. No link was observed in MCI participants between total volume of WML and balance measured using the figure-eight walking test [57].
Table 5
Aggregated results for studies reporting associations between non-gait motor performance and neuroimaging in participants with MCI or AD diagnosis without healthy control comparison
 |
Text inside the cells indicate the first few letters of the first author from the manuscript from which the result is extracted. If necessary, these letters are followed by two numbers indicating the year the study was published to differentiate between different publications that have the same first author. If no side (hemisphere; (L) or (R)) is indicated, studies looked at bilateral regions.  = Amnestic MCI;
 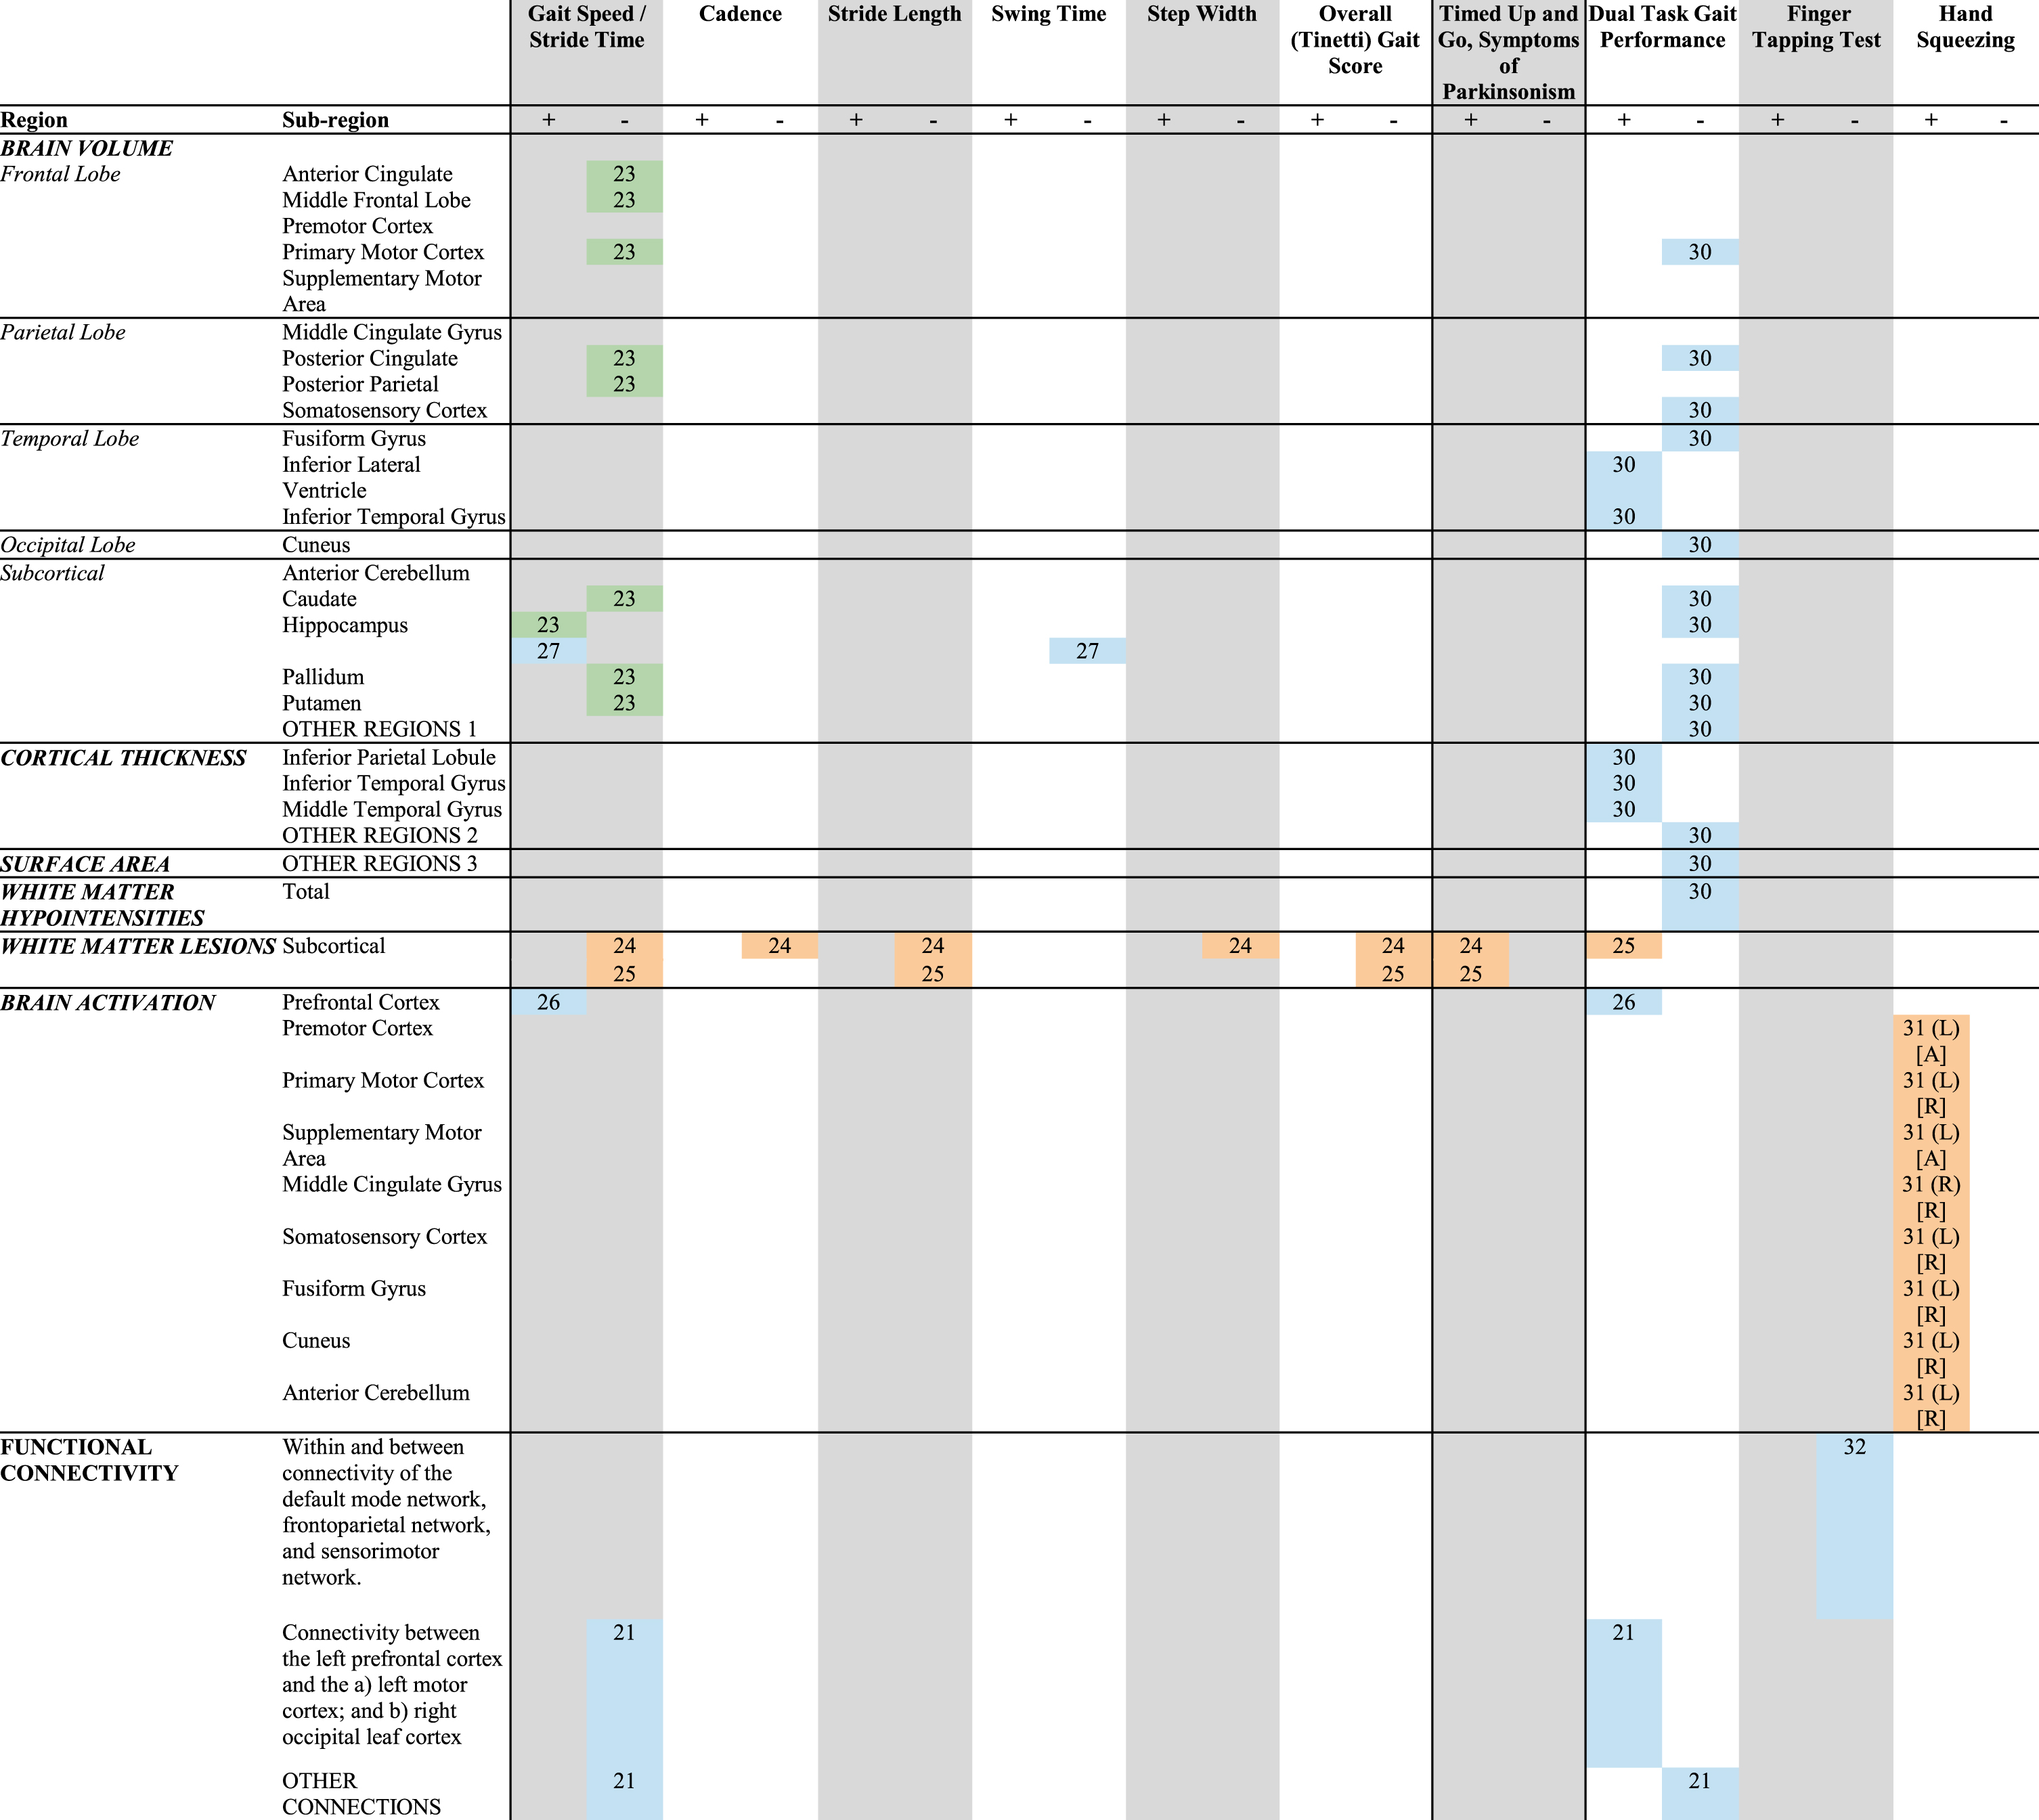 = undifferentiated MCI;
 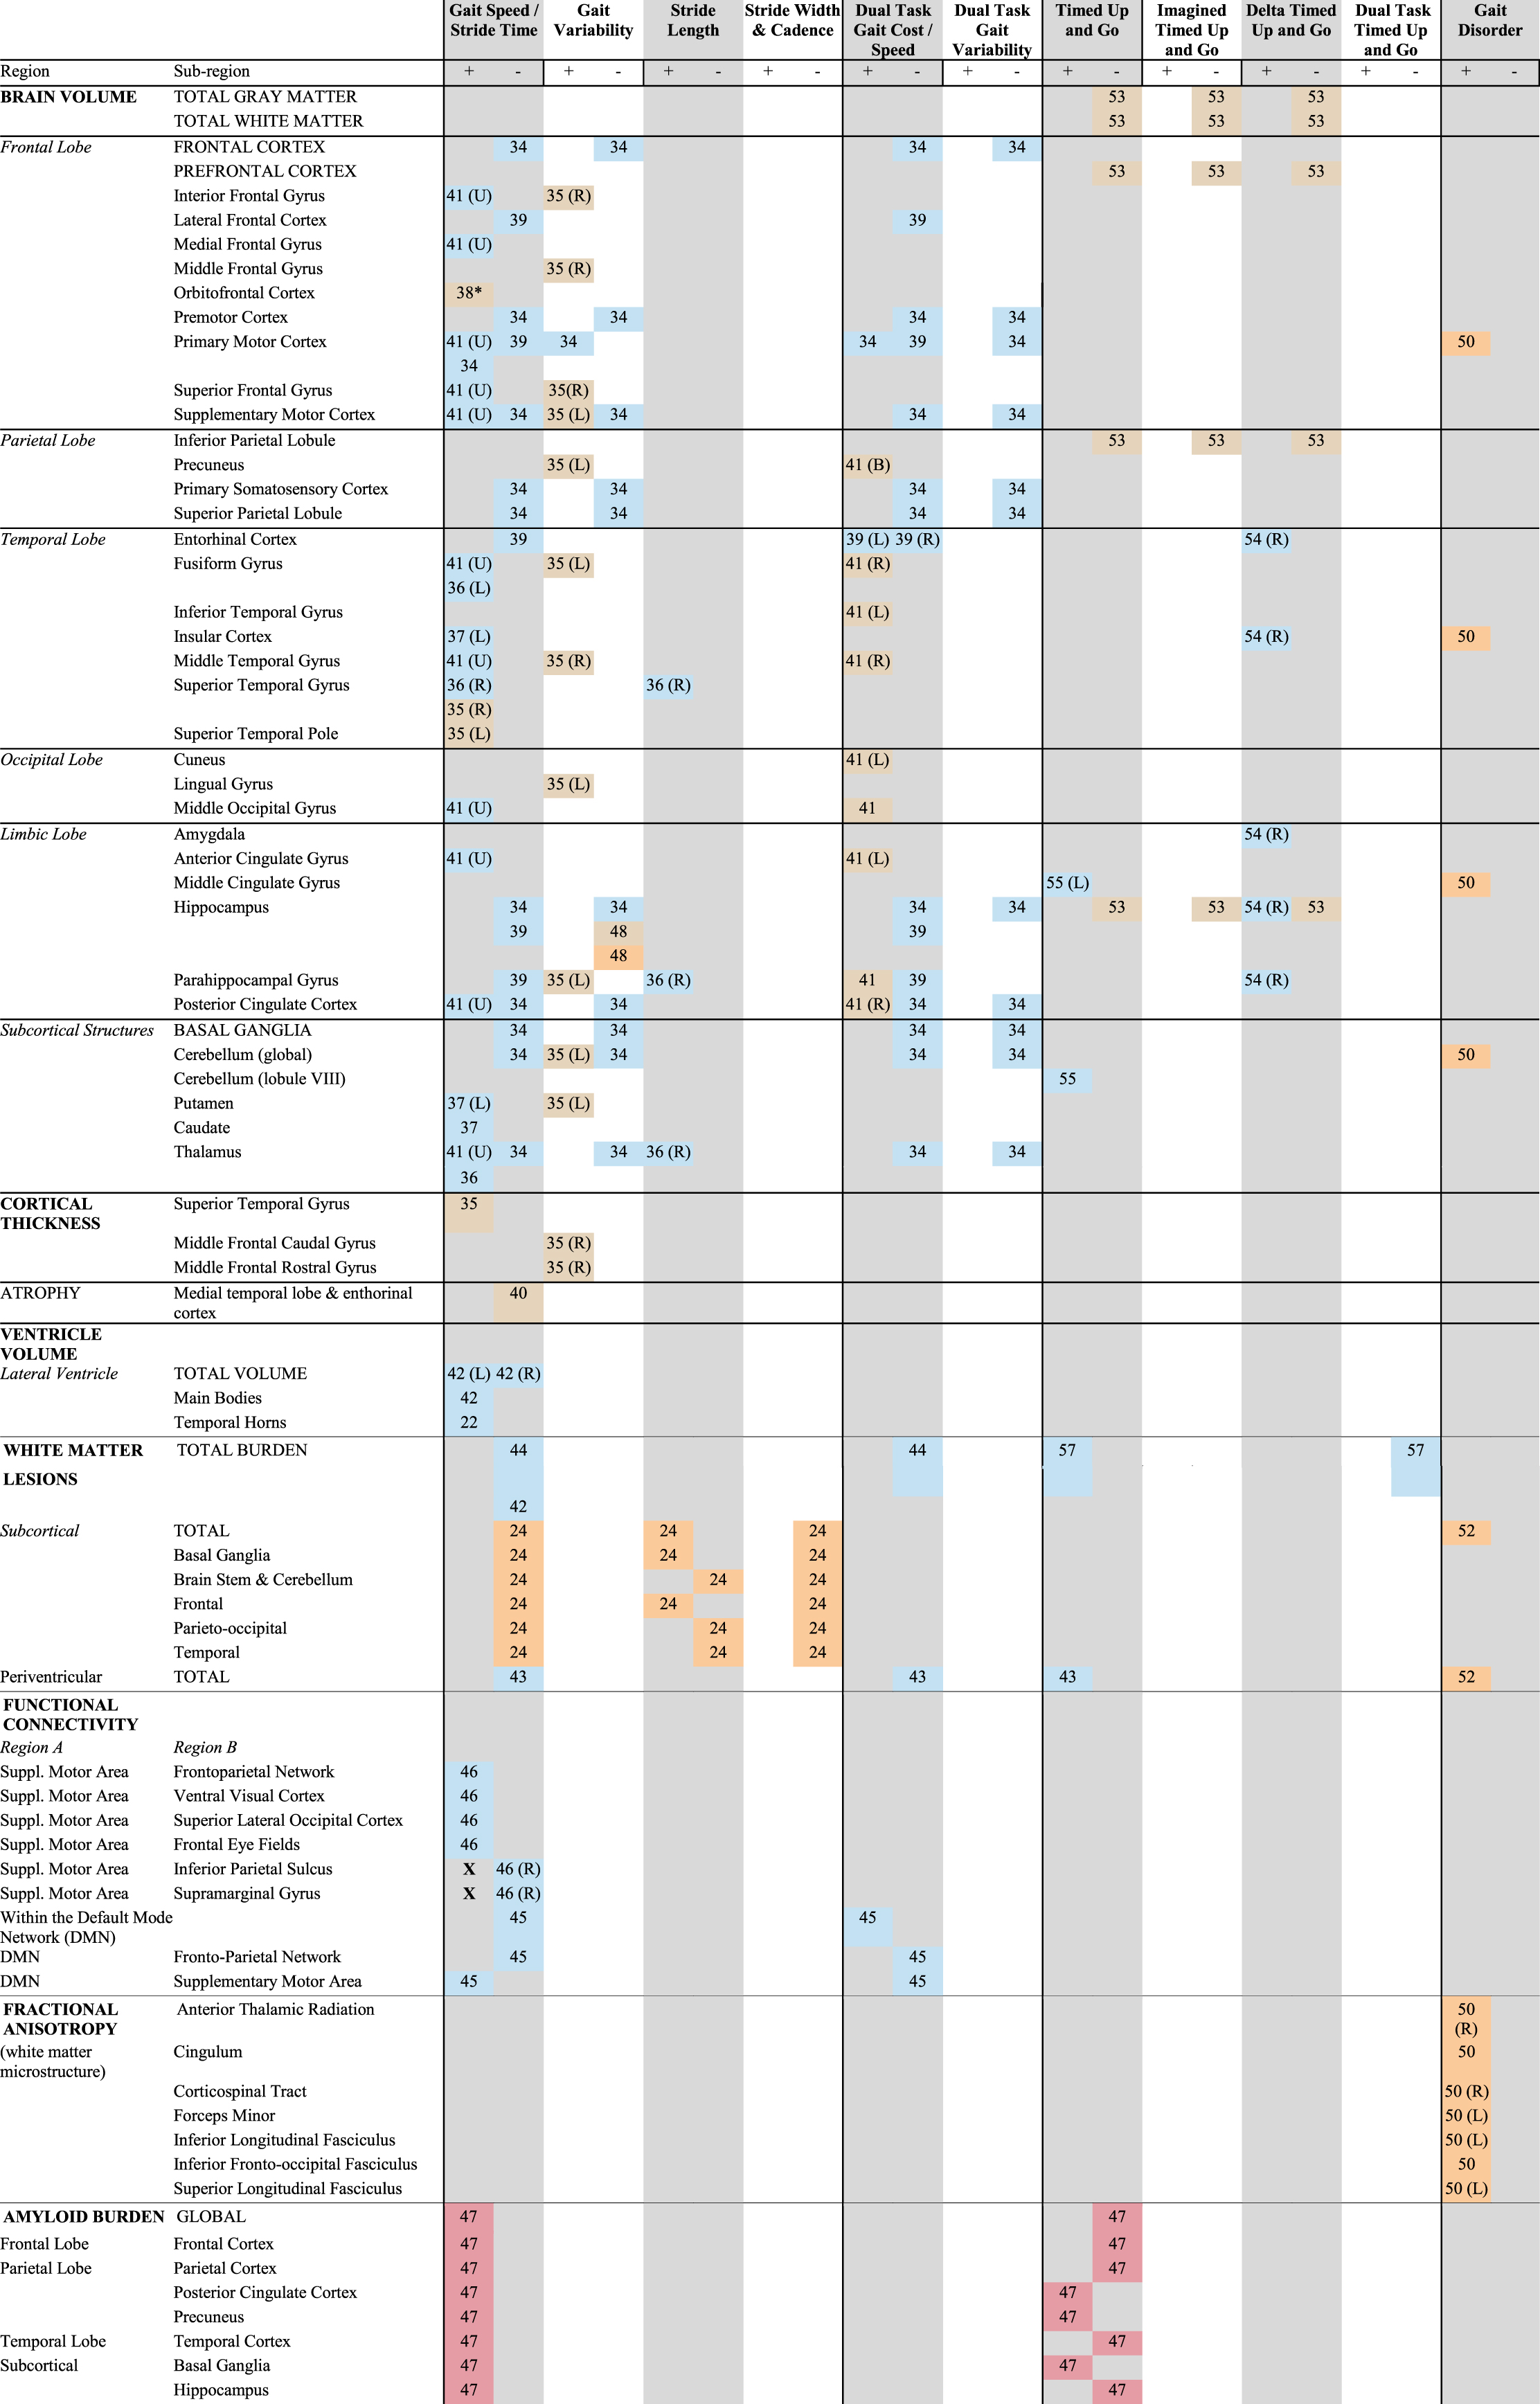 = undifferentiated MCI (aMCI +naMCI) or a clinical dementia rating scale score of 0.5 without dementia;
 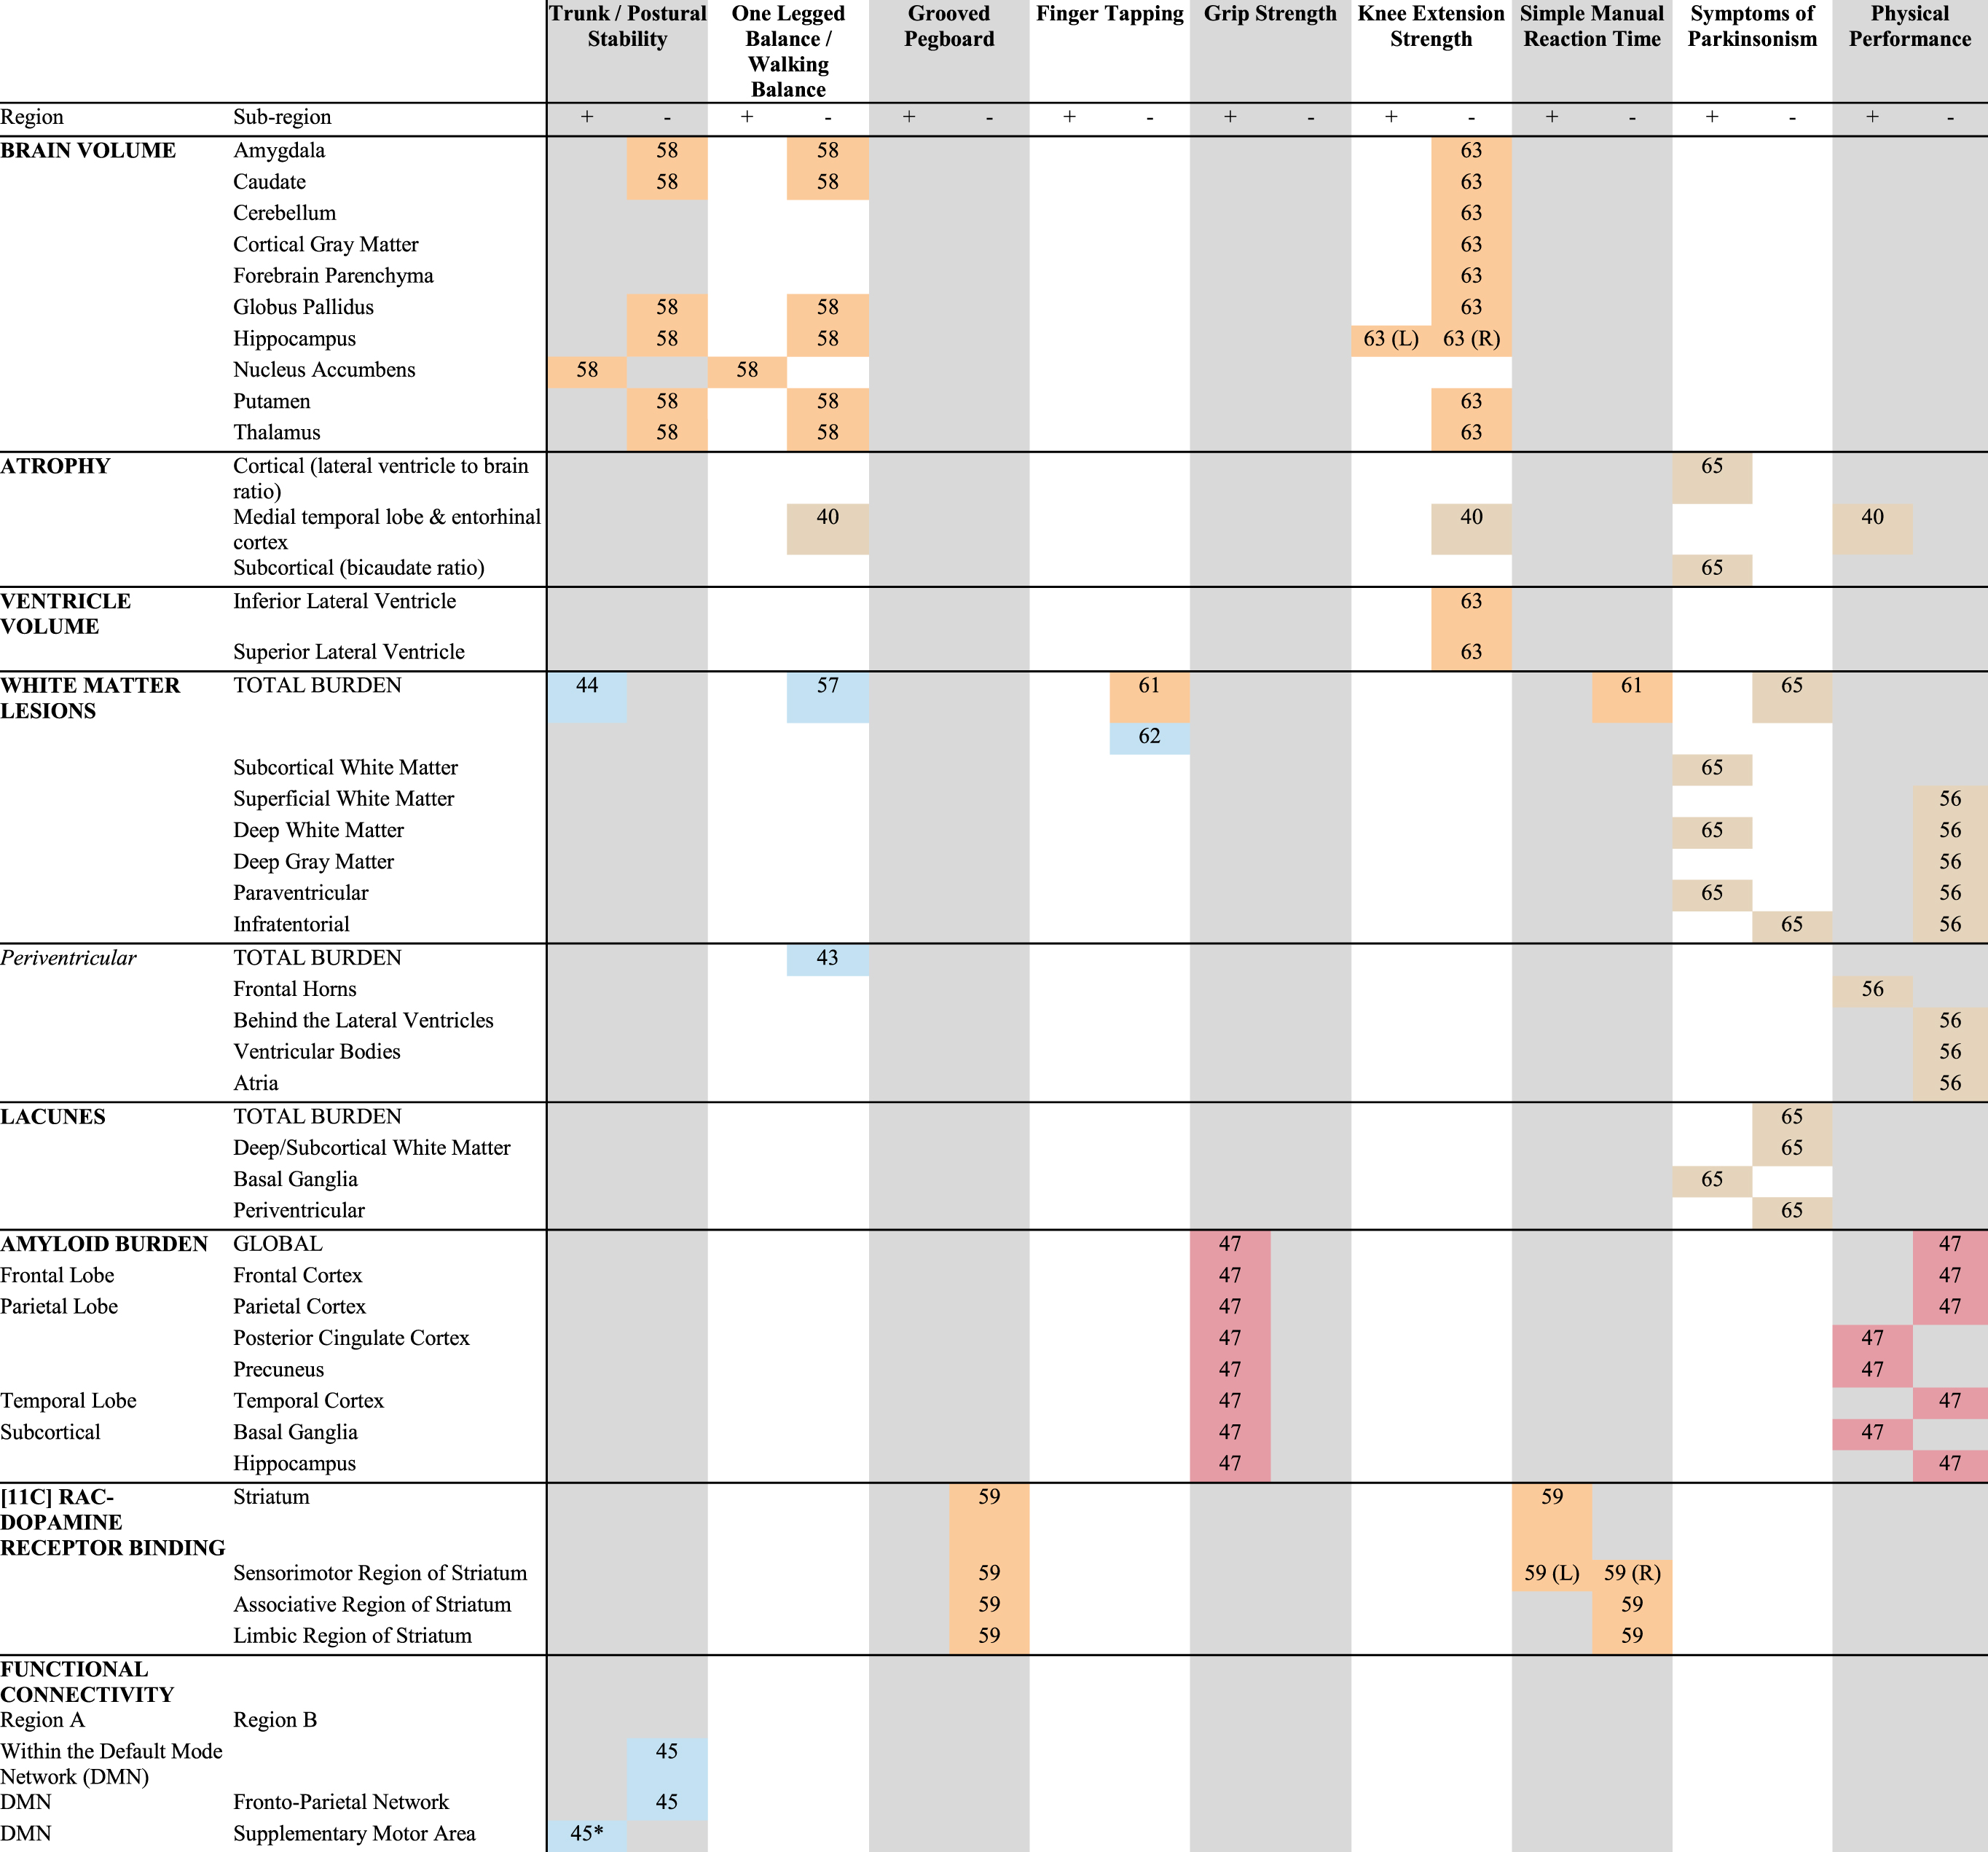 = AD; * = On a hard surface floor, but not on a foam surface.
Manual motor performance
Lower grip force strength has been associated with higher global and regional (i.e., the frontal, temporal, parietal cortices, the precuneus/posterior cingulate cortex, the hippocampus, and basal ganglia) amyloid-β depositions in a sample of MCI [47] (see Table 5). Furthermore, slower manual reaction time speed (pressing a button when a stimulus is presented on a screen) in a sample of AD participants was linked to less dopamine receptor availability in the sensorimotor region of the striatum [59].
Performance on measures of tapping speed and manual dexterity (i.e., the ability to make coordinated hand and finger movements to grasp and manipulate objects [60]), have not been linked to neural measures in MCI and AD. In a group of AD participants, no significant association was observed between dopamine receptor availability and dominant hand performance on the grooved pegboard test [59] (see Table 5). Studies associating left and right hand finger tapping speed with whole brain WML in AD [61] or hand tapping frequency with whole brain WML in MCI [62] also did not report significant links.
Physical performance and knee extension strength
Physical performance refers to overall motor function spanning multiple motor domains. Cardio-respiratory fitness, as approximated by performance on a 6-minute walking test, has been inversely linked to medial temporal lobe atrophy in aMCI [40] (see Table 5). Another study defined physical fitness as a composite score of a balance measures, gait speed, and rise-from-chair performance. In a combined sample of participants with MCI or physical and cognitive frailty, better performance on this summary measure was linked to higher amyloid depositions in the basal ganglia and the precuneus/posterior cingulate cortex [47].
Left hippocampal volume has been positively related to isokinetic (resistance is placed on the muscle that makes a full range of motion) knee extension strength in AD [63] (see Table 5). Isometric (muscle activation without movement; joints stay static and the muscle does not change in size) knee extension strength on the other hand, did not show a significant relationship with volume of the medial temporal lobe in aMCI [40].
Symptoms of parkinsonism
Within a sample of participants with single-domain aMCI, those who scored positive on at least one motor category of the UPDRS (i.e., tremor, rigidity, bradykinesia, or gait/balance/axial) were more likely to have periventricular WML, lacunae in the basal ganglia (small CSF filled cavities [64]), small vessel disease, and cortical atrophy [65] (see Table 5). Within multi-domain aMCI participants, such symptoms of parkinsonism were associated with presence of deep/subcortical and periventricular white matter lesions, and cortical and subcortical atrophy.
DISCUSSION
Motor dysfunction is prevalent in individuals along the AD disease continuum. The neural substrate of motor impairments in AD is not well understood. With this review, we provide a comprehensive overview of the possible structural and neural underpinnings of different types of motor behavior in AD. We furthermore summarize how often individual motor behaviors were studied and what neuroimaging techniques were used to provide insight in how well these topics are currently understood.
Integrated summary
Out of the 37 studies we identified in our literature search, nine formally tested if associations between motor function and neural measures differed between a control group and participants with MCI and/or AD. These studies found that slower gait speed in individuals with MCI and AD was related to smaller hippocampi [23, 27]. They also found that individuals with MCI had a larger decline in prefrontal cortex activation during walking at normal pace [26]. Participants with MCI also showed less prefrontal brain activation but stronger connectivity of the left prefrontal cortex with the left motor cortex and the right occipital cortex when walking while performing a cognitive task [21, 26]. Gray matter of the inferior temporal lobule and inferior and middle temporal gyrus were strongly related to motor-cognitive dual tasking performance in MCI, while this association was weak to absent in control participants [30]. Also, the extent of increase in prefrontal brain activation that is seen in controls when adding a cognitive task while walking is smaller in MCI [30]. Furthermore, participants with MCI and AD have more activation in cerebellar, cingulate, cuneal, somatosensory, and fusiform brain regions when performing a hand squeezing task [31], and the relative excess of subcortical WML in AD is associated with more signs of parkinsonism, poorer performance during a task requiring simultaneous cognitive and motor performance, and poorer functional mobility [24, 25]. This suggests that motor dysfunction in MCI and AD is related to both the characteristic medial temporal lobe degeneration as well as small vessel disease. It furthermore indicates that motor deficits in MCI and AD are related to the activation and interconnection of an elaborate network of motor brain regions that span cortical, subcortical, and infratentorial regions. The differential association between gait and prefrontal cortical brain activation further reflects the cognitive component in gait and is in line with studies showing that gait relies on higher cognitive functions such as attention and executive functioning [66] and that slower gait has been linked to frontal gray matter volume reductions [67].
The majority of studies that we identified reported relationships between motor function and neural metrics stratified for MCI/AD and control samples, without reporting the neural predictor-by-group interaction effects. With such statistical designs, it is not possible to conclude that disease-related neurodegeneration is responsible for any of the observed motor impairments in MCI/AD. Nonetheless, in light of the limited studies that do report interaction effects, the outcomes of these studies provide some insight in the brain regions and degenerative processes potentially underlying motor impairments in MCI and AD. Together, these studies suggest that slower gait speed in MCI and AD is related to less gray matter volume in frontal [34, 38, 41], temporal [35, 36, 41], cingulum [41], and subcortical brain regions [36, 37, 41], larger lateral ventricles [42], larger widespread white matter degeneration [24, 42–44], global build up of amyloid-β [47], and decreases in coherence between the sensorimotor network and the frontoparietal network [45, 46].
Other aspects of gait, such as stride time variability and step length, were found to be related to volume of the primary motor cortex [34] and precentral gyrus, supplementary motor cortex, cerebellum and parahippocampal gyrus respectively [35]. Motor tests that incorporate gait, such as gait-cognitive dual tasking, and the timed up-and-go test, were related to degeneration of the primary motor cortex and temporal lobe [34, 39, 41], as well as degeneration and activation changes of the default mode network (dual tasking) [45], and less frontal, temporal, and cerebellar volume [55], periventricular WML [43, 56], and amyloid deposition in the precuneus and cingulum [47]. Gait disorders in AD were related to volume loss of motor brain regions such as the primary motor cortex and the cerebellum [49], subcortical and periventricular WML [52], and microstructural white matter changes of several white matter projections, including the corticospinal tract [50].
Other motor functions that were investigated in MCI and AD samples were much less often investigated than gait, which makes it difficult to draw firm conclusions. These non-gait studies are suggesting that balance deficits in MCI and AD are related to periventricular and subcortical WML [41, 43] and connectivity between the supplementary motor area and DMN [45]. There were some indications that grip weakness is related to global amyloid deposition [47], and that manual reaction time in AD is related to striatal dopamine binding [59]. Symptoms of parkinsonism in amnestic MCI were associated with subcortical vascular pathology, periventricular WML, and cortical atrophy [65], whereas overall physical performance was related to medial temporal lobe atrophy [40], amyloid deposition in the parietal lobe and basal ganglia [47]. It should be noted that lack of statistically significant associations is not proof for the absence of such associations. To the contrary, in light of the limited number of investigations and often small sample sizes, future studies should continue to investigate them to provide more conclusive evidence while Bayesian models can be used to formally test the absence of relationships between brain measures and motor function [68].
In summary, the reviewed studies indicate that gait and gait-related dysfunction in MCI and AD is related to atrophy of medial temporal lobe and motor brain regions, ventricular enlargement, global amyloid deposition, white matter damage, disturbed connectivity between motor and frontal regions, and prefrontal hypoactivation. There was limited evidence that dysfunction of non-gait motor functions in MCI and AD are affected by neurodegeneration specific to AD pathology, but this is mainly due to lack of investigations of non-gait motor behavior.
Confounding factors and limitations
Despite the body of work completed in this area, there are a number of noteworthy limitations that were revealed through this review. All but two studies had cross-sectional study designs, thereby limiting our understanding of the direction of the association and any indication of causation. Another limitation of the studies reviewed here is that many studies had small sample sizes, with 13 studies having at least one experimental group with fewer than 30 participants. While the sample sizes for studies reporting group-by-brain interactions ranged from 9–43 per experimental group, the remaining studies had experimental samples with a larger upper bound, ranging from 20 to 347. The negative findings of studies with small studies should thus be interpreted with caution.
The majority of studies included only MCI patients while a minority included AD patients. Only two studies included both MCI and AD participants. Studies that do include both groups and use designs to test differences in motor function and brain associations can improve our understanding on how these associations develop with the progression of AD pathology.
The majority of studies reviewed did not distinguish between amnestic and non-amnestic MCI. Whereas the greater field has not consistently and specifically characterized the subtypes of MCI examined, it may not be surprising that these motor/imaging studies have perpetuated this limitation. However, failing to more clearly characterize one’s sample may stymie true advancement. For example, a sample of poorly defined MCI may reflect AD, cerebrovascular disease, or dementia with Lewy bodies. This might be particularly important, as Lewy body disease is associated with slowness of gait [69] and other parkinsonian features [70]. On most motor behavioral measures Lewy body patients generally perform worse than individuals with MCI due to AD [71] and motor dysfunction in Lewy body disease has been associated with neural degeneration such as white matter microstructural changes and frontal and parietal cortical thinning [72] as well. Future studies should focus on participants with amnestic MCI when studying the neural mechanisms of motor dysfunction due to AD to ensure we are not in fact studying the mechanisms of motor dysfunction in MCI due to Lewy body disease or other non-AD etiologies.
Thirteen studies that we reviewed had experimental groups with fewer than 30 participants. These studies may have been underpowered to detect true associations between motor function and neural measures. Therefore, the negative findings of these small studies should be interpreted with caution.
Few studies have investigated the same motor behavior with the same neuroimaging outcome measures, as can be seen from the overview tables. Although we report convergence of results despite differences in methodology, mixed results in associations between motor measures and brain metrics may have been due to differences in study design, predictive, and outcome measures. More consistency in both the motor measures used and the neuroimaging modalities will help determine the robustness of their associations.
Lastly, the reviewed studies did not look at sex differences in the relationship between motor function and brain measures, but merely adjusted for its effect statistically. It is therefore uncertain if the relationship between motor differences and brain differences in MCI and AD differ by sex. The fact that shared risk factors for AD and brain disease, such as hypertension [73, 74], are also related to motor performance such as gait speed [75], and the fact that there are sex differences in motor performance [76], neuroanatomy [77], neurobiology [78], and age-related neuropathology [79] warrants studying sex differences. This idea is supported by reports showing sex differences in motor behavior in AD, such as relationship between cognitive function and muscle strength in AD males that is absent in AD females [80], and poorer balance performance in MCI and AD compared to cognitively normal controls in females, but not in males [6]. Nevertheless, the small sample sizes of the reviewed study may have prevented them to detect true sex differences, which further stress the necessity of larger sample sizes in future investigations.
Future perspectives
Focus of motor behavior beyond gait function and integration of motor behavior
Gait disturbances are the most commonly reported motor problems in AD. They are predictive of incident AD [81] and gait problems have shared pathophysiological pathways with cognitive deficits [82]. Gait is also very functionally relevant for an individual’s autonomy and has been part of clinical neurological examination long before other measures became part of routine assessments [83]. It is therefore not surprising that most motor behavioral studies in AD that add neuroimaging measures to their protocols are also gait studies.
Nevertheless, several studies have reported that there is a wide variety of motor dysfunction in AD beyond gait problems. These motor deficits that comprise balance, [84–87], muscle strength [5, 88, 89], implicit motor learning [90], graphomotor functions, [91, 92], finger tapping speed [7], and bimanual coordination [93] have received less attention.
The pattern of widespread motor behavioral deficits in MCI and AD implies that gait should not be the single (or even the primary) outcome in motor behavioral studies in MCI and AD. In fact, previous work has shown that combining motor behavioral measures more strongly predicts [94] or better classifies [95] AD than single measures do. Future studies should therefore combine assessments addressing the breadth of motor domains when studying neural mechanisms underlying motor dysfunction in MCI and AD if we want to obtain an integral explanation and if we want to understand which neural deficits in MCI and AD are responsible for either cognitive deficits, motor deficits, or both.
Need for integration of multi-modal imaging
Overall, motor dysfunction in MCI and AD appears to be related to multi-system neuropathology including atrophy, small vessel disease, and amyloid deposition. As such, it is important to study motor dysfunction in MCI and AD using multi-modal imaging to improve our understanding of the neural mechanisms of motor dysfunction in these conditions. Currently, most studies report on brain-motor behavioral associations of single imaging modalities. This prevents the development of models that consider these neural predictors to interact. Future studies should consider an integrated approach that includes multi-modal imaging predictors when studying the relationship between neural degeneration and motor dysfunction in MCI and AD [96].
Necessity of studying brain regions beyond hippocampal volume and frontal circuits
Gray matter volume, specifically that of the hippocampus, was the most studied neural predictor of motor dysfunction in MCI and AD. Brain volume of other regions that were most often related to gait function in MCI and AD included frontal (motor) regions, subcortical areas, and medial temporal lobe structures. Other regions that play a crucial role in motor function [97] and which have reported to be affected in AD [98–100], such as the cerebellum, were only investigated in five studies. Considering our current limited understanding of the neural underpinnings of motor dysfunction in MCI and AD, it is warranted to use both hypothesis free (e.g., voxel-wise analysis) as well as more powerful hypothesis driven (e.g., region of interest analysis) techniques.
ACKNOWLEDGMENTS
The authors have no acknowledgments to report.
FUNDING
This work was supported by the National Institutes of Health/National Institute on Aging [1K01AG073578].
CONFLICT OF INTEREST
The authors have no conflict of interest to report.
SUPPLEMENTARY MATERIAL
[1] The supplementary material is available in the electronic version of this article: https://dx.doi.org/10.3233/ADR-210065.
REFERENCES
[1] | DeCarli C ((2003) ) Mild cognitive impairment: Prevalence, prognosis, aetiology, and treatment. Lancet Neurol 2: , 15–21. |
[2] | Albers MW , Gilmore GC , Kaye J , Murphy C , Wingfield A , Bennett DA , Boxer AL , Buchman AS , Cruickshanks KJ , Devanand DP , Duffy CJ , Gall CM , Gates GA , Granholm Ann-Charlotte , Hensch T , Holtzer R , Hyman BT , Lin FR , McKee AC , Morris JC , Petersen RC , Silbert LC , Struble RG , Trojanowski JQ , Verghese J , Wilson DA , Xu S , Zhang LI ((2015) ) At the interface of sensory and motor dysfunctions and alzheimer’s disease. Alzheimers Dement 11: , 70–98. |
[3] | Masse FAA , Ansai JH , Fiogbe E , Rossi PG , Vilarinho ACG , de Medeiros Takahashi AC , de Andrade LP ((2021) ) Progression of gait changes in older adults with mild cognitive impairment. J Geriatr Phys Ther 44: , 119–124. |
[4] | de Oliveira Silva F , Ferreira JV , Plácido J , Chagas D , PraxedesJ , Guimarães C , Batista LA , Marinho V , Laks J , Deslandes AC ((2019) ) Stages of mild cognitive impairment and Alzheimer’s diseasecan be differentiated by declines in timed up and go test: Asystematic review and meta-analysis. Arch Gerontol Geriatr 85: , 103941. |
[5] | Buchman AS , Wilson RS , Boyle PA , Bienias JL , Bennett DA ((2007) ) Grip strength and the risk of incident Alzheimer’s disease. Neuroepidemiology 29: , 66–73. |
[6] | Yoon B , Choi SH , Jeong JH , Park KW , Kim E-J , Hwang J , Jang J-W , Kim HJ , Hong JY , Lee J-M , Kang J-H , Yoon SJ ((2020) ) Balance and mobility performance along the Alzheimer’s disease spectrum. J Alzheimers Dis 73: , 633–644. |
[7] | Roalf DR , Rupert P , Mechanic-Hamilton D , Brennan L , Duda JE , Weintraub D , Trojanowski JQ , Wolk D , Moberg PJ ((2018) ) Quantitative assessment of finger tapping characteristics in mild cognitive impairment, Alzheimer’s disease, and Parkinson’s disease. J Neurol 265: , 1365–1375. |
[8] | de Paula JJ , Albuquerque MR , Lage GM , Bicalho MA , Romano-Silva MA , Malloy-Diniz LF ((2016) ) Impairment of fine motor dexterity in mild cognitive impairment and Alzheimer’s disease dementia: Association with activities of daily living. Braz J Psychiatry 38: , 235–238. |
[9] | Verghese J , Robbins M , Holtzer R , Zimmerman M , Wang C , Xue X , Lipton RB ((2008) ) Gait dysfunction in mild cognitive impairment syndromes. J Am Geriatr Soc 56: , 1244–1251. |
[10] | Sullivan KJ , Ranadive R , Su D , Neyland BR , Hughes TM , HugenschmidtCE , Lockhart SN , Wong DF , Jack CR , Gottesman RF , Mosley TH , Griswold ME , Windham BG ((2021) ) Imaging-based indices of neuropathology andgait speed decline in older adults: The atherosclerosis risk incommunities study. Brain Imaging Behav 15: , 2387–2396. |
[11] | Nadkarni NK , Perera S , Snitz BE , Mathis CA , Price J , Williamson JD , DeKosky ST , Klunk WE , Lopez OL ((2017) ) Association of brainamyloid-β with slow gait in elderlyindividuals without dementia. JAMA Neurol 74: , 82. |
[12] | Ezzati A , Katz MJ , Lipton ML , Lipton RB , Verghese J ((2015) ) The association of brain structure with gait velocity in older adults: A quantitative volumetric analysis of brain MRI. Neuroradiology 57: , 851–861. |
[13] | Niemann C , Godde B , Voelcker-Rehage C ((2014) ) Not onlycardiovascular, but also coordinative exercise increases hippocampalvolume in older adults. Front Aging Neurosci 6: , 170. |
[14] | Wennberg AM , Savica R , Mielke MM ((2017) ) Association between various brain pathologies and gait disturbance. Dement Geriatr Cogn Disord 43: , 128–143. |
[15] | Kueper JK , Speechley M , Lingum NR , Montero-Odasso M ((2017) ) Motor function and incident dementia: A systematic review and meta-analysis. Age Ageing 46: , 729–738. |
[16] | Buchman AS , Bennett DA ((2011) ) Loss of motor function in preclinical Alzheimer’s disease. Expert Rev Neurother 11: , 665–676. |
[17] | Temple R ((2010) ) Enrichment of clinical study populations. Clin Pharmacol Ther 88: , 774–778. |
[18] | Tifratene K , Robert P , Metelkina A , Pradier C , Dartigues JF ((2015) ) Progression of mild cognitive impairment to dementia due to ad in clinical settings. Neurology 85: , 331–338. |
[19] | Roberts RO , Geda YE , Knopman DS , Cha RH , Pankratz VS , Boeve BF , Tangalos EG , Ivnik RJ , Rocca WA , Petersen RC ((2012) ) The incidence of MCI differs by subtype and is higher in men: The mayo clinic study of aging. Neurology 78: , 342–351. |
[20] | Schneider JA , Arvanitakis Z , Bang W , Bennett DA ((2007) ) Mixed brain pathologies account for most dementia cases in community-dwelling older persons. Neurology 69: , 2197–2204. |
[21] | Liu Y , Huo C , Lu K , Liu Q , Xu G , Ji R , Zhang T , Shang P , Lv Z , Li Z ((2021) ) Correlation between gait and near-infrared brain functional connectivity under cognitive tasks in elderly subjects with mild cognitive impairment. Front Aging Neurosci 13: , 482447. |
[22] | Allen G , Barnard H , McColl R , Hester AL , Fields JA , Weiner MF , Ringe WK , Lipton AM , Brooker M , McDonald E , Rubin CD , Cullum CM ((2007) ) Reduced hippocampal functional connectivity in Alzheimer disease. Arch Neurol 64: , 1482. |
[23] | Rosso AL , Verghese J , Metti AL , Boudreau RM , Aizenstein HJ , Kritchevsky S , Harris T , Yaffe K , Satterfield S , Studenski S , Rosano C ((2017) ) Slowing gait and risk for cognitive impairment: The hippocampus as a shared neural substrate. Neurology 89: , 336–342. |
[24] | Nadkarni NK , McIlroy WE , Mawji E , Black SE ((2009) ) Gait and subcortical hyperintensities in mild Alzheimer’s disease and aging. Dement Geriatr Cogn Disord 28: , 295–301. |
[25] | Nadkarni NK , Levine B , McIlroy WE , Black SE ((2012) ) Impact of subcortical hyperintensities on dual-tasking in Alzheimer disease and aging. Alzheimer Dis Assoc Disord 26: , 28–35. |
[26] | Holtzer R , Izzetoglu M ((2020) ) Mild cognitive impairments attenuate prefrontal cortex activations during walking in older adults. Brain Sci 10: , 415. |
[27] | Beauchet O , Launay CP , Annweiler C , Allali G ((2015) ) Hippocampal volume, early cognitive decline and gait variability: Which association? Exp Gerontol 61: , 98–104. |
[28] | Tinetti ME , Williams TF , Mayewski R ((1986) ) Fall risk index for elderly patients based on number of chronic disabilities. Am J Med 80: , 429–434. |
[29] | Bahureksa L , Najafi B , Saleh A , Sabbagh M , Coon D , Mohler MJ , Schwenk M ((2016) ) The impact of mild cognitive impairment on gait and balance: A systematic review and meta-analysis of studies using instrumented assessment. Gerontology 63: , 67–83. |
[30] | Grijalva C , Toosizadeh N , Sindorf J , Chou Y-h , Laksari K ((2021) ) Dual-task performance is associated with brain MRI morphometry in individuals with mild cognitive impairment. J Neuroimaging 31: , 588–601. |
[31] | Vidoni ED , Thomas GP , Honea RA , Loskutova N , Burns JM ((2012) ) Evidence of altered corticomotor system connectivity in early-stage Alzheimer’s disease. J Neurol Phys Ther 36: , 8–16. |
[32] | Crockett RA , Hsu CL , Best JR , Beauchet O , Liu-Ambrose T ((2019) ) Head over heels but I forget why: Disruptive functional connectivity in older adult fallers with mild cognitive impairment. Behav Brain Res 376: , 112104. |
[33] | Martínez-Martín P , Gil-Nagel A , Gracia LM , Gómez JB , Martínez-Sarriés J , Bermejo F ((1994) ) Unified Parkinson’sDisease Rating Scale characteristics and structure. The CooperativeMulticentric Group. Mov Disord 9: , 76–83. |
[34] | Annweiler C , Beauchet O , Bartha R , Wells JL , Borrie MJ , Hachinski V , Montero-Odasso M ((2013) ) Motor cortex and gait in mild cognitive impairment: A magnetic resonance spectroscopy and volumetric imaging study. Brain 136: , 859–871. |
[35] | Ali P , Labriffe M , Paisant P , Custaud MA , Annweiler C , Dinomais M ((2022) ) Associations between gait speed and brain structure in amnestic mild cognitive impairment: A quantitative neuroimaging study. Brain Imaging Behav 16: , 228–238. |
[36] | Cosentino E , Palmer K , Della Pietà C , Mitolo M , Meneghello F , Levedianos G , Iaia V , Venneri A ((2020) ) Association between gait,cognition, and gray matter volumes in mild cognitive impairment andhealthy controls. Alzheimer Dis Assoc Disord 34: , 231–237. |
[37] | Beauchet O , Montembeault M , Barden JM , Szturm T , Bherer L , Liu-Ambrose T , Chester VL , Li K , Helbostad JL , Allali G ((2019) ) Brain gray matter volume associations with gait speed and related structural covariance networks in cognitively healthy individuals and in patients with mild cognitive impairment: A cross-sectional study. Exp Gerontol 122: , 116–122. |
[38] | Allali G , Montembeault M , Saj A , Wong CH , Cooper-Brown LA , Bherer L , Beauchet O ((2019) ) Structural brain volume covariance associated with gait speed in patients with amnestic and non-amnestic mild cognitive impairment: A double dissociation. J Alzheimers Dis 71: , S29–S39. |
[39] | Sakurai R , Bartha R , Montero-Odasso M ((2019) ) Entorhinal cortex volume is associated with dual-task gait cost among older adults with MCI: Results from the gait and brain study. J Gerontol A Biol Sci Med Sci74: , 698–704. |
[40] | Makizako H , Shimada H , Doi T , Yoshida D , Ito K , Kato T , Shimokata H , Washimi Y , Endo H , Suzuki T , ((2011) ) The association between decline in physical functioning and atrophy of medial temporal areas in community-dwelling older adults with amnestic and nonamnestic mild cognitive impairment. Arch Phys Med Rehabil 92: , 1992–1999. |
[41] | Doi T , Blumen HM , Verghese J , Shimada H , Makizako H , Tsutsumimoto K , Hotta R , Nakakubo S , Suzuki T , ((2017) ) Gray matter volume and dual-task gait performance in mild cognitive impairment. Brain Imaging Behav 11: , 887–898. |
[42] | Annweiler C , Beauchet O , Bartha R , Montero-Odasso M ((2013) )Slow gait in MCI is associated with ventricular enlargement: Results from the Gait and Brain Study. J Neural Transm (Vienna) 120: , 1083–1092. |
[43] | Onen F , Henry-Feugeas MC , Roy C , Baron G , Ravaud P ((2008) ) Mobility decline of unknown origin in mild cognitive impairment: An MRI-based clinical study of the pathogenesis. Brain Res 1222: , 79–86. |
[44] | Doi T , Shimada H , Makizako H , Tsutsumimoto K , Hotta R , Nakakubo S , Suzuki T , ((2015) ) Effects of white matter lesions on trunk stability during dual-task walking among older adults with mild cognitive impairment. Age (Dordr) 37: , 120. |
[45] | Crockett RA , Hsu CL , Best JR , Liu-Ambrose T ((2017) ) Resting state default mode network connectivity, dual task performance, gait speed, and postural sway in older adults with mild cognitive impairment. Front Aging Neurosci9: , 423. |
[46] | Hsu CL , Best JR , Voss MW , Handy TC , Beauchet O , Lim C , Liu-Ambrose T ((2019) ) Functional neural correlates of slower gait among older adults with mild cognitive impairment. J Gerontol A Biol Sci Med Sci 74: , 513–518. |
[47] | Yoon D , Lee J-Y , Shin S , Kim Y , Song W ((2018) ) Physical frailty and amyloid-β deposits in the brains of older adults with cognitive frailty. J Clin Med 7: , 169. |
[48] | Beauchet O , Launay CP , Sekhon H , Montembeault M , Allali G ((2019) )Association of hippocampal volume with gait variability in pre-dementia and dementia stages of Alzheimer disease: Results from a cross-sectional study. Exp Gerontol 115: , 55–61. |
[49] | Martínez-Martín P , Osa-Ruiz E , Gómez-Conesa A , Olazarán J , RSGE-CD Validation Group ((2012) ) A Rating Scale forGait Evaluation in Cognitive Deterioration (RSGE-CD): Validationstudy. J Alzheimers Dis 31: , 543–553. |
[50] | Olazarán J , Hernández-Tamames JA , Molina E , García-PoloP , Dobato JL , Álvarez-Linera J , Martínez-Martín P ((2013) ) Clinical and anatomical correlates of gait dysfunction inAlzheimer’s disease. J Alzheimers Dis 33: , 495–505. |
[51] | Oishi K ((2011) ) MRI Atlas of Human White Matter, Elsevier/Academic Press, Amsterdam. |
[52] | Bennett DA , Gilley DW , Wilson RS , Huckman MS , Fox JH ((1992) ) Clinical correlates of high signal lesions on magnetic resonance imaging in Alzheimer’s disease. J Neurol 239: , 186–190. |
[53] | Allali G , Annweiler C , Predovan D , Bherer L , Beauchet O ((2016) ) Brain volume changes in gait control in patients with mild cognitive impairment compared to cognitively healthy individuals; gait study results. Exp Gerontol 76: , 72–79. |
[54] | Beauchet O , Montembeault M , Allali G ((2020) ) Brain gray matter volume associations with abnormal gait imagery in patients with mild cognitive impairment: Results of a cross-sectional study. Front Aging Neurosci 11: , 364. |
[55] | Allali G , Montembeault M , Griffa A , Beauchet O ((2020) ) Default mode network and the timed up and go in MCI: A structural covariance analysis. Exp Gerontol 129: , 110748. |
[56] | Onen F , Feugeas MCH , Baron G , De Marco G , Godon-Hardy S , Peretti II , Ravaud P , Legrain S , Moretti JL , Claeys ES ((2004) ) Leukoaraiosis and mobility decline: A high resolution magnetic resonance imaging study in older people with mild cognitive impairment. Neurosci Lett 355: , 185–188. |
[57] | Nilsson MH , Tangen GG , Palmqvist S , van Westen D , Mattsson-Carlgren N , Stomrud E , Hansson O ((2020) ) The effects of tau, amyloid, and white matter lesions on mobility, dual tasking, and balance in older people. J Gerontol A Biol Sci Med Sci 76: , 683–691. |
[58] | Lee Y-W , Lee H , Chung I-S , Yi H-A ((2017) ) Relationship between postural instability and subcortical volume loss in Alzheimer’s disease. Medicine 96: , e7286. |
[59] | Reeves S , Mehta M , Howard R , Grasby P , Brown R ((2010) ) Thedopaminergic basis of cognitive and motor performance in Alzheimer’sdisease. Neurobiol Dis 37: , 477–482. |
[60] | Makofske B ((2011) ) Manual dexterity. In Encyclopedia of Clinical Neuropsychology, Springer, New York, pp. 1522–1523. |
[61] | Almkvist O , Basun H , Wahlund LO , Andersson Lundman G , Bäckman L ((1992) ) White-matter hyperintensity and neuropsychological functions in dementia and healthy aging. Arch Neurol 49: , 626–632. |
[62] | Mascalchi M , Ginestroni A , Toschi N , Poggesi A , Cecchi P , Salvadori E , Tessa C , Cosottini M , Stefano ND , Pracucci G , Pantoni L , Inzitari D , Diciotti S , VMCI Tuscany Investigators ((2014) ) The burden of microstructural damage modulates cortical activation in elderly subjects with MCI and leuko-araiosis. A DTI and fMRI study. Hum Brain Mapp 35: , 819–830. |
[63] | Moon Y , Moon W-J , Kim JO , Kwon KJ , Han S-H ((2019) ) Muscle strength is independently related to brain atrophy in patients with Alzheimer’s disease. Dement Geriatr Cogn Disord 47: , 306–314. |
[64] | Wardlaw JM ((2008) ) What is a lacune? Stroke 39: , 2921–2922. |
[65] | Camarda C , Torelli P , Pipia C , Battaglini I , Azzarello D , Rosano R , Ventimiglia CC , Sottile G , Cilluffo G , Camarda R ((2019) ) Mild parkinsonian signs in a hospital-based cohort of mild cognitive impairment types: A cross-sectional study. Curr Alzheimer Res 16: , 633–649. |
[66] | Yogev-Seligmann G , Hausdorff JM , Giladi N ((2007) ) The role of executive function and attention in gait. Mov Disord 23: , 329–342. |
[67] | Wilson J , Allcock L , Ardle RM , Taylor J-P , Rochester L ((2019) ) The neural correlates of discrete gait characteristics in ageing: A structured review. Neurosci Biobehav Rev 100: , 344–369. |
[68] | Ruitenberg M , Koppelmans V Cognition in motion: Evidence forintact action control with healthy aging. ((2021) ) J Gerontol B PsycholSci Soc Sci 76: , 252–261. |
[69] | Merory JR , Wittwer JE , Rowe CC , Webster KE ((2007) ) Quantitative gait analysis in patients with dementia with Lewy bodies and Alzheimer’s disease. Gait Posture 26: , 414–419. |
[70] | McKeith IG , Rowan E , Askew K , Naidu A , Allan L , Barnett N , Lett D , Mosimann UP , Burn D , O’Brien JT ((2006) ) More severe functional impairment in dementia with Lewy bodies than Alzheimer disease is related to extrapyramidal motor dysfunction. Am J Geriatr Psychiatry 14: , 582–588. |
[71] | Fritz NE , Kegelmeyer DA , Kloos AD , Linder S , Park A , Kataki M , Adeli A , Agrawal P , Scharre DW , Kostyk SK ((2016) ) Motor performance differentiates individuals with Lewy body dementia, Parkinson’s and Alzheimer’s disease. Gait Posture 50: , 1–7. |
[72] | Yousaf T , Dervenoulas G , Valkimadi P-E , Politis M ((2018) ) Neuroimaging in Lewy body dementia. J Neurol 266: , 1–26. |
[73] | Gillis EE , Sullivan JC ((2016) ) Sex differences in hypertension. Hypertension 68: , 1322–1327. |
[74] | Lennon MJ , Makkar SR , Crawford JD , Sachdev PS ((2019) ) Midlife hypertension and Alzheimer’s disease: A systematic review and meta-analysis. J Alzheimers Dis 71: , 307–316. |
[75] | Rosano C , Longstreth WT , Boudreau R , Taylor CA , Du Y , Kuller LH , Newman AB ((2011) ) High blood pressure accelerates gait slowing in well-functioning older adults over 18-years of follow-up. J Am Geriatr Soc 59: , 390–397. |
[76] | Thomas JR , French KE ((1985) ) Gender differences across age in motor performance: A meta-analysis. Psychol Bull 98: , 260–282. |
[77] | Ritchie SJ , Cox SR , Shen X , Lombardo MV , Reus LM , Alloza C , Harris MA , Alderson HL , Hunter S , Neilson E , Liewald DC , Auyeung B , Whalley HC , Lawrie SM , Gale CR , Bastin ME , McIntosh AM , Deary IJ , ((2018) ) Sex differences in the adult human bra, Evidence from 5216 Uk Biobankarticipants Cereb Cortex 28: , 2959–2975 . |
[78] | Choleris E , Galea LA , Sohrabji F , Frick KM , ((2018) ) Sex differences in the bra, Imlications for behavioral and biomedical research Neurosci Biobehav Rev 85: , 126–145 . |
[79] | Armstrong NM , Huang CW , Williams OA , Bilgel M , An Y , Doshi J , Erus G , Davatzikos C , Wong DF , Ferrucci L , Resnick SM ((2019) ) Sex differences in the association between amyloid and longitudinal brain volume change in cognitively normal older adults. Neuroimage Clin 22: , 101769. |
[80] | Moon Y , Choi Y-J , Kim JO , Han S-H ((2018) ) Muscle profile and cognition in patients with Alzheimer’s disease dementia. Neurol Sci 39: , 1861–1866. |
[81] | Verghese J , Lipton RB , Hall CB , Kuslansky G , Katz MJ , Buschke H ((2002) ) Abnormality of gait as a predictor of non-Alzheimer’s dementia. N Engl J Med 347: , 1761–1768. |
[82] | Grande G , Triolo F , Nuara A , Welmer A-K , Fratiglioni L , Vetrano DL ((2019) ) Measuring gait speed to better identify prodromal dementia. Exp Gerontol 124: , 110625. |
[83] | Baker R ((2007) ) The history of gait analysis before the advent of modern computers. Gait Posture 26: , 331–342. |
[84] | Chong RKY , Horak FB , Frank J , Kaye J ((1999) ) Sensory organization for balance: Specific deficits in Alzheimer’s but not in Parkinson’s disease. J Gerontol A Biol Sci Med Sci 54: ,M122–M128. |
[85] | Dickin DC , Rose DJ ((2004) ) Sensory organization abilities during upright stance in late-onset Alzheimer’s-type dementia. Exp Aging Res 30: , 373–390. |
[86] | Gras LZ , Kanaan SF , McDowd JM , Colgrove YM , Burns J , Pohl PS ((2015) ) Balance and gait of adults with very mild Alzheimer disease. J Geriatr Phys Ther 38: , 1–7. |
[87] | Suttanon P , Hill KD , Said CM , LoGiudice D , Lautenschlager NT , Dodd KJ ((2012) ) Balance and mobility dysfunction and falls risk in older people with mild to moderate Alzheimer disease. Am J Phys Med Rehabil 91: , 12–23. |
[88] | Boyle PA , Buchman AS , Wilson RS , Leurgans SE , Bennett DA ((2009) ) Association of muscle strength with the risk of Alzheimer diseaseand the rate of cognitive decline in community-dwelling olderpersons. Arch Neurol 66: , 1339–1344. |
[89] | Camargo EC , Weinstein G , Beiser AS , Tan ZS , Decarli C , Kelly-Hayes M , Kase C , Murabito JM , Seshadri S ((2016) ) Association of physical function with clinical and subclinical brain disease: The Framingham Offspring Study. J Alzheimers Dis 53: , 1597–1608. |
[90] | Ferraro F , Balota D , Connor L ((1993) ) Implicit memory and the formation of new associations in nondemented Parkinson’s disease individuals and individuals with senile dementia of the Alzheimer type: A serial reaction time (SRT) investigation. Brain Cogn 21: , 163–180. |
[91] | Yu N-Y , Chang S-H ((2016) ) Kinematic analyses of graphomotor functions in individuals with Alzheimer’s disease and amnestic mild cognitive impairment. J Med Biol Eng36: , 334–343. |
[92] | Yu N-Y , Chang S-H ((2019) ) Characterization of the fine motor problems in patients with cognitive dysfunction - a computerized handwriting analysis. Hum Mov Sci 65: , 71–79. |
[93] | Martin E , Blais M , Albaret J-M , Pariente J , Tallet J ((2017) ) Alteration of rhythmic unimanual tapping and anti-phase bimanual coordination in Alzheimer’s disease: A sign of inter-hemispheric disconnection? Hum Mov Sci 55: , 43–53. |
[94] | Buchman AS , Leurgans SE , Boyle PA , Schneider JA , Arnold SE , Bennett DA ((2011) ) Combinations of motor measures more strongly predict adverse health outcomes in old age: The Rush Memory and Aging Project, a community-based cohort study. BMC Med 9: , 42. |
[95] | Yamada Y , Shinkawa K , Kobayashi M , Caggiano V , Nemoto M , Nemoto K , Arai T ((2021) ) Combining multimodal behavioral data of gait, speech, and drawing for classification of Alzheimer’s disease and mild cognitive impairment. J Alzheimers Dis 84: , 315–327. |
[96] | Teipel S , Drzezga A , Grothe MJ , Barthel H , Chételat G , Schuff N , Skudlarski P , Cavedo E , Frisoni GB , Hoffmann W , Thyrian JR , Fox C , Minoshima S , Sabri O , Fellgiebel A ((2015) ) Multimodal imaging inAlzheimer’s disease: Validity and usefulness for earlydetection. Lancet Neurol 14: , 1037–1053. |
[97] | Manto M , Bower JM , Conforto AB , Delgado-García JM , da Guarda SNF , Gerwig M , Habas C , Hagura N , Ivry RB , Mariën P , Molinari M , Naito E , Nowak DA , Taib NOB , Pelisson D , Tesche CD , Tilikete C , Timmann D ((2011) ) Consensus paper: Roles of the cerebellum in motorcontrol-the diversity of ideas on cerebellar involvement inmovement. Cerebellum 11: , 457–487. |
[98] | Jacobs HIL , Hopkins DA , Mayrhofer HC , Bruner E , van Leeuwen FW , Raaijmakers W , Schmahmann JD ((2018) ) The cerebellum in Alzheimer’s disease: Evaluating its role in cognitive decline. Brain 141: , 37–47. |
[99] | Schmahmann JD ((2016) ) Cerebellum in Alzheimer’s disease and frontotemporal dementia: Not a silent bystander. Brain 139: , 1314–1318. |
[100] | Tabatabaei-Jafari H , Walsh E Shaw ME Cherbuin N , ((2017) ) The cerebellum shrinks faster than normal ageing in Alzheimer’s disease but not in mild cognitive impairment. Hum Brain Mapp 38: , 3141–3150. |


