
The Added Value of Cerebrospinal Fluid Neurofilament Light Chain to Existing Diagnostic Methods and Biomarkers in a Mixed Memory Clinic Cohort of Consecutive Patients
Abstract
The added value of neurofilament light chain (NfL) to the existing diagnostic methods is unknown, although a plethora of studies have shown increased levels in cerebrospinal fluid (CSF) and blood in many neurodegenerative and neurological disorders. The added value of CSF NfL was determined in a mixed memory clinic cohort of consecutive patients for 136 patients with Alzheimer’s disease (AD) (n = 69), mild cognitive impairment (n = 24), non-AD (n = 34), and also healthy controls (n = 9). This study found no increase in the diagnostic accuracy of the etiological diagnoses but knowing the CSF NfL value led to increased diagnostic certainty for the specialist in neurology.
INTRODUCTION
Neurodegenerative diseases and dementias are increasing health concerns, which affect several million patients and relatives worldwide [1]. Regardless of the primary pathology, the damage and loss of neurons in the central nervous system (CNS) are essential steps in the development and pathophysiology of these disorders. The cognitive deficits in neurodegenerative dementias progress with the accelerating neurodegenerative processes, and studies have reported that the formation of specific Alzheimer’s disease (AD) pathology begin decades prior to dementia onset [2]. The diagnosis of neurodegenerative dementias relies on clinical examinations by physicians and psychologists, imaging modalities, and cerebrospinal fluid (CSF) biomarkers, especially tau, phosphorylated tau (p-tau), and amyloid-β 1–42 (Aβ42), and recently neurofilament light chain (NfL).
Neurofilaments are scaffolding proteins found primarily in the axons of neurons where they enable the radial growth [3]. They are composed of five subunits: NfL, neurofilament medium chain (NfM), neurofilament heavy chain (NfH), alpha-internexin, and peripherin, of which NfL is the easiest to analyze [3]. Studies have reported that a low increase of NfL in CSF can be observed in an age-dependent manner [4, 5]. However, depending on the degree of damage and loss of neurons in neurodegenerative dementias and other disorders, large amounts of NfL are released into the CSF and blood [4]. A plethora of recent studies have shown that NfL in CSF [6, 7] and blood [8, 9] is robustly increased in AD, but also in many other neurodegenerative disorders and acute neurological disorders [10, 11], making NfL a promising biomarker for the diagnosis of neurodegenerative dementias. However, the added value of NfL, to the existing diagnostic methods and biomarkers, in a mixed memory clinic cohort of consecutive patients, is unknown.
MATERIALS AND METHODS
Subjects
CSF samples were collected at the Regional Dementia Research Centre, Zealand University Hospital, Roskilde between November 2017 and April 2020.
A total of 136 patients and healthy controls with CSF NfL samples were included in the study. The CSF samples were collected from healthy controls (HC) (n = 9), who, after clinical assessment for suspected cognitive decline, were found to have normal cognition. This included patients with subjective cognitive decline (SCD), side effects from other medication, substance abuse (i.e., alcohol) or mild non-organic mental disorders. Furthermore, patients with mild cognitive impairment (MCI) (n = 24), AD (n = 69) and non-AD (n = 34) were included in the study. The non-AD group consisted of vascular dementia (VaD) (n = 9), frontotemporal dementia (FTD) (n = 8), mixed dementia (n = 7), atypical Parkinsonism disorders (PSP, CBD, MSA) (n = 5), alcohol-induced dementia (n = 2), dementia with Lewy bodies (DLB) (n = 1), and unknown etiology (n = 2). All included patients and healthy controls were diagnosed after extensive clinical evaluation, including CSF biomarkers for AD (tau, p-tau, Aβ42, and NfL), scans (magnetic resonance imaging or 18F-flourdeoxyglucose position emission tomography), and neuropsychological examination. The patients were diagnosed at a consensus conference.
All included patients with AD fulfilled the NIA-AA criteria [12], while the patients with MCI fulfilled the criteria by the International Working group in Mild Cognitive Impairment [13]. The patients with VaD fulfilled the VASCOG criteria [14], the patients with mixed dementia fulfilled the NIA-AA and VASCOG criteria [12, 14], and the patients with FTD fulfilled either the diagnostic criteria for the semantic [15] or behavioral variant [16] or non-fluent aphasia [15]. The patients with atypical Parkinsonism disorders fulfilled the criteria suggested by the International Parkinson and Movement Disorder Society [17, 18] [19].The patients diagnosed with DLB fulfilled the criteria of the fourth report of the DLB consortium [20], while patients with alcohol-induced dementia fulfilled the ICD-10 criteria [21].
Assessment of the diagnostic impact of CSF NfL
A specialist in neurology with more than 30 years of experience in dementia evaluation performed a diagnostic evaluation of all included patients based on medical history, paraclinical results, neuropsychological examinations, and scans. The evaluation was designed to simulate the usual clinical practice in a memory clinic. For each patient the specialist characterized whether the patient fulfilled the criteria for normal cognition, MCI or dementia, and furthermore determined the etiological diagnosis. In addition, the specialist graded the level of diagnostic certainty on a Visual Analogue Scale (VAS), ranging from zero to 100. For each included patient, this evaluation was performed twice by the same specialist, first without knowing the CSF NfL value and secondly including the CSF NfL value. The cut-off value for CSF NfL is < 890 ng/L for people aged 40–59 years, while it is < 1850 ng/L for people≥60 years. The analytical range of the NfL assay is 0.2–45000 ng/L.
Sample and sample processing
CSF samples were collected in polypropylene tubes by a lumbar puncture at the Regional Dementia Research Centre, Zealand University Hospital, Roskilde. NfL was measured as part of the clinical routine at Aarhus University Hospital, Skejby [22]. CSF NfL was analyzed using the Simoa® NF-light Advantage Kit, according to the protocol provided by the manufacturer, at the Department of Clinical Biochemistry, Aarhus University Hospital, Skejby, Denmark. Samples are analyzed approximately every second week, and the inter-assay CV was 11.2% measured by running the same CSF pool on all assay runs. A QC sample from the manufacturer with concentrations ranging between 3.0–5.0 ng/L was also measured, and the assay is monitored according to the Alzheimer’s Association QC program.
The levels of CSF Aβ42, total tau, and p-tau were also measured as part of the clinical routine using sandwich ELISA (INNOTEST® β-AMYLOID (1 –42) Fujirebio), sandwich ELISAs INNOTEST hTau Ag, and INNOTEST PHOSPHO-TAU (181P) , respectively.
Statistics
The analyses were performed in GraphPad Prism. Differences between the four diagnostic groups (HC, MCI, AD, and non-AD) were analyzed using a Chi-square test and Kruskal-Wallis tests where appropriate.
Firstly, we assessed the effect of CSF NfL on the diagnostic accuracy by comparing the etiological diagnoses with and without information about CSF NfL levels to the reference diagnosis decided at a consensus conference at the Regional Dementia Research Centre, Zealand University Hospital, Roskilde. The etiological diagnoses were defined as “correct” if the diagnoses were the same as the etiological diagnoses decided at the consensus conference. Inversely, the diagnoses were defined as “incorrect” if they differed from the reference diagnosis. Furthermore, if the etiological diagnosis was the same after knowing the CSF NfL value, the diagnosis was categorized as “unchanged,” and if the diagnosis changed, it was categorized as “changed”. There were no cases with three different etiological evaluations.
Secondly, the diagnostic certainty of the etiological diagnosis was assessed on a VAS score, ranging from zero to 100%. To analyze the diagnostic certainty between the four different diagnostic groups, Kruskal-Wallis tests were performed.
In addition, linear regressions with 95% confidence intervals were performed in order to investigate the relationship between NfL in CSF and Aβ42, p-tau and total in CSF.
Statistical significance for the analyses were determined at p < 0.05 (two-sided).
RESULTS
Demographics
A total of 136 patients and healthy controls with consecutive CSF NfL samples were included in the study. Table 1 gives an overview of the characteristics of the study cohort. Significant differences were found between sex, age, Mini-Mental State Examination score, Addenbrooke’s Cognitive Examination, CSF Aβ42, CSF p-tau, CSF total tau and CSF NfL between the four groups.
Table 1
Characteristics of the study cohort
| HC (n = 9) | MCI (n = 24) | AD (n = 69) | Non-AD (n = 34) | p | |
| Sex F/M | 7/2 | 11/13 | 38/31 | 11/23 | 0.005 |
| Age, y† | 60.9±11.5 | 67.1±9.0 | 71.5±9.1 | 72.1±8.2 | 0.0027 |
| MMSE score† | 28.3±1.7 | 25.7±3.2 | 22.4±4.8 | 22.6±4.2 | < 0.0001 |
| ACE score† | 87.3±8.0 | 77.9±13.5 | 66.6±12.7 | 68.1±12.7 | < 0.0001 |
| CSF Aβ42 (pg/mL)† | 1073.3±293.7 | 805.3±376.9 | 645.7±291.7 | 973.6±440.0 | < 0.0001 |
| CSF p-tau (pg/mL)† | 36.2±15.0 | 59.8±44.4 | 70.2±65.0 | 45.0±36.2 | 0.017 |
| CSF total tau (pg/mL)† | 204.6±113.4 | 420.1±252.2 | 534.1±375.0 | 412.9±402.3 | 0.0012 |
| CSF NfL (ng/L)† | 952.8±625.9 | 1208.8±568.1 | 1722.8±1208.1 | 2377.8±1363.2 | < 0.0001 |
n, number; F, female; M, male; MMSE, Mini-Mental State Examination; ACE, Addenbrooke’s Cognitive Examination; CSF, cerebrospinal fluid; Aβ42, amyloid-β 1–42; p-tau, phosphorylated tau; NfL, neurofilament light chain; HC, healthy controls; MCI, mild cognitive impairment; AD, Alzheimer’s disease. †Expressed as mean±standard deviation (SD). p-values were calculated by a Chi-squared test (sex), a one-way ANOVA (age, years), and a Kruskal-Wallis test (MMSE score, ACE score, CSF Aβ42, CSF p-tau, CSF total tau and CSF NfL).
For the subgroups contained in the non-AD group, the NfL values (ng/L) expressed as mean±standard deviation (SD) were for VaD: 2974.3±2052.8, FTD: 1809.3±637.4, mixed dementia: 2172.9±607.1, atypical Parkinsonism disorders (PSP, CBD, MSA): 2801.0±1052.6, alcohol-induced dementia: 613.5±108.5, unknown etiology: 1471.0±421. For the patient with DLB the NfL value was 2121 ng/L.
The added value of CSF NfL
Table 2 gives and overview of the impact of CSF NfL on the etiological diagnoses according to the original diagnoses made at the consensus conference. For 124 (91.2%) included patients, the etiological diagnosis was correct and did not change after knowing the CSF NfL value. For 7 (5.1%) subjects the diagnosis was unchanged and incorrect according to the diagnosis decided at the consensus conference, while the diagnostic accuracy in 5 (3.7%) cases changed to the incorrect diagnosis when knowing the CSF NfL value. When looking at the four individual diagnostic groups (HC, MCI, AD, and non-AD) the results were similar in all four groups. The highest proportion of correct and unchanged diagnoses were seen for HC (100%) and AD (97.1%), while the highest proportion of changed and incorrect diagnoses were found for the patients with MCI (8.3%). The highest proportion of incorrect and unchanged diagnoses were seen in the non-AD group, probably due to the heterogenous nature of the group.
Table 2
Impact of CSF NfL and the certainty of the etiological diagnoses
| All subjects (n = 136) | HC (n = 9) | MCI (n = 24) | AD (n = 69) | Non-AD (n = 34) | p* | ||||||
| Correct | Incorrect | Correct | Incorrect | Correct | Incorrect | Correct | Incorrect | Correct | Incorrect | ||
| Unchanged diagnosis (%) | 124 (91.2) | 7 (5.1) | 9 (100.0) | 0 (0.0) | 20 (83.4) | 2 (8.3) | 67 (97.1) | 0 (0.0) | 28 (82.4) | 5 (14.7) | |
| Changed diagnosis (%) | 0 (0.0) | 5 (3.7) | 0 (0.0) | 0 (0.0) | 0 (0.0) | 2 (8.3) | 0 (0.0) | 2 (2.9) | 0 (0.0) | 1 (2.9) | |
| Certainty without CSF NfL | 82.1±7.0 | 77.1±9.7 | 79.2±8.5 | 84.0±6.1 | 81.5±5.1 | 0.023 | |||||
| Certainty with CSF NfL | 84.9±7.9 | 80.1±14.4 | 83.5±6.0 | 85.4±6.9 | 85.6±8.0 | 0.43 | |||||
| Average increase in certainty | 7.0±4.1 | 8.1±4.0 | 9.9±5.7 | 4.9±2.5 | 7.8±3.3 | 0.0021 | |||||
| Average decrease in certainty | 6.4±4.4 | 13.0±4.0 | 5.0±0.0 | 5.3±3.7 | 5.7±1.9 | 0.58 | |||||
n, number; NfL, neurofilament light chain; HC, healthy controls; MCI, mild cognitive impairment; AD, Alzheimer’s disease. The table shows the impact of CSF NfL on the etiological diagnoses, and the mean certainty in VAS score (0–100%)±standard deviation (SD).“Unchanged diagnosis” is expressed as number and (percentage) of subjects and indicates the cases where the ethological diagnosis did not change after knowing the CSF NfL value. “Changed diagnosis” is expressed as number and (percentage) of subjects and indicates the cases where the ethological diagnosis was changed after knowing the CSF NfL value. *p-values were calculated by a Kruskal-Wallis test on the difference between HC, MCI, AD, and non-AD.
Table 2 also gives and overview of the certainty in VAS score (0–100%) of the etiological diagnoses with and without knowing the CSF NfL value. The level of certainty of the etiological diagnosis when knowing the CSF NfL level increased in 69 cases, decreased in 17 cases and was stable in 50 out of the 136 cases. For all subjects, without knowing the CSF NfL value, the average level of diagnostic certainty in VAS score was 82.1%, and a statistically significant difference in certainty was found between the diagnostic groups (HC, MCI, AD, and non-AD) (p = 0.023). The VAS score was 84.9% when knowing the CSF NfL value, but no statistically significant difference was found between the four diagnostic groups (p = 0.43). For the 69 cases where the level of certainty increased, the average diagnostic certainty increase in VAS score was 7.0%. For the 17 cases where the level of certainty decreased, the average diagnostic decrease was 6.4%. For the individual diagnostic groups, the highest increase in certainty, when knowing the CSF value, was seen in the patients with MCI (4.3%), while the lowest increase was seen for the patients with AD (1.4%).
A statistically significant difference between the four diagnostic groups was found when analyzing the average increase in certainty (p = 0.0021). The cases in the MCI group had the highest average increase when knowing the CSF NfL value (9.9%), while the cases in the AD group had the lowest (4.9%). No statistically significant difference between the four diagnostic groups was found when analyzing the average decrease in certainty (p = 0.58). For these cases that decreased in certainty, the cases in the HC group had the highest average decrease when knowing the CSF NfL value (13.0%), while the cases in the MCI group had the lowest (5.0%).
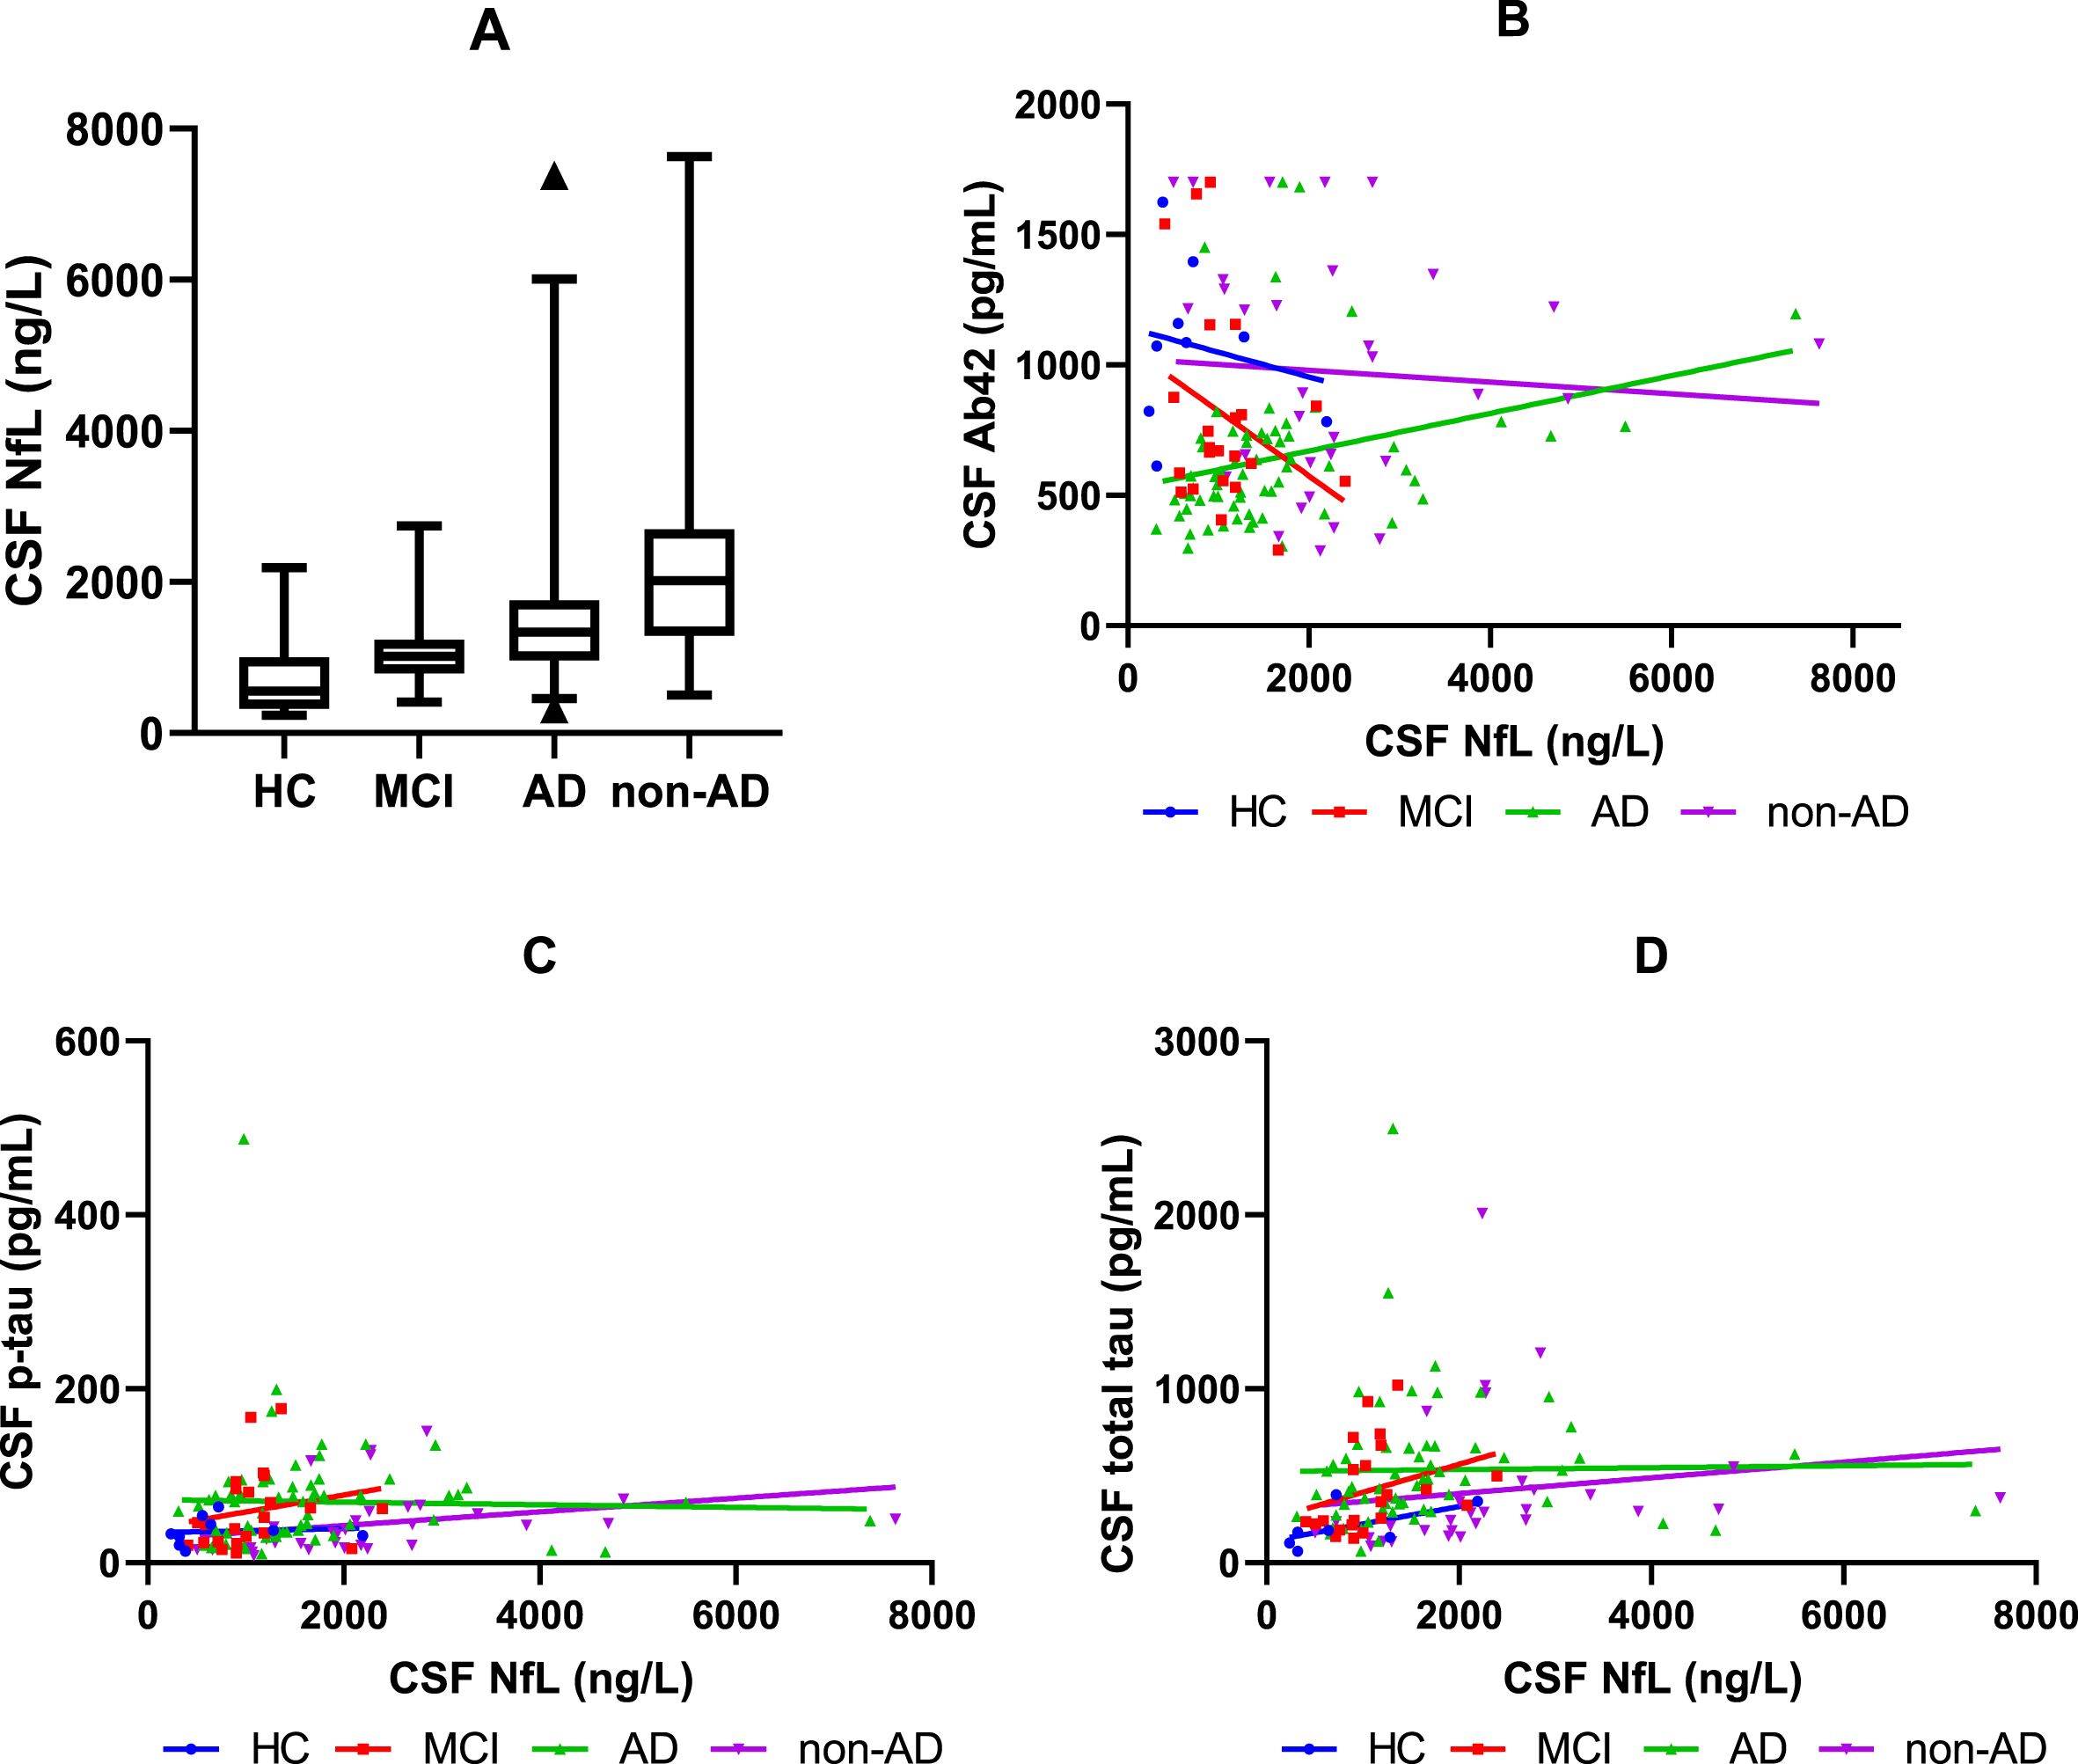
When investigating the association between NfL in CSF and Aβ42 in CSF, a correlation was found for AD (p = 0.016), but no correlation was found for HC, MCI, and non-AD (Fig. 1B). No correlation was found between NfL in CSF and p-tau or total tau in CSF in any of the groups (Fig. 1C, D).
Fig. 1
CSF NfL and the association between CSF NfL and Aβ42, p-tau, and total tau in CSF. A) The boxplot shows the median, interquartile range, and extreme values of NfL in CSF for HC, MCI, AD, and non-AD. All data in the 2.5–97.5 percentile has been included in the boxplot. B) The graph shows the relationship between CSF NfL and CSF Aβ42 for HC, MCI, AD, and non-AD. C) The graph shows the relationship between CSF NfL and CSF p-tau for HC, MCI, AD, and non-AD. D) The graph shows the relationship between CSF NfL and CSF total tau for HC, MCI, AD, and non-AD. HC, healthy controls; MCI, mild cognitive impairment; AD, Alzheimer’s disease; CSF, cerebrospinal fluid; Aβ42, amyloid 1–42; p-tau, phosphorylated tau; NfL, neurofilament light chain.
DISCUSSION
Studies have reported, that NfL in CSF and blood is robustly increased in neurodegenerative dementias [4]. However, to the best of our knowledge, this was the first study to evaluate the added value of CSF NfL to the existing diagnostic methods and biomarkers in a mixed memory clinic cohort of consecutive patients. This study found no increase in the diagnostic accuracy of the etiological diagnoses when compared to using solely the present diagnostic methods and biomarkers. However, knowing the CSF NfL value led to increased diagnostic certainty for the specialist in neurology with more than 30 years of experience in dementia evaluation. The level of certainty might have an effect on the initiation of treatment, treatment monitoring, future management of the patient, and maybe decrease the amount of additional testing. This might especially be the case for patients with MCI, who had the highest increase in certainty, and are often complex patients with various underlying etiological diagnoses. It is particular in this group of patients, with very heterogeneous underlying conditions, that the relevance of a supplemental diagnostic marker is underscored. Potentially, the increased level of certainty in MCI patients may impact treatment regimens and enable patients to participate in clinical trials.
Our cohort is a representation of the clinical reality in a specialized memory clinic. However, the memory clinic is also a referral clinic, and therefore our cohort might have contained more complicated patients when compared to other clinics. Usually, the clear diagnostic cases will not get a lumbar puncture, excluding them from our cohort, and therefore making the rate of unclear diagnostic cases higher. Therefore, the rate of patients diagnosed with more rare types of dementias, such as DLB, was low.
Dementia diagnostics and biomarkers are highly developing fields and represents fruitful domains for new biomarkers, new sources to sample biomarkers [23, 24], new technologies and the complex process of the clinical evaluation of a patient with a suspected dementia disorder. Better exploitation of already validated biomarkers is important for optimizing the diagnostic procedure, making it cost-effective and lessen the need for additional clinical evaluation. It might be possible that CSF NfL assessments are more likely to be beneficial in the primary care rather than in specialized memory clinics, where it can serve as a screening tool of a large number of patients, to increase the clinician’s level of certainty in separating neurodegenerative disorders from healthy aging.
ACKNOWLEDGMENTS
The authors have no acknowledgments to report.
FUNDING
The authors have no funding to report.
CONFLICT OF INTEREST
The authors have no conflict of interest to report.
REFERENCES
[1] | Prince M , Wimo A , Guerchet M , Ali G-C , Wu Y-T , Prina M ((2015) ) World Alzheimer Report 2015. The Global Impact of Dementia: An analysis of prevalence, incid ence, cost and trends. Alzheimer’s Disease International, London. |
[2] | Holtzman DM , Morris JC , Goate AM ((2011) ) Alzheimer’s disease: The challenge of the second century. Sci Transl Med 3: , 77sr1. |
[3] | Yuan A , Rao M V. , Veeranna , Nixon RA ((2017) ) Neurofilaments and neurofilament proteins in health and disease. Cold Spring Harb Perspect Biol 9: , a018309. |
[4] | Khalil M , Teunissen CE , Otto M , Piehl F , Sormani MP , Gattringer T , Barro C , Kappos L , Comabella M , Fazekas F , Petzold A , Blennow K , Zetterberg H , Kuhle J ((2018) ) Neurofilaments as biomarkers in neurological disorders. Nat Rev Neurol 14: , 577–589. |
[5] | Khalil M , Pirpamer L , Hofer E , Voortman MM , Barro C , Leppert D , Benkert P , Ropele S , Enzinger C , Fazekas F , Schmidt R , Kuhle J ((2020) ) Serum neurofilament light levels in normal aging and their association with morphologic brain changes. Nat Commun 11: , 812. |
[6] | Fortea J , Carmona-Iragui M , Benejam B , Fernández S , Videla L , Barroeta I , Alcolea D , Pegueroles J , Muñoz L , Belbin O , de Leon MJ , Maceski AM , Hirtz C , Clarimón J , Videla S , Delaby C , Lehmann S , Blesa R , Lleó A ((2018) ) Plasma and CSF biomarkers for the diagnosis of Alzheimer’s disease in adults with Down syndrome: a cross-sectional study. Lancet Neurol 17: , 860–869. |
[7] | Zetterberg H , Skillbäck T , Mattsson N , Trojanowski JQ , Portelius E , Shaw LM , Weiner MW , Blennow K ; Alzheimer’s Disease Neuroimaging Initiative ((2016) ) Association of cerebrospinal fluid neurofilament light concentration with Alzheimer disease progression. JAMA Neurol 73: , 60–67. |
[8] | Mattsson N , Andreasson U , Zetterberg H , Blennow K ; Alzheimer’s Disease Neuroimaging Initiative ((2017) ) Association of plasma neurofilament light with neurodegeneration in patients with Alzheimer disease. JAMA Neurol 74: , 557–566. |
[9] | Lin YS , Lee WJ , Wang SJ , Fuh JL ((2018) ) Levels of plasma neurofilament light chain and cognitive function in patients with Alzheimer or Parkinson disease. Sci Rep 8: , 17368. |
[10] | Ehler J , Petzold A , Wittstock M , Kolbaske S , Gloger M , Henschel J , Heslegrave A , Zetterberg H , Lunn MP , Rommer PS , Grossmann A , Sharshar T , Richter G , Nöldge-Schomburg G , Sauer M ((2019) ) The prognostic value of neurofilament levels in patients with sepsis-associated encephalopathy – A prospective, pilot observational study. PLoS One 14: , e0211184. |
[11] | Hansson O , Janelidze S , Hall S , Magdalinou N , Lees AJ , Andreasson U , Norgren N , Linder J , Forsgren L , Constantinescu R , Zetterberg H , Blennow K ; Swedish BioFINDER study ((2017) ) Blood-based NfL: A biomarker for differential diagnosis of parkinsonian disorder. Neurology 88: , 930–937. |
[12] | McKhann GM , Knopman DS , Chertkow H , Hyman BT , Jack CR Jr , Kawas CH , Klunk WE , Koroshetz WJ , Manly JJ , Mayeux R , Mohs RC , Morris JC , Rossor MN , Scheltens P , Carrillo MC , Thies B , Weintraub S , Phelps CH ((2011) ) The diagnosis of dementia due to Alzheimer’s disease: Recommendations from the National Institute on Aging-Alzheimer’s Association workgroups on diagnostic guidelines for Alzheimer’s disease. Alzheimers Dement 7: , 263–269. |
[13] | Winblad B , Palmer K , Kivipelto M , Jelic V , Fratiglioni L , Wahlund LO , Nordberg A , Bäckman L , Albert M , Almkvist O , Arai H , Basun H , Blennow K , de Leon M , DeCarli C , Erkinjuntti T , Giacobini E , Graff C , Hardy J , Jack C , Jorm A , Ritchie K , van Duijn C , Visser P , Petersen RC ((2004) ) Mild cognitive impairment - Beyond controversies, towards a consensus: Report of the International Working Group on Mild Cognitive Impairment. J Intern Med 256: , 240–246. |
[14] | Sachdev P , Kalaria R , O’Brien J , Skoog I , Alladi S , Black SE , Blacker D , Blazer DG , Chen C , Chui H , Ganguli M , Jellinger K , Jeste DV , Pasquier F , Paulsen J , Prins N , Rockwood K , Roman G , Scheltens P ; Internationlal Society for Vascular Behavioral and Cognitive Disorders ((2014) ) Diagnostic criteria for vascular cognitive disorders: A VASCOG statement. Alzheimer Dis Assoc Disord 28: , 206–218. |
[15] | Gorno-Tempini ML , Hillis AE , Weintraub S , Kertesz A , Mendez M , Cappa SF , Ogar JM , Rohrer JD , Black S , Boeve BF , Manes F , Dronkers NF , Vandenberghe R , Rascovsky K , Patterson K , Miller BL , Knopman DS , Hodges JR , Mesulam MM , Grossman M ((2011) ) Classification of primary progressive aphasia and its variants. Neurology 76: , 1006–1014. |
[16] | Rascovsky K , Hodges JR , Knopman D , Mendez MF , Kramer JH , Neuhaus J , van Swieten JC , Seelaar H , Dopper EG , Onyike CU , Hillis AE , Josephs KA , Boeve BF , Kertesz A , Seeley WW , Rankin KP , Johnson JK , Gorno-Tempini ML , Rosen H , Prioleau-Latham CE , Lee A , Kipps CM , Lillo P , Piguet O , Rohrer JD , Rossor MN , Warren JD , Fox NC , Galasko D , Salmon DP , Black SE , Mesulam M , Weintraub S , Dickerson BC , Diehl-Schmid J , Pasquier F , Deramecourt V , Lebert F , Pijnenburg Y , Chow TW , Manes F , Grafman J , Cappa SF , Freedman M , Grossman M , Miller BL ((2011) ) Sensitivity of revised diagnostic criteria for the behavioural variant of frontotemporal dementia. Brain 134: (Pt 9), 2456–2477. |
[17] | Höglinger GU , Respondek G , Stamelou M , Kurz C , Josephs KA , Lang AE , Mollenhauer B , Müller U , Nilsson C , Whitwell JL , Arzberger T , Englund E , Gelpi E , Giese A , Irwin DJ , Meissner WG , Pantelyat A , Rajput A , van Swieten JC , Troakes C , Antonini A , Bhatia KP , Bordelon Y , Compta Y , Corvol JC , Colosimo C , Dickson DW , Dodel R , Ferguson L , Grossman M , Kassubek J , Krismer F , Levin J , Lorenzl S , Morris HR , Nestor P , Oertel WH , Poewe W , Rabinovici G , Rowe JB , Schellenberg GD , Seppi K , van Eimeren T , Wenning GK , Boxer AL , Golbe LI , Litvan I ; Movement Disorder Society-endorsed PSP Study Group ((2017) ) Clinical diagnosis of progressive supranuclear palsy: The movement disorder society criteria. Mov Disord 32: , 853–864. |
[18] | Gilman S , Wenning GK , Low PA , Brooks DJ , Mathias CJ , Trojanowski JQ , Wood NW , Colosimo C , Dürr A , Fowler CJ , Kaufmann H , Klockgether T , Lees A , Poewe W , Quinn N , Revesz T , Robertson D , Sandroni P , Seppi K , Vidailhet M ((2008) ) Second consensus statement on the diagnosis of multiple system atrophy. Neurology 71: , 670–676. |
[19] | Armstrong MJ , Litvan I , Lang AE , Bak TH , Bhatia KP , Borroni B , Boxer AL , Dickson DW , Grossman M , Hallett M , Josephs KA , Kertesz A , Lee SE , Miller BL , Reich SG , Riley DE , Tolosa E , Tröster AI , Vidailhet M , Weiner WJ ((2013) ) Criteria for the diagnosis of corticobasal degeneration. Neurology 80: , 496–503. |
[20] | McKeith IG , Boeve BF , Dickson DW , Halliday G , Taylor JP , Weintraub D , Aarsland D , Galvin J , Attems J , Ballard CG , Bayston A , Beach TG , Blanc F , Bohnen N , Bonanni L , Bras J , Brundin P , Burn D , Chen-Plotkin A , Duda JE , El-Agnaf O , Feldman H , Ferman TJ , Ffytche D , Fujishiro H , Galasko D , Goldman JG , Gomperts SN , Graff-Radford NR , Honig LS , Iranzo A , Kantarci K , Kaufer D , Kukull W , Lee VMY , Leverenz JB , Lewis S , Lippa C , Lunde A , Masellis M , Masliah E , McLean P , Mollenhauer B , Montine TJ , Moreno E , Mori E , Murray M , O’Brien JT , Orimo S , Postuma RB , Ramaswamy S , Ross OA , Salmon DP , Singleton A , Taylor A , Thomas A , Tiraboschi P , Toledo JB , Trojanowski JQ , Tsuang D , Walker Z , Yamada M , Kosaka K ((2017) ) Diagnosis and management of dementia with Lewy bodies. Neurology 89: , 88–100. |
[21] | ICD-10 Version ((2010) ) https://icd.who.int/browse10/2010/en#. Accessed October 23, 2020. |
[22] | Disanto G , Barro C , Benkert P , Naegelin Y , Schädelin S , Giardiello A , Zecca C , Blennow K , Zetterberg H , Leppert D , Kappos L , Gobbi C , Kuhle J ; Swiss Multiple Sclerosis Cohort Study Group ((2017) ) Serum neurofilament light: A biomarker of neuronal damage in multiple sclerosis. Ann Neurol 81: , 857–870. |
[23] | Gleerup HS , Sanna F , Høgh P , Simrén J , Blennow K , Zetterberg H , Hasselbalch SG , Ashton NJ , Simonsen AH ((2021) ) Saliva neurofilament light chain is not a diagnostic biomarker for neurodegeneration in a mixed memory clinic population. Front Aging Neurosci 13: , 659898. |
[24] | Gleerup HS , Jensen CS , Høgh P , Hasselbalch SG , Simonsen AH ((2021) ) Lactoferrin in cerebrospinal fluid and saliva is not a diagnostic biomarker for Alzheimer’s disease in a mixed memory clinic population. EBioMedicine 67: , 103361. |

