
Clustering Alzheimer’s Disease Gene Expression Dataset Reveals Underlying Sexually Dimorphic and Disease Status Profiles
Abstract
Background:
The multiple appearance phenotypes in Alzheimer’s disease (AD) are manifested in epidemiologic sexual dimorphism, variation in age of onset, progress, and severity of the disease.
Objective:
In this study, we focused on sexual dimorphism, aiming to untie some of the complex interconnections in AD between sex, disease status, and gene expression profiles. Two strategic decisions guided our study: 1) to value transcriptomic multi-layered profiles over alterations in single genes expression; and 2) to embrace a sexual dimorphism centered approach, as we suspect that transcriptomic profiles may dramatically differ not only between healthy and sick individuals but between men and women as well.
Methods:
Microarray dataset GSE15222, fulfilling our strict criteria, was retrieved from the GEO repository. We performed cluster analysis for each sex separately, comparing the proportion of healthy and AD individuals in each cluster.
Results:
We were able to identify a biased, female, AD-typified cluster. Furthermore, we showed that this female AD-typified cluster is highly similar to one of the male clusters. While the female cluster constitutes mostly sick individuals, the male cluster constitutes healthy and sick individuals in almost identical proportion.
Conclusion:
Our results clearly indicate that similar transcriptomic profiles in the two sexes are “physiologically translated” in to a very different, dramatic outcome. Thus, our results suggest the need for a sex-based and transcriptomic profile-based study, for a better understanding of the onset and progression of AD.
INTRODUCTION
Alzheimer’s disease (AD) is a progressive neurodegenerative disease, accountable for up to 80% of dementia cases [1]. Memory loss of newly learned information is one of the first symptoms of AD. Long before that, microscopic changes in brain architecture starts to emerge [1, 2], mainly the extracellular deposited amyloid-β (Aβ) peptide known as amyloid plaques, and the intracellular hyperphosphorylated tau protein accumulation as neurofibrillary tangles [3].
AD prevails worldwide with the highest incident rate in North America and Western Europe. The most dominant risk factor of AD is aging, with an exponential growth of incident rate with age. AD is a multifactorial disease with genetic (70%) and environmental (30%) causes: i.e., risk factors are categorized as genetic, non-modifiable, or multiple modifiable lifestyle related ones [4, 5].
Two sub-populations of AD patients are diagnosed: early onset individuals, developing AD prior to the age of 65 years, and late onset AD, accountable for 95% of all AD patients (age 65 years and above). Early onset AD is associated with inherited, dominant rare mutations in amyloid precursor protein (APP) and in presenilin (PSEN1 and PSEN2) [6– 8]. Late onset AD is known to be associated with Apolipoprotein E (APOE) ɛ4 allele [9]. APOE gene transcribes into three variants: APOE ɛ2, ɛ3, and ɛ4. Heterozygotes for APOE ɛ4 allele are at 2-3 fold higher risk for AD, while homozygotes show four times higher risk for AD than the heterozygotes [4, 5, 10]. APOE ɛ2 allele, on the other hand, shows a protective effect, and is under-represented in AD patients in comparison to the healthy population [4, 9– 13]. Furthermore, genome wide association studies indicate the involvement of three biological pathways associated with AD: the immune system and inflammatory responses; cholesterol and lipid metabolism; and endosomal vesicle recycling, in a yet unknown manner [8].
Sexually dimorphic occurrence rate of AD is reported around the world, with an approximately twofold higher rate of AD in women [14, 15]. Yet, recently, a large-scale meta-analysis combining the results of nearly 58,000 individuals, reported that the risk of developing AD in individuals with APOE ɛ3/ɛ4 genotype was found to be similar between men and women, while women have an increased risk at younger ages, indicating the complex interconnections between an individual’s sex and genotype [16].
Understanding the role and mode of influence of the various factors interconnected in AD may potentially lead to the alteration of AD from untreatable to an improvable disease, and maybe even toward diagnosis and extension of the pre-symptomatic phase [5].
As in many complex diseases, the AD patient population is composed of several sub-groups of phenotypes expressed in different onset, progress, and severity of the disease. Thus, we are witnessing multiple appearances under the same disease name. Under these circumstances, identifying “elite genes”, directly involved in AD pathology onset and progress, is central, yet far from being sufficient. We would like to suggest that the profound distinction between AD patients and healthy controls does not lie in any single specific gene but rather in a complex pattern of gene expression. Moreover, we suspect that this pattern may dramatically differ between men and women.
Thus, we implemented two strategic decisions: first, to embrace a sexual dimorphism centered approach, stressing the notion that the differences between healthy and sick individuals are not necessarily synonymous when it comes to the sex of the individuals studied, and might even reflect a mirror image of each other; and second, to value transcriptomic multi-layered profile over alterations in single genes expression.
Following the split of the dataset according to sex criteria, we performed K-means cluster analysis. We then studied the proportion of healthy and AD subjects in the two defined clusters. Thus, we were able to identify a biased, female, AD-typified cluster.
METHODS
Data were retrieved from Gene Expression Omnibus (GEO) repository [17]. We analyzed GSE15222 experiment datasets which include human brain from 363 cortical samples. Transcriptome analysis was performed on these 363 individuals: 177 women, out of which 85 were healthy individuals and 92 AD patients; and 199 men, out of which 102 were healthy individuals and 88 AD patients.
This specific dataset was chosen due to its large size and moreover a sufficient number of cases from each sex by disease status combination.
To guarantee that only substantially expressed probes will be included in this analysis, a threshold was set such that probes were only considered if at least 50% of each group subjects had an expression level above the overall 95th percentile. We used the bisection algorithm in order to find the appropriate percentile of expression level over the entire experiment’s data set.
K-means cluster analysis was implemented, in order to reveal whether we could untie some of the complexities of AD, in terms of the interconnections between sex, disease state, and gene expression patterns. This algorithm was chosen as it can provide adequate partitioning of a dataset without prior knowledge, while enabling the user to control and determine the suitable number of clusters.
For each dataset of gene expression, two cluster analyses were carried out. Clusters were defined according to a criterion of expression level distance. Thus, within each cluster the distance of the probes’ expression levels aims to be the smallest, while attempting to achieve the largest distance between clusters. According to this algorithm, each individual was ascribed to one of the groups, thus we could determine whether group ascription is associated with additional characteristics (i.e., disease status). Each group was characterized by its own probe expression pattern.
Since the main goal of our study was to detect genes significantly contributing to sexual dimorphism characteristic of AD, we performed the cluster analysis for men and women separately, due to our concern that expression profiles unique to one gender would be masked.
We used multiple logistic regression in order to test for the effects of gender and cluster assignment on disease status, and the Chi-square test as follow-up analysis in order to correlate cluster assignment with disease status separately for men and women and learn the nature of the interaction. We considered results as statistically significant at p < 0.05.
RESULTS
Gene expression data were split into subsets according to sex. K-means clustering algorithm was implemented to create two clusters. Clusters were formed based on a vector of their probe’s expression levels, such that subjects that were assigned to the same cluster were similar in their probe expression levels vector, while subjects not assigned to the same cluster differed in it. Consequently, in each group (190 males or 177 females) subjects were separated into two clusters, substantially different from each other. No correlation between age and clusters’ assignment was found for either sex.
We were interested in the interaction between gender and cluster assignment that affects disease status— namely, to test if the assignment of healthy and AD individuals into two clusters differ between men and women. In order to test the interaction, we conducted binary logistic regression. As cluster names are arbitrary, we had to verify that gender differences in cluster assignment are a result of true differences in the cluster patterns, as opposed to a result of the randomly given cluster name. Therefore, we marked as “cluster I” the cluster to which the majority of the individuals were assigned in each gender. However, we repeated the test with opposite cluster names in one gender, obtaining even more significant results. For reasons of parsimony, we will only present the results from the first model.
While neither of the main effects of gender or of cluster were significant (odds ratio (OR) = 0.26, p = 0.052 and OR = 0.46, p = 0.318, respectively), we found a significant gender by cluster interaction (OR = 3.81, p = 0.015). In order to more deeply understand the nature of the interaction, we conducted separate Chi-square tests for men and women, to test the relation between cluster and disease status. We found that while clusters did not differentiate between healthy and AD men, they were highly correlated with disease status among women. In detail, a crossmatch of female clusters with disease status revealed most intriguing results. Cluster II was almost solely composed of AD women (∼83%; p < 0.001; Table 1), while cluster I and both male clusters showed a more even proportion of AD and healthy distribution. The differences between the two transcriptomic profiles in women are visually demonstrated in Fig. 1.
Table 1
Uneven distribution of healthy and sick women between the two gene expression profiles clusters. Table 1 presents the different interconnections between disease status and sexes in each cluster, by sex and by disease status. p-value of disease status and sex of individual’s distribution is presented
| Dataset ID | GSE15222 | |||
| Sex | Female (n = 177) | Male (n = 190) | ||
| Cluster ID [size]/ Disease state | Cluster I | Cluster II | Cluster I | Cluster II |
| Healthy | 78 | 7 | 76 | 26 |
| AD | 59 | 33 | 55 | 33 |
| p | < 0.001 | Not significant | ||
Fig. 1
A) Women transcriptomic profiles, cluster I (blue) and II (green); B) Women transcriptomic profiles, cluster I (blue) and II (green) zoom in on probes 1– 100.
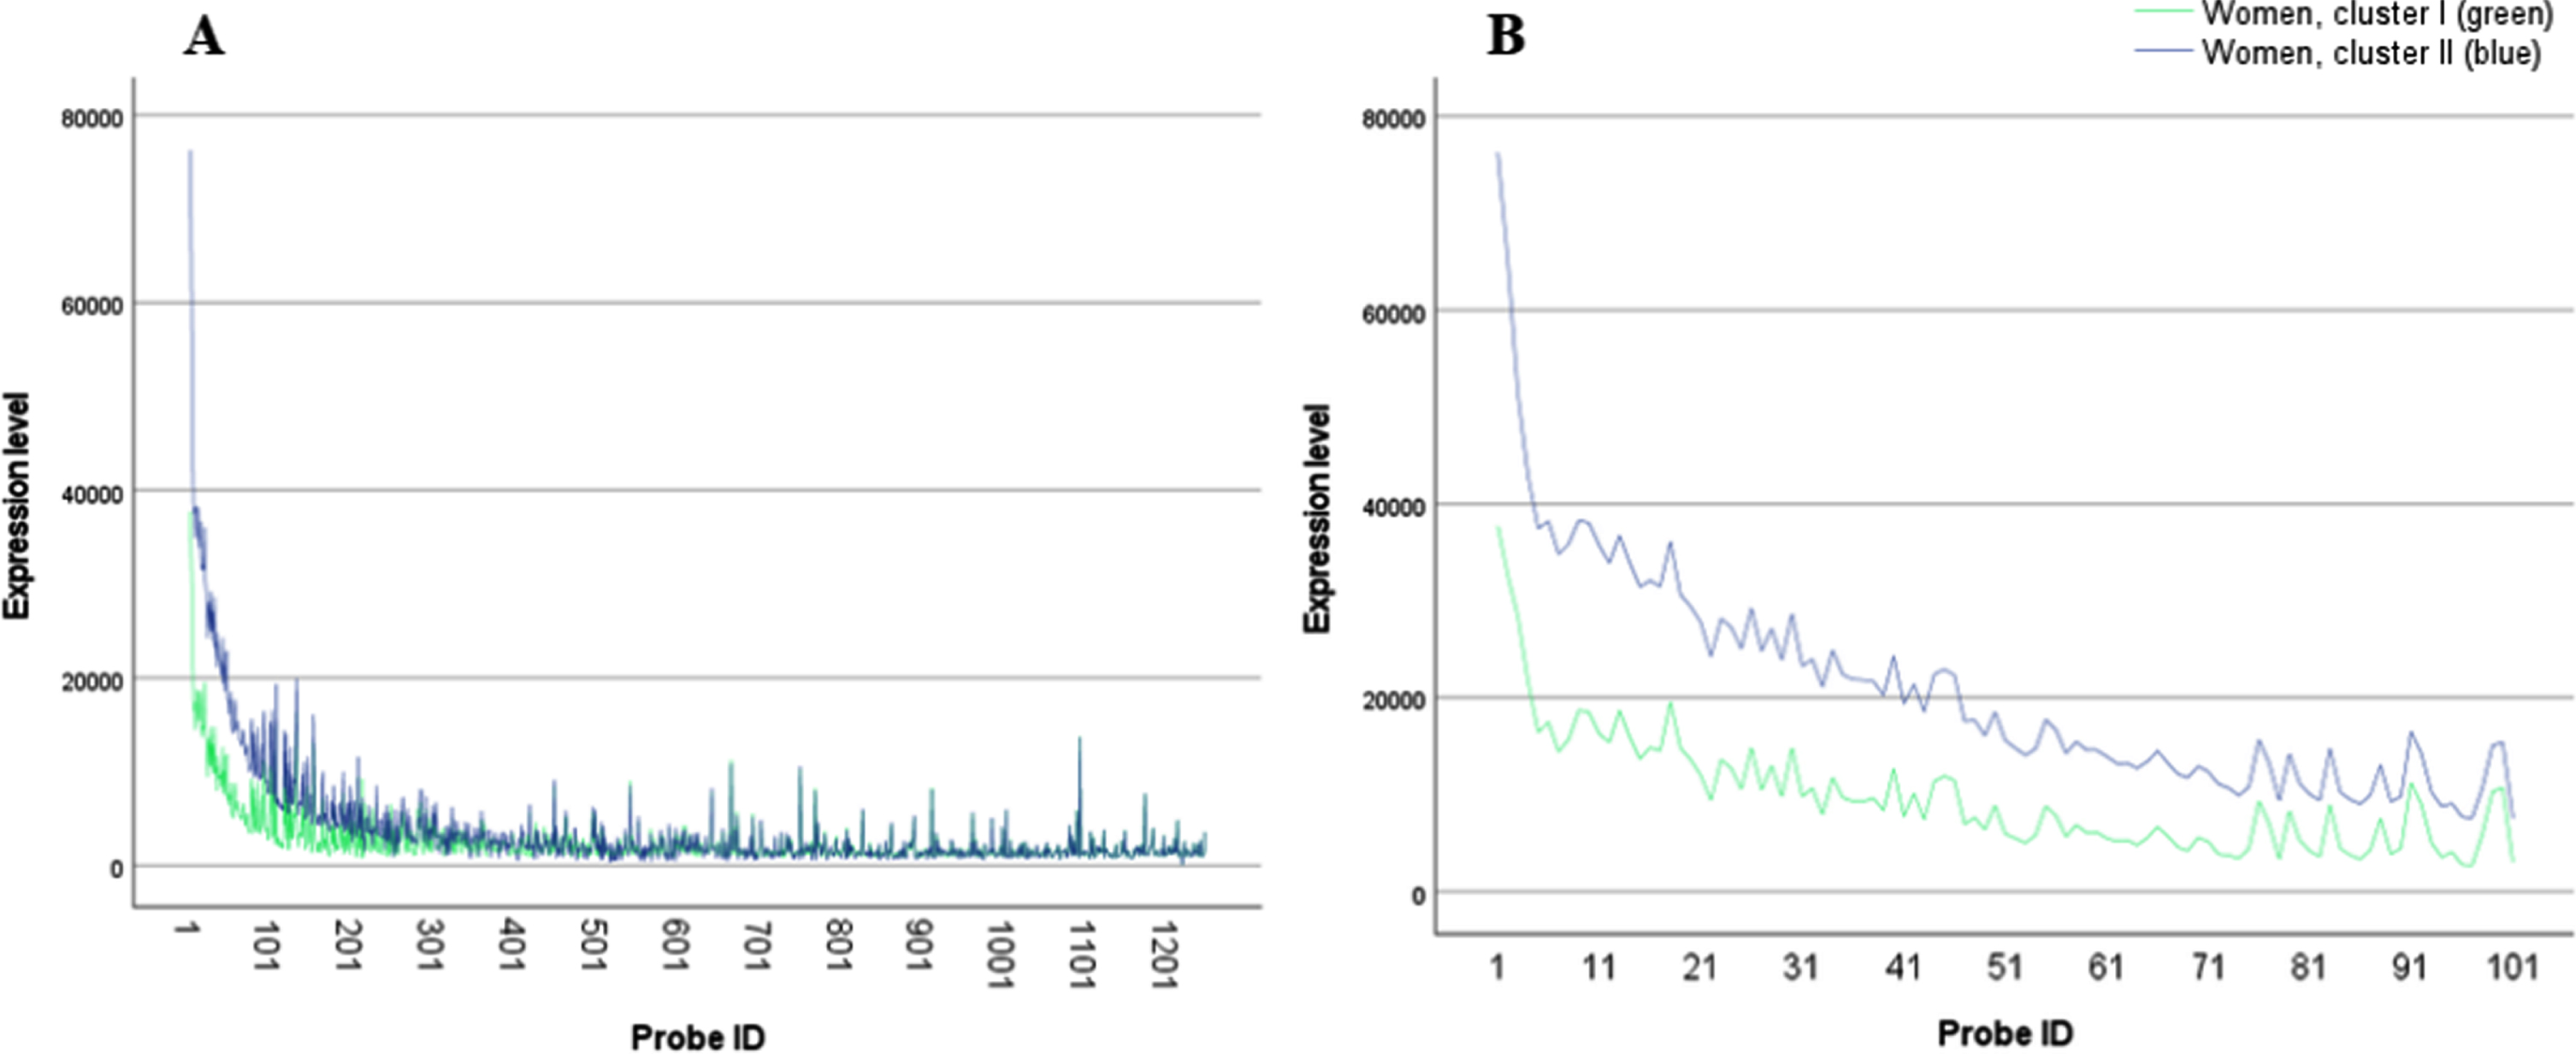
The split of the dataset according to sex enabled us to uncover differences in correlation between transcriptomic profiles and disease status, in women alone, a tendency that would have been masked if male and female data were analyzed together.
Second to the identification of the sexually dimorphic effect on the uneven distribution of AD versus healthy individuals in female cluster II, we focused on evaluating whether we can identify similarities between the two clusters of men and women. In other words, we wanted to see if the transcriptomic profiles of cluster I and II are similar among the men and women. Figure 2 displays a clear picture; while cluster I profiles of the men and women almost totally overlap, cluster II profiles are spaced one from the other, with a small elevation in the mean expression levels of the women’s probe in comparison to the men ones. Yet, though the differences between the two profiles of cluster II do not seem very dramatic, they hold a striking difference in terms of the proportion of subjects populated them. While female cluster II constitute mostly sick, AD individuals male cluster II holds healthy and sick patients in almost identical proportion. In order to statistically support this observation, we calculated a standard deviation-like measure, i.e., the square root of mean squared distances between cluster centers. We compared the two sexes within each cluster, contrasted with comparing the two clusters within each sex. The results, presented in Table 2, show that the distance between men and women in cluster I is smaller than the same distance in cluster II, while the differences between the two clusters within each sex are dramatically larger, up to over 10 times. Medians of the squared distances lead to the same conclusion.
Fig. 2
A) Women and men transcriptomic profiles, cluster I (blue - women; red men) and II (green - women, grey - men; a list of the probes by name is presented in Supplementary Table 1); B) Women and men transcriptomic profiles, cluster I (blue - women; red men) and II (green - women, grey – men) zoom in on probes 1– 100.
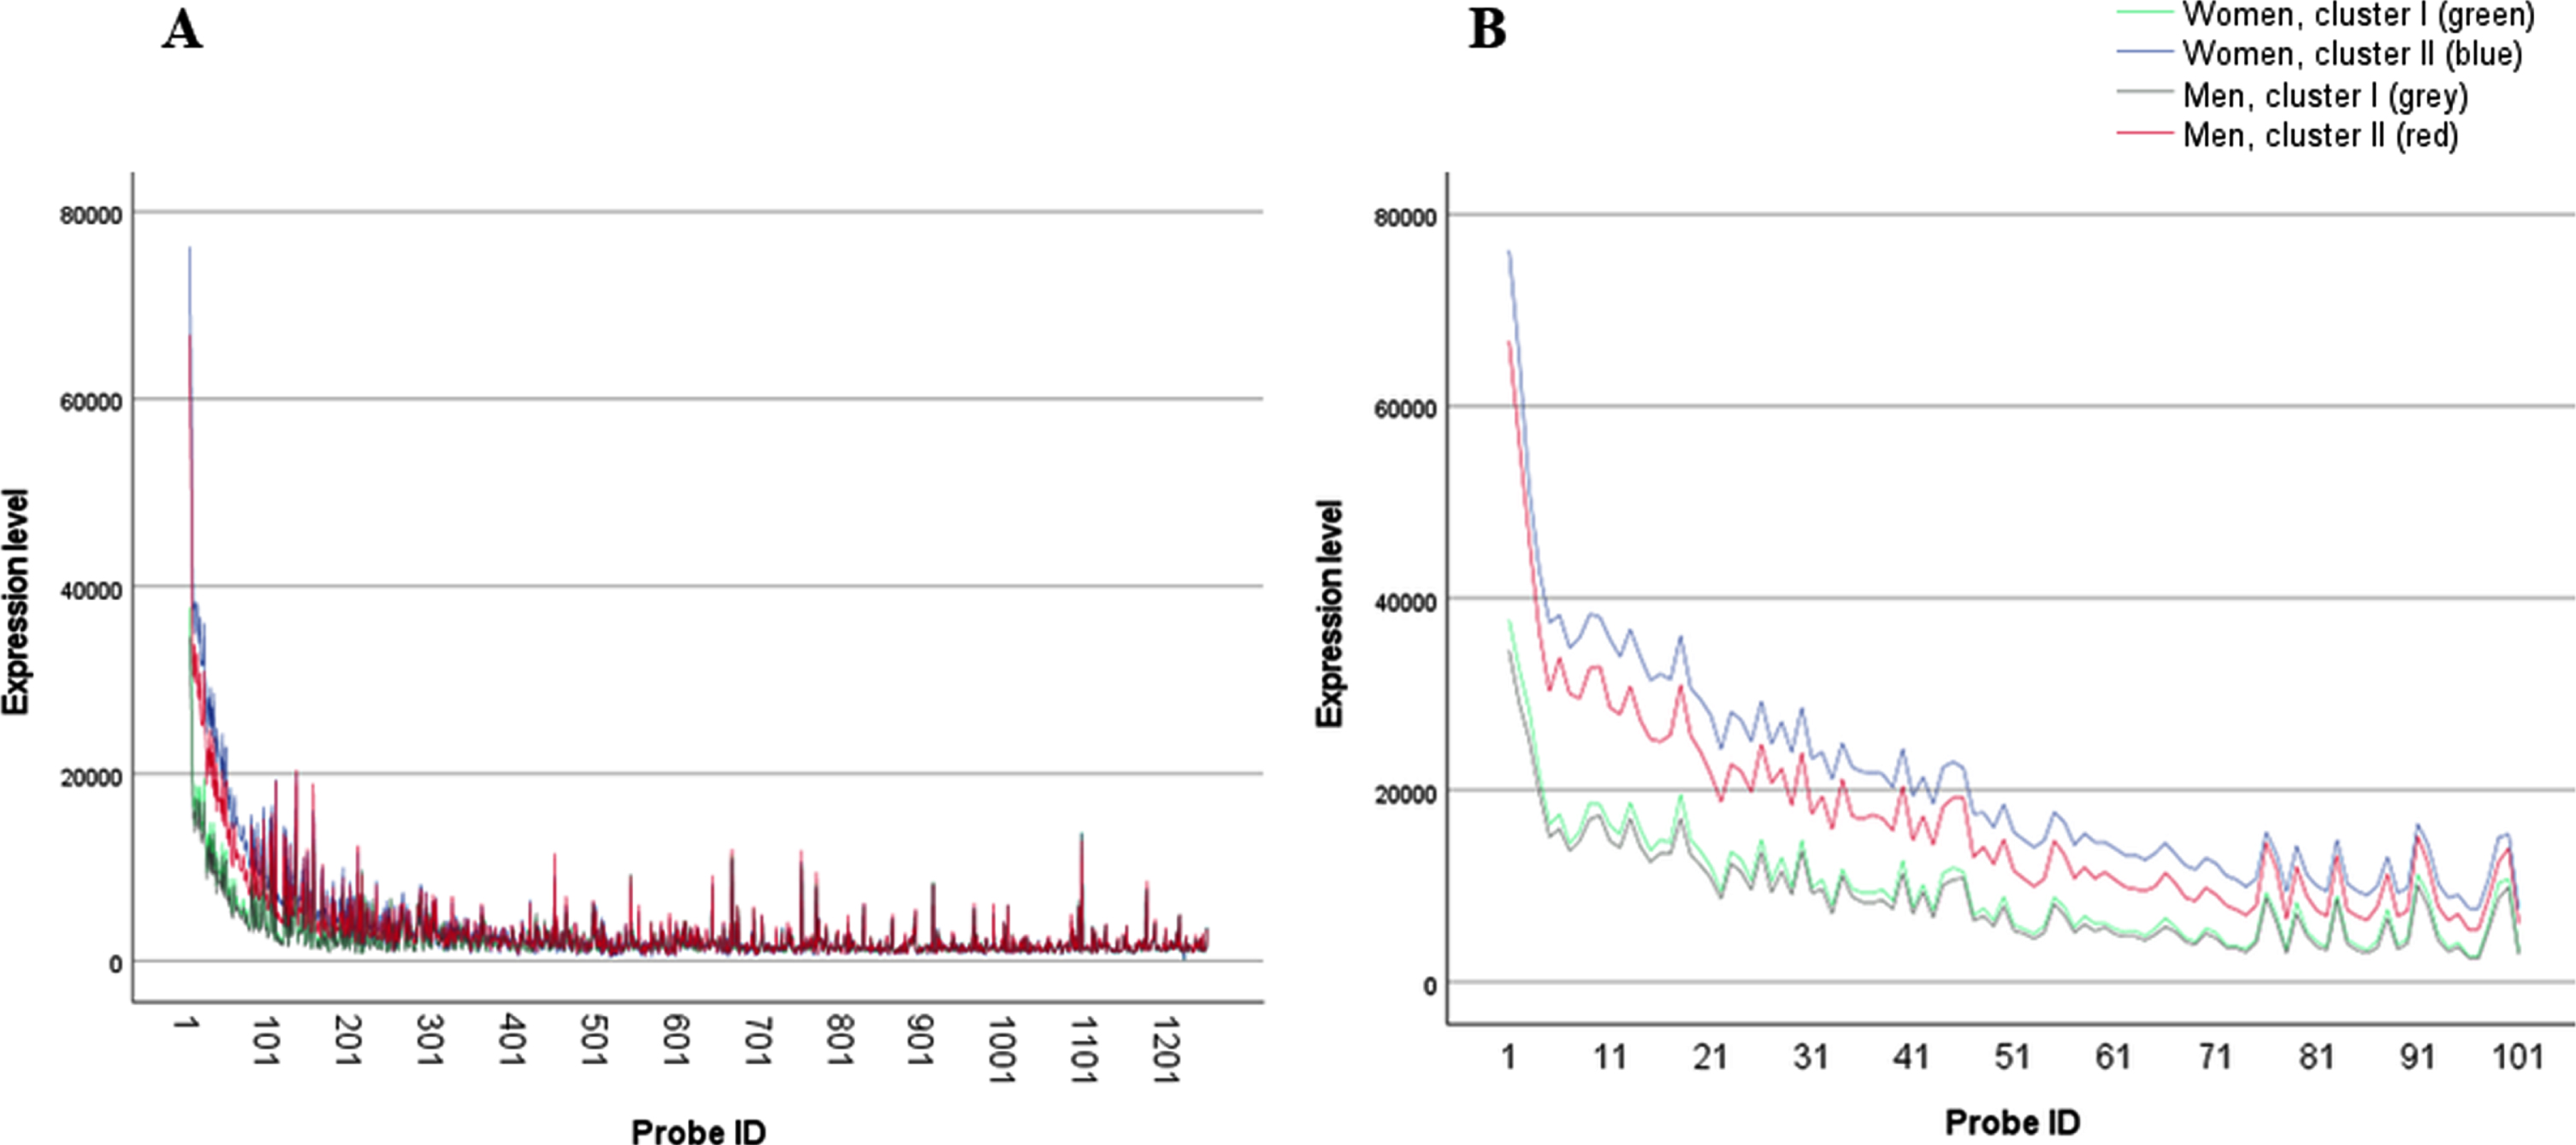
Table 2
Square root and medians of the squared distances between cluster centers. Table 2 presents the square root of mean squared distance, and the median squared distance of the two sexes in each cluster and of the two clusters within each sex
| Cluster I, male versus female | Cluster II, male versus female | Male, cluster I versus cluster II | Female, cluster I versus cluster II | |
| Square root of mean squared distance | 359.3 | 1321.4 | 2868.8 | 3778.3 |
| Median squared distance | 8,715 | 43,708 | 137,058 | 177,754 |
DISCUSSION
In this study, we reanalyzed documented gene expression levels of AD and healthy individuals’ brain samples. Following the split of data according to subjects’ sex, we implemented K-means clustering separating each sex into two clusters, based on a vector of each individual probes’ expression level. Consequently, strongly dissimilar transcriptomic profiles for each sex were obtained. We were interested in whether any of those profiles were indicative of AD and if this indication differs between the sexes. A sexual dimorphism is indeed evident, with a greater representation of AD subjects in one of the clusters in females, but not in males. Specifically, we identified a biased, female, AD-typified transcriptomic profile.
Disease-oriented functional genomics strive to detect the change that unless occurred, the normal phenotype would have stayed intact, thus promoting our understanding of the molecular base of a given disease. This strategy is beneficial, yet often tells us only part of the story. Our results clearly demonstrate the need for studying entire gene interaction. Here we showed that the expression profiles of healthy and AD subjects are highly dissimilar up to the point of profiles’ segregation, and more so when considering a more complex pattern which involves the sex of the subject, attributing sexual dimorphism its proper contribution.
Epidemiological studies indicate that a major risk factor for AD is being female [14]. Thus, identifying such a striking biased cluster raises the possibility that healthy women expressing this transcriptomic profile are more prone to develop AD, possibly due to genetic predisposition. Namely, we might be looking at a transcriptomic profile characterizing not only AD female patients but also pre-clinical ones. Further study is needed to explore this possibility. Obviously, no long-term follow-up is relevant, due to the nature of the samples taken (postmortem autopsy). Yet, familial heritage analyses may provide an indirect clue to the potential of this hypothesis, hence, the enrichment of these individuals with an AD inherited background.
We further showed that small differences in the transcriptomic profiles of cluster II in men and women holds dramatic surprise in terms of the proportion of AD and healthy subjects populating these clusters. While most women presenting this profile were diagnosed with AD, men presenting a very similar profile showed no significant distribution between AD and healthy individuals. It is intriguing to decipher the way similar transcriptomic profiles are “physiologically translated” in to a very different, dramatic outcome.
In cancer research, decreased disease incidents in women is evident from the age of menarche to menopause and declines in postmenopausal age, stressing possible female hormones protective effect [18, 19]. Indeed, rodents models of glioblastoma multiform and gastric cancer demonstrated survival rate improvement with the administration of estradiol [20, 21]. Sex hormone effects were suggested to be mediated via gene-specific DNA methylation and histone modification, stressing the role of epigenetics in sexual dimorphism [22].
The phenomenon observed in which similar transcriptomic profiles produce dramatic variation in the rate of sickness among the individuals presenting the profile, according to their sex, raises the question of whether sex hormones effect is involved. Yet since the youngest person in this study (male and female) was 65 years old, no direct hormonal effect is expected. However, we would like to raise the possibility that long-exposure effect of sex hormones might be accountable for different pathology-related sexual dimorphism, possibly via epigenetic mechanism.
Profound efforts are being made to develop sensitive measurement tools that will enable early diagnosis and consequently early interventions for the benefit of newly-diagnosed AD patients, including care planning, quality of life improvement, and access to new therapies that can slow down the disease process. Our results emphasize the need for sex-based and transcriptomic profile-based separation in the models produced. Further research is called for in order to better specify the expression profiles that are related to disease characteristics, formation, and progression.
AD is a multiple appearance disease. The population of AD patients is composed of several sub-groups of phenotypes manifested in different onset, progress, and severity of the disease. Thus, while studying AD gene expression profiles, one must bear in mind that a substantial “noise” and “gene expression masking” exist. While reanalyzing microarray datasets the problem of partial annotation is of significance. The number of studies in the GEO database lacking sex (and age) annotation is beyond understanding, skews what we know on gene expression patterns in human diseases, and hampers efforts to evaluate sexual dimorphism effect. Furthermore, the size of the dataset is a crucial limitation, which explains why our study is based on one dataset solely.
We identified a biased, female, AD-typified cluster. We speculate that the nature of the small subgroup of healthy women in the otherwise, AD-typified cluster, may represent pre-clinical individuals. Furthermore, we showed that this female AD-typified cluster displays high similarity to one of the male clusters, yet while the female cluster constitutes mostly sick individuals, the male cluster includes healthy and sick individuals in almost identical proportion. Namely, similar transcriptomic profiles in the two sexes, are “physiologically translated” in to a very different, dramatic outcome.
CONCLUSIONS
In this study we presented a distinction in transcriptomic profiles between male and female, AD and healthy individuals. While further research is required in order to determine the precise nature of these differences, this may be the key to genetically targeting individuals at risk for AD. Hence, utilizing the newly acquired knowledge about the sex-based differences may serve to increase early detection of AD onset and of progression.
CONFLICT OF INTEREST
The authors have declared that no conflict of interest exists.
SUPPLEMENTARY MATERIAL
[1] The supplementary material is available in the electronic version of this article: https://dx.doi.org/10.3233/ADR-210014.
REFERENCES
[1] | ((2021) ) 2021 Alzheimer’s disease facts and figures. Alzheimers Dement 17: , 327–406. |
[2] | Kozlova I , Parra MA , Titova N , Gantman M , Sala SD ((2021) ) Alzheimer’s disease and Parkinson dementia distinguished by cognitive marker. Arch Clin Neuropsychol 36: , 307–315. |
[3] | Reitz C , Mayeux R ((2014) ) Alzheimer disease: Epidemiology, diagnostic criteria, risk factors and biomarkers. Biochem Pharmacol 88: , 640–651. |
[4] | Hickman RA , Faustin A , Wisniewski T ((2016) ) Alzheimer disease and its growing epidemic: Risk factors, biomarkers, and the urgent need for therapeutics. Neurol Clin 34: , 941–953. |
[5] | Imtiaz B , Tolppanen AM , Kivipelto M , Soininen H ((2014) ) Future directions in Alzheimer’s disease from risk factors to prevention. Biochem Pharmacol 88: , 661–670. |
[6] | Dorszewska J , Prendecki M , Oczkowska A , Dezor M , Kozubski W ((2016) ) Molecular basis of familial and sporadic Alzheimer’s disease. Curr Alzheimer Res 13: , 952–963. |
[7] | Giri M , Zhang M , Lu Y ((2016) ) Genes associated with Alzheimer’s disease: An overview and current status. Clin Interv Aging 11: , 665–681. |
[8] | Guerreiro R , Hardy J ((2014) ) Genetics of Alzheimer’s disease. Neurotherapeutics 11: , 732–737. |
[9] | Corder EH , Saunders AM , Strittmatter WJ , Schmechel DE , Gaskell PC , Small GW , Roses AD , Haines JL , Pericak-Vance MA ((1993) ) Gene dose of apolipoprotein E type 4 allele and the risk of Alzheimer’s disease in late onset families. Science 261: , 921–923. |
[10] | Michaelson DM ((2014) ) APOE epsilon4: The most prevalent yet understudied risk factor for Alzheimer’s disease. Alzheimers Dement 10: , 861–868. |
[11] | Riedel BC , Thompson PM , Brinton RD ((2016) ) Age, APOE and sex: Triad of risk of Alzheimer’s disease. J Steroid Biochem Mol Biol 160: , 134–147. |
[12] | Roses AD ((1996) ) Apolipoprotein E alleles as risk factors in Alzheimer’s disease. Annu Rev Med 47: , 387–400. |
[13] | Serrano-Pozo A , Qian J , Monsell SE , Betensky RA , Hyman BT ((2015) ) APOEepsilon2 is associated with milder clinical and pathological Alzheimer disease. Ann Neurol 77: , 917–929. |
[14] | Podcasy JL , Epperson CN ((2016) ) Considering sex and gender in Alzheimer disease and other dementias. Dialogues Clin Neurosci 18: , 437–446. |
[15] | Carter CL , Resnick EM , Mallampalli M , Kalbarczyk A ((2012) ) Sex and gender differences in Alzheimer’s disease: Recommendations for future research. J Womens Health 21: , 1018–1023. |
[16] | Neu SC , Pa J , Kukull W , Beekly D , Kuzma A , Gangadharan P , Wang LS , Romero K , Arneric SP , Redolfi A , Orlandi D , Frisoni GB , Au R , Devine S , Auerbach S , Espinosa A , Boada M , Ruiz A , Johnson SC , Koscik R , Wang JJ , Hsu WC , Chen YL , Toga AW ((2017) ) Apolipoprotein E genotype and sex risk factors for Alzheimer disease: A meta-analysis. JAMA Neurol 74: , 1178–1189. |
[17] | Barrett T , Wilhite SE , Ledoux P , Evangelista C , Kim IF , Tomashevsky M , Marshall KA , Phillippy KH , Sherman PM , Holko M , Yefanov A , Lee H , Zhang N , Robertson CL , Serova N , Davis S , Soboleva A ((2013) ) NCBI GEO: Archive for functional genomics data sets–update.D. Nucleic Acids Res 41: , 991–995. |
[18] | Felini MJ , Olshan AF , Schroeder JC , Carozza SE , Miike R , Rice T , Wrensch M ((2009) ) Reproductive factors and hormone use and risk of adult gliomas. Cancer Causes Control 20: , 87–96. |
[19] | Giovannucci E ((2002) ) Obesity, gender, and colon cancer. Gut 51: , 147–. |
[20] | Barone TA , Gorski JW , Greenberg SJ , Plunkett RJ ((2009) ) Estrogen increases survival in an orthotopic model of glioblastoma. J Neurooncol 95: , 37–48. |
[21] | Ohtani M , Garcia A , Rogers AB , Ge Z , Taylor NS , Xu S , Watanabe K , Marini RP , Whary MT , Wang TC , Fox JG ((2007) ) Protective role of 17 beta -estradiol against the development of Helicobacter pylori-induced gastric cancer in INS-GAS mice. Carcinogenesis 28: , 2597–2604. |
[22] | Kaminsky Z , Wang SC , Petronis A ((2006) ) Complex disease, gender and epigenetics. Ann Med 38: , 530–544. |


