
Betahydroxybutyrate Consumption in Autopsy Brain Tissue from Alzheimer’s Disease Subjects
Abstract
Background:
Alzheimer’s disease (AD) features perturbed brain glucose utilization, which could contribute to brain bioenergetic failure. This led some to consider using ketone bodies to enhance AD brain bioenergetics and treat AD.
Objective:
We evaluated the rate at which brain homogenates from persons with Alzheimer’s disease (AD) metabolize D-β-hydroxybutyrate (BHB).
Methods:
We homogenized pieces of temporal cortex from frozen autopsy brains obtained from recently deceased AD subjects (n = 4), and age-matched subjects that did not have clinical AD (n = 3). Measuring the rate of CO2 production that followed the introduction of radiolabeled BHB to the homogenates yielded a BHB utilization rate.
Results:
Compared to the control homogenates, the BHB-supported CO2 production rate was 66%lower in the AD homogenates (p < 0.05).
Conclusions:
AD brains can utilize BHB, albeit less robustly than control brains. In conjunction with a previous study that demonstrated reduced glucose utilization in AD brain homogenates, our BHB data provide further evidence of AD brain mitochondrial dysfunction or altered mitochondrial biology.
INTRODUCTION
After we and others first used fluorodeoxyglucose positron emission tomography (FDG PET) to demonstrate cerebral glucose utilization declines in Alzheimer’s disease (AD) [1–3], we began to explore this phenomenon’s biochemical basis. Using brain homogenates obtained from rapid-autopsy brains removed from decedents with and without AD, we observed a 73%reduction in the AD glucose consumption rate [4].
To test whether reduced AD brain energy meta-bolism was restricted to glucose, we next considered the consumption rate of an alternative fuel utilized by the brain, the ketone body D-β-hydro-xybutyrate (BHB). Our approach repeated that used for the glucose experiments, except we substituted BHB for glucose. These BHB experiments were performed in 1988 and 1989 and predate ketone-based interventions to treat AD. Select results from these experiments were previously reported in abstract form [5], but the BHB data we now detail remained unpublished in any form.
MATERIALS AND METHODS
Brains
Samples of autopsy-derived temporal cortex from decedents with AD and non-demented, age-matched individuals was provided by the New York University Medical Center Department of Pathology. These individuals were evaluated during life through the Medical Center’s Aging and Dementia program and consented to brain donation under an institutionally approved protocol. The cause of death for the non-demented brain donors was medical illness not related to central nervous system disease. AD was initially clinically diagnosed using the original McKhann et al. criteria [6], and the presence or absence of AD was further verified by histologic examination [7]. Cognitive test scores are not available for the AD brain donors. Brains were obtained less than 12 h postmortem and stored frozen at –70°C.
Homogenate preparation
To prepare homogenates, 5 grams of frozen temporal cortex was removed using a scalpel and the isolated piece was then thawed. The thawed cortices were homogenized in 2.5 ml of Krebs Improved Ringer phosphate without glucose (KRP-G) buffer, pH 7.4, with three strokes of a Dounce homogenizer. We also heat-denatured homogenate aliquots to serve as negative control samples.
BHB consumption measurements
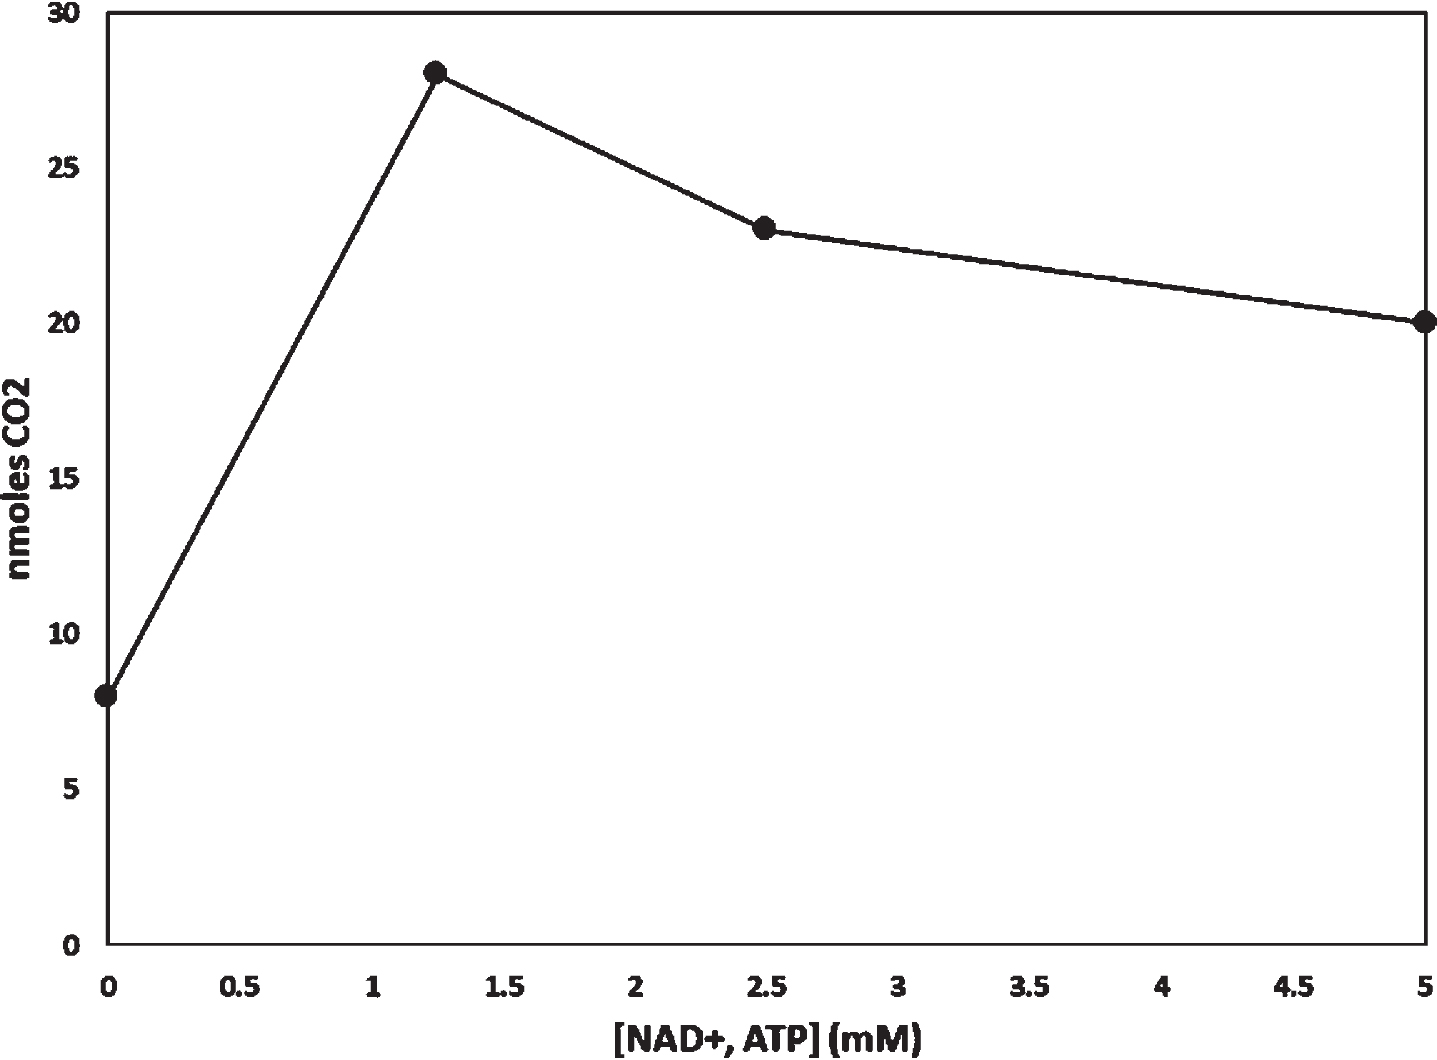
To measure BHB consumption we modified methods previously described by Sims et al. to apply specifically to autopsy brain [8]. All assays were performed in duplicate. We diluted 200μl of homo-genate in 2.8 ml of KRP-G buffer and added it to sealable glass flasks. As our earlier studies of glucose consumption also included the addition of NAD + and ATP, in preliminary experiments we determined optimal NAD + and ATP concentrations for measuring BHB consumption. Whereas we previously found 2.5 mM NAD + and 2.5 mM ATP optimized glucose consumption [4], for BHB we determined 1.25 mM NAD + and 1.25 mM ATP were optimal (Fig. 1). Therefore, unless otherwise specified to measure BHB consumption we also added 1.25 mM NAD + and 1.25 mM ATP. Unless otherwise specified we did not add any exogenous glucose to these assays.
Fig. 1
Effect of adding NAD + and ATP to a homogenate. Equal concentrations of NAD + and ATP were added to flasks containing homogenate from a common homogenate preparation. 14CO2 derived from radiolabeled BHB. The incubation period was 60 min.
The flasks were flushed with O2 and sealed with rubber serum stoppers equipped with a center well. The center wells contained 100μl of hyamine hydroxide. Metabolism reactions were initiated by injecting the homogenates with D(-)-betahydroxy [3–14C] butyrate potassium salt (NEN NEC-637) diluted with unlabeled D-BHB. The final BHB concentration in the flasks was 0.625 mM, with a final specific activity of 0.73μCi/μmole.
Flasks were incubated for 40, 80, and 120 min. To determine the amount of 14CO2 trapped in each center well’s hyamine hydroxide we transferred the hyamine hydroxide to scintillation vials and used a standard scintillation counting protocol to measure the 14CO2 content [4]. To determine the protein content present in each flask’s homogenate we applied the method of Lowry [9] using a Varian Cary 219 spectrophotometer.
Effect of glucose on BHB metabolism
Using homogenate from a single control brain, we modified the methods described above by additionally supplementing with different amounts of unlabeled glucose (0 mM, 1 mM, and 2 mM) to duplicate flasks. For this experiment we used 2.5 mM NAD + and 2.5 mM ATP rather than the 1.25 mM concentrations. Under these conditions we determined the amount of 14CO2 generated from the D(-)-betahydroxy [3–14C] butyrate potassium salt following a 90 min incubation.
Data analysis
Raw data were converted to nmoles CO2/mg protein using the method described by McGarry and Foster [10]. We determined rates by dividing these values by the time in minutes, yielding rates with values of pmoles CO2/mg protein/minute. Assay groups were compared using the Student’s T test with significance defined as p < 0.05, two-way.
RESULTS
The age of death for the AD decedents trended higher than that of the controls, but the mean ages were not significantly different (p = 0.13) (Table 1). Postmortem intervals for all brains was less than 12 hours. In these assays of autopsy tissue homogenates, adding NAD + and ATP appeared to influence BHB consumption (Fig. 1). Assays were performed in duplicate, and duplicate assays varied by less than 15%. 14CO2 did not accumulate in the hyamine hydroxide of flasks that contained heat-inactivated homogenate.
Table 1
Brains used in the main analysis
| AD | Control | |
| Number of Brains Analyzed | 4 | 3 |
| Age at Death (Years±Standard Deviation) | 84.5±5.2 | 75.7±7.8 |
CO2 production rates were essentially linear over 120 min (Fig. 2A). The CO2 production rate for the AD group was 34%of the control group production rate (p < 0.05) (Fig. 2B; Table 2). Adding 1 mM glucose to a single control brain homogenate appeared to slightly lower the rate of BHB-derived CO2 production, by 12%, while adding 2 mM led to an apparent more profound 78%reduction (Fig. 2C).
Fig. 2
BHB-derived CO2 production by AD and control brain homogenates. A) For both groups CO2 production was essentially linear over 120 min. The assayed homogenates contained 1.25 mM NAD + and 1.25 mM ATP; no exogenous glucose was added. B) The CO2 production rate was lower in the AD brains. The assayed homogenates contained 1.25 mM NAD + and 1.25 mM ATP; no exogenous glucose was added. C) For one assessed control brain, adding 1 mM glucose appeared to slightly lower BHB-derived CO2 production, while adding 2 mM glucose appeared to dramatically lower BHB-derived CO2 production. In addition to providing exogenous glucose, the experiment shown in 2C was performed in the presence of 2.5 mM NAD + and 2.5 mM ATP.
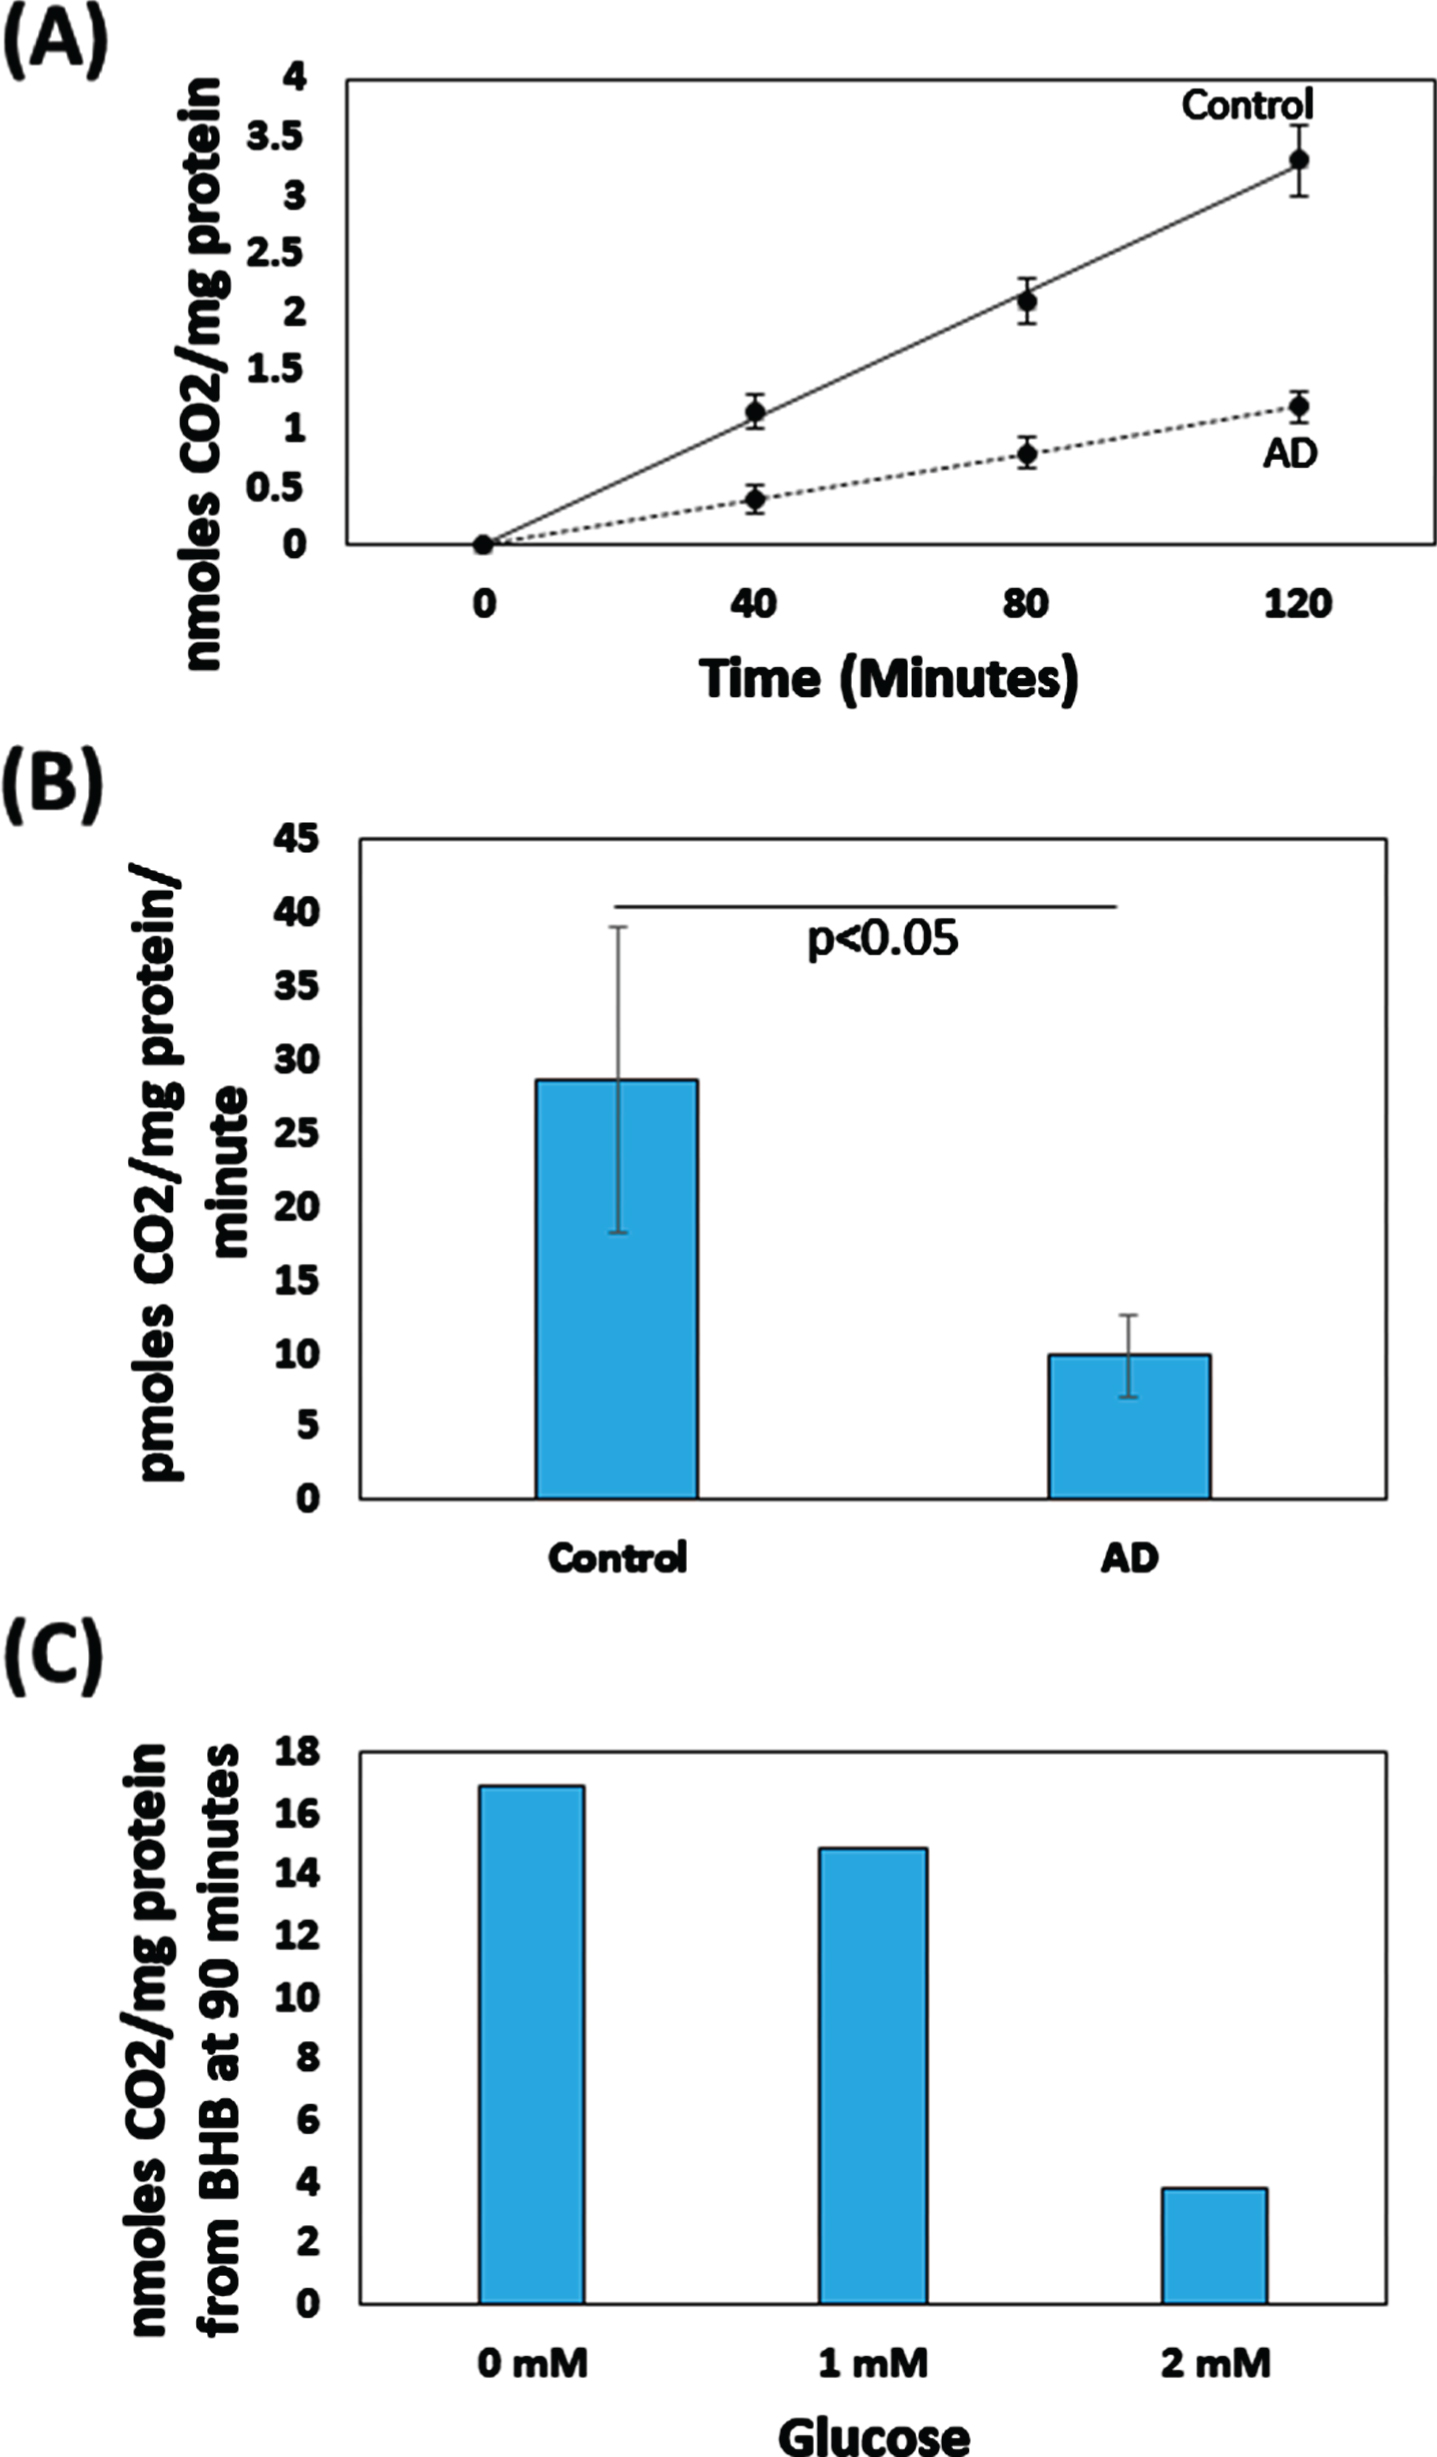
Table 2
Rates of CO2 production from BHB and from glucose. Units are pmoles CO2/mg protein/minute±standard error of the mean. The glucose data are from [4]
| AD | Control | |
| BHB | 9.9±2.8 | 28.7±10.4 |
| Glucose | 9.3±0.7 | 34.2±9.3 |
We could not assess the statistical significance of the glucose-related reduction in BHB-derived CO2 production because we did not perform repeated or independent measurements. Table 2 further compares the results of our BHB assays with the results of a companion study that used radiolabeled glucose to measure rates of AD and control brain glucose-derived CO2 production [4].
DISCUSSION
We designed this study because glucose utilization is reduced in the AD brain [1–3] and we wanted to test whether the AD brain could metabolize an alternative bioenergetic substrate. In addition to glucose brains can use ketone bodies to produce ATP [11], so we analyzed whether the AD brain could perform ketolysis. We found the AD brain can perform ketolysis of a ketone body, BHB, and use this to support a Krebs cycle flux and, therefore, brain bioenergetics.
In homogenates prepared from a single control brain, adding glucose in adequate amounts reduced BHB-derived CO2 production. This supports our view that the CO2 produced in these experiments derived from the Krebs cycle. Both BHB and glucose carbon undergo conversion to acetyl CoA, which feeds into the Krebs cycle. The glucose-induced reduction in BHB-derived CO2 production is consistent with the possibility that the presence of glucose reduced ketolysis, or acetyl CoA produced through glycolysis competed with acetyl CoA produced from BHB. A reduction in ketolysis could occur if glycolysis competes for and removes from the homogenate NAD + that is needed to oxidize BHB to acetoacetate. Data shown in Fig. 1 are compatible with this scenario. The potential for glucose-derived carbon intermediates to compete with BHB during mitochondrial uptake also warrants consideration. Nevertheless, although our available data cannot confirm this, we speculate a competitive entry of acetyl CoA into the Krebs cycle is the more likely explanation. It is further important to note we did not repeat this specific experiment using an AD brain, so we do not know whether an AD brain, which could manifest additional problems with glycolysis flux [4], would similarly respond to increasing amounts of exogenous glucose.
The fact that adding 2 mM glucose robustly re-duced BHB-derived CO2 production, while adding 1 mM glucose only slightly reduced it, suggests potential differences in the group glucose content cannot account for the rather large reduction in the AD BHB-derived CO2 production rate. Other factors thus require consideration. Autopsy brain integrity is susceptible to pre-mortem agonal effects, differences in the postmortem interval, and storage conditions. For the brains we used we are unaware of pre-mortem agonal differences. We only used brains with a postmortem interval of less than 12 h, which studies suggest is adequate to avoid profound reductions in enzyme function [12, 13]. Freeze-thaw effects could also affect our results. Upon receiving brains, we maintained them in a common freezer and avoided freeze-thaw cycles. For the brain bank that supported this study, though, we cannot verify freezer function or the distribution of brains within those freezers before we acquired them.
We suspect other factors more likely contribute to lower BHB-derived CO2 production in the AD group. Neuron but not glial cell loss occurs in AD [14–16]. Brain ketolysis primarily occurs in neurons [17], so their selective elimination could reduce BHB-derived CO2 production. The Krebs cycle resides within mitochondria, and the AD brain contains reduced numbers of normal-appearing mitochondria and reduced activities of some Krebs cycle enzymes [18, 19]. AD brain respiratory chain function is also perturbed [20], which could impact the Krebs cycle by generating oxidative stress or lowering NAD + /NADH and FAD/FADH2 ratios.
In considering our data it is further worth noting the BHB-derived CO2 production rate in these experiments is roughly equivalent to the glucose-derived CO2 production rate we previously reported [4]. In the glucose study the control group CO2 production rate was 34.2 pmoles CO2/mg protein/min (versus 28.7 pmoles CO2/mg protein/min with BHB), and in the AD group it was 9.3 pmoles CO2/mg protein/min (versus 9.9 pmoles CO2/mg protein/min with BHB). Some of the brains used in the BHB study were also used in the glucose study. Since glucose and BHB fluxes converge in the mitochondria, we strongly suspect mitochondrial dysfunction or other aspects of mitochondrial biology contribute to reduced BHB and glucose-derived CO2 production.
In addition to the technical and interpretive limitations already discussed, because these were autopsy brains and because at the time we performed this study the field was less focused on early diagnosis or analyses of biospecimens from mild or very mild cases, our AD brains in general featured advanced cases. The AD decedent age also trended higher than the control decedent age, but given the rate of age-related decline in brain glucose consumption we previously reported [4], we would not expect a one-decade age difference to account for the AD-control difference in BHB consumption rates. Another limitation is that our study utilized only seven brains, which could enhance the chances of a Type 1 error. Small datasets in general are at greater risk of statistical error than large datasets [21], and we acknowledge our study in any case was only powered to detect a large difference.
More recent data obtained through [(11)C]-aceto-acetate PET studies of living AD and cognitively normal subjects show comparable levels of brain acetoacetate uptake and utilization [22, 23]. Direct comparisons of our data and the [(11)C]-aceto-acetate PET data are challenging for several reasons. The [(11)C]-acetoacetate PET approach concomitantly measures acetoacetate brain uptake and meta-bolism, while our use of homogenates prevents us from assessing brain ketone uptake. Homogenates prepared from frozen autopsy brains present an environment distinctly different from that of the intact, living brain as homogenization eliminates the possibility of neuron-glia interaction. The [(11)C]-acetoacetate PET approach employs modeling assumptions to infer the status of ketolysis and Krebs cycle fluxes [24–26], and although our in vitro method more directly assesses these fluxes it is certainly less physiologic and the values we report are more appropriately viewed as maximum flux rates. The use of BHB versus acetoacetate as the ketone substrate also requires consideration. We additionally suspect the stage of dementia in the brain donors from our study was overall more advanced than that reported in the [(11)C]-acetoacetate PET studies, and this could have had an impact [22, 23]. This is important because as AD neurodysfunction and neurodegeneration advances, the more difficult it becomes to identify the proximal cause of an observed endpoint. The stage of disease could profoundly influence the brain’s metabolic state.
The AD brain BHB-derived CO2 production rate was 6.5%higher than the AD brain glucose-derived CO2 production rate, and the control brain BHB-derived CO2 production rate was 16%lower than the control brain glucose-derived CO2 rate. Although these suspected maximum-approximating rates appear roughly equivalent, because we did not more rigorously optimize assay conditions and assay conditions varied between the BHB and glucose measurements, we cannot conclude that in the AD or control state one substrate is superior to the other in supporting bioenergetic metabolism. As glucose metabolism is less compartmentalized than ketone metabolism, we cannot say how much of the reduction in glucose-derived AD brain CO2 production is due to reduced flux within the cytosol, versus reduced flux within the mitochondria and this also limits what we can infer from direct comparisons.
Multiple exploratory clinical trials report ketotherapeutic interventions may potentially benefit AD patients [27–34]. Our finding that AD brains perform ketolysis, and acetyl CoA produced via ketolysis enters the Krebs cycle and supports a Krebs cycle flux, provide a rationale for and argue in favor of testing such approaches. Also, while our data are consistent with what is currently overwhelming evidence of mitochondrial dysfunction in AD [20, 35], for many of the reasons discussed above the BHB consumption data we present here may exaggerate the extent of this dysfunction. Of especial concern is the fact that our homogenates mix neurons and glia, and neuron to glia ratios decline in AD [14–16]. Studies of isolated neurons could further inform this issue and testing how ketotherapeutics specifically affect neurons and glia could better clarify how these interventions change the brain.
These studies predate the testing of ketotherapeutic interventions in AD subjects. We referred to parts of this research, in particular the conceptual aspects of it, in a 1989 abstract which to our knowledge was the first time the use of ketone bodies for the treatment of AD was advocated in the biomedical literature [5]. The BHB metabolism rates reported in that abstract were ascertained 14.5–18.5 hours after assay initiation, and those data are less reliable than the 0–2 h rates included in this manuscript.
The remaining unpublished in vitro BHB meta-bolism data we generated then are now presented for the first time. An emerging interest in the use of ketotherapeutics to treat AD, in conjunction with the fact that the data we now show remain novel, justify their presentation. This full report also contributes to the AD field as the studies we here describe in detail provided early insight into the AD mitochondrial lesion and partly account for our subsequent interest in pursuing the causes and consequences of AD mitochondrial dysfunction. These data provide additional insight into why we initially proposed using ketone bodies to treat AD more than three decades ago [5], and were used to justify implementing a subsequent ketogenic diet intervention in persons with AD [28].
CONFLICT OF INTEREST
The authors have no conflict of interest to report.
ACKNOWLEDGMENTS
This study was supported by an NIH Training Grant (5T35DK07421), the NIA (AG04860), the Pope Foundation, and the Rose and Harry Rothman Geriatric Research Fund. RHS is currently supported by P30 AG035982.
REFERENCES
[1] | Ferris SH , de Leon MJ , Wolf AP , Farkas T , Christman DR , Reisberg B , Fowler JS , Macgregor R , Goldman A , George AE , Rampal S ((1980) ) Positron emission tomography in the study of aging and senile dementia. Neurobiol Aging 1: , 127–131. |
[2] | Frackowiak RS , Pozzilli C , Legg NJ , Du Boulay GH , Marshall J , Lenzi GL , Jones T ((1981) ) Regional cerebral oxygen supply and utilization in dementia. A clinical and physiological study with oxygen-15 and positron tomography. Brain 104: , 753–778. |
[3] | Foster NL , Chase TN , Fedio P , Patronas NJ , Brooks RA , Di Chiro G ((1983) ) Alzheimer’s disease: Focal cortical changes shown by positron emission tomography. Neurology 33: , 961–965. |
[4] | Swerdlow R , Marcus DL , Landman J , Kooby D , Frey W 2nd , Freedman ML ((1994) ) Brain glucose metabolism in Alzheimer’s disease. Am J Med Sci 308: , 141–144. |
[5] | Swerdlow R , Marcus DM , Landman J , Harooni M , Freedman ML ((1989) ) Brain glucose and ketone body metabolism in patients with Alzheimer’s disease. Clin Res 37: , 461A. |
[6] | McKhann G , Drachman D , Folstein M , Katzman R , Price D , Stadlan EM ((1984) ) Clinical diagnosis of Alzheimer’s disease: Report of the NINCDS-ADRDA Work Group under the auspices of Department of Health and Human Services Task Force on Alzheimer’s Disease. Neurology 34: , 939–944. |
[7] | Khachaturian ZS ((1985) ) Diagnosis of Alzheimer’s disease. Arch Neurol 42: , 1097–1105. |
[8] | Sims NR , Bowen DM , Smith CC , Flack RH , Davison AN , Snowden JS , Neary D ((1980) ) Glucose metabolism and acetylcholine synthesis in relation to neuronal activity in Alzheimer’s disease. Lancet 1: , 333–336. |
[9] | Lowry OH , Passonneau JV , Hasselberger FX , Schulz DW ((1964) ) Effect of ischemis on known substrates and cofactors of the glycolytic pathway in brain. J Biol Chem 239: , 18–30. |
[10] | McGarry JD , Foster DW ((1971) ) The regulation of ketogenesis from octanoic acid. The role of the tricarboxylic acid cycle and fatty acid synthesis. J Biol Chem 246: , 1149–1159. |
[11] | Owen OE , Morgan AP , Kemp HG , Sullivan JM , Herrera MG , Cahill GF Jr. ((1967) ) Brain metabolism during fasting. J Clin Invest 46: , 1589–1595. |
[12] | ElHajj Z , Cachot A , Müller T , Riederer IM , Riederer BM ((2016) ) Effects of postmortem delays on protein composition and oxidation. Brain Res Bull 121: , 98–104. |
[13] | Hynd MR , Lewohl JM , Scott HL , Dodd PR ((2003) ) Biochemical and molecular studies using human autopsy brain tissue. J Neurochem 85: , 543–562. |
[14] | Andrade-Moraes CH , Oliveira-Pinto AV , Castro-Fonseca E , da Silva CG , Guimarães DM , Szczupak D , Parente-Bruno DR , Carvalho LR , Polichiso L , Gomes BV , Oliveira LM , Rodriguez RD , Leite RE , Ferretti-Rebustini RE , Jacob-Filho W , Pasqualucci CA , Grinberg LT , Lent R ((2013) ) Cell number changes in Alzheimer’s disease relate to dementia, not to plaques and tangles. Brain 136: , 3738–3752. |
[15] | Leuba G , Kraftsik R ((1994) ) Visual cortex in Alzheimer’s disease: Occurrence of neuronal death and glial proliferation, and correlation with pathological hallmarks. Neurobiol Aging 15: , 29–43. |
[16] | Delacourte A ((1990) ) General and dramatic glial reaction in Alzheimer brains. Neurology 40: , 33–37. |
[17] | Koppel SJ , Swerdlow RH ((2018) ) Neuroketotherapeutics: A modern review of a century-old therapy. Neurochem Int 117: , 114–125. |
[18] | Hirai K , Aliev G , Nunomura A , Fujioka H , Russell RL , Atwood CS , Johnson AB , Kress Y , Vinters HV , Tabaton M , Shimohama S , Cash AD , Siedlak SL , Harris PL , Jones PK , Petersen RB , Perry G , Smith MA ((2001) ) Mitochondrial abnormalities in Alzheimer’s disease. J Neurosci 21: , 3017–3023. |
[19] | Gibson GE , Sheu KF , Blass JP ((1998) ) Abnormalities of mitochondrial enzymes in Alzheimer disease. J Neural Transm 105: , 855–870. |
[20] | Swerdlow RH ((2011) ) Mitochondria and cell bioenergetics: Increasingly recognized components and a possible etiologic cause of Alzheimer’s disease. Antioxid Redox Signal 16: , 1434–1455. |
[21] | Biau DJ , Jolles BM , Porcher R ((2010) ) P value and the theory of hypothesis testing: An explanation for new researchers. Clin Orthop Relat Res 468: , 885–892. |
[22] | Croteau E , Castellano CA , Fortier M , Bocti C , Fulop T , Paquet N , Cunnane SC ((2018) ) A cross-sectional comparison of brain glucose and ketone metabolism in cognitively healthy older adults, mild cognitive impairment and early Alzheimer’s disease. Exp Gerontol 107: , 18–26. |
[23] | Castellano CA , Nugent S , Paquet N , Tremblay S , Bocti C , Lacombe G , Imbeault H , Turcotte É , Fulop T , Cunnane SC ((2015) ) Lower brain 18F-fluorodeoxyglucose uptake but normal 11C-acetoacetate metabolism in mild Alzheimer’s disease dementia. J Alzheimers Dis 43: , 1343–1353. |
[24] | Bentourkia M , Tremblay S , Pifferi F , Rousseau J , Lecomte R , Cunnane S ((2009) ) PET study of 11C-acetoacetate kinetics in rat brain during dietary treatments affecting ketosis.E. Am J Physiol Endocrinol Metabol 296: , 796–801. |
[25] | Blomqvist G , Thorell JO , Ingvar M , Grill V , Widén L , Stone-Elander S ((1995) ) Use of R-beta-[1-11C]hydroxybutyrate in PET studies of regional cerebral uptake of ketone bodies in humans. Am J Physiol 269: , E948–959. |
[26] | Roy M , Nugent S , Tremblay-Mercier J , Tremblay S , Courchesne-Loyer A , Beaudoin JF , Tremblay L , Desco-teaux M , Lecomte R , Cunnane SC ((2012) ) The ketogenic diet increases brain glucose and ketone uptake in aged rats: A dual tracer PET and volumetric MRI study. Brain Res 1488: , 14–23. |
[27] | Krikorian R , Shidler MD , Dangelo K , Couch SC , Benoit SC , Clegg DJ ((2012) ) Dietary ketosis enhances memory in mild cognitive impairment. Neurobiol Aging 33: , 425 e419–427. |
[28] | Taylor MK , Sullivan DK , Mahnken JD , Burns JM , Swerdlow RH ((2018) ) Feasibility and efficacy data from a ketogenic diet intervention in Alzheimer’s disease. Alzheimers Dementia (N Y) 4: , 28–36. |
[29] | Brandt J , Buchholz A , Henry-Barron B , Vizthum D , Avramopoulos D , Cervenka MC ((2019) ) Preliminary report on the feasibility and efficacy of the modified Atkins diet for treatment of mild cognitive impairment and early Alzheimer’s Disease. J Alzheimers Dis 68: , 969–981. |
[30] | Neth BJ , Mintz A , Whitlow C , Jung Y , Solingapuram Sai K , Register TC , Kellar D , Lockhart SN , Hoscheidt S , Maldjian J , Heslegrave AJ , Blennow K , Cunnane SC , Castellano CA , Zetterberg H , Craft S ((2020) ) Modified ketogenic diet is associated with improved cerebrospinal fluid biomarker profile, cerebral perfusion, and cerebral ketone body uptake in older adults at risk for Alzheimer’s disease: A pilot study. Neurobiol Aging 86: , 54–63. |
[31] | Fortier M , Castellano CA , Croteau E , Langlois F , Bocti C , St-Pierre V , Vandenberghe C , Bernier M , Roy M , Descoteaux M , Whittingstall K , Lepage M , Turcotte EE , Fulop T , Cunnane SC ((2019) ) A ketogenic drink improves brain energy and some measures of cognition in mild cognitive impairment. Alzheimers Dement 15: , 625–634. |
[32] | Fortier M , Castellano CA , St-Pierre V , Myette-Côté É , Langlois F , Roy M , Morin MC , Bocti C , Fulop T , Godin JP , Delannoy C , Cuenoud B , Cunnane SC ((2020) ) A ketogenic drink improves cognition in mild cognitive impairment: Results of a 6-month RCT. Alzheimers Dement, doi: 10.1002/alz.12206 |
[33] | Reger MA , Henderson ST , Hale C , Cholerton B , Baker LD , Watson GS , Hyde K , Chapman D , Craft S ((2004) ) Effects of beta-hydroxybutyrate on cognition in memory-impaired adults. Neurobiol Aging 25: , 311–314. |
[34] | Henderson ST , Vogel JL , Barr LJ , Garvin F , Jones JJ , Costantini LC ((2009) ) Study of the ketogenic agent AC-1202 in mild to moderate Alzheimer’s disease: A randomized, double-blind, placebo-controlled, multicenter trial. Nutr Metab (Lond) 6: , 31. |
[35] | Swerdlow RH , Koppel S , Weidling I , Hayley C , Ji Y , Wilkins HM ((2017) ) Mitochondria, Cybrids, Aging, and Alzheimer’s Disease. Prog Mol Biol Transl Sci 146: , 259–302. |


