
Distinct Cognitive Trajectories in Late Life and Associated Predictors and Outcomes: A Systematic Review
Abstract
Background:
Cognitive aging is a dynamic process in late life with significant heterogeneity across individuals.
Objective:
To review the evidence for latent classes of cognitive trajectories and to identify the associated predictors and outcomes.
Methods:
A systematic search was performed in MEDLINE and EMBASE for articles that identified two or more cognitive trajectories in adults. The study was conducted following the PRISMA statement.
Results:
Thirty-seven studies were included, ranging from 219 to 9,704 participants, with a mean age of 60 to 93.4 years. Most studies (n = 30) identified distinct cognitive trajectories using latent class growth analysis. The trajectory profile commonly consisted of three to four classes with progressively decreasing baseline and increasing rate of decline—a ‘stable-high’ class characterized as maintenance of cognitive function at high level, a ‘minor-decline’ class or ‘stable-medium’ class that declines gradually over time, and a ‘rapid-decline’ class with the steepest downward slope. Generally, membership of better classes was predicted by younger age, being female, more years of education, better health, healthier lifestyle, higher social engagement and lack of genetic risk variants. Some factors (e.g., education) were found to be associated with cognitive function over time only within individual classes.
Conclusion:
Cognitive aging in late life is a dynamic process with significant inter-individual variability. However, it remains unclear whether similar patterns of cognitive aging are observed across all cognitive domains. Further research into unique factors which promote the maintenance of high-cognitive function is needed to help inform public policy.
INTRODUCTION
Healthy aging has been defined as the process of developing and maintaining the functional ability that enables well-being in older age [1]. It highlights the absence of age-related decline in intrinsic capacities during the aging process. Since cognitive function is one of the most important capacities which significantly influence the well-being of older adults [1], maintenance of optimal cognitive function is essential for healthy aging.
Cognitive aging refers to the dynamic and variable longitudinal changes in cognitive function that inherently occur throughout the aging process [2]. When severe, these changes can be considered as symptoms of pathological conditions. There is extensive research literature focused on the identification of risk and protective factors of severe cognitive impairment, or incident dementia [3–5]. However, most have primarily compared two groups, those with severe decline or dementia compared to all other individuals, and often only across two assessments. A lack of longitudinal repeated cognitive assessments might not sufficiently capture the likely substantial intra-individual heterogeneity and the natural process of cognitive aging over time. The group of individuals who do not experience severe cognitive impairment might also be highly heterogeneous. It is likely that a fraction of individuals might experience gradual age-related cognitive loss to varying degrees as they age [2]. Importantly, there also appears to be a group of ‘successful cognitive agers’ who maintain their cognitive function at high levels, even with advancing age [6].
Using longitudinally collected cognitive data from at least three timepoints provides opportunities to determine the ‘patterns’ or ‘trajectories’ of cognitive function, highlighting the dynamic nature of cognitive aging and reflecting its continuous change over time [7]. This approach presents the cognitive assessments longitudinally as a curve and facilitates a more detailed description of the natural evolution of cognitive aging as well as its intra-individual change. However, most of these studies did not consider the inter-individual difference. For example, some studies analyzed the average patterns of the cognitive trajectories based on a single curve, assuming that the sample was from a homogenous population [8–13]. Also, some other studies compared the trajectories between subsamples classified based on a pre-specified factor (i.e., male versus female), with a hypothesis that this factor contributes to differential trajectories [14–18]. Either design might have underestimated the population heterogeneity.
In the recent decade, some studies of cognitive trajectories have emerged that also considered population heterogeneity [19, 20]. These studies further identified latent classes of cognitive trajectories by classifying and clustering the participants with similar cognitive trajectories. This data-driven and hypothesis-free approach take both the intra-individual change and inter-individual difference into account, which more comprehensively delineates the natural process of cognitive aging. The aim of this review is to systematically summarize the research findings from the studies which identified multiple latent classes of cognitive trajectories.
MATERIALS AND METHODS
This systematic review was registered (PROSPERO; CRD42020156754) and conducted in line with PRISMA guidelines [21]. Further details regarding the methodology are described in the Supplementary Material. Briefly, any studies investigating longitudinal trajectories of cognitive function in a general adult population (18 + years) were eligible. A cognitive trajectory was defined as assessing cognitive function using three or more waves of data. A systematic search was conducted in two databases via Ovid, MEDLINE and EMBASE, from inception until 6 November 2019 (Supplementary Table 1). Three reviewers (ZW, AZZP, and TA) independently assessed studies for eligibility and extracted information from those articles deemed eligible. Discrepancies were resolved by discussion and consultation. Quality of each selected study was assessed using a modified version of the Newcastle-Ottawa Scale (NOS) for cohort studies [22]. A higher number of stars indicates higher quality and lower risk of bias. Due to high heterogeneity across studies, a meta-analysis was not undertaken. A narrative synthesis of the main findings is presented.
RESULTS
Study characteristics
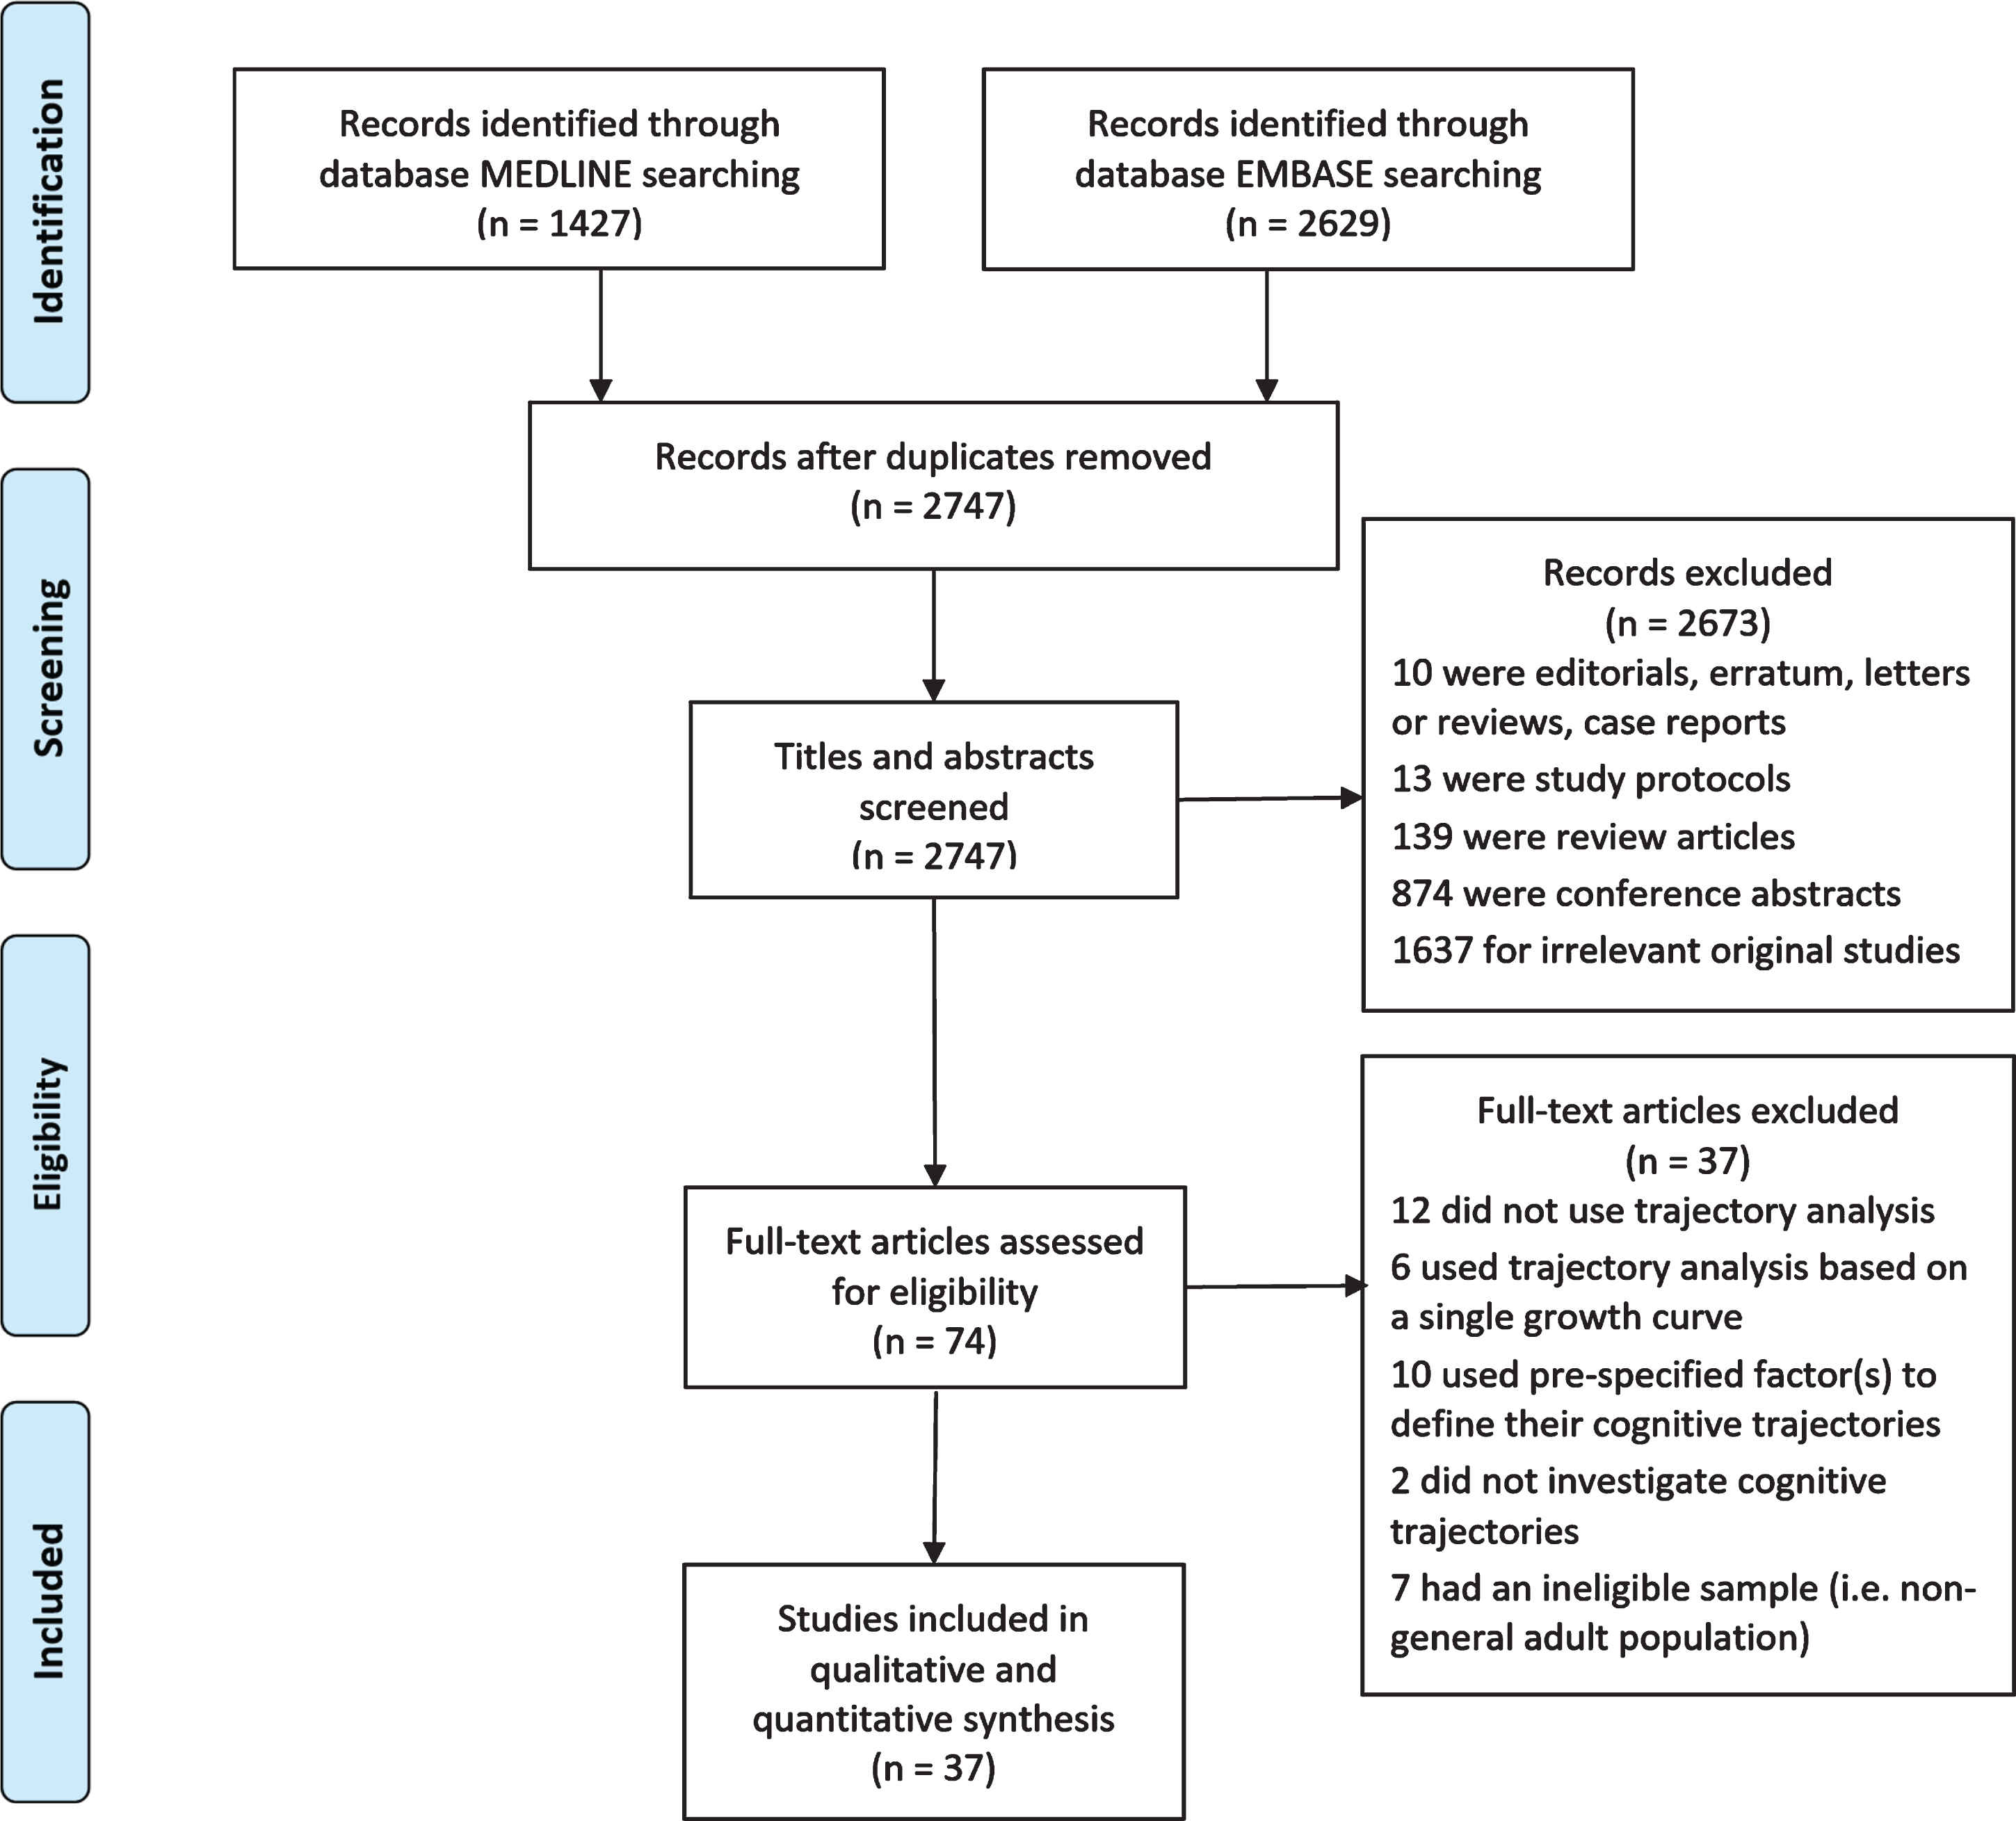
From an initial 2,747 records identified, 37 studies published between 2005 and 2019 were included in the final review (Fig. 1 and Supplementary Table 2). All studies were longitudinal, 92% community-based and most included generally healthy participants. Sixty percent of studies were conducted in North America, 24% in Europe, and 16% in Asia. The sample size of studies ranged from 219 to 9704. The majority of participants were older adults (mean age from 60.0 to 93.4 years). All but three studies included males and females, and there were varying ethnicities.
Fig. 1
PRISMA flow diagram of study selection.
The studies could be grouped into four categories on the basis of how cognitive trajectories and the latent classes were identified. There were 22 studies which determined the latent classes of cognitive trajectories based on the longitudinal patterns of cognitive function and analyzed the associated factors (Table 1). Six studies investigated cognitive function jointly with another variable including death, dementia, grip strength, physical function and frailty (Table 2). Seven studies classified the participants solely based on the slope parameter of cognitive change over time (Table 3). The fourth category included two studies that pre-specified latent classes of cognitive trajectories to discriminate those who were diagnosed with dementia during follow-up from those who were not (Table 4). Findings of the predictors and outcomes which were associated with the membership of trajectory classes were summarized in Supplementary Table 3.
Table 1
Characteristics of cognitive trajectories
| Authors | Country (name of study) | Inclusion criteria | Sample size, mean age (SD), gender, ethnicity | Cognitive assessment | Follow-up | Trajectory analysis | Trajectory classes (% of sample) | ||
| Terrera et al. [26] | UK (CC75C) | Aged 75+; cognitive data available at baseline; no intermittent cognitive data | 2,053 80.9 (4.6) y Female (65%) Ethnicity n.s. | MMSE | 4 waves, 9 y | Growth mixture models | 3 classes 1. Good performers with smooth decline (41%) 2. Moderate cognitively impaired with constant sharp decline (5%) 3. Cognitively impaired with sharp and changing decline (54%) | ||
| Howrey et al. [40] | US (H-EPESE) | Aged 65+; Mexican American; complete data of included baseline variables | 2,767 73.2 (6.5) y Female (58%) Mexican American | MMSE | 7 waves, 18 y | Group-based trajectory models | 3 classes 1. Stable (30%) 2. Slow decline (50%) 3. Rapid decline (20%) | ||
| Downer et al. [42] | US (H-EPESE) | Aged 75+; Mexican American; cognitive data available at 2 + waves; completed baseline visit without a proxy | 1,328 80.9 (4.4) y Female (63%) Mexican American | MMSE | 4 waves, 9 y | Latent class growth analysis (model n.s.) | 3 classes 1. Persistent high (31%) 2. Decline but high (53%) 3. Decline to low (16%) | ||
| Yu et al. [52] | US (ROS+MAP) | No dementia at baseline; autopsy data available (decedents); cognitive data available at 2 + waves | 876 80.3 (6.9) y Female (66%) White, Others | Composite score (general) | 19 waves, 18 y | Random-effects mixture models | 4 classes 1. Non-decliners (44%) 2. Moderate decliners (35%) 3. Severe decliners (13%) 4. Decline with large fluctuation (8%) | ||
| Chen et al. [58] | Taiwan (TLSA) | Aged 65+; no stroke; cognitive data available at 1993 (first wave of cognitive assessment) and any subsequent waves (2 + waves) | 2,300 71.0 (5.0) y Female (45%) Chinese | SPMSQ | 5 waves, 14 y | Group-based trajectory models | 3 classes 1. High-stable (17%) 2. Starting high and declining (52%) 3. Starting low and declining (31%) | ||
| Min et al. [36] | South Korea (KLoSA) | Aged 60+; MMSE≥24; cognitive data available at 3 + waves | 2,445 67.5 (5.6) y Female (46%) Korean | MMSE | 4 waves, 6 y | Growth mixture models | 2 classes 1. Stable (93%) 2. Sharp cognitive decline (7%) | ||
| Lee et al. [39] | South Korea (KLoSA) | Aged 55–84; MMSE≥20; attended all 5 waves; no missing data in included variables | 3,729 55–84 y Female (54%) Korean | MMSE | 5 waves, 8 y | Growth mixture models | 4 classes 1. High-Maintaining (20%) 2. Moderate-Stable (44%) 3. Low-Decreasing (23%) 4. Moderate declined to severe impairment (13%) | ||
| Park et al. [30] | US (HRS + AHEAD + CODA + WB) | Aged 65+; attended 3 + waves of visits; no missing data in childhood variables | 7,374 73.4 (6.4) y Female (59%) White, Others | Composite score (general) | 7 waves, 12 y | Growth mixture models | 5 classes 1. Stable High (15%) 2. High-to-Moderate (20%) 3. Stable Moderate (53%) 4. Moderate-to-Low (8%) 5. Stable Low (4%) | ||
| Espeland et al. [31] | US (WHIMS) | Postmenopausal women aged 65–79; in the HRT trial of WHI; cognitive data available at 2 + waves | 2,561 80.8 (3.5) y Female (100%) White, Others | 3MS TICS-m | 11 waves, 10 y | Group-based trajectory models | 5 classes 1. Consistently high (20%) 2. Relative improvement (25%) 3. Decline to median (19%) 4. Decline to low (18%) 5. Consistently low (18%) | ||
| Elovainio et al. [75] | UK (Whitehall II Study) | Aged 35–55; London-based civil servants; attended baseline, wave 2 follow-up and any subsequent waves (3 + waves) | 6,072 41–61 y Female (29%) White, Others | Composite score (general) | 5 waves, 21 y | Group-based trajectory models | 3 classes 1. High (31%) 2. Medium (49%) 3. Low (20%) | ||
| McFall et al. [49] | Canada (VLS) | Aged 53–85; MMSE≥24; no brain-related injuries or conditions; no stroke or depression; cognitive data available at 1 + wave | 882 71.6 (8.9) y Female (66%) Ethnicity n.s. | Composite score (EM) | 3 waves, 9 y | Growth mixture models | 3 classes (EM) 1. Stable memory aging (31%) 2. Normal memory aging (47%) 3. Declining memory aging (22%) | ||
| Hayden et al. [20] | US (ROS) | Catholic nuns, priests and brothers; no dementia at recruitment; autopsy data available (decedents) | 1,049 75.0 (7.0) y Female (69%) White, Others | Composite score (general) | 16 waves, 15 y | Random-effects mixture models | 3 classes 1. Slow decline (65%) 2. Moderate decline (27%) 3. Rapid decline (8%) | ||
| Ding et al. [45] | US (ADNI) and Canada | Aged 55–90; White; Hachinski Ischemic Score≤4; GDS < 6; good general health; cognitive data available at 2 + waves | 219 75.9 (5.1) y Female (47%) White | RAVLT (EM) | 11 waves, 9 y | Group-based trajectory models | 6 classes 1. Norm 12.9-Stable (10%) 2. Norm 9.4-Curvilinear decline (14%) 3. Norm 9.1-Curvilinear decline (14%) 4. Norm 6.9-Stable (20%) 5. Norm 6.2-Linear decline (27%) 6. Norm 3.3-Linear decline (15%) | ||
| Tampubolon et al. [53] | UK (ELSA) | Aged 50+; complete information at the last wave of visit | 5,912 71.7 (7.1) y Female (56%) White, Others | TICS | 6 waves, 11 y | Latent class growth analysis (model n.s.) | 4 classes† 1: High-Decline (advantaged) (22%) 2. Medium (higher)-Decline (28%) 3. Medium (lower)-Decline (27%) 4. Low-Decline (disadvantaged) (24%) | ||
| Han et al. [25] | US (PEP Study) | Aged 70+; no assistance in ADLs; no significant cognitive impairment; no terminal illness | 754 78.4 (5.3) y Female (65%) White, Others | MMSE | 7 waves, 9 y | Group-based trajectory models | 5 classes 1. No decline (32%) 2. Minimal decline (44%) 3. Moderate decline (15%) 4. Progressive decline (7%) 5. Rapid decline (3%) | ||
| Zahodne et al. [50] | US (WHICAP) | Aged 65+; no dementia at recruitment; attended baseline visit | 2,593 76.0 (n.s.) y Female (69%) White, African American, Hispanic | Composite score (EM) | 5 waves, 8 y | Growth mixture models | 4 classes 1. Stable-High (44%) 2. Stable-Low (17%) 3. Decline (27%) 4. Rapid decline (12%) | ||
| Zahodne et al. [43] | US (WHICAP) | Aged 65+; no dementia at recruitment; attended baseline visit | 2,593 76.0 (n.s.) y Female (69%) White, African American, Hispanic | Composite score (EM) | 5 waves, 8 y | Growth mixture models | 4 classes 1. Stable-High (44%) 2. Stable-Low (17%) 3. Decline (27%) 4. Rapid decline (12%) | ||
| Kim et al. [32] | South Korea (KLoSA) | Aged 60+; complete data at wave 1–3 | 5,812 60.0 (9.8) y Female (55%) Korean | MMSE | 3 waves, 4 y | Growth mixture models | 4 classes 1. Consistently high (77%) 2. Decreased (15%) 3. Increased (4%) 4. Consistently low (4%) | ||
| Teipel et al. [34] | France (INSIGHT-PreAD Study) | Aged 70–85; subjective memory complaint; unimpaired cognition; visual and auditory acuity adequate for neuropsychological testing; had a baseline PET amyloid imaging; MMSE and MBT assessed at all 5 waves | 265 76.3 (3.4) y Female (62%) White | MMSE MBT-Binding List1/2 | 5 waves, 2 y | Group-based trajectory models | 3 classes (MMSE)† 1. High-Stable (33%) 2. Medium-Stable (65%) 4 classes (MBT-List1/2)† 1. High-Stable (44%) 2. Medium (higher)-Stable (36%) 3. Medium (lower)-Stable (17%) 4. Low-Decrease (3%) | 4 classes (MBT-Binding)† 1. High-Stable (18%) 2. Medium (higher)-Stable (40%) 3. Low-Decline (2%) 3. Medium (lower)-Stable (36%) 4. Low-Stable (6%) | |
| Lin et al. [51] | US and Canada (ADNI) | Aged 55–90; without cognitive impairment (MMSE 24–30) and major psychiatric disorder; Clinical Dementia Rating global score = 0 | 354 74.5 (6.5) y Female (54%) White, Others | 2 composite scores (EM, EF) | 5 waves, 4 y | Growth mixture models | 3 classes (EM)† 1. High-Stable (41%) 2. High-Major decline (21%) 3. Medium-Stable (38%) | 3 classes (EF)† 1. High-Increase (41%) 2. High-Major decline (21%) 3. Low-Minor decline (38%) | |
| Graziane et al. [23] | US (MYHAT) | Aged 65+; not residents of long-term care institutions; age-education-corrected MMSE≥21; no severe impairment in vision or hearing; decisionally capacitated; attended all 6 waves of visit | 1,978 77.7 (7.4) y Female (61%) White, Others | 5 composite scores (5 domains) | 6 waves, 5 y | Group-based trajectory models | 6 classes† Attention 1. Highest-Stable (3%) 2. High-Stable (17%) 3. Medium (higher)-Stable (28%) 4. Medium (lower)-Minor decline (32%) 5. Low-Minor decline (15%) 6. Lowest-Major decline (4%) * 1. Highest-Stable (6%) 2. High-Stable (26%) EF 3. Medium -Stable (37%) 4. Medium -Minor decline (21%) 5. Low-Major decline (7%)* 6. Lowest-Stable (2%)* Language 1. Highest-Stable (20%) 2. High-Stable (33%) 3. Medium -Stable (27%) 4. Medium -Minor decline (12%) 5. Low-Major decline (7%)* 6. Lowest-Major decline (2%)* | 6 classes† Memory 1. Highest-Minor increase (10%) 2. High-Minor increase (23%) 3. Medium (higher)-Minor increase (26%) 4. Medium (lower)-Stable (21%) 5. Low-Major decline (13%)* 6. Lowest-Major decline (7%)* Visuospatial skill 1. Highest-Stable (2%) 2. High-Minor decline (7%) 3. Medium (higher)-Stable (19%) 4. Medium (lower)-Stable (37%) 5. Low-Stable (24%) 6. Lowest-Stable (11%)* | |
| Sha et al. [33] | China (CHARLS) | Aged 60+; attended all 4 waves; no missing data in included variables | 3,584 66.6 (5.5) y Female (47%) Chinese | TICS EM score | 4 waves, 4 y | Growth mixture models | 3 classes (EF)† Male/Female 1. High-Decline (50% /30%) 2. Medium-Stable (34% /40%) 3. Low-Increase (16% /30%) | 4 classes (EM)† Male 1. High-Decline (40%) 2. Medium (higher)-Increase (11%) 3. Medium (lower)-Decline (18%) 4. Low-Decline (31%) | 4 Classes (EM)† Female 1. High-Decline (8%) 2. Medium (higher)-Decline (24%) 3. Medium (lower)-Decline (56%) 4. Low-Decline (12%) |
n.s., not stated; MMSE, Mini-Mental State Examination; SPMSQ, The Short Portable Mental Status Questionnaire; TICS, Telephone Interview for Cognitive Status; MBT, memory binding test; 3MS/mMMSE, Modified Mini-Mental State Examination; RAVLT, Search Results Web results Rey Auditory Verbal Learning Test; EM, episodic memory; EF, executive function; PET, positron emission tomography; HRT, hormone replacement therapy; WHI, Women’s Health Initiative; ADL, activity of daily living; GDS, Geriatric Depression Scale *designated as persistently low group with a composite z-score of -1 or lower during the majority of the follow-up period. 1) The label of each trajectory class was transcribed verbatim from the articles. Where the labels were not stated in the article†, they were described based on baseline and rate of change in this Table. 2) The order of each trajectory class was from the most advantaged to the most disadvantaged.
Table 2
Characteristics of joint cognitive trajectories
| Authors | Country (name of study) | Inclusion criteria | Sample size, mean age (SD), gender, ethnicity | Cognitive assessment; Joint variable | Follow-up | Trajectory analysis | Cognitive trajectory classes (% of sample) | Joint trajectory classes (% of sample) |
| Marioni et al. [44] | France (PAQUID) | Aged 65+; no missing data in cognition or covariates | 3,653 75.3 (6.8) y Female (58%) Ethnicity n.s. | MMSE Death records | 10 waves, 20 y | Joint latent class mixed models | 4 classes 1. High baseline cognition (51%) 2. Low baseline cognition (34%) 3. Slow decliners (11%) 4. Immediate decliners (4%) | 4 classes (death)† 1. Low incident rate (51%) 2. Medium (lower) incident rate (34%) 3. Medium (higher) incident rate (11%) 4. High incident rate (4%) |
| Marioni et al. [54] | France (PAQUID) | Aged 65+; no missing data for cognition or covariates | 2,854 77.0 (6.8) y Female (59%) Ethnicity n.s. | Composite score (general) Dementia (DSM-III-R) | 10 waves, 20 y | Joint latent class mixed models | 3 classes 1. Non-decliners (70%) 2. Moderate decliners (21%) 3. Fast decliners (9%) | 3 classes (dementia)‡ 1. Low incident rate (70%) 2. Medium incident rate (21%) 3. High incident rate (9%) |
| Robitaille et al. [41] | Sweden (OCTO-Twin) | Aged 80+; dizygotic or monozygotic twin pairs; no missing data in covariates | 702 82.9 (3.3) y Female (68%) Ethnicity n.s. | MMSE Martin vigorimeter | 5 waves, 8 y | Joint growth mixture models | 3 classes 1. High functioning (40%) 2. Moderate functioning (31%) 3. Low functioning (29%) | 3 classes (grip strength) 1. High functioning (40%) 2. Moderate functioning (31%) 3. Low functioning (29%) |
| Hu et al. [37] | China (CLHLS) | Aged 80–105; cognitive data available at all 7 waves | 6,842 93.4 (7.3) y Female (60%) Chinese | MMSE Death records | 7 waves, 16 y | Group-based trajectory models | 4 classes 1. Slow decline (53%) 2. Moderate decline (31%) 3. Progressive decline (13%) 4. Rapid decline (3%) | 4 classes (death)† 1. Slow increase (53%) 2. Moderate increase (31%) 3. Progressive increase (13%) 4. Rapid increase (3%) |
| Liu et al. [57] | US (PEP Study) | Aged 70+; preserved ADLs; no significant cognitive impairment; no terminal illness; cognitive data available at 2 + waves | 690 82.0 (11.9) y Female (65%) White, Others | MMSE Composite frailty score | 7 waves, 9 y | Group-based multi-trajectory models | 4 classes 1. No cognitive frailty (28%) 2. Slow cognitive decline (46%) 3. Rapid cognitive decline (20%) 4. Cognitive frailty (7%) | 4 classes (frailty) 1. No cognitive frailty (28%) 2. Progressive frailty (46%) 3. Progressive frailty (20%) 4. Cognitive frailty (7%) |
| Hochstetler et al. [69] | US and Canada (ADNI) | Aged 55–90; MMSE 24–30 (EMCI and LMCI) or 20–26 (AD); preserved ADLs; amyloid data available at 1 + wave; ADAS-Cog13 and FAQ data available at baseline and any subsequent waves (2 + waves) | 1,192 73.4 (7.4) y Female (57%) White, Others | ADAS-Cog13 FAQ | 4 waves, 2 y | Joint growth mixture models | 3 classes 1. Lowest baseline-Minimal change (69%) 2. Intermediate baseline-Slow worsening (18%) 3. Highest baseline-Steepest worsening (13%) | 3 classes (physical function) 1. Lowest baseline-Minimal change (69%) 2. Intermediate baseline-Slow worsening (18%) 3. Highest baseline-Steepest worsening (13%) |
n.s., not stated; MMSE, Mini-Mental State Examination; DSM, Diagnostic and Statistical Manual of Mental Disorders; ADAS-Cog13, Alzheimer’s Disease Assessment Scale–Cognitive Subscale 13-item version; FAQ, Functional Activities Questionnaire; EMCI, early mild cognitive impairment; LMCI, late mild cognitive impairment; AD, Alzheimer’s disease; ADL, activity of daily living. 1) The label of each trajectory class was transcribed verbatim from the articles. Where the labels were not stated in the article†, they were described based on baseline and rate of change in this table. 2) The order of each trajectory class was from the most advantaged to the most disadvantaged.
Table 3
Slope-based cognitive trajectories
| Authors | Country (name of study) | Inclusion criteria | Sample size, mean age (SD), gender, ethnicity | Cognitive assessment | Follow-up | Trajectory analysis | Trajectory classes (% of sample) |
| Barnes et al. [27] | US (SOF) | Aged 65+; white; physically mobile; without a bilateral hip replacement or prior hip fracture | 9,704 71.7 (5.3) y Female (100%) White | 3MS | 5 waves, 15 y | Random-effects models | 3 classes 1. Cognitive maintainers (slope ≥0, 9%) 2. Minor decliners (slope < 0 but > lowest tertile, 58%) 3. Major decliners (slope ≤ lowest tertile, 33%) |
| Yaffe et al. [55] | US (SOF) | Aged 65+; white; physically mobile; survived until age 80; without a bilateral hip replacement or prior hip fracture; 3MS and TMTB available at baseline and any subsequent waves (2 + waves) | 7,477 (3MS) 6503 (TMTB) 71.0 (n.s.) y Female (100%) White | 3MS TMTB | 6 waves, 20 y (3MS) 5 waves, 16 y (TMTB) | Mixed-effects models | 3 classes (3MS) 1. Best performers (slope = quintile 5, 22%) 2. Middle performers (slope = quintile 2–4, 58%) 3. Worst performers (slope = quintile 1, 20%) 3 classes (TMTB) 1. Best performers (slope = quintile 5, 22%) 2. Middle performers (slope = quintile 2–4, 59%) 3. Worst performers (slope = quintile 1, 19%) |
| Yaffe et al. [28] | US (Health ABC Study) | Aged 70–79; preserved ADLs; able to walk 0.25 mile or climb 10 steps without resting; no life-threatening cancer; baseline 3MS≥80; cognitive data available at baseline and any subsequent waves (2 + waves) | 2,509 70–79 y Female (53%) White, Black | 3MS | 4 waves, 7 y | Random-effects models | 3 classes 1. Cognitive maintainers (slope≥0, 30%) 2. Minor decliners (slope < 0 but > 1 SD below mean, 53%) 3. Major decliners (slope ≤1 SD below mean, 16%) |
| Yaffe et al. [56] | US (Health ABC Study) | Aged 70–79; preserved ADLs; able to walk 0.25 mile or climb 10 steps without resting; no life-threatening cancer; cognitive data available at baseline and any subsequent waves (2 + waves) | 2,733 74.0 (n.s.) y Female (52%) White, Black | 3MS | 3 waves, 4 y | Mixed-effects models | 3 classes 1. Cognitive maintainers (slope ≥0, 36%) 2. Minor decliners (slope < 0 but ≥1 SD below mean, 48%) 3. Major decliners (slope < 1 SD below mean, 16%) |
| Rosano et al. [35] | US (Health ABC Study) | Aged 70–79; preserved ADLs; able to walk 0.25 mile or climb 10 steps without resting; no life-threatening cancer; cognitive data available at baseline and any subsequent waves (2 + waves) | 258 82.9 (n.s.) y Female (56%) White, Black | 3MS | 5 waves, 10 y | Mixed-effects models | 2 classes 1. Cognitive maintainers (slope ≥0, 59%) 2. Cognitive decliners (slope < 0, 41%) |
| Casaletto et al. [38] | US (Healthy Aging Study) | Aged 65–100; no neurological condition; no functional decline; no phenotypes of both declining processing speed and memory; attended 2 + waves of visits | n = 314 69.3 (7.5) y Female (55%) Ethnicity n.s. | Composite score (processing speed) CVLT-II (EM) | 13 waves, 16.5 y | Mixed-effects models | 2 classes Processing speed 1. Stable (slope ≥1 SD below mean, 84%) 2. Decliners (slope < 1 SD below mean, 16%) EM 1. Stable (slope ≥1 SD below mean, 84%) 2. Decliners (slope < 1 SD below mean, 16%) |
| Yokoyama et al. [29] | Exploration: US (SOF+MrOS) | Exploration SOF: aged 70–79; preserved ADLs; able to walk 0.25 mile or climb 10 steps without resting; no life-threatening cancer | n = 7,328 for exploration n = 122 for replication 65 + y Female (48%) White | Composite score (general) | 4 waves, 10 y (SOF) 3 waves, 6 y (MrOS) | Mixed-effects models | 2 classes SOF (n = 3508, Female) 1. Cognitive maintainers (slope ≥0, 22%) 2. Cognitive decliners (slope < 0, 78%) MrOS (n = 3820, Male) 1. Cognitive maintainers (slope ≥0, 6%) 2. Cognitive decliners (slope < 0, 94%) |
| Replication: US (Healthy Aging Study) | MrOS: aged 65+; no assistance in walk; no bilateral hip replacements; no life-threatening condition SOF + MrOS: genetic data available; cognitive data available at 2 + waves | ||||||
| Replication | |||||||
| Healthy aging study: white; cognitively normal; had MRI scan; genetic data available |
n.s., not stated; 3MS/mMMSE, Modified Mini-Mental State Examination; TMTB, Trails Making Test Part B; CLVT, California Verbal Learning Test; ADL, activity of daily living; EM, episodic memory; MRI, magnetic resonance imaging. 1) The label of each trajectory class was transcribed verbatim from the articles. Where the labels were not stated in the article†, they were described based on baseline and rate of change in this table. 2) The order of each trajectory class was from the most advantaged to the most disadvantaged.
Table 4
Cognitive trajectories and incident dementia
| Authors | Country (name of study) | Inclusion criteria | Sample size, mean age (SD), gender, ethnicity | Cognitive assessment | Follow-up | Statistical analysis | Trajectory analysis |
| Proust et al. [24] | France (PAQUID) | Aged 65+; no dementia till the 5th follow-up; attended the 8th wave of visit (last wave) | n = 1392 65 + y Female (n.s.) Ethnicity n.s. | MMSE | 4 wave, 6 y | Random-effects mixture models | 2 classes 1. Linear slight decline (98%) 2. Non-linear accelerating decline (2%) |
| Small et al. [19] | Sweden (The Kungsholmen Project) | Aged 75+; no missing data in included variables | n = 528 79.7 (n.s.) y Female (77%) Ethnicity n.s. | MMSE | 4 waves, 7 y | Growth mixture models | 2 classes† 1. High-Minor decline (79%) 2. Low-Major decline (21%) |
n.s., not stated; MMSE, Mini-Mental State Examination. 1) The label of each trajectory class was transcribed verbatim from the articles. Where the labels were not stated in the article†, they were described based on baseline and rate of change in this table. 2) The order of each trajectory class was from the most advantaged to the most disadvantaged.
Cognitive assessment
The majority of studies assessed global cognitive function (n = 30), using most commonly the Mini-Mental State Examination (MMSE) (n = 14) and others using modified MMSE, Telephone Interview for Cognitive Status (TICS), Short Portable Mental Status Questionnaire, Alzheimer’s Disease Assessment Scale–Cognitive Subscale (ADAS-Cog) and composite scores. There were nine studies which focused on episodic memory, three on executive function, one on processing speed and another on multiple domains (attention, language, visuospatial skills).
The number of waves of cognitive assessment ranged from three to 19, with a median of five waves and the length of follow-up ranged from two to 21 years (median nine years). Most studies (n = 22) required participants to have data from a minimum of two waves to be included in their analysis, but eight studies set this as three or more waves. Three studies had no inclusion criteria on the minimum number of waves of cognitive assessment.
Number and shape of trajectories
The number of classes of cognitive trajectories identified ranged from two to six, with 17 studies finding three and 11 studies identifying four classes. The proportion of individuals who fell into the different classes varied widely across the studies. The trajectory profiles identified in most studies (n = 20) followed a typical pattern with the trajectories that started at a higher baseline generally having a lower degree of decline, while those that started lower had a faster rate of decline. Therefore, the slopes became progressively steeper as the intercept dropped, and the trajectories of different classes did not intersect. Studies following this pattern all reported a group of ‘successful cognitive agers’, with the proportion ranging from 2% [23] to 98% [24], whose trajectories were characterized as the most superior class—the highest intercept and flattest or even upward slope. All of these studies also identified a group of ‘rapid decliners’ with the lowest intercept and steepest slope, and the proportion ranged from 3% [25] to 54% [26]. Except for the studies with only two classes, all studies also identified one or more groups of ‘minor decliners’ or ‘stable-medium’ with moderate intercept and a slope that was in-between the two aforementioned trajectory patterns. This pattern was also observed in three of seven slope-based studies [27–29].
A number of studies, however, detected some ‘non-typical’ patterns. For example, four studies [23, 30–32] reported a ‘stable low’ class with low baseline/intercept and a relatively flat slope suggestive of no further decline or change (% of individuals falling in this class ranged from 4% –18%). Ten studies identified one to two trajectory classes whose intercept was not the lowest but still had the steepest slope, with some of them intersecting with other trajectories (proportion: 4% –30%). Similarly, one of these studies observed a decline in the class which started highest, while there was an increase in the class starting lowest [33]. Another study found that all classes, except for the worst class, improved in performance over time [34]. Finally, one slope-based study observed similar cognitive function between classes at baseline, but they diverged over follow-up [35].
Predictors and outcomes associated with trajectories
Predictors of class membership
Of the 37 studies included in this review, 26 studies investigated factors that were associated with the membership of a trajectory class. Nine of these studies used the best class as the reference group and determined which factors were associated with membership in worse classes, while six studies used an intermediate class as the reference group, and five studies used the worst class. The reference group differed by cognitive domain in one study and by the class of interest in another. Four studies compared the factors univariately between the classes. Overall, a total of 60 factors were identified that were associated with class membership, including 32 protective factors that predicted higher odds of being in a better class or lower odds of being in a worse class compared to the reference class. There were also 24 risk factors that were identified. A further four factors showed inconsistent results, being either a protective or risk factor depending on the study (described further below).
Most of the identified factors (n = 44) were either positively (protective factors) or inversely (risk factors) predictive of the best class but were often associated with one or more intermediate classes also when the best class was not chosen as the reference group. The most commonly reported protective factors were higher education (n = 14), social engagement (n = 8), physical activity (n = 5), physical function (n = 4), cognitive activity (n = 3), volunteering activity (n = 3) and higher BMI (n = 3). On the other hand, risk factors that were often examined and found to be associated with class membership were depressive symptoms (n = 6), APOE ɛ4 allele (n = 6), physical limitation (n = 5), diabetes (n = 4), higher amyloid burden (n = 4), and smoking (n = 3).
There were four factors that showed inconsistent results across studies. Among the 16 studies that analyzed age in relation to class membership, older age predicted worse trajectory classes in 10 studies. Being female was predictive of better classes in eight studies, but another two studies found opposite results [36, 37]. Furthermore, in terms of discordant findings, although most studies showed higher baseline cognitive function in better classes, one study observed that better baseline episodic memory inversely predicted declining memory [38]. One study also found that the best class was predicted by better self-rated health in males [39], in contrast to another study in males and females [30].
Class-specific predictors
Four studies (all with three classes), examined factors associated with baseline cognitive performance, rate of change, or the average cognitive score over time within individual classes. In two studies consistent effects were seen across all classes, with older age, physical limitation and dementia being detrimental, and being married and church attendance beneficial [26, 40].
In contrast, some factors did not affect cognitive trajectory to the same extent across all classes. For example, higher education was found to be beneficial only in the best class in one study [26] and the worst class in another study [41]. Howrey et al. observed that depression was detrimental in the best two classes, and social support was beneficial only in the worst class [40]. Further, Parkinson’s disease was associated with lower general cognitive function in the best class, and stroke negatively impacted non-memory cognition only in the worst class [42].
Outcomes associated with trajectories
Ten studies investigated the association between trajectory class membership and outcomes. Being in a worse class compared to the reference class was associated with higher risk of mortality, physical limitations or disability, dementia, cognitive impairment, hospitalization, nursing home admission, and depression. In addition, membership of worse trajectory classes predicted an increase in amyloid burden and tangle density, as well as a higher rate of hippocampal atrophy and lower hippocampal volume and entorhinal cortical thickness.
Two studies analyzed the interaction between a number of factors and trajectory class in predicting health outcomes. Zahodne et al. observed that predictors of the risk of dementia differed across the four classes identified [43]. Similarly, Marioni et al. found that being female and higher social engagement decreased the risk of mortality in all classes, but higher education counterintuitively increased the risk of mortality in the best class [44].
Quality assessment
Thirteen studies were assessed as high quality and 23 as moderate quality, mostly because attrition rates were very high (>20%) or could not be properly assessed (Supplementary Table 4).
DISCUSSION
This is the first systematic review to identify the patterns of cognitive trajectories in older adults, and to summarize the factors which are associated with membership of different trajectories, as well as the associated outcomes. The findings of 37 studies suggest that cognitive aging in late life is a dynamic process with significant inter-individual variability. The number of trajectory class identified varied widely across studies but was not specifically linked to the size or heterogeneity of the sample. Most studies identified a relatively stable and high functioning class, and contrasted this was one or more classes that declined to varying extents with lower initial functioning. Factors which were predictive of being in the best trajectory class were largely consistent with existing literature in being the absence of known risk factors for cognitive decline. However, associations were not consistent across all studies and varied depending on the reference group and factors considered. The ten studies which investigated outcomes based on class membership found that being in a worse trajectory class was associated with poorer outcomes.
The results of this systematic review indicate that there is no a specific number of cognitive trajectories which is found consistently across different studies and populations. However, the majority of studies using latent class growth analysis (LCGA) identified three to four classes, suggesting that the underlying heterogeneity of cognitive aging in community-dwelling individuals might follow such a typical profile. The reason why some studies identified fewer or more classes than this is unclear [23, 25, 30, 36, 45]. In particular, there was no specific correlation between a larger sample or a wider age-range and/or recruitment of a more diverse sample, and an increasing number of trajectories. It is worth noting, however, that the optimal number of classes in LCGA is not determined based on a single objective criterion but is derived from the trade-off between subjective judgement and objective standards [46, 47]. Therefore, the research aim, statistical methodology, and criteria used for model selection might have contributed to such variance. For example, two studies pre-determined to classify the participants into two classes before selecting the best model based on fit indices, in order to predict the risk of dementia versus no dementia [19, 24]. Also, statistical methods of analysis can influence the permitted variability within classes. In group-based trajectory modelling, the within-class intercept and slope variances are set to zero, implying larger within-class homogeneity and possibly resulting in more trajectory classes in comparison to growth mixture modelling which includes random effects in the model of each trajectory class with higher within-class variability [7, 46]. Further, since a number of indices in terms of model fit (information criteria), classification accuracy (entropy), and comparison of competing models (likelihood ratio test, Bayes factor) can be used for determining the number of classes, the mixed statistical criteria used for model selection in the included studies might have partially caused such variance. The general rule of thumb is to incorporate multiple indices and also consider the research question and clinical plausibility, in order to select the best-fitting, yet the most parsimonious and representative model [7, 47, 48]. The seven slope-based studies classified the participants into either two or three classes based on the change in cognitive function, and thus the number of classes was not data-driven and might not adequately capture the population heterogeneity.
Despite the heterogeneity across studies, almost all studies identified a ‘stable-high’ class in which the individuals appeared to maintain their cognitive function at a relatively high level even with advancing age. It is reasonable to view this subgroup as the ‘successful cognitive agers’ as their longitudinal patterns conform to the definition of healthy aging [1]. The strongest evidence for this ‘stable-high’ class was for a measure of general cognitive function, but this was also because most studies focused on this cognitive assessment. However, the ‘stable-high’ class was also observed in terms of some other cognitive domains such as memory, processing speed, and executive function [23, 34, 43, 45, 49–51]. Of note, these are cognitive domains that are thought to decline more rapidly than others during the ‘normal’ aging process [2]. This suggests that some individuals may be resilient to brain aging. Another class which was commonly identified was the ‘minor-decline’ or ‘stable-medium’ class. In contrast to the stable-high class described above, these individuals may fit a more ‘typical’ profile based on prior knowledge about changes in cognitive function with aging [2], and these individuals may be experiencing ‘normal cognitive aging’. This is traditionally viewed as slight and gradual cognitive decline over time due to age-related neurodegeneration which leads to a compromise in daily activities without impaired function [2, 52]. As expected, these two classes (minor-decline and stable-medium) therefore accounted for the majority of the participants in most studies. The other classes identified across a number of studies include the rapid-decliners, which could be viewed as individuals with ‘pathological cognitive aging’, and possibly even reaching criteria for mild cognitive impairment or dementia [19, 20, 24, 25, 32, 50, 51, 53–56]. In four studies, an atypical ‘stable-low’ class was identified which also had a higher prevalence of risk factors for cognitive decline and poorer health outcomes compared to other classes [30–32, 51]. It remains unclear if the stability of cognitive function in this class resulted from floor effects in terms of the cognitive tests or large intra-individual variability of the slope [51]. Inclusion of individuals with low cognitive function at baseline indicates that individuals were not sufficiently screened at study entry and may have also had symptoms of severe impairment or dementia. It is worth mentioning that the ‘rapid-decline’ and ‘stable-low’ class was found to be predicted and prospectively associated with physical limitation/disability, suggesting that decline in cognitive and physical function is most likely to occur concurrently [25, 30, 40, 42, 51, 57, 58]. Together, these findings outline several main phenotypes of cognitive aging in the general population and highlight the importance of studying cognitive function as trajectories which takes both the baseline and longitudinal changes into account.
It is also important to note that the proportion of individuals falling into each of these classes varied substantially across studies. This is likely to reflect different characteristics of the study sample, as well as the different cognitive domains assessed. The assessment tools used to measure cognitive performance varied across studies, making direct comparisons difficult [59, 60]. However, the results do provide further support for some cognitive domains being more susceptible (or resistant) to decline with aging. For example, memory loss, as one of the most common cognitive complaints from older adults, is a core early symptom of dementia [2, 61]. Therefore, it is reasonable that studies focusing on episodic memory generally reported fewer participants in the ‘stable-high’ class compared to those of general cognitive function [33, 43, 45, 49–51]. However, the trajectory profiles were still highly heterogeneous among the 15 studies that used a common assessment of general cognitive function, the MMSE. One possible reason is the difference in inclusion criteria for study participants, with some studies involving younger participants or using rigorous screening to recruit individuals who were cognitively healthy at baseline. This might have resulted in the selection of a particularly ‘healthy’ and homogenous study sample, which could lead to a smaller proportion in the ‘rapid-decline’ class and a reduction in the number of classes overall. Another reason for the variability in findings could have resulted from the length of follow-up and extent of cognitive testing. As cognitive aging is a slow process, studies with shorter lengths of follow-up and/or younger individuals might have been less likely to observe a class of individuals with cognitive decline. Moreover, as trajectory analysis required repeated measurement, there is a higher risk of drop out (including death, given that most studies involved older adults), and this attrition might have influenced the trajectory profiles. Three community-based studies which used a quite robust approach that minimized both attrition bias and selection bias (with more relaxed inclusion criteria), all found a similar proportion of individuals in the ‘stable-high’ class (28% –32%) [25, 42, 57]. This might provide a more accurate reflection of the proportion of ‘successful cognitive agers’ in the wider community.
With regards to the predictors of class membership, overall findings indicate that younger individuals, females, and those with higher education, better psychosocial/health conditions and without a key genetic risk factor (i.e., APOE ɛ4 allele) were more likely to be in a high trajectory class. These findings align with current knowledge about risk and protective factors for cognitive decline in older adults [62]. However, there were some studies that reported opposing findings. For example, two studies found that females were more likely to be in the worse classes [36, 37], but they also reported an interaction between gender and social factors on cognitive function, suggesting that social mechanisms might help explain these differences. Also, despite that older age is the most commonly identified risk factor of lower cognitive trajectories, the observation that age was not predictive of any trajectory classes in any age groups suggests that chronological age might be not always a robust predictor across the wide spectrum of cognitive aging [49]. Consistent with existing evidence [3, 63, 64], a number of modifiable factors were found to be predictive of class membership, among which social engagement, depressive symptoms, and physical activity were the most studied. Furthermore, the trajectories of these modifiable factors were associated with classes of cognitive trajectories [23, 30, 58], so that these factors not only predict but also coexist with cognitive aging. This not only shows the cumulative effects of these modifiable factors on cognitive aging over time, as well as the complexity of their contemporaneous interrelationship with cognitive function, but also provides evidence for the optimal time window and suggests specific targeting of cognitive management, especially for those with comorbid conditions, to reduce or delay cognitive impairment. Finally, four studies investigated factors which could influence cognitive change specifically within individual trajectory classes and showed that individuals in different trajectory class varied widely in sociodemographic, health behaviors, and health status [26, 40–42]. In terms of possible interventions to promote successful cognitive aging and preventive strategies to delay cognitive decline, this highlights the need for strategies to be tailored specifically to individuals with different trajectories of cognitive aging and risk profiles. This more ‘personalized’ medicine approach would differ from broad public health policies which may only be applicable to a subpopulation of individuals [65, 66].
There are several limitations in the findings from the research literature to date and areas where more research is required. Firstly, evidence about what factors could help predict ‘successful cognitive aging’ is relatively scarce, yet this is essential knowledge to inform the development of approaches to promote cognitive resilience. Importantly, using a machine learning technique, McFall et al. observed that predictors of the ‘stable-high’ class largely differed from the risk factors for ‘rapid-decline’ class, suggesting that the mechanisms of cognitive resilience might not simply be the opposite of those underlying cognitive decline [49]. This concept would be applicable for both environmental/lifestyle factors, as well as the genetic contributors of cognitive function. Despite risk genes of dementia having been extensively studied using genome-wide association studies [67, 68], little is known about the genetic factors contributing to cognitive resilience. Indeed, the study of Yokoyama et al. was the only study that reported on genetic factors of cognitive maintenance [29]. There is a total of 11 studies that looked at biological measures in relation to cognitive trajectories including neuroimaging, genetic, blood and autoptic biomarkers [20, 28, 29, 31, 34, 35, 38, 43, 50, 52, 69]. However, APOE ɛ4 allele and amyloid load are the only two biomarkers which were tested in two or more studies. Therefore, further research is needed to duplicate the results of other biomarkers, especially neuroimaging biomarkers which could facilitate better early prediction of cognitive decline clinically. Furthermore, some studies investigated predictors of the ‘stable-high’ class using a worse class as the reference group, but it is unsure if such methodologies could distinguish ‘successful cognitive agers’ from the general population. Secondly, many studies acknowledged that the cognitive tests they used for general cognitive function, often the MMSE, were insensitive to a subtle change in cognitive function, and subject to strong ceiling effects (meaning many individuals will attain maximal scores on the test). The use of composite measures combining multiple tests might be more desirable for assessing general cognitive function because they could sensitively capture the cognitive change with additional information, and reduce both ceiling, as well as floor effects [70]. However, the disadvantage of using composite measures is the loss of information provided from individual tests, and potential differences across cognitive domains which can also provide important insights into the etiology of cognitive decline [20, 71]. Therefore, it might be helpful for further research to incorporate both composite and domain-specific measures. Thirdly, there is a lack of evidence about the potential effects of attrition bias. A proportion of the studies set inclusion criteria on the availability of cognitive data across waves to minimize the missing values in their analyses, but these criteria might lead to selection bias. Despite the statistical methodology (LCGA) generally tolerating missing values, it does not account for the mechanisms of dropout and assumes data are missing at random [48, 72, 73]. There are only a few studies that set relatively wide inclusion criteria based on their cognitive data while also providing evidence for low risk of attrition bias [25, 30, 31, 35, 44, 52, 57]. Fourthly, most studies analyzed modifiable factors using a single cross-sectional assessment at baseline. However, as mentioned above, these modifiable factors such as psychosocial conditions, physical function, depressive symptoms and comorbidities might change over time and concurrently with cognitive function, mutually affecting one another. Therefore, further investigation of concurrent trajectories of cognitive function and modifiable factors might be a promising future direction of research. Fourthly, given the significant heterogeneity of the included study sample, comparison of trajectory profiles of specific cognitive domains could not be done between studies using different samples. In the three studies that assessed multiple domains using a single study sample, two studies respectively found that sleeping patterns and mental health well-being were associated with membership of cognitive trajectories regardless of cognitive domains [23, 33]. However, Teipel et al. found that the protective effects of higher education observed on general cognitive function was absent on memory, although the class membership was highly consistent across cognitive domains [34]. Therefore, additional studies are needed to investigate the variation of cognitive ageing across different domains. Lastly, other typical methodological limitations are likely to exist to some extent in the included studies and have influenced their findings, including limitations related to smaller sample size and lower statistical power, residual confounding and recall bias.
There are limitations of this review. Firstly, we only searched research literature published in English and identifiable from two databases, MEDLINE and EMBASE, and thus some relevant studies might not have been included. Secondly, in terms of the quality assessment, we only assessed the representativeness of each cohort based on the source population rather than providing a comprehensive evaluation which also considered loss to follow-up. Studies with a strict inclusion criterion based on the number of timepoints that cognitive function was assessed, generally had a low dropout rate. They ensured the completeness of the cognitive data across multiple waves in the analysis, but the compromise was a highly selected sample. In contrast, the dropout rate was usually higher in studies which were less selective in the availability of cognitive data. Therefore, there appears to be a direct trade-off between attrition bias (the dropout rate) and selection bias (the inclusion criteria regarding the availability of cognitive data). Thirdly, we did not perform a meta-analysis due to the high heterogeneity across studies in many aspects, including the cognitive test used, aims of the study which influenced their design and analysis, as well as the predictors examined. Strengths of this review, however, include comprehensive search strategies and broad criteria of study selection in terms of the population, cognitive test and domain as well as the exposure and outcome of interest, which facilitated a comprehensive summary of the heterogeneous process of cognitive aging as well as its predictors and outcomes. Another strength is that we independently extracted all the relevant data with details and conducted quality assessment for each included study, following PRISMA guidelines.
Conclusion
This review found that cognitive aging is dynamic and heterogeneous in community-dwelling older adults. The identified trajectory profiles varied by study, possibly because of the difference in research aim, study sample, cognitive domain assessed, or model selection criteria, as the statistical methodologies of LCGA are highly flexible and there is no fixed standard approach. Future studies using LCGA should ideally use a comprehensive battery of cognitive assessment, follow a uniform theoretical framework, and report the rationale and details of statistical analysis. Age was the most commonly identified non-modifiable factor that influenced cognitive trajectories. However, chronological age might not be the most robust scale on which to assess aging. Additional studies could thus investigate whether markers of biological aging [74] provide a more accurate predictor of later-life cognitive trajectories.
Additional research into modifiable factors (e.g., psychosocial factors and health behaviors) is also required, especially their longitudinal changes and time-varying effects on cognitive aging, to better inform the feasibility and timing of interventions. Further investigation of a variety of biological measures, especially those which can be easily accessed in clinics and communities, may also offer new insights into the processes that co-occur with cognitive ageing as well as the early prediction and prevention of dementia. Finally, what defies successful cognitive aging remains under debate, and the factors that distinguish high cognitive performance from ‘normal aging’ is unclear. It is likely that preventive strategies for cognitive decline are merely necessary yet insufficient for older adults to be in the optimal class of cognitive trajectory. Therefore, it is worth shifting the conceptualization of cognitive health from the lack of cognitive impairment to maintenance of cognitive function at the optimal level.
CONFLICT OF INTEREST
The authors have no conflict of interest to report.
ACKNOWLEDGMENTS
ZW is supported by the Australian Government Research Training Program Scholarship. AZZP is supported by the Monash Graduate Scholarship. TA is a recipient of the Custodian of the two Holy Mosques’ Overseas Scholarship Program. JR is funded by a NHMRC Dementia Research Leader Fellowship [APP1135727]. This work was not supported by a specific grant from any funding agencies in the public, commercial, or non-for-profit sectors.
SUPPLEMENTARY MATERIAL
[1] The supplementary material is available in the electronic version of this article: https://dx.doi.org/10.3233/ADR200232.
REFERENCES
[1] | World Health Organization, What is Healthy Ageing?, Copyright World Health Organization (WHO) 2020, https://www.who.int/ageing/healthy-ageing/en/, Accessed on March 3, 2020. |
[2] | Harada CN , Natelson Love MC , Triebel KL ((2013) ) Normal cognitive aging. Clin Geriatr Med 29: , 737–752. |
[3] | Bellou V , Belbasis L , Tzoulaki I , Middleton LT , Ioannidis JPA , Evangelou E ((2017) ) Systematic evaluation of the associations between environmental risk factors and dementia: An umbrella review of systematic reviews and meta-analyses. Alzheimers Dement 13: , 406–418. |
[4] | Sun JH , Tan L , Wang HF , Tan MS , Tan L , Li JQ , Xu W , Zhu XC , Jiang T , Yu JT ((2015) ) Genetics of vascular dementia: Systematic review and meta-analysis. J Alzheimers Dis 46: , 611–629. |
[5] | Stocker H , Mollers T , Perna L , Brenner H ((2018) ) The genetic risk of Alzheimer’s disease beyond APOE epsilon4: Systematic review of Alzheimer’s genetic risk scores. Transl Psychiatry 8: , 166. |
[6] | Daffner KR ((2010) ) Promoting successful cognitive aging: A comprehensive review. J Alzheimers Dis 19: , 1101–1122. |
[7] | Hoekstra T , Twisk JWR ((2015) ) The analysis of individual health trajectories across the life course: Latent class growth models versus mixed models. In A Life Course Perspective on Health Trajectories and Transitions, Burton-Jeangros C, Cullati S, Sacker A, Blane D, eds. Springer Open, Switzerland, pp. 179-193. |
[8] | Castro-Costa E , Dewey ME , Uchoa E , Firmo JO , Lima-Costa MF , Stewart R ((2011) ) Trajectories of cognitive decline over 10 years in a Brazilian elderly population: The Bambui Cohort Study of Aging. Cad Saude Publica 27: , 345–350. |
[9] | Karlamangla AS , Miller-Martinez D , Aneshensel CS , Seeman TE , Wight RG , Chodosh J ((2009) ) Trajectories of cognitive function in late life in the United States: Demographic and socioeconomic predictors. Am J Epidemiol 170: , 331–342. |
[10] | Han WJ , Shibusawa T ((2015) ) Trajectory of physical health, cognitive status, and psychological well-being among Chinese elderly. Arch Gerontol Geriatr 60: , 168–177. |
[11] | Bilgel M , An Y , Lang A , Prince J , Ferrucci L , Jedynak B , Resnick SM ((2014) ) Trajectories of Alzheimer disease-related cognitive measures in a longitudinal sample. Alzheimers Dement 10: , 735–742. |
[12] | Chodosh J , Miller-Martinez D , Aneshensel CS , Wight RG , Karlamangla AS ((2010) ) Depressive symptoms, chronic diseases, and physical disabilities as predictors of cognitive functioning trajectories in older Americans. J Am Geriatr Soc 58: , 2350–2357. |
[13] | Muniz-Terrera G , Matthews F , Dening T , Huppert FA , Brayne C , Group CC ((2009) ) Education and trajectories of cognitive decline over 9 years in very old people: Methods and risk analysis. Age Ageing 38: , 277–282. |
[14] | Burnham SC , Bourgeat P , Dore V , Savage G , Brown B , Laws S , Maruff P , Salvado O , Ames D , Martins RN , Masters CL , Rowe CC , Villemagne VL , AIBL Research Group ((2016) ) Clinical and cognitive trajectories in cognitively healthy elderly individuals with suspected non-Alzheimer’s disease pathophysiology (SNAP) or Alzheimer’s disease pathology: A longitudinal study. Lancet Neurol 15: , 1044–1053. |
[15] | Hayden KM , Zandi PP , Khachaturian AS , Szekely CA , Fotuhi M , Norton MC , Tschanz JT , Pieper CF , Corcoran C , Lyketsos CG , Breitner JC , Welsh-Bohmer KA , Cache County Investigators ((2007) ) Does NSAID use modify cognitive trajectories in the elderly? The Cache County study. Neurology 69: , 275–282. |
[16] | Wilson RS , Leurgans SE , Boyle PA , Schneider JA , Bennett DA ((2010) ) Neurodegenerative basis of age-related cognitive decline. Neurology 75: , 1070–1078. |
[17] | McCarrey AC , An Y , Kitner-Triolo MH , Ferrucci L , Resnick SM ((2016) ) Sex differences in cognitive trajectories in clinically normal older adults. Psychol Aging 31: , 166–175. |
[18] | Choi M , Lohman MC , Mezuk B ((2014) ) Trajectories of cognitive decline by driving mobility: Evidence from the Health and Retirement Study. Int J Geriatr Psychiatry 29: , 447–453. |
[19] | Small BJ , Backman L ((2007) ) Longitudinal trajectories of cognitive change in preclinical Alzheimer’s disease: A growth mixture modeling analysis. Cortex 43: , 826–834. |
[20] | Hayden KM , Reed BR , Manly JJ , Tommet D , Pietrzak RH , Chelune GJ , Yang FM , Revell AJ , Bennett DA , Jones RN ((2011) ) Cognitive decline in the elderly: An analysis of population heterogeneity. Age Ageing 40: , 684–689. |
[21] | Moher D , Liberati A , Tetzlaff J , Altman DG , Group P ((2010) ) Preferred reporting items for systematic reviews and meta-analyses: The PRISMA statement. Int J Surg 8: , 336–341. |
[22] | GA Wells BS , O’Connell D , Peterson J , Welch V , Losos M , Tugwell P ((2013) ) The Newcastle-Ottawa Scale (NOS) for assessing the quality of nonrandomised studies in meta-analyses, Ottawa Hospital Research Institute, http://www.ohri.ca/programs/clinical_epidemiology/oxford.asp, Accessed on December 21, 2019. |
[23] | Graziane JA , Beer JC , Snitz BE , Chang CC , Ganguli M ((2016) ) Dual trajectories of depression and cognition: A longitudinal population-based study. Am J Geriatr Psychiatry 24: , 364–373. |
[24] | Proust C , Jacqmin-Gadda H ((2005) ) Estimation of linear mixed models with a mixture of distribution for the random effects. Comput Methods Programs Biomed 78: , 165–173. |
[25] | Han L , Gill TM , Jones BL , Allore HG ((2016) ) Cognitive aging trajectories and burdens of disability, hospitalization and nursing home admission among community-living older persons. J Gerontol A Biol Sci Med Sci 71: , 766–771. |
[26] | Terrera GM , Brayne C , Matthews F , CC75C Study Collaboration Group ((2010) ) One size fits all? Why we need more sophisticated analytical methods in the explanation of trajectories of cognition in older age and their potential risk factors. Int Psychogeriatr 22: , 291–299. |
[27] | Barnes DE , Cauley JA , Lui LY , Fink HA , McCulloch C , Stone KL , Yaffe K ((2007) ) Women who maintain optimal cognitive function into old age. J Am Geriatr Soc 55: , 259–264. |
[28] | Yaffe K , Fiocco AJ , Lindquist K , Vittinghoff E , Simonsick EM , Newman AB , Satterfield S , Rosano C , Rubin SM , Ayonayon HN , Harris TB ((2009) ) Predictors of maintaining cognitive function in older adults: The Health ABC study. Neurology 72: , 2029–2035. |
[29] | Yokoyama JS , Evans DS , Coppola G , Kramer JH , Tranah GJ , Yaffe K ((2014) ) Genetic modifiers of cognitive maintenance among older adults. Hum Brain Mapp 35: , 4556–4565. |
[30] | Park S , Kwon E , Lee H ((2017) ) Life course trajectories of later-life cognitive functions: Does social engagement in old age matter? Int J Environ Res Public Health 14: , 393. |
[31] | Espeland MA , Chen JC , Weitlauf J , Hayden KM , Rapp SR , Resnick SM , Garcia L , Cannell B , Baker LD , Sachs BC , Tindle HA , Wallace R , Casanova R , Women’s Health Initiative Memory Study Magnetic Resonance Imaging Study Group ((2018) ) Trajectories of relative performance with 2 measures of global cognitive function. J Am Geriatr Soc 66: , 1575–1580. |
[32] | Kim JH , Kim JM ((2019) ) Association of cognitive impairment and grip strength trajectories with mortality among middle-aged and elderly adults. Int Psychogeriatr 31: , 723–734. |
[33] | Sha T , Cheng W , Yan Y ((2019) ) Prospective association between sleep-related factors and the trajectories of cognitive performance in the elderly Chinese population across a 5-year period cohort study. PLoS One 14: , e0222192. |
[34] | Teipel SJ , Cavedo E , Lista S , Habert MO , Potier MC , Grothe MJ , Epelbaum S , Sambati L , Gagliardi G , Toschi N , Greicius MD , Dubois B , Hampel H , INSIGHT-preAD study group; Alzheimer Precision Medicine Initiative (APMI) ((2018) ) Effect of Alzheimer’s disease risk and protective factors on cognitive trajectories in subjective memory complainers: An INSIGHT-preAD study. Alzheimers Dement 14: , 1126–1136. |
[35] | Rosano C , Aizenstein HJ , Newman AB , Venkatraman V , Harris T , Ding J , Satterfield S , Yaffe K ((2012) ) Neuroimaging differences between older adults with maintained versus declining cognition over a 10-year period. Neuroimage 62: , 307–313. |
[36] | Min JW ((2018) ) A longitudinal study of cognitive trajectories and its factors for Koreans aged 60 and over: A latent growth mixture model. Int J Geriatr Psychiatry 33: , 755–762. |
[37] | Hu X , Gu S , Sun X , Gu Y , Zhen X , Li Y , Huang M , Wei J , Dong H ((2019) ) Cognitive ageing trajectories and mortality of Chinese oldest-old. Arch Gerontol Geriatr 82: , 81–87. |
[38] | Casaletto KB , Elahi FM , Staffaroni AM , Walters S , Contreras WR , Wolf A , Dubal D , Miller B , Yaffe K , Kramer JH ((2019) ) Cognitive aging is not created equally: Differentiating unique cognitive phenotypes in “normal” adults. Neurobiol Aging 77: , 13–19. |
[39] | Lee Y , Jean Yeung WJ ((2019) ) Gender matters: Productive social engagement and the subsequent cognitive changes among older adults. Soc Sci Med 229: , 87–95. |
[40] | Howrey BT , Raji MA , Masel MM , Peek MK ((2015) ) Stability in cognitive function over 18 years: Prevalence and predictors among older Mexican Americans. Curr Alzheimer Res 12: , 614–621. |
[41] | Robitaille A , Piccinin AM , Hofer SM , Johansson B , Muniz Terrera G ((2018) ) An examination of the heterogeneity in the pattern and association between rates of change in grip strength and global cognition in late life. A multivariate growth mixture modelling approach. Age Ageing 47: , 692–697. |
[42] | Downer B , Chen NW , Raji M , Markides KS ((2017) ) A longitudinal study of cognitive trajectories in Mexican Americans age 75 and older. Int J Geriatr Psychiatry 32: , 1122–1130. |
[43] | Zahodne LB , Schupf N , Brickman AM , Mayeux R , Wall MM , Stern Y , Manly JJ ((2016) ) Dementia risk and protective factors differ in the context of memory trajectory groups. J Alzheimers Dis 52: , 1013–1020. |
[44] | Marioni RE , Proust-Lima C , Amieva H , Brayne C , Matthews FE , Dartigues JF , Jacqmin-Gadda H ((2014) ) Cognitive lifestyle jointly predicts longitudinal cognitive decline and mortality risk. Eur J Epidemiol 29: , 211–219. |
[45] | Ding X , Charnigo RJ , Schmitt FA , Kryscio RJ , Abner EL ((2019) ) Evaluating trajectories of episodic memory in normal cognition and mild cognitive impairment: Results from ADNI. PLoS One 14: , e0212435. |
[46] | Nagin DS , Odgers CL ((2010) ) Group-based trajectory modeling in clinical research. Annu Rev Clin Psychol 6: , 109–138. |
[47] | Ram N , Grimm KJ ((2009) ) Growth mixture modeling: A method for identifying differences in longitudinal change among unobserved groups. Int J Behav Dev 33: , 565–576. |
[48] | Nagin DS ((2014) ) Group-based trajectory modeling: An overview. Ann Nutr Metab 65: , 205–210. |
[49] | McFall GP , McDermott KL , Dixon RA ((2019) ) Modifiable risk factors discriminate memory trajectories in non-demented aging: Precision factors and targets for promoting healthier brain aging and preventing dementia. J Alzheimers Dis 70: , S101–S118. |
[50] | Zahodne LB , Wall MM , Schupf N , Mayeux R , Manly JJ , Stern Y , Brickman AM ((2015) ) Late-life memory trajectories in relation to incident dementia and regional brain atrophy. J Neurol 262: , 2484–2490. |
[51] | Lin FV , Wang X , Wu R , Rebok GW , Chapman BP , Alzheimer’s Disease Neuroimaging Initiative ((2017) ) Identification of successful cognitive aging in the Alzheimer’s Disease Neuroimaging Initiative study. J Alzheimers Dis 59: , 101–111. |
[52] | Yu L , Boyle PA , Segawa E , Leurgans S , Schneider JA , Wilson RS , Bennett DA ((2015) ) Residual decline in cognition after adjustment for common neuropathologic conditions. Neuropsychology 29: , 335–343. |
[53] | Tampubolon G , Nazroo J , Pendleton N ((2017) ) Trajectories of general cognition and dementia in English older population: An exploration. Eur Geriatr Med 8: , 454–459. |
[54] | Marioni RE , Proust-Lima C , Amieva H , Brayne C , Matthews FE , Dartigues JF , Jacqmin-Gadda H ((2015) ) Social activity, cognitive decline and dementia risk: A 20-year prospective cohort study. BMC Public Health 15: , 1089. |
[55] | Yaffe K , Peltz CB , Ewing SK , McCulloch CE , Cummings SR , Cauley JA , Hillier TA , Ensrud KE ((2016) ) Long-term cognitive trajectories and mortality in older women. J Gerontol A Biol Sci Med Sci 71: , 1074–1080. |
[56] | Yaffe K , Lindquist K , Vittinghoff E , Barnes D , Simonsick EM , Newman A , Satterfield S , Rosano C , Rubin SM , Ayonayon HN , Harris T ((2010) ) The effect of maintaining cognition on risk of sisability and death. J Am Geriatr Soc 58: , 889–894. |
[57] | Liu Z , Han L , Gahbauer EA , Allore HG , Gill TM ((2018) ) Joint trajectories of cognition and frailty and associated burden of patient-reported outcomes. J Am Med Dir Assoc 19: , 304–309. |
[58] | Chen TY , Chang HY ((2016) ) Developmental patterns of cognitive function and associated factors among the elderly in Taiwan. Sci Rep 6: , 33486. |
[59] | Tsoi KK , Chan JY , Hirai HW , Wong SY , Kwok TC ((2015) ) Cognitive tests to detect dementia: A systematic review and meta-analysis. JAMA Intern Med 175: , 1450–1458. |
[60] | Cullen B , O’Neill B , Evans JJ , Coen RF , Lawlor BA ((2007) ) A review of screening tests for cognitive impairment. J Neurol Neurosurg Psychiatry 78: , 790–799. |
[61] | Park HL , O’Connell JE , Thomson RG ((2003) ) A systematic review of cognitive decline in the general elderly population. Int J Geriatr Psychiatry 18: , 1121–1134. |
[62] | Livingston G , Sommerlad A , Orgeta V , Costafreda SG , Huntley J , Ames D , Ballard C , Banerjee S , Burns A , Cohen-Mansfield J , Cooper C , Fox N , Gitlin LN , Howard R , Kales HC , Larson EB , Ritchie K , Rockwood K , Sampson EL , Samus Q , Schneider LS , Selbaek G , Teri L , Mukadam N ((2017) ) Dementia prevention, intervention, and care. Lancet 390: , 2673–2734. |
[63] | Deckers K , van Boxtel MP , Schiepers OJ , de Vugt M , Munoz Sanchez JL , Anstey KJ , Brayne C , Dartigues JF , Engedal K , Kivipelto M , Ritchie K , Starr JM , Yaffe K , Irving K , Verhey FR , Kohler S ((2015) ) Target risk factors for dementia prevention: A systematic review and Delphi consensus study on the evidence from observational studies. Int J Geriatr Psychiatry 30: , 234–246. |
[64] | Plassman BL , Williams JW Jr. , Burke JR , Holsinger T , Benjamin S ((2010) ) Systematic review: Factors associated with risk for and possible prevention of cognitive decline in later life. Ann Intern Med 153: , 182–193. |
[65] | Ryan L , Hay M , Huentelman MJ , Duarte A , Rundek T , Levin B , Soldan A , Pettigrew C , Mehl MR , Barnes CA ((2019) ) Precision aging: Applying precision medicine to the field of cognitive aging. Front Aging Neurosci 11: , 128. |
[66] | Reitz C ((2016) ) Toward precision medicine in Alzheimer’s disease. Ann Transl Med 4: , 107. |
[67] | Trampush JW , Yang MLZ , Yu J , Knowles E , Davies G , Liewald DC , Starr JM , Djurovic S , Melle I , Sundet K , Christoforou A , Reinvang I , DeRosse P , Lundervold AJ , Steen VM , Espeseth T , Raikkonen K , Widen E , Palotie A , Eriksson JG , Giegling I , Konte B , Roussos P , Giakoumaki S , Burdick KE , Payton A , Ollier W , Horan M , Chiba-Falek O , Attix DK , Need AC , Cirulli ET , Voineskos AN , Stefanis NC , Avramopoulos D , Hatzimanolis A , Arking DE , Smyrnis N , Bilder RM , Freimer NA , Cannon TD , London E , Poldrack RA , Sabb FW , Congdon E , Conley ED , Scult MA , Dickinson D , Straub RE , Donohoe G , Morris D , Corvin A , Gill M , Hariri AR , Weinberger DR , Pendleton N , Bitsios P , Rujescu D , Lahti J , Le Hellard S , Keller MC , Andreassen OA , Deary IJ , Glahn DC , Malhotra AK , Lencz T ((2017) ) GWAS meta-analysis reveals novel loci and genetic correlates for general cognitive function: A report from the COGENT consortium. Mol Psychiatry 22: , 1651–1652. |
[68] | Davies G , Armstrong N , Bis JC , Bressler J , Chouraki V , Giddaluru S , Hofer E , Ibrahim-Verbaas CA , Kirin M , Lahti J , van der Lee SJ , Le Hellard S , Liu T , Marioni RE , Oldmeadow C , Postmus I , Smith AV , Smith JA , Thalamuthu A , Thomson R , Vitart V , Wang J , Yu L , Zgaga L , Zhao W , Boxall R , Harris SE , Hill WD , Liewald DC , Luciano M , Adams H , Ames D , Amin N , Amouyel P , Assareh AA , Au R , Becker JT , Beiser A , Berr C , Bertram L , Boerwinkle E , Buckley BM , Campbell H , Corley J , De Jager PL , Dufouil C , Eriksson JG , Espeseth T , Faul JD , Ford I , Generation S , Gottesman RF , Griswold ME , Gudnason V , Harris TB , Heiss G , Hofman A , Holliday EG , Huffman J , Kardia SL , Kochan N , Knopman DS , Kwok JB , Lambert JC , Lee T , Li G , Li SC , Loitfelder M , Lopez OL , Lundervold AJ , Lundqvist A , Mather KA , Mirza SS , Nyberg L , Oostra BA , Palotie A , Papenberg G , Pattie A , Petrovic K , Polasek O , Psaty BM , Redmond P , Reppermund S , Rotter JI , Schmidt H , Schuur M , Schofield PW , Scott RJ , Steen VM , Stott DJ , van Swieten JC , Taylor KD , Trollor J , Trompet S , Uitterlinden AG , Weinstein G , Widen E , Windham BG , Jukema JW , Wright AF , Wright MJ , Yang Q , Amieva H , Attia JR , Bennett DA , Brodaty H , de Craen AJ , Hayward C , Ikram MA , Lindenberger U , Nilsson LG , Porteous DJ , Raikkonen K , Reinvang I , Rudan I , Sachdev PS , Schmidt R , Schofield PR , Srikanth V , Starr JM , Turner ST , Weir DR , Wilson JF , van Duijn C , Launer L , Fitzpatrick AL , Seshadri S , Mosley TH Jr. , Deary IJ ((2015) ) Genetic contributions to variation in general cognitive function: A meta-analysis of genome-wide association studies in the CHARGE consortium (}=53949). Mol Psychiatry 20: , 183–192. |
[69] | Hochstetler H , Trzepacz PT , Wang S , Yu P , Case M , Henley DB , Degenhardt E , Leoutsakos JM , Lyketsos CG ((2016) ) Empirically defining trajectories of late-life cognitive and functional decline. J Alzheimers Dis 50: , 271–282. |
[70] | Wilson RS , Beckett LA , Barnes LL , Schneider JA , Bach J , Evans DA , Bennett DA ((2002) ) Individual differences in rates of change in cognitive abilities of older persons. Psychol Aging 17: , 179–193. |
[71] | Morris MC , Evans DA , Hebert LE , Bienias JL ((1999) ) Methodological issues in the study of cognitive decline. Am J Epidemiol 149: , 789–793. |
[72] | Muthen B , Shedden K ((1999) ) Finite mixture modeling with mixture outcomes using the EM algorithm. Biometrics 55: , 463–469. |
[73] | Amelia M. Haviland BLJ , Daniel S. Nagin ((2011) ) Group-based trajectory modeling extended to account for nonrandom participant attrition. Sociol Methods Res 40: , 367–390. |
[74] | Fransquet PD , Wrigglesworth J , Woods RL , Ernst ME , Ryan J ((2019) ) The epigenetic clock as a predictor of disease and mortality risk: A systematic review and meta-analysis. Clin Epigenetics 11: , 62. |
[75] | Elovainio M , Sommerlad A , Hakulinen C , Pulkki-Raback L , Virtanen M , Kivimaki M , Singh-Manoux A ((2018) ) Structural social relations and cognitive ageing trajectories: Evidence from the Whitehall II cohort study. Int J Epidemiol 47: , 701–708. |


