
Attempt to Predict A/T/N-Based Alzheimer’s Disease Cerebrospinal Fluid Biomarkers Using a Peripheral Blood DNA Methylation Clock
Abstract
Background:
Although aging is the strongest risk factor for the development of Alzheimer’s disease (AD), it remains uncertain if the blood DNA methylation clock, which reflects the effect of biological aging on DNA methylation (DNAme) status of blood cells, may be used as a surrogate biomarker for AD pathology in the central nervous system (CNS).
Objective:
We aimed to develop a practical model to predict for A/T/N-based AD biomarkers as the prediction targets using the aging acceleration of blood cells.
Methods:
We obtained data of North American ADNI study participants (n = 317) whose blood DNA methylation microarray (Illumina HumanMethylation EPIC Beadchips) and cerebrospinal fluid (CSF) AD biomarkers (Aβ, t-tau, and p-tau) were recorded simultaneously. Methylation clock was calculated to conduct machine learning, in order to predict binary statuses (+ or –) for A (corresponding to the lowered CSF Aβ), T (the elevated CSF p-tau), or N (the elevated CSF t-tau). The predictive performance of the models was evaluated by area under curve (AUC) in the test subset within ADNI.
Results:
Among the 317 included samples, 194 (61.2%) were A+, 247 (77.9%) were T+, and 104 (32.8%) were N+. The degree of blood aging acceleration showed weak positive correlation with the CSF Aβ levels, even after adjustment with APOE genotype and other covariates. However, the contribution of aging acceleration to improve the predictive performance of models was not significant for any of A+, T+, or N+.
Conclusion:
Our exploratory attempts could not demonstrate the substantial utility of the peripheral blood cells’ methylation clock as a predictor for A/T/N-based CSF biomarkers of AD, and further additional work should be conducted to determine whether the blood DNAme signatures including methylation clock have substantial utility in detecting underlying amyloid, tau or neurodegeneration pathology of AD.
INTRODUCTION
Positive amyloid-β (Aβ) accumulation in brain, one of the hallmarks of Alzheimer’s disease (AD) pathology [1], greatly increases its prevalence as aging (e.g., from 10% in 50-year-olds to more than 40% in 90-year-olds in general populations) [2]: although its molecular mechanisms remain uncertain, aging is actually the strongest risk factor of AD [3]. Preclinical AD, which corresponds to positive brain Aβ accumulation in healthy individuals without evidence of cognitive decline [4, 5], is becoming the focus of clinical trials aiming to develop disease-modifying therapies for AD [6]. Along with such recent trends, a blood biomarker that is less invasive than lumbar puncture and that can increase the prior probability for CNS AD pathology including positive Aβ accumulation has been much desired.
As one of the blood-based biomarkers that is related with both aging and AD, DNA methylation (DNAme) can be considered as one suitable modality candidates. DNAme is an epigenetic mechanism involved in the regulation of gene expression which dynamically changes throughout the entire cellular lifetime including throughout aging [7], and its alteration is also closely associated with the AD. For example, the aberrant DNAme patterns have been found in the AD brain [8, 9], and furthermore, “aging acceleration” defined as an excess in the estimated biological age calculated based on the DNAme status (= methylation clock) compared to the actual chronological age [10], is reported to be associated with AD pathological features such as amyloid load or neuritic plaques in the brains of AD patients [11].
Although to date it remains unclear how, mechanistically, the methylation clock is linked to aging, it has potential as a biomarker of aging-related disease or mortality [12]. The methylation clock has some advantages over the whole DNAme signature data in that it is the single numerical value for each sample, representing the DNAme signatures of an enormous number of CpG sites, and therefore it has better interpretability than the whole DNAme data itself. In addition, by using the methylation clock, we can avoid the “curse of dimensionality” which reduces statistical power in the DNAme analysis [13], and we can handle the DNAme data in a more efficient way.
Since a certain proportion, if not a large portion, of brain DNAme status is known to be reflected by the peripheral blood DNAme within each individual [14, 15], the AD-related aging acceleration in brain may also be reflected by the methylation clock in the blood cells at least partly. It is also reported that the aging acceleration in blood cells is associated with cognitive decline [16] or general AD risks such as higher blood pressure or smoking behavior [17]. Based on these earlier studies, here we hypothesized that the aging acceleration in blood cells may be used as a surrogate of CNS AD pathology. Blood DNAme as a biomarker for AD, long expected as in the case of other diseases such as early cancer [18] but has been inconclusive for AD so far [19–21], may be achieved.
To this end, in this discovery study we aimed to construct a practical model to predict A/T/N-based AD biomarkers as the prediction targets using the aging acceleration of blood cells. The A/T/N classification has originally been developed as an unbiased descriptive classification that is more closely-related with the AD pathology than the clinical diagnosis [22], and by using the A/T/N classification [22], we expect to avoid current diagnostic confusion as to the clinical staging [22], which may have been one of the causes of inconclusive results among earlier studies on blood DNAme in AD [19, 20].
MATERIALS AND METHODS
Data acquisition and preprocessing
This study was approved by the University of Tokyo Graduate School of Medicine institutional ethics committee (ID: 11628-(3)). Informed consent is not required because this is an observational study using publicly available data. We used the Alzheimer’s Disease Neuroimaging Initiative (ADNI) study dataset [23] obtained from the Laboratory of Neuro Imaging (LONI) (https://ida.loni.usc.edu) in October 2019 with the approval of the data access committee. The ADNI dataset provides a large number of DNAme data set of a single platform (Illumina HumanMethylation EPIC Beadchip array [24]) which is also equipped with the cerebrospinal fluid (CSF) biomarker data simultaneously, and is suitable for the purpose of our study. The ADNI was launched in 2003 as a public-private partnership, led by Principal Investigator Michael W. Weiner, MD. The primary goal of ADNI has been to test whether serial magnetic resonance imaging (MRI), positron emission tomography (PET), other biological markers, and clinical and neuropsychological assessments can be combined to measure the progression of mild cognitive impairment (MCI) and early AD. For up-to-date information, see http://www.adni-info.org.
In this study, we used the DNA methylation microarray data (Illumina HumanMethylation EPIC Beadchip array, provided in ‘.IDAT’ file format) regardless of the participants’ cognitive status at-index blood sampling. We included the microarray data which is collected on the same day as of lumbar puncture for CSF biomarkers: amyloid-beta (Aβ42, pg/mL), total tau (t-tau, pg/mL), and phosphorylated tau (p-tau, pg/mL) as listed on the data file ‘UPENNBIOMK_MASTER.csv’. A few of sample data not containing all three CSF biomarkers (Aβ, t-tau, and p-tau) were excluded from the analysis. To prevent possible data-leakage between the training and test datasets, we excluded the duplicated DNAme data obtained from the same participant even if sampled at different times. Eventually, we included n = 317 samples derived from n = 317 unique participants.
Included samples were categorized according to the A/T/N system by 3 binary (+ or –) items [22], where “A” refers to whether or not the CSF Aβ is lowered (<192 pg/mL), “T” refers to whether or not the CSF p-tau is elevated (>23 pg/mL), and “N” refers to whether or not the CSF t-tau is elevated (>93 pg/mL). The threshold values mentioned here are based on earlier literature [23]. We also obtained the binary (+ or –) status of amyloid PET (AV45). Although the original A/T/N system refers to CSF Aβ or amyloid PET for “A”, CSF p-tau or tau PET for “T”, and CSF t-tau or FDG-PET or structural MRI for “N” [22], in this study we predominantly refer to the CSF data for A/T/N classification: this is because the timing of amyloid PET and blood sampling in each case occasionally differ, and in some cases there is a discrepancy in the positivity between the CSF Aβ and amyloid PET or between the CSF t-tau and brain MRI.
We also obtained the clinical features of the included cases, such as follows: age at blood sampling, sex (male/female: binary), the number of APOE ɛ4 allele(s), ethnicity (white or not: binary), smoking history (yes/no: binary), education years, diagnosis at the timing nearest to the blood sampling, and the total Mini-Mental State Examination and Alzheimer’s Disease Assessment Scale-cog13 scores at the timing nearest to the blood sampling: the difference between the timing of clinical assessment and the timing of blood sampling was median 10 days (interquartile ranges (IQR): 1∼21 days).
Microarray processing procedure
All the following data handling and analysis were carried out using R 3.5.1 (R Foundation for Statistical Computing, Vienna, Austria), in macOS Mojave. First, microarray data (in ‘.IDAT’ files) were read using the R package {minfi} [25], and annotated with the EPIC manifest file. For preprocessing, the “noob” method was used [24], and low-quality samples were excluded from the analysis by using minfi. We then converted the DNAme data to methylation level (beta value) matrix, normalized it with the “PBC” method implemented in the {ChAMP} function [27]. Thereafter the SNP-related probes or probes of which detection p-value is less than 0.01 were further filtered-out by the ChAMP function. At this point, there is a DNAme data matrix containing beta values [0–1] of more than 700,000 + CpG sites for each case. 188 batches were run in total and there was a batch effect (p < 0.05) as confirmed using the ChAMP function, the matrix is further batch-corrected using Combat function of R package {sva} [27] without including the A/T/N binary annotations as the covariates in Combat: this is because in practical situation the correct labeling of the test dataset should be unknown. The differentially-methylated probe (DMP), the CpG site of which methylation level [0–1] is statistically different between the two subgroups of interest (e.g., A+ versus A–, T+ versus T–), was calculated using the function of ChAMP package.
Epigenetic aging calculation
Epigenetic aging was calculated using the online software (https://dnamage.genetics.ucla.edu) which is provided by Horvath et al. [10]. The above normalized DNAme data matrix was submitted to the software, and the two measures of methylation clock were obtained for each case: intrinsic epigenetic aging acceleration (IEAA) and extrinsic epigenetic aging acceleration (EEAA). The IEAA is defined as the residual from a multivariate model regressing estimated Horvath epigenetic age on chronological age and blood cell counts, and subtracting the effect of aging-related changes in blood cell counts allows us to measure “pure” epigenetic aging effects [10, 17, 28]. EEAA is defined as the residual from a univariate model regressing the estimated age on the actual age [10, 28]: EEAA reflects IEAA as well as the immune-related changes in the blood cell counts following the aging [10, 17, 28].
Model training and evaluation
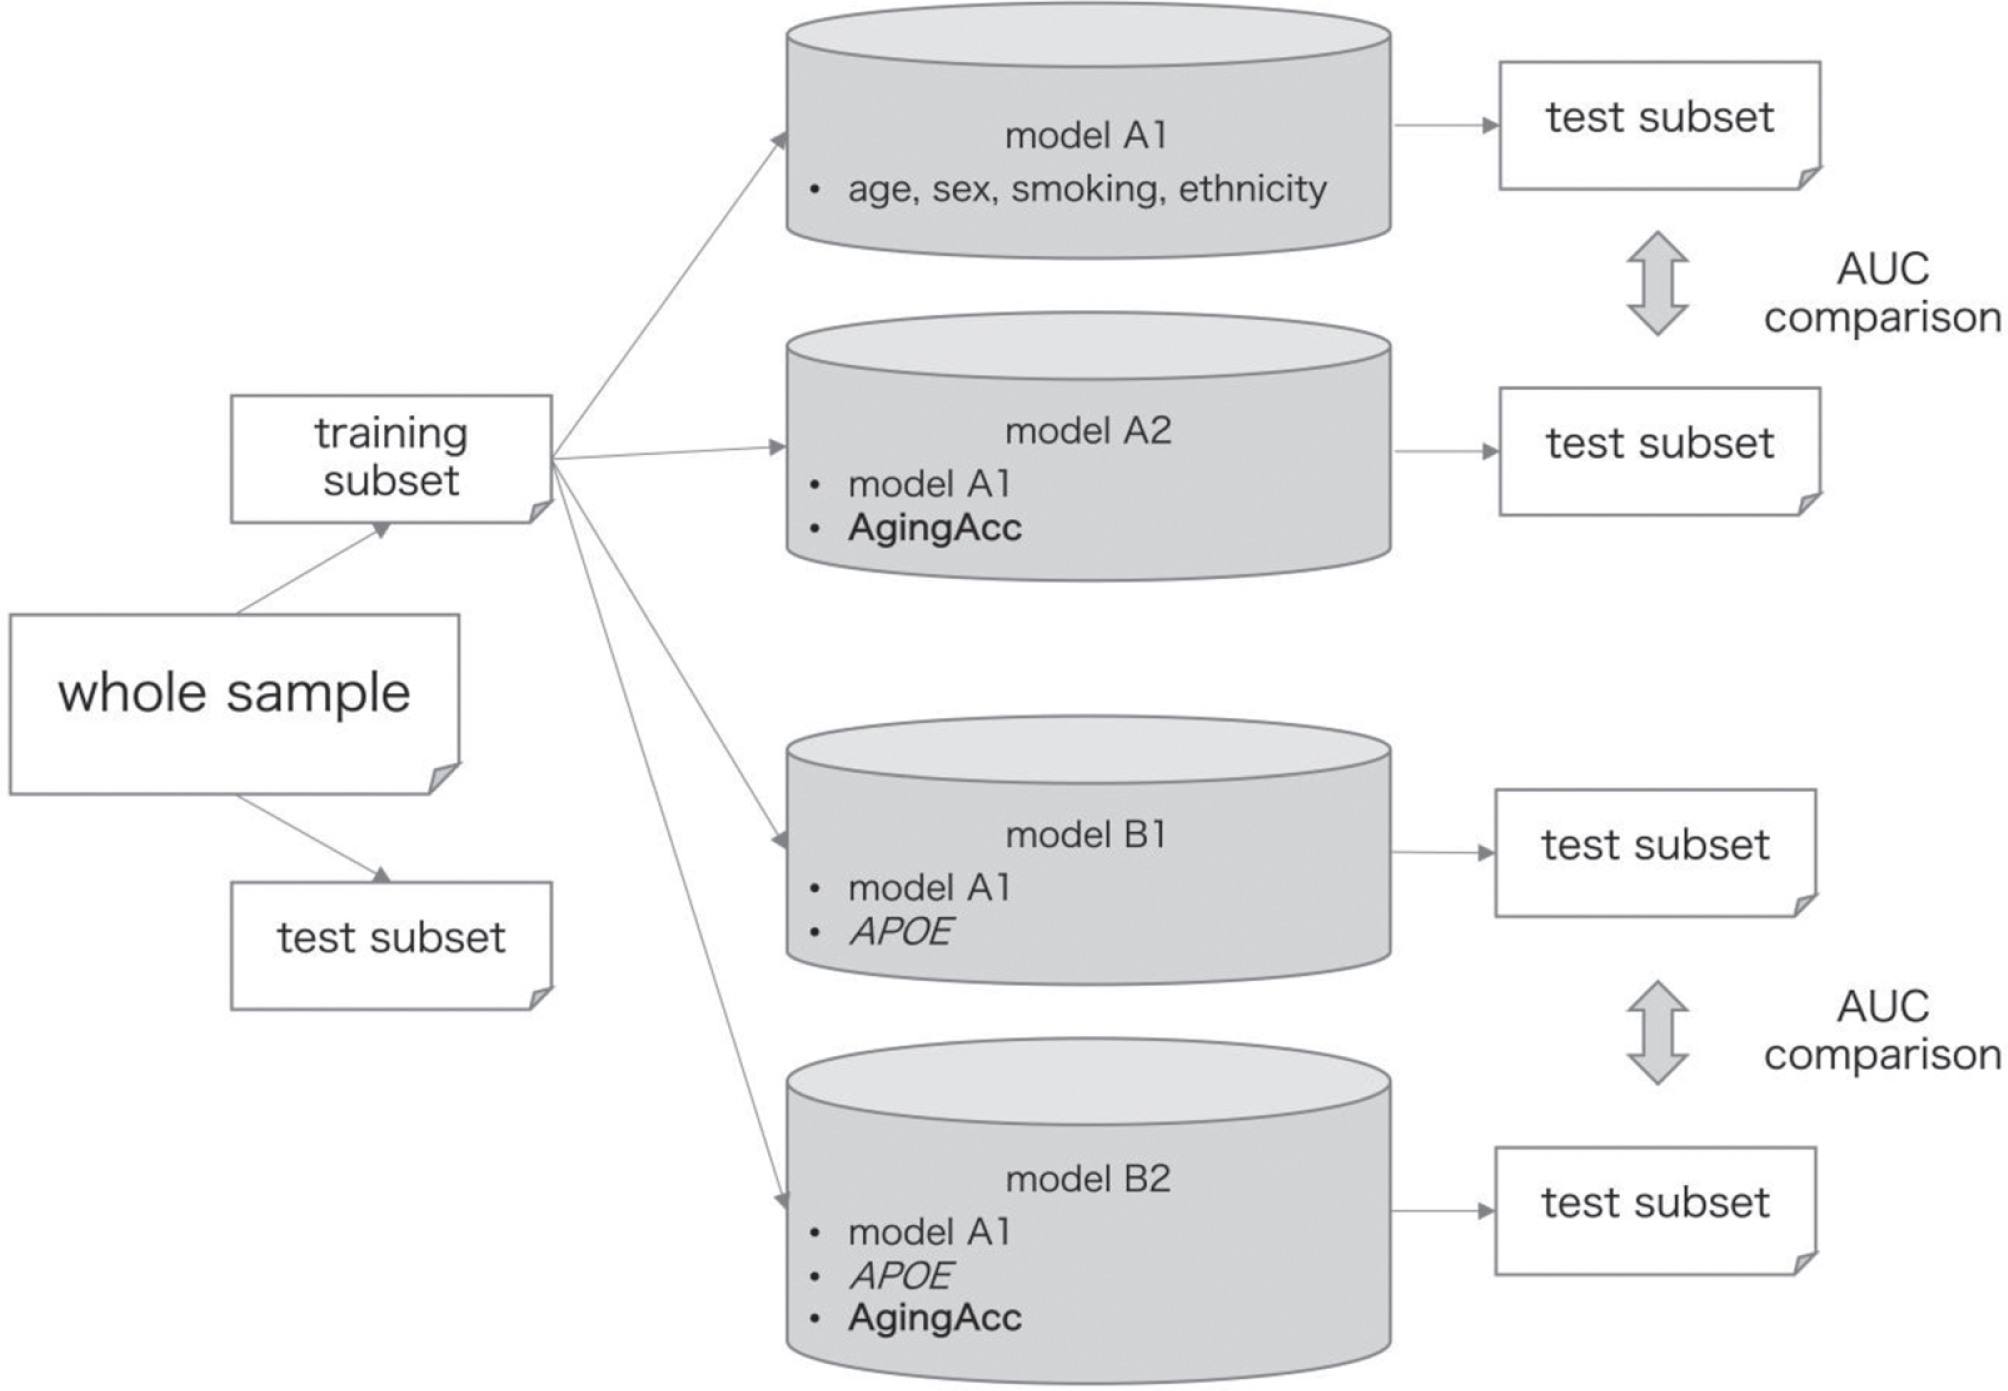
The data processing flow for model training and evaluation is outlined in Fig. 1. Whole samples were randomly split into training and test subsets at a proportion of approximately 1 : 1 by using the R package {caret} function [29]. These datasets were split so that the distribution of the A/T/N-based classification becomes approximately equal between the training and test subsets, as well as the clinical features (age, sex, the number of APOE ɛ4 allele(s), and history of smoking) do not have significant difference in their distribution between the training and test subsets (as confirmed by false discovery rate (FDR) ≥0.05).
Fig. 1
Data processing flow for model training and evaluation. The entire data are randomly split into training and test subsets at a ratio of 1 : 1. Models A1–B2 were trained based on the different combination of features (‘age’ refers to the chronological age), where model A2 included features from model A1 in addition to the AgingAcc, model B1 included features form model A1 in addition to the APOE, and model B2 included features from model A1 in addition to the APOE and AgingAcc. The performance of these models was evaluated in the test subset. Performance AUC was compared between models A1 and A2, and between models B1 and B2, using DeLong’s test. The whole procedure was repeated 20 times. AUC, area under curve; AgingAcc, aging acceleration calculated based on the methylation clock and the actual chronological age.
We set either A+, T+, or N+ as a target to predict using IEAA or EEAA, sex, ethnicity, the number of APOE ɛ4 allele(s), and smoking history. These binary categories were assessed separately instead of the A/T/N multi-category as target, because the A/T/N categorization yields considerable imbalance in its classified cases (e.g., there were as many as 91 cases with A + T + N+, whereas there were 0 cases with A + T–N+, 1 case with A–T–N+, and 12 cases with A–T + N+), and that we cannot evaluate the performance of multi-class predictive model by area under the curve (AUC). We included ethnicity since it is reported to affect the level of DNAme, but not included the general risk factors for coronary heart disease such as hypertension, diabetes, or dyslipidemia, in reference to the earlier study comprehensively examining the features of DNAme as conducted by Horvath et al. [30]. Furthermore, we included the history of smoking because another earlier study reported that it can affect the blood DNAme status [31]. For training a model within the training subset, we used the ElasticNet algorithm using the caret package, where the hyper-parameters were tuned by the caret function automatically. During training, 10-fold cross validation (cv) was repeated. The model’s performance was then evaluated with the AUC [0–1] of the model when applied to the test subset, where the AUC = 1 in complete prediction and AUC = 0 in complete inverse prediction.
To measure the usefulness of aging acceleration to use as one of the variables to include into the model, we compared the AUC by DeLong’ test using R package {pROC} [32] between models with different combination of features, as follows: 1) model A1 using age, sex, smoking history, and ethnicity, 2) model A2 using age, sex, smoking history, ethnicity, and either IEAA or EEAA, 3) model B1 using age, sex, smoking history, ethnicity, and the number of APOE ɛ4 allele(s), and 4) model B2 using age, sex, smoking history, ethnicity, the number of APOE ɛ4 allele(s), and either IEAA or EEAA. By comparing models B1 and B2, we can assess the degree of aging acceleration (IEAA or EEAA) as a helpful feature to predict for A/T/N in the condition where the number of APOE ɛ4 allele(s) is known, and by comparing models A1 and A2 we can see the degree of aging acceleration as a helpful feature to predict for A/T/N in the condition where the number of APOE ɛ4 allele(s) is unknown. We separately set the models depending on the conditions of the number of APOE ɛ4 allele(s) known/unknown, since the information as to the number of APOE ɛ4 allele(s) is often unavailable in clinical situations despite its critical importance to the development of AD [2]. Note that the models were developed and evaluated separately for each of IEAA and EEAA.
As shown in Fig. 1, in a single procedure we compare two pairs of models (A1 versus A1, B1 versus B2) by DeLong’s test for each of 3 targets (A+ or T+ or N+), obtaining 2 * 3 = 6 p-values. These p-values were adjusted for multiple comparison by Benjamini-Hochberg method [33], yielding FDR. Then the whole procedure was repeated for 20 times in total, to evaluate how frequently the models including DNAme (models A2 or B2) may be superior to the models not including DNAme (models A1 or B1), regardless of the randomly-split subsets’ variability.
Statistical analysis
For numerical data, we used median and IQR for summaries and t-tests for comparisons between groups. For categorical data, we used frequency and percentage to summarize, and mainly used Fisher’s exact test for the group comparison. For determining correlations between two numerical vectors, we used Pearson’s correlation. p-value (or FDR) <0.05 was considered as statistically significant if not mentioned otherwise. We used multivariate linear models regressing the epigenetic aging (IEAA or EEAA) to CSF biomarkers (Aβ, p-tau, or t-tau), sex, APOE genotype, ethnicity, and smoking history to evaluate the relationships between the epigenetic aging and each CSF biomarkers.
3RESULTS
Basic characteristics of the included participants and microarray data
In total, n = 317 included samples were classified by the A/T/N system as follows: 43/317 cases (13.6%) were A–T–N–, 26 cases (8.2%) were A + T–N–, 77 cases (24.3%) were A + T + N–, 91 cases (28.7%) were A + T + N+, 67 cases (21.1%) were A–T + N–, 1 case (0.3%) was A–T–N+, and 12 cases (3.8%) were A–T + N+. There were no A + T–N+ cases among those included in this study. By dividing the data into individual items, we found that 194/317 cases (61.2%) were A+, 247 cases (77.9%) were T+, and 104 cases (32.8%) were N+. The concordance between amyloid positivity of the CSF and the amyloid PET had “substantial agreement” with the kappa coefficient = 0.7058.
Basic characteristics of each A/T/N category are summarized in Supplementary Table 1. Most of the included cases were white ethnicity. Median age at index blood sampling was the highest in A + T + N+ cases, followed by that in A + T–N–, and A + T + N–. As for the diagnosis evaluated at the timing nearest to the blood sampling, AD cases most frequently fell into the A + T + N+ category, whereas MCI and cognitive normal (CN) cases occasionally fell into the A–T + N–or A + T–N–or A + T + N–categories.
The difference in methylation level between each of these binary statuses within the whole sample was relatively limited: there was only 1 DMP in A+ versus A–, 0 DMP for T+ versus T–, and 0 DMP for N+ versus N–. This small difference between the target subgroups is also visualized in the MDS plots in Supplementary Figure 1, revealing no clear separation between the two subgroups (A–C).
Modeling with the aging acceleration
We then obtained the aging acceleration data for each sample and evaluated its characteristics. The obtained methylation clock shows a clear correlation with the actual chronological age (Supplementary Figure 2A, coefficients = 0.692, p < 0.001). After adjustment for sex, APOE genotype, ethnicity, smoking history, CSF Aβ, t-tau, and p-tau, there is a weak but significant correlation between the IEAA and CSF Aβ (pg/mL) (coefficients = 0.016 (p = 0.035) in linear regression) (Supplementary Figure 2B, coefficients = 0.126 (p = 0.025) in Pearson’s correlation) and between the EEAA and CSF Aβ value (coefficients = 0.017 (p = 0.017) in linear regression) (data not shown, coefficients = 0.116 (p = 0.041) in Pearson’s correlation). However, there is no significant correlation between the IEAA/EEAA and CSF p-tau or t-tau values (data not shown).
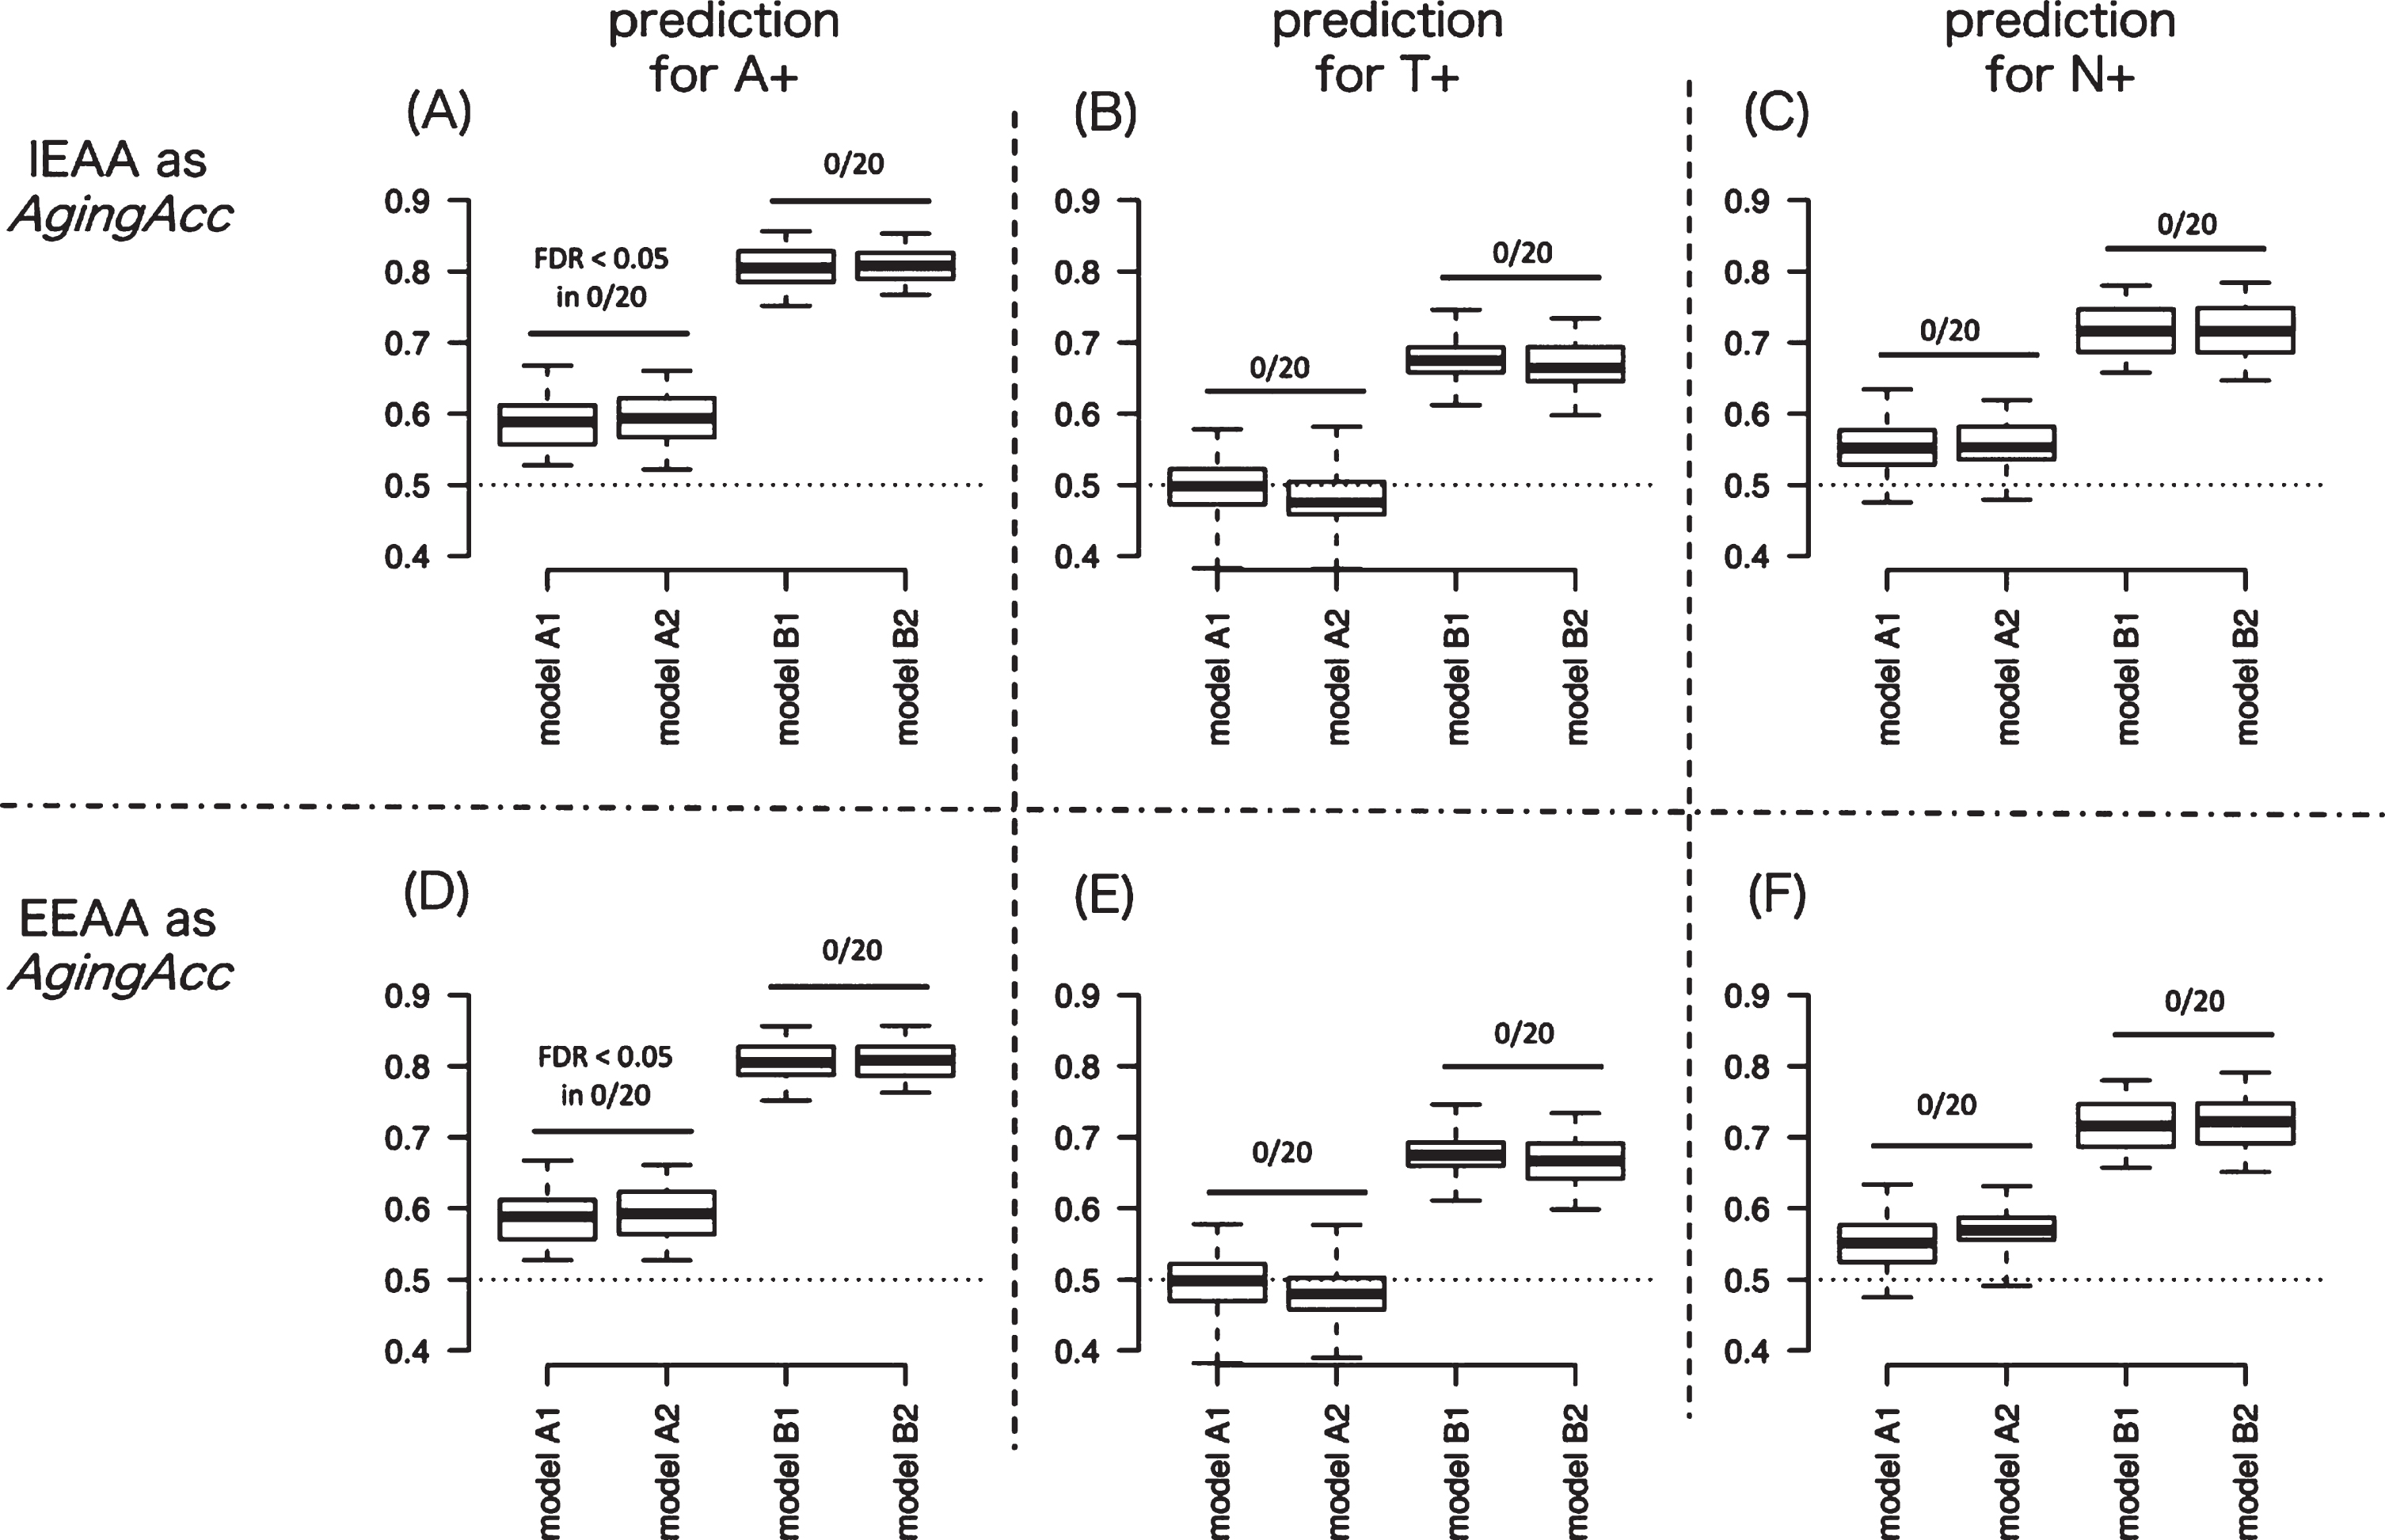
We next evaluated the averaged predictive performance of the 8 different models. Figure 2A represents the AUC results targeting A+ in models A–D, where the methylation clock is IEAA. Figure 2D shows the AUC results targeting A+ in models A–D where the methylation clock is EEAA. Similarly, Fig. 2B shows the AUC results targeting T+ with IEAA, Fig. 2E shows the AUC results targeting T+ with EEAA, Fig. 2C shows N+ with IEAA, and Fig. 2F shows N+ with EEAA. In comparing between models A1 and A2 or between models B1 and B2, significantly high AUC for A+ or T+ or N+ was not observed in any model pairs compared, across 20 times of randomization trials. These results suggest that incorporating methylation clock into models might hardly increase the predictive performance for A+, T+, or N+.
Fig. 2
Degree of AUC performance improvement by incorporating aging acceleration. To measure the usefulness of aging acceleration, we evaluated the AUC between models with different combination of features (model A1–B2). Panels A and D show the AUC results by 20 times of repeated trials predicting for A+ when IEAA (in A) or EEAA (in D) is included as epigenetic aging. Similarly, panels B and E show the AUC results predicting for T+ when IEAA (in B) or EEAA (in E) is included as epigenetic aging. And panels C and F show the AUC results predicting for N+ when IEAA (in C) or EEAA (in F) is included as epigenetic aging. The AUC results were compared between model A versus B and between model C versus D in panels A–F: significantly high AUC for A+ or T+ or N+ was not observed in any model pairs compared (as denoted by ‘FDR < 0.05 in 0/20’ in figures), across 20 times of randomization trials. In the box plot, upper and lower whiskers correspond to the maximum and minimum range, and the range of box corresponds to the interquartile range. Y-axis corresponds to the value of AUC. AUC, area under curve; AgingAcc, aging acceleration calculated based on the methylation clock and the actual chronological age; IEAA, intrinsic epigenetic aging acceleration; EEAA, extrinsic epigenetic aging acceleration; FDR, false-discovery rate.
DISCUSSION
DNA methylation (DNAme) is an epigenetic mechanism involved in the regulation of gene expression during cellular development, activity, aging, and degeneration [7, 14]. Because specific patterns of blood DNAme changes are observed in some systemic diseases such as early cancer or chronic inflammatory diseases, blood DNAme has been expected as a blood biomarker for their diagnosis [18].
As well, in this exploratory study, we aimed to develop a predictive model for each of A/T/N binary statuses in AD patients using methylation clock calculated from the blood-derived DNAme microarray data, in order to explore the potential of peripheral blood DNAme as a practical predictor for AD pathology. Our study used pathologically more closely-related annotations as prediction targets, as well as that we employed the methylation clock of blood as one of the features representative for blood DNAme. As a result, however, the significance of epigenetic aging as a predictor for AD remains poor; the performance improvement by adding epigenetic aging into the model was not achieved for A+, T+ or N+. These results suggest that peripheral blood epigenetic aging is currently not practically useful as it is.
The poor contribution of aging acceleration to performance improvement may be due to the small difference in blood DNAme signatures between those with or without CNS AD pathology, as observed in the small number of DMPs between A+ versus A–, T+ versus T–, and N+ versus N–in our dataset (Supplementary Figure 1A). To date, the significance of blood DNAme for the diagnosis of AD has been inconclusive [20]: the reported genes or CpG sites with differentially methylated vary between earlier studies, and are generally not reproducible [21]. We can explain from the pathophysiological or diagnostic aspects: first, in terms of its pathophysiology, peripheral blood DNAme changes observed in AD patients may essentially be irrelevant of AD pathology of which disease locus should be confined to CNS, in contrast to the lowered plasma Aβ level as repeatedly shown to be associated with the AD pathology in CNS [34]. Despite a good correlation in some of the DNAme signatures in between the brain and blood [14, 15], the alterations in DNAme following the pathological changes may not always be reflected with each other. Indeed, it has been reported that brain DNAme changes associated with AD pathology did not directly reflect the DNAme changes of the peripheral blood [19].
The diagnostic uncertainty for AD might be one of the reasons that led to such weak association between brain and blood DNAme changes: in earlier studies examining blood DNAme for AD, the diagnosis of AD/control for participants from whom the blood samples were obtained has been based mainly on the clinical criteria including NINCDS-ADRDA [21, 35–38] or less frequently on the histopathology of AD [8, 19], but further rarely on the AD biomarkers such as amyloid PET or CSF Aβ [39]. This means the identified differentially-methylated genes may not always be associated with Aβ accumulation in brain, but may rather be related to any causes of cognitive decline including vascular dementia or tauopathy or the common risk factors of cognitive decline such as hypertension, dyslipidemia, diabetes, or smoking. These reasons should also be applied to the limited reproducibility of earlier blood biomarker studies with different modalities such as proteome [40] or metabolome.
For these reasons, in this study we intended to salvage the potentially-confusing link between the changes in brain and blood DNAme by directly targeting the A/T/N-based CNS pathological classification of AD, which eventually failed by itself. Further additional work is needed to determine whether the blood DNAme clock may really have substantial utility in detecting underlying amyloid, tau, or neurodegeneration pathology of AD. We expect there remains some chances by further technical ingenuities, such as including whole DNAme signatures in addition to the epigenetic aging while selecting highly-predictive CpG sites. Since there was considerable inconsistency as to the candidate CpG sites of which methylation level or its variance differs between AD and control subgroups (= differentially methylation sites and differentially variated sites, respectively) as reported by many earlier blood methylation studies [19–21], merely including the large number of CpG sites as selected by the conventional filter model [13] to include into the predictive model might not work, because of the “Large p, Small n” characteristics of high-throughput data like microarray. Instead, unsupervised CpG sites-selection may be helpful to increase the probability of identifying key CpG sites. Furthermore, the difference in the substantial biological significance between cases with barely lower CSF Aβ than threshold and those with barely higher CSF Aβ than threshold would be vague (e.g., consider difference in the biological significance of those with Aβ= 190 (<192) and of those with Aβ= 195 (>192)), setting the continuous value of CSF Aβ, p-tau, and t-tau as the regression targets instead of categorical prediction for binary A/T/N statuses will enhance the flexibility of the models. In addition, including DNAme clock cooperatively with other epigenetic aging markers such as histone modification or chromatic remodeling [12], or integrating data from multiple omics modality (e.g., methylome, proteome, and metabolome), may enhance the potential utility as a blood-based biomarker for CNS AD pathology.
Our study includes some limitations. Not all the potentially confounding factors that can influence the epigenetic aging such as ethnicity or medical history [30] were included in the predictive models, which may have impaired their accuracy. In addition, although we referred to the CSF data alone to categorize participants by the A/T/N system, data of other testing modalities, such as amyloid PET for A+ or structural brain MRI for N+ should also be considered. We also need to address how to deal with the discrepancy of results within the same A/T/N categories (e.g., elevated CSF Aβ but positive amyloid PET). Furthermore, models in this study are evaluated specifically within the ADNI dataset alone of which A/T/N proportion should differ from other cohort studies, so that the external validation in other datasets is essential.
To conclude, despite efforts to derive a good predictive model, our current attempt failed to demonstrate the potential efficacy of the peripheral blood-derived methylation clock as a practical predictor of A/T/N-based CNS biomarkers of AD as it is. Further model refinement is needed to enable the DNAme signatures not limited to epigenetic clock to be used as a predictor for CNS AD pathology.
CONFLICT OF INTEREST
The authors have no conflict of interest to report.
ACKNOWLEDGMENTS
This study is supported by the grants AMED 19dk0207048h0001 and 16dk0207028h0001.
Data collection and sharing for this project was funded by the Alzheimer’s Disease Neuroimaging Initiative (ADNI) (National Institutes of Health Grant U01 AG024904) and DOD ADNI (Department of Defense award number W81XWH-12-2-0012). ADNI is funded by the National Institute on Aging, the National Institute of Biomedical Imaging and Bioengineering, and through generous contributions from the following: AbbVie, Alzheimer’s Association; Alzheimer’s Drug Discovery Foundation; Araclon Biotech; BioClinica, Inc.; Biogen; Bristol-Myers Squibb Company; CereSpir, Inc.; Cogstate; Eisai Inc.; Elan Pharmaceuticals, Inc.; Eli Lilly and Company; EuroImmun; F. Hoffmann-La Roche Ltd and its affiliated company Genentech, Inc.; Fujirebio; GE Healthcare; IXICO Ltd.; Janssen Alzheimer Immunotherapy Research & Development, LLC.; Johnson & Johnson Pharmaceutical Research & Development LLC.; Lumosity; Lundbeck; Merck & Co., Inc.; Meso Scale Diagnostics, LLC.; NeuroRx Research; Neurotrack Technologies; Novartis Pharmaceuticals Corporation; Pfizer Inc.; Piramal Imaging; Servier; Takeda Pharmaceutical Company; and Transition Therapeutics. The Canadian Institutes of Health Research is providing funds to support ADNI clinical sites in Canada. Private sector contributions are facilitated by the Foundation for the National Institutes of Health (www.fnih.org). The grantee organization is the Northern California Institute for Research and Education, and the study is coordinated by the Alzheimer’s Therapeutic Research Institute at the University of Southern California. ADNI data are disseminated by the Laboratory for Neuro Imaging at the University of Southern California.
SUPPLEMENTARY MATERIAL
[1] The supplementary material is available in the electronic version of this article: https://dx.doi.org/10.3233/ADR-200205.
REFERENCES
[1] | Jack CR Jr, Knopman DS , Jagust WJ , Shaw LM , Aisen PS , Weiner MW , Petersen RC , Trojanowski JQ ((2010) ) Hypothetical model of dynamic biomarkers of the Alzheimer’s pathological cascade, Lancet Neurol 9: , 119–128. |
[2] | Jansen WJ , Ossenkoppele R , Knol DL , Tijms BM , Scheltens P , Verhey FR , Visser PJ ; Amyloid Biomarker Study Group, Aalten P , Aarsland D , Alcolea D , Alexander M , Almdahl IS , Arnold SE , Baldeiras I , Barthel H , van Berckel BN , Bibeau K , Blennow K , Brooks DJ , van Buchem MA , Camus V , Cavedo E , Chen K , Chetelat G , Cohen AD , Drzezga A , Engelborghs S , Fagan AM , Fladby T , Fleisher AS , van der Flier WM , Ford L , Förster S , Fortea J , Foskett N , Frederiksen KS , Freund-Levi Y , Frisoni GB , Froelich L , Gabryelewicz T , Gill KD , Gkatzima O , Gómez-Tortosa E , Gordon MF , Grimmer T , Hampel H , Hausner L , Hellwig S , Herukka SK , Hildebrandt H , Ishihara L , Ivanoiu A , Jagust WJ , Johannsen P , Kandimalla R , Kapaki E , Klimkowicz-Mrowiec A , Klunk WE , Köhler S , Koglin N , Kornhuber J , Kramberger MG , Van Laere K , Landau SM , Lee DY , de Leon M , Lisetti V , Lleó A , Madsen K , Maier W , Marcusson J , Mattsson N , de Mendonça A , Meulenbroek O , Meyer PT , Mintun MA , Mok V , Molinuevo JL , Møllergård HM , Morris JC , Mroczko B , Van der Mussele S , Na DL , Newberg A , Nordberg A , Nordlund A , Novak GP , Paraskevas GP , Parnetti L , Perera G , Peters O , Popp J , Prabhakar S , Rabinovici GD , Ramakers IH , Rami L , Resende de Oliveira C , Rinne JO , Rodrigue KM , Rodríguez-Rodríguez E , Roe CM , Rot U , Rowe CC , Rüther E , Sabri O , Sanchez-Juan P , Santana I , Sarazin M , Schröder J , Schütte C , Seo SW , Soetewey F , Soininen H , Spiru L , Struyfs H , Teunissen CE , Tsolaki M , Vandenberghe R , Verbeek MM , Villemagne VL , Vos SJ , van Waalwijk van Doorn LJ , Waldemar G , Wallin A , Wallin ÅK , Wiltfang J , Wolk DA , Zboch M , Zetterberg H ((2015) ) Prevalence of cerebral amyloid pathology in persons without dementia: A meta-analysis, JAMA 313: , 1924–1938. |
[3] | Nativio R , Donahue G , Berson A , Lan Y1 , Amlie-Wolf A , Tuzer F , Toledo JB , Gosai SJ , Gregory BD , Torres C , Trojanowski JQ , Wang LS , Johnson FB , Bonini NM , Berger SL ((2018) ) Dysregulation of the epigenetic landscape of normal aging in Alzheimer’s disease, Nat Neurosci 21: , 497–505. |
[4] | Sperling RA , Aisen PS , Beckett LA , Bennett DA , Craft S , Fagan AM , Iwatsubo T , Jack CR Jr, Kaye J , Montine TJ , Park DC , Reiman EM , Rowe CC , Siemers E , Stern Y , Yaffe K , Carrillo MC , Thies B , Morrison-Bogorad M , Wagster MV , Phelps CH ((2011) ) Toward defining the preclinical stages of Alzheimer’s disease: Recommendations from the National Institute on Aging-Alzheimer’s Association workgroups on diagnostic guidelines for Alzheimer’s disease, Alzheimers Dement 7: , 280–292. |
[5] | Jack CR Jr, Knopman DS , Jagust WJ , Petersen RC , Weiner MW , Aisen PS , Shaw LM , Vemuri P , Wiste HJ , Weigand SD , Lesnick TG , Pankratz VS , Donohue MC , Trojanowski JQ ((2013) ) Tracking pathophysiological processes in Alzheimer’s disease: An updated hypothetical model of dynamic biomarkers, Lancet Neurol 12: , 207–216. |
[6] | Cummings J ((2019) ) The National Institute on Aging-Alzheimer’s Association Framework on Alzheimer’s disease: Application to clinical trials, Alzheimers Dement 15: , 172–178. |
[7] | Ciccarone F , Tagliatesta S , Caiafa P , Zampieri M ((2018) ) DNA methylation dynamics in aging: How far are we from understanding the mechanisms? Mech Ageing Dev 174: , 3–17. |
[8] | Lunnon K , Smith R , Hannon E , De Jager PL , Srivastava G , Volta M , Troakes C , Al-Sarraj S , Burrage J , Macdonald R , Condliffe D , Harries LW , Katsel P , Haroutunian V , Kaminsky Z , Joachim C , Powell J , Lovestone S , Bennett DA , Schalkwyk LC , Mill J ((2014) ) Methylomic profiling implicates cortical deregulation of ANK1 in Alzheimer’s disease, Nat Neurosci 17: , 1164–1170. |
[9] | Mano T , Nagata K , Nonaka T , Tarutani A , Imamura T , Hashimoto T , Bannai T , Koshi-Mano K , Tsuchida T , Ohtomo R , Takahashi-Fujigasaki J , Yamashita S , Ohyagi Y , Yamasaki R , Tsuji S , Tamaoka A , Ikeuchi T , Saido TC , Iwatsubo T , Ushijima T , Murayama S , Hasegawa M , Iwata A ((2017) ) Neuron-specific methylome analysis reveals epigenetic regulation and tau-related dysfunction of BRCA1 in Alzheimer’s disease, Proc Natl Acad Sci U S A 114: , E9645–E9654. |
[10] | Horvath S ((2013) ) DNA methylation age of human tissues and cell types, Genome Biol 14: , R115. |
[11] | Levine ME , Lu AT , Bennett DA , Horvath S ((2015) ) Epigenetic age of the pre-frontal cortex is associated with neuritic plaques, amyloid load, and Alzheimer’s disease related cognitive functioning, Aging (Albany NY) 7: , 1198–1211. |
[12] | Field AE , Robertson NA , Wang T , Havas A , Ideker T , Adams PD ((2018) ) DNA Methylation clocks in aging: Categories, causes, and consequences, Mol Cell 71: , 882–895. |
[13] | Pirooznia M , Yang JY , Yang MQ , Deng Y ((2008) ) A comparative study of different machine learning methods on microarray gene expression data BMC Genomics 9: Suppl 1, S13. |
[14] | Davies MN , Volta M , Pidsley R , Lunnon K , Dixit A , Lovestone S , Coarfa C , Harris RA , Milosavljevic A , Troakes C , Al-Sarraj S , Dobson R , Schalkwyk LC , Mill J ((2012) ) Functional annotation of the human brain methylome identifies tissue-specific epigenetic variation across brain and blood, Genome Biol 13: , R43. |
[15] | Braun PR , Han S , Hing B , Nagahama Y , Gaul LN , Heinzman JT , Grossbach AJ , Close L , Dlouhy BJ , Howard MA 3rd, Kawasaki H , Potash JB , Shinozaki G ((2019) ) Genome-wide DNA methylation comparison between live human brain and peripheral tissues within individuals, Transl Psychiatry 9: , 47. |
[16] | Marioni RE , Shah S , McRae AF , Ritchie SJ , Muniz-Terrera G , Harris SE , Gibson J , Redmond P , Cox SR , Pattie A , Corley J , Taylor A , Murphy L , Starr JM , Horvath S , Visscher PM , Wray NR , Deary IJ ((2015) ) The epigenetic clock is correlated with physical and cognitive fitness in the Lothian Birth Cohort 1936, Int J Epidemiol 44: , 1388–1396. |
[17] | McCartney DL , Stevenson AJ , Walker RM , Gibson J , Morris SW , Campbell A , Murray AD , Whalley HC , Porteous DJ , McIntosh AM , Evans KL , Deary IJ , Marioni RE ((2018) ) Investigating the relationship between DNA methylation age acceleration and risk factors for Alzheimer’s disease, Alzheimers Dement (Amst) 10: , 429–437. |
[18] | Li L , Choi JY , Lee KM , Sung H , Park SK , Oze I , Pan KF , You WC , Chen YX , Fang JY , Matsuo K , Kim WH , Yuasa Y , Kang D ((2012) ) DNA methylation in peripheral blood: A potential biomarker for cancer molecular epidemiology, J Epidemiol 22: , 384–394. |
[19] | Yu L , Chibnik LB , Yang J , McCabe C , Xu J , Schneider JA , De Jager PL , Bennett DA ((2016) ) Methylation profiles in peripheral blood CD4+ lymphocytes versus brain: The relation to Alzheimer’s disease pathology. Alzheimers Dement 12: , 942–951. |
[20] | Yokoyama AS , Rutledge JC , Medici V ((2017) ) DNA methylation alterations in Alzheimer’s disease, Environ Epigenet 3: , dvx008. |
[21] | Fransquet PD , Lacaze P , Saffery R , McNeil J , Woods R , Ryan J ((2018) ) Blood DNA methylation as a potential biomarker of dementia: A systematic review, Alzheimers Dement 14: , 81–103. |
[22] | Jack CR Jr, Bennett DA , Blennow K , Carrillo MC , Feldman HH , Frisoni GB , Hampel H , Jagust WJ , Johnson KA , Knopman DS , Petersen RC , Scheltens P , Sperling RA , Dubois B ((2016) ) A/T/N: An unbiased descriptive classification scheme for Alzheimer disease biomarkers, Neurology 87: , 539–547. |
[23] | Shaw LM , Vanderstichele H , Knapik-Czajka M , Clark CM , Aisen PS , Petersen RC , Blennow K , Soares H , Simon A , Lewczuk P , Dean R , Siemers E , Potter W , Lee VM , Trojanowski JQ ; Alzheimer’s Disease Neuroimaging Initiative ((2009) ) Cerebrospinal fluid biomarker signature in Alzheimer’s disease neuroimaging initiative subjects, Ann Neurol 65: , 403–413. |
[24] | McEwen LM , Jones MJ , Lin DTS , Edgar RD , Husquin LT , MacIsaac JL , Ramadori KE , Morin AM , Rider CF , Carlsten C , Quintana-Murci L , Horvath S , Kobor MS ((2018) ) Systematic evaluation of DNA methylation age estimation with common preprocessing methods and the Infinium MethylationEPIC BeadChip array, Clin Epigenetics 10: , 123. |
[25] | Aryee MJ , Jaffe AE , Corrada-Bravo H , Ladd-Acosta C , Feinberg AP , Hansen KD , Irizarry RA ((2014) ) Minfi: A flexible and comprehensive Bioconductor package for the analysis of Infinium DNA methylation microarrays, Bioinformatics 30: , 1363–1369. |
[26] | Morris TJ , Butcher LM , Feber A , Teschendorff AE , Chakravarthy AR , Wojdacz TK , Beck S ((2014) ) ChAMP: 450k chip analysis methylation pipeline, Bioinformatics 30: , 428–430. |
[27] | Leek JT , Johnson WE , Parker HS , Jaffe AE , Storey JD ((2012) ) The sva package for removing batch effects and other unwanted variation in high-throughput experiments, Bioinformatics 28: , 882–883. |
[28] | Horvath S , Ritz BR ((2015) ) Increased epigenetic age and granulocyte counts in the blood of Parkinson’s disease patients, Aging (Albany NY) 7: , 1130–1142. |
[29] | Kuhn M ((2018) ) caret: Classification and Regression Training. R package version 6.0-81. https://CRAN.R-project.org/package=caret |
[30] | Horvath S , Gurven M , Levine ME , Trumble BC , Kaplan H , Allayee H , Ritz BR , Chen B , Lu AT , Rickabaugh TM , Jamieson BD , Sun D , Li S , Chen W , Quintana-Murci L , Fagny M , Kobor MS , Tsao PS , Reiner AP , Edlefsen KL , Absher D , Assimes TL ((2016) ) An epigenetic clock analysis of race/ethnicity, sex, and coronary heart disease, Genome Biol 17: , 171. |
[31] | van Dongen J , Nivard MG , Willemsen G , Hottenga JJ , Helmer Q , Dolan CV , Ehli EA , Davies GE , van Iterson M , Breeze CE , Beck S ; BIOS Consortium, Suchiman HE , Jansen R , van Meurs JB , Heijmans BT , Slagboom PE , Boomsma DI ((2016) ) Genetic and environmental influences interact with age and sex in shaping the human methylome, Nat Commun 7: , 11115. |
[32] | Robin X , Turck N , Hainard A , Tiberti N , Lisacek F , Sanchez JC , Müller M ((2011) ) pROC: An open-source package for R and S+ to analyze and compare ROC curves, BMC Bioinformatics 12: , 77. |
[33] | Benjamini Y , Drai D , Elmer G , Kafkafi N , Golani I ((2001) ) Controlling the false discovery rate in behavior genetics research, Behav Brain Res 125: , 279–284. |
[34] | Hanon O , Vidal JS , Lehmann S , Bombois S , Allinquant B , Tréluyer JM , Gelé P , Delmaire C , Blanc F , Mangin JF , Buée L , Touchon J , Hugon J , Vellas B , Galbrun E , Benetos A , Berrut G , Paillaud E , Wallon D , Castelnovo G , Volpe-Gillot L , Paccalin M , Robert PH , Godefroy O , Dantoine T , Camus V , Belmin J , Vandel P , Novella JL , Duron E , Rigaud AS , Schraen-Maschke S , Gabelle A ; BALTAZAR study group ((2018) ) Plasma amyloid levels within the Alzheimer’s process and correlations with central biomarkers, Alzheimers Dement 14: , 858–868. |
[35] | Hou Y , Chen H , He Q , Jiang W , Luo T , Duan J , Mu N , He Y , Wang H ((2013) ) Changes in methylation patterns of multiple genes from peripheral blood leucocytes of Alzheimer’s disease patients, Acta Neuropsychiatr 25: , 66–76. |
[36] | Di Francesco A , Arosio B , Falconi A , Micioni Di Bonaventura MV , Karimi M , Mari D , Casati M , Maccarrone M , D’Addario C ((2015) ) Global changes in DNA methylation in Alzheimer’s disease peripheral blood mononuclear cells, Brain Behav Immun 45: , 139–144. |
[37] | Kobayashi N , Shinagawa S , Nagata T , Shimada K , Shibata N , Ohnuma T , Kasanuki K , Arai H , Yamada H , Nakayama K , Kondo K ((2016) ) Development of biomarkers based on DNA methylation in the NCAPH2/LMF2 promoter region for diagnosis of Alzheimer’s disease and amnesic mild cognitive impairment, PLoS One 11: , e0146449. |
[38] | Tannorella P , Stoccoro A , Tognoni G , Petrozzi L , Salluzzo MG , Ragalmuto A , Siciliano G , Haslberger A , Bosco P , Bonuccelli U , Migliore L , Coppedè F ((2015) ) Methylation analysis of multiple genes in blood DNA of Alzheimer’s disease and healthy individuals, Neurosci Lett 600: , 143–147. |
[39] | Konki M , Malonzo M , Karlsson IK , Lindgren N , Ghimire B , Smolander J , Scheinin NM , Ollikainen M , Laiho A , Elo LL , Lönnberg T , Röyttä M , Pedersen NL , Kaprio J , Lähdesmäki H , Rinne JO , Lund RJ ((2019) ) Peripheral blood DNA methylation differences in twin pairs discordant for Alzheimer’s disease, Clin Epigenetics 11: , 130. |
[40] | Soares HD , Chen Y , Sabbagh M , Roher A , Schrijvers E , Breteler M ((2009) ) Identifying early markers of Alzheimer’s disease using quantitative multiplex proteomic immunoassay panels, Ann N Y Acad Sci 1180: , 56–67. |
[41] | Buerger K , Zinkowski R , Teipel SJ , Tapiola T , Arai H , Blennow K , Andreasen N , Hofmann-Kiefer K , DeBernardis J , Kerkman D , McCulloch C , Kohnken R , Padberg F , Pirttilä T , Schapiro MB , Rapoport SI , Möller HJ , Davies P , Hampel H ((2002) ) Differential diagnosis of Alzheimer disease with cerebrospinal fluid levels of tau protein phosphorylated at threonine 231, Arch Neurol 59: , 1267–1272. |


