
Gliosis Precedes Amyloid-β Deposition and Pathological Tau Accumulation in the Neuronal Cell Cycle Re-Entry Mouse Model of Alzheimer’s Disease
Abstract
Background:
The presence of cell cycle markers in postmortem Alzheimer’s disease (AD) brains suggest a potential role of cell cycle activation in AD. It was shown that cell cycle activation in postmitotic neurons in mice produces Aβ and tau pathologies from endogenous mouse proteins in the absence of AβPP or tau mutations.
Objective:
In this study, we examined the microglial and astrocytic responses in these mice since neuroinflammation is another key pathological feature in AD.
Methods:
Our neuronal cell cycle re-entry (NCCR) mouse model are bitransgenic mice heterozygous for both Camk2a-tTA and TRE-SV40T. Using this tet-off system, we triggered NCCR in our animals via neuronal expression of SV40T starting at 1 month of age. TRE-SV40T Tg mice were used as SV40T transgene controls. The animals were examined at following time points: 2, 3, 4, 6, and 12 months of age. The microglia and astrocyte responses in our mice were determined by image analysis and stereology on brain sections immunofluorescently labeled using the following antibodies: Iba1, CD45, CD68, MHCII, and GFAP. Cellular senescent marker p16 was also used in this study.
Results:
Our NCCR mice demonstrate early and persistent activation of microglia and astrocytes. Additionally, proinflammatory and senescent microglia phenotype and brain leukocyte infiltration is present at 12 months of age.
Conclusion:
In the absence of FAD gene mutations, our NCCR mice simultaneously display many of the pathological changes associated with AD, such as ectopic neuronal cell cycle re-entry, Aβ and tau pathologies, neuroinflammation, and neurodegeneration. These animals represent a promising alternative AD mouse model.
INTRODUCTION
Alzheimer’s disease (AD) is the most common form of dementia and is clinically defined by memory loss and cognitive impairment. The main pathological hallmarks of AD are amyloid-β (Aβ) plaques, neurofibrillary tangles, and neuroinflammation. Neuroinflammation in AD is characterized by gliosis as well as brain infiltration of leukocytes. The AD cases are categorized as either familial or sporadic, with sporadic form representing 95% of the AD cases. A subset of familial AD (FAD) cases are characterized by disease causing gene mutations in amyloid-β protein precursor (A βPP) and presenilin (PSEN) genes. The discovery of causative familial A βPP and PSEN gene mutations in FAD patients highlighted Aβ as a potential pathogenic driver of AD. Transgenic expression of these gene mutations in mice helped determine early-on the significant role of A βPP and PSEN gene mutations on amyloidogenic process underlying Aβ deposition and plaque formation [1– 3]. Despite the prevalence of Aβ plaque pathology in the AβPP mouse models, these mice do not develop tangle-like pathology [4]. Findings from various AβPP mouse models suggest that the Aβ pathology, however severe, is insufficient for generating tangle pathology.
AD is a complex disorder with many different abnormal pathological changes that manifest during the aging process. This poses a significant challenge in identifying pathogenic mechanisms in the context of sporadic AD. Furthermore, the commonly used AD model in the field represents the FAD pathogenic mechanism affecting a subset of the 5% of the AD cases while 95% of the AD cases are sporadic with no underlying genetic cause. The presence of various cell cycle markers in postmortem AD brains suggests a potential role of neuronal cell cycle re-entry as a possible non-genetic pathogenic process in AD [5– 15].
The presence of neuronal cell cycle markers in AD prompted us to develop a mouse model for directly testing the pathogenic role of chronic neuronal cell cycle re-entry in AD. Our conditional transgenic mice express SV40 large T antigen (SV40T) regulated by tetracycline response element (TRE) (TRE-SV40T or “TAg” mice) [16]. SV40T is a powerful oncoprotein that activates the cell cycle by perturbing the retinoblastoma protein (pRb)- and p53-mediated tumor suppressor pathways [17]. Using the tet-off system, we induced ectopic cell cycle activation in postmitotic neurons via neuronally targeted SV40T expression [16]. This was accomplished by crossing the TAg mice with mice expressing the tetracycline-controlled transactivator (tTA) under the control of CamKinase IIα (Camk2a) promoter (Camk2a-tTA mice or “OFF” mice) [18]. When combined with the tet-off gene expression system, SV40T-mediated aberrant cell cycle can be induced in the resulting neuronal cell cycle-re-entry (NCCR) mice by removing doxycycline from the diet post-weaning [16].
Our previously published work demonstrate that SV40T expression in postmitotic neurons increases the brain expression of various cell cycle regulatory proteins and neuronal DNA synthesis [16]. Furthermore, we demonstrated that these mice also produce AD-like amyloid and tau pathologies with aging [16]. Importantly, the Aβ and tau pathologies in these animals were generated from endogenous mouse proteins in the absence of FAD mutations. It has also been demonstrated that SV40T-mediated forced cell cycle re-entry in primary neuron cultures can promote hyperploidy [19] similar to what has been observed in AD and aged brains [10, 20].
Chronic neuroinflammation is thought to be a risk factor for AD [21, 22]. It has been shown that microglia activation is observed in the prodromal and preclinical stages of AD [23] and microglia activation is positively correlated with tau aggregation and amyloid deposition [24].The role of chronic inflammation in AD is highlighted by identification of APOE4, TREM2, and CD33 as genetic risk factors for sporadic AD [25, 26]. Although these gene mutations by themselves do not produce pathological hallmarks of AD in mice, the presence of these gene mutations modulate Aβ plaque formation and clearance in the AβPP mice [27– 30]. Thus, a large body of research suggests a significant role of inflammation process in AD. A network analysis using epigenetic and transcriptomic datasets from AD brains identified a major hub genes that are associated with molecular pathways involved in cell cycle re-entry and inflammation [31]. Others have shown that inducing neuronal cell cycle re-entry in vivo using either c-Myc or c-Abl leads to gliosis and neuronal loss [32, 33]. Here we demonstrate that early and persistent gliosis is also observed in our NCCR mouse model of AD. In comparison to AβPP mouse models and other cell cycle re-entry models using either c-Myc or c-Abl, our SV40T-mediated NCCR mouse model of AD simultaneously display many of the pathological changes associated with AD in the absence of FAD gene mutations. These animals represent an alternative mouse model for sporadic AD.
MATERIALS AND METHODS
Animals
All mice were maintained on a C57BL/6N genetic background. Camk2a-tTA mice are available from the Jackson Laboratory (Bar Harbor, ME). TRE-SV40T mice were previously generated and characterized [16]. Camk2a-tTA mice and TRE-SV40T mice were maintained as heterozygotes in separate colonies. Camk2a-tTA mice were crossed with TRE-SV40T mice to generate bitransgenic mice heterozygous for both Camk2a-tTA and TRE-SV40T (NCCR mouse model). Camk2a-tTAxTRE-SV40T breeding pairs were maintained on doxycycline (Dox) diet. The offspring was also maintained on dox diet until 1 month of age, at which time they were switched to standard (std) diet to induce cell cycle re-entry in postmitotic neurons via SV40T expression. TRE-SV40T litter mate mice were used as controls in this study. All animals were housed in individually ventilated cages under specific-pathogen-free condition and maintained on a 12-h light cycle with access to food and water ad libitum. PCR analysis was performed on genomic DNA isolated from tail tissue collected at the time of weaning and again at the animal’s end point. All animal protocols were approved by the Institutional Animal Care and Use Committee at Central Michigan University.
Antibodies
The following antibodies were used in this study: Iba1 and p16 (ab178846 and ab108349, respectively, abcam, Cambridge, MA, USA); CD68 (MCAA1957GA, Bio-Rad, Hercules, CA, USA); MHCII (#556999, BD Biosciences, San Jose, CA, USA); CD45 (YW62.3, Thermo Fisher Scientific, Waltham, MA, USA); SV40T and PCNA (Pab 101 and PC10, respectively, Santa Cruz Biotechnology, Dallas, TX, USA); GFAP (MAB360) (Millipore, Billerica, MA, USA); Alexa Fluor conjugated goat-anti mouse 488, goat-anti rabbit 594, and goat-anti-rat 594 (Thermo Fisher Scientific). PHF1 antibody (generously provided by Dr. Peter Davies, The Feinstein Institute for Medical Research, Manhasset, NY); 4G8 (aa17-24 Aβ, Biolegend, San Diego, CA); Aβ42 (C42, C-terminal human Aβ42, IBL-America, Minneapolis, MN)
Immunofluorescence
Immunofluorescence was performed as previously reported [34]. The images were captured on a Zeiss AxioCam M2 microscope (Carl Zeiss Inc., Thornwood, NY) using a 20X objective and digitized using the ZEN software (Carl Zeiss Inc.). Confocal images were captured on a 60X objective, using a Nikon Eclipse Ti inverted microscope on a Nikon A1R confocal, using NIS-Elements software (version 5.20.00, Nikon, Melville, NY, USA).
Image analysis using Image J
For neuroinflammation quantification, a total of 20 sites were sampled for each animal and used as independent data points. Image J software was used for quantifying area fraction of GFAP, Iba1, and MHCII immunofluorescent labeled sections [35]. For each immunofluorescence stain, images were converted to 8-bit grey scale, and then thresholded. Images of GFAP immunofluorescent and MHCII immunofluorescent sections were thresholded to minimize background and artifact. Threshold intensity was adjusted similarly for each sample and the area fraction occupied by the GFAP thresholded and MHCII thresholded signal was reported. For the analysis of Iba1 immunofluorescence labeled sections, threshold intensity of each image was adjusted so that just the soma of Iba1 stained cells were included. The area fraction occupied by the Iba1 thresholded signal was reported as Iba1 somatic area. The dimensions of each of the 20× images (region of interest) evaluated were 991.59 μm by 795.58 μm.
Immunohistochemistry
Prior to staining, heat-induced epitope retrieval was done on tissue being probed for SV40T and PCNA. Sections were incubated in 10mM sodium citrate, pH 6.0, in a 95°C water bath for 10 min, then let cool at room temperature (RT) for 20 min. Following this, sections were rinsed in 1X TBS three times for 15 min, followed by permeabilization in a 3% H2O2/0.3% triton-x100/1X TBS solution for 30 min at RT. Following a rinse three times in 1X TBS for 5 min, the sections were blocked in blocking solution for 1 h. Sections were incubated overnight at 4°C on a shaker with primary antibody in the blocking solution. On the following day, the sections were rinsed one time in 0.015% triton-x100/1X TBS solution followed by two rinses in 1X TBS for 15 min at RT. The sections were incubated with goat anti-mouse biotin conjugated secondary antibody (1 : 500; Southern Biotechnology, Birmingham, AL, USA) for 2 h at RT. Next, they were rinsed one time in 0.015% triton-x100/1X TBS solution followed by two rinses in 1X TBS for 15 min. Sections were then incubated in VECTASTAIN® Elite® ABC HRP solution (Vector Laboratories, Burlingame, CA, USA) for 1 h. Following a rinse in 1XTBS 4 times for 10 min, sections were Piercetrademark DAB Substrate solution (Thermo Fisher Scientific), which was prepared following manufacturer instructions. Tissue incubation times varied depending on the antibody reaction and background development. Finally, tissue was rinses twice in 1XTBS for 10 min and mounted on Super frost Plus microscope slides (Thermo Fisher Scientific) and left to air dry overnight. The next day, slides were incubated in xylenes for 2 min and cover-slipped using Permount® (Thermo Fisher Scientific). Bright field images were images were captured on a Zeiss AxioCam M2 microscope (Carl Zeiss Inc.) using a 20X objective and digitized using the ZEN software (Carl Zeiss Inc.).
RESULTS
SV40T expression induces neuronal cell cycle re-entry and early microglia activation
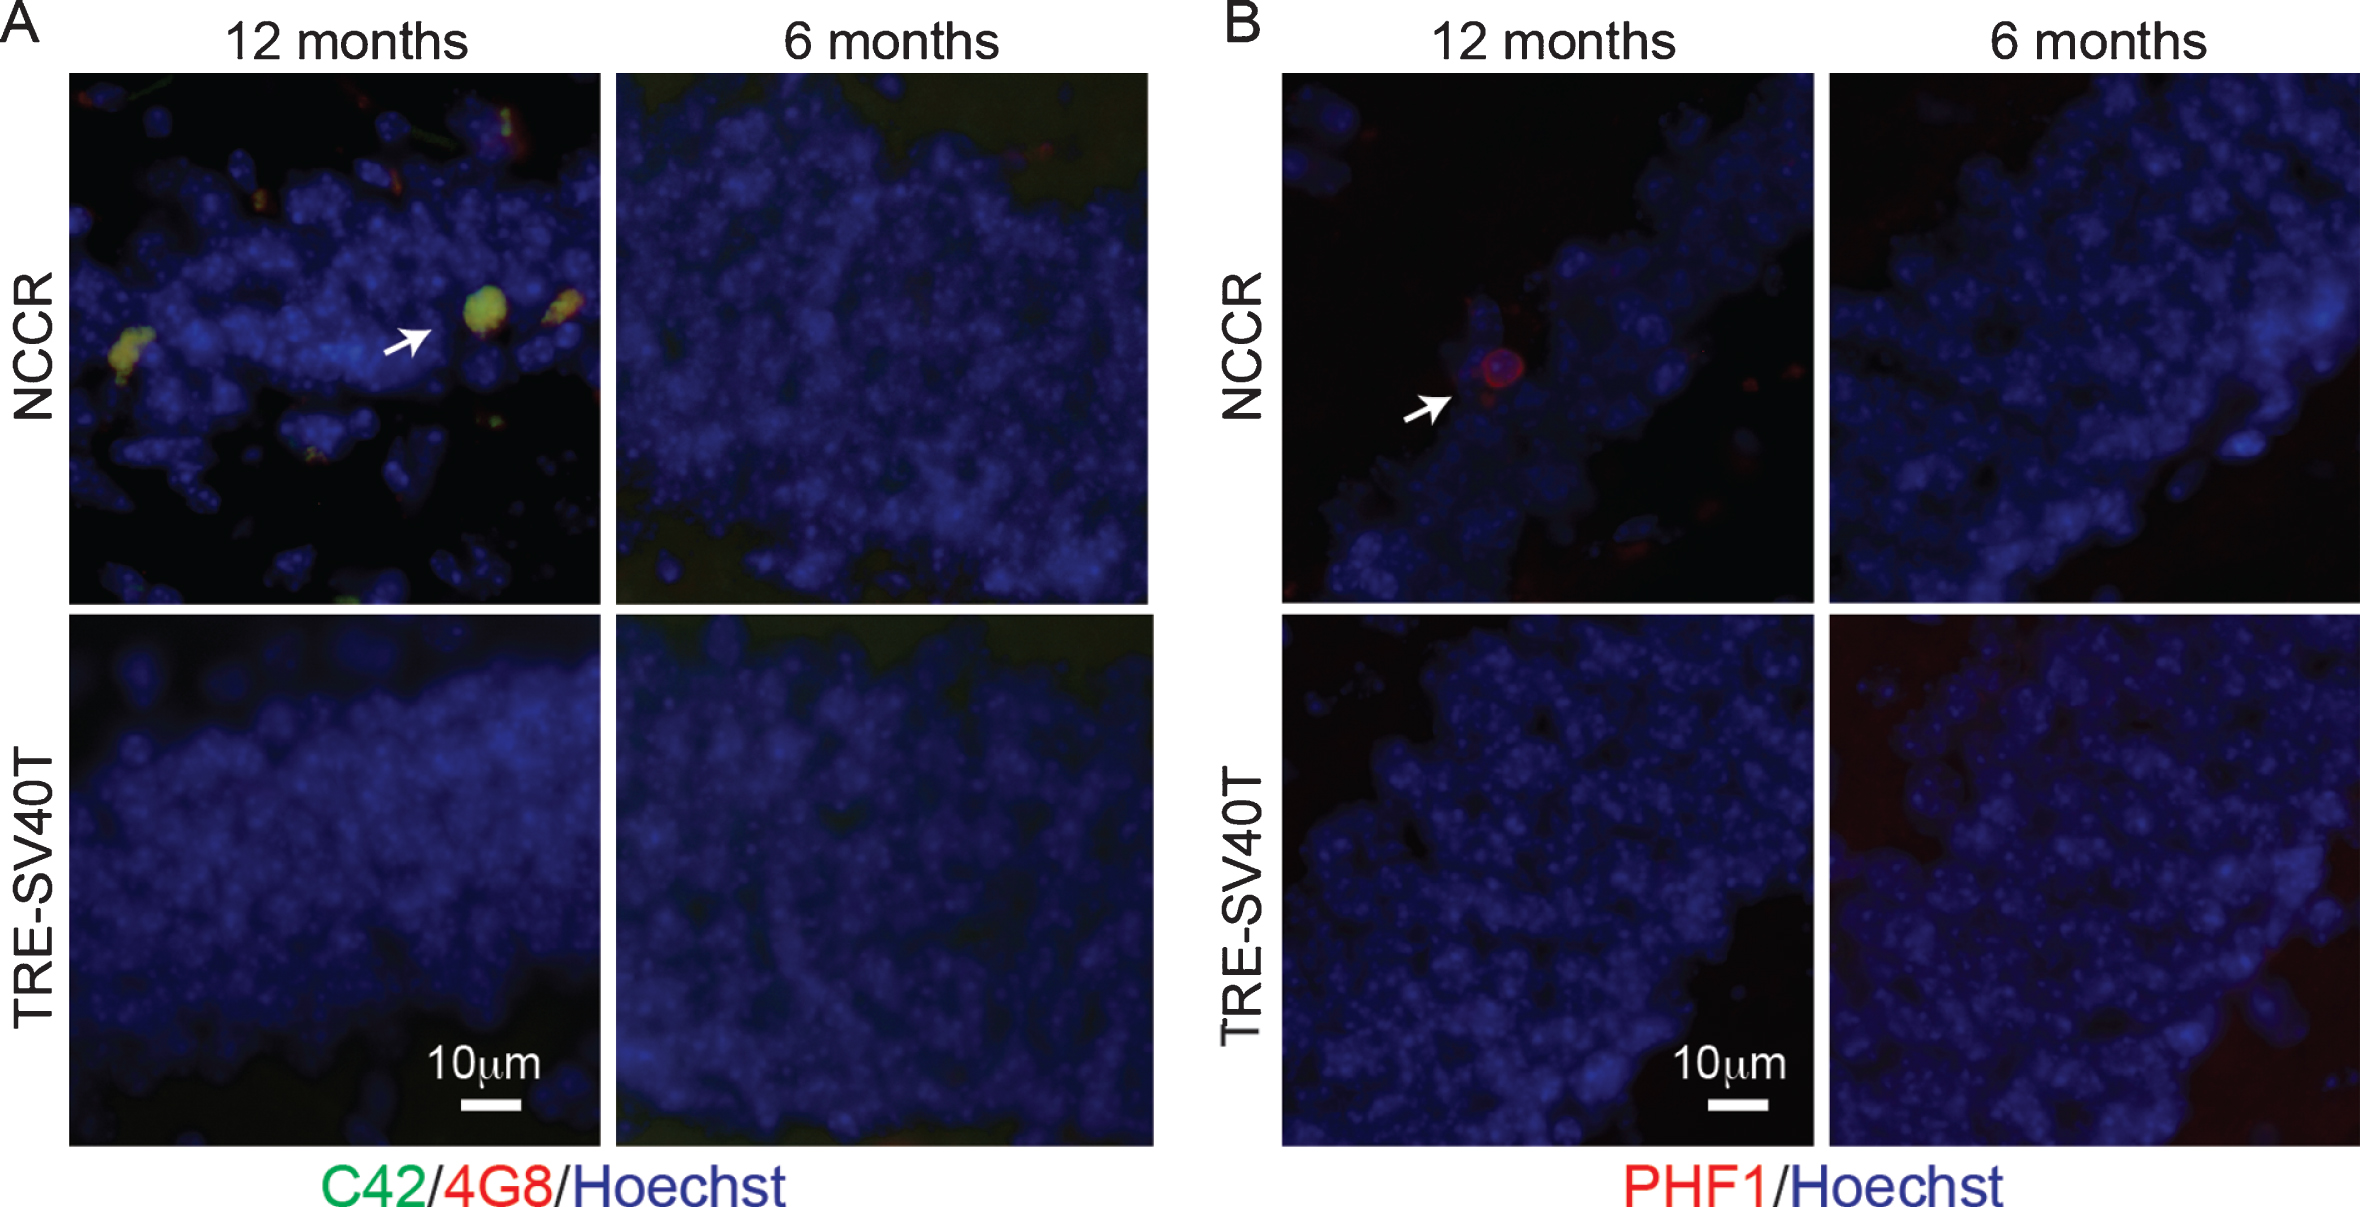
Our previous work demonstrated AD-like Aβ and tau pathologies generated from endogenous mouse proteins in the NCCR mouse model of AD [16]. Examination of the neuropathology in the NCCR mice confirms the presence of Aβ deposits and PHF-1-positive pathological tau accumulation in the 12-month-old NCCR mouse model (Fig. 1A, B). Aβ double-labeling immunofluorescence was done using 4G8 (recognizes aa17– 24 of Aβ domain) and C42 (recognizes C-terminal domain of Aβ42) to identify Aβ42. Aβ was detected in the dentate gyrus of 12-month-old NCCR mouse brain sections (Fig. 1A, arrow), but not in 6-month-old NCCR mice and in age-matched TAg control littermates (TRE-SV40T mice) (Fig. 1A). PHF-1 antibody labels pSer396/404 tau, which is associated with paired helical filaments in AD [36]. PHF-1-positive pathological phospho-tau labeled neurons were observed in the dentate gyrus of 12-month-old NCCR mice (Fig. 1B, arrow), but not in 6-month old NCCR mice and in age-matched TAg control littermates (Fig. 1B).
Fig.1
NCCR mouse model of AD display Aβ and pathological tau at 12 months of age. A) Immunofluorescence image showing Aβ deposits in the dentate gyrus of 12-month-old animals. Aβ was detected via double immunofluorescence using C42 (c-terminal Aβ42, rabbit antibody) and 4G8 (aa17– 24 Aβ, mouse antibody) (arrow). Aβ stain was not detected in 6-month-old NCCR mice and age-matched Tag control mice (TRE-SV40T Tg mice littermates) maintained on the same diet regimen. B) Immunofluorescence labeling shows PHF-1-positive neurons in the dentate gyrus of 12-month-old NCCR mice (arrow). PHF-1 immunolabeling was not detected in 6-month-old NCCR mice and age-matched TAg control mice (TRE-SV40T Tg mice littermates) maintained on the same diet regimen. Number of animals examined; 6 months of age: NCCR (n = 2), TAg control (n = 2); 12 months of age: NCCR (n = 2), TAg control (n = 2).
The gliosis in the brains of these animals were not examined in our previously published study [16]. Since the neuronal SV40T expression in NCCR mice is regulated by doxycycline (dox), we used this conditional expression system to determine whether SV40T-mediated neuronal cell cycle re-entry induces astrocyte and microglia activation. Examination of 4-month-old NCCR animals show neuronal expression of SV40T (Fig. 2A) and PCNA (Fig. 2B). SV40T and PCNA expression was not detected in the TAg control mice (Fig. 2A, 2B). The neuronal expression of PCNA in 4-month-old animals following dox removal at 1 month of age suggests persistent neuronal cell cycle activation in the NCCR animals.
Fig.2
Forced neuronal cell cycle re-entry induces microglia activation. A) Immunofluorescence labeling shows SV40T and NeuN co-label (arrows) in 4-month-old NCCR mice (n = 4). TAg control animals (n = 4) do not show SV40T immunofluorescence. B) Immunofluorescence labeling shows PCNA and NeuN co-label (arrows) in 4-month-old NCCR mice (n = 4). TAg control animals (n = 4) do not show PCNA immunofluorescence. C, a) NCCR animals (n = 3) maintained on standard (Std) diet starting at 1 month of age and examined at 3 months of age show persistent expression of SV40T and PCNA (marker of cell cycle activation) in the cortex (shown) and hippocampus (data not shown). C, b) The SV40T expression is tightly regulated by dox diet in the NCCR mice. SV40T and PCNA stains are absent in a separate group of NCCR mice (n = 3) that are put back on dox diet at 2 months of age and examined at 3 months of age. C, c) The NCCR animals that are continuously maintained on dox diet (n = 3) do not show any SV40T or PCNA stains. D, a) The same animals in Ca show Iba-1 labeled rod-like activated microglia in the hippocampus. TAg control animals maintained in the same diet regimen do not show rod-like microglia. D, b) The rod-like microglia in the NCCR animals become morphologically less pronounced in the hippocampus when they are put back on dox diet for 1 month. D, c) When the NCCR animals are always maintained on dox diet (SV40T is chronically turned off), the microglia display morphological features and distribution patterns typical of resting microglia that are similar to TAg control animals (TRE-SV40T) under different diet treatment conditions. E) Schematic showing the different diet treatments used in the experiment. Lower case letters next to the treatment conditions correspond to the lower case letters shown in the image panels in C and D. Scale bar = 100 μm.
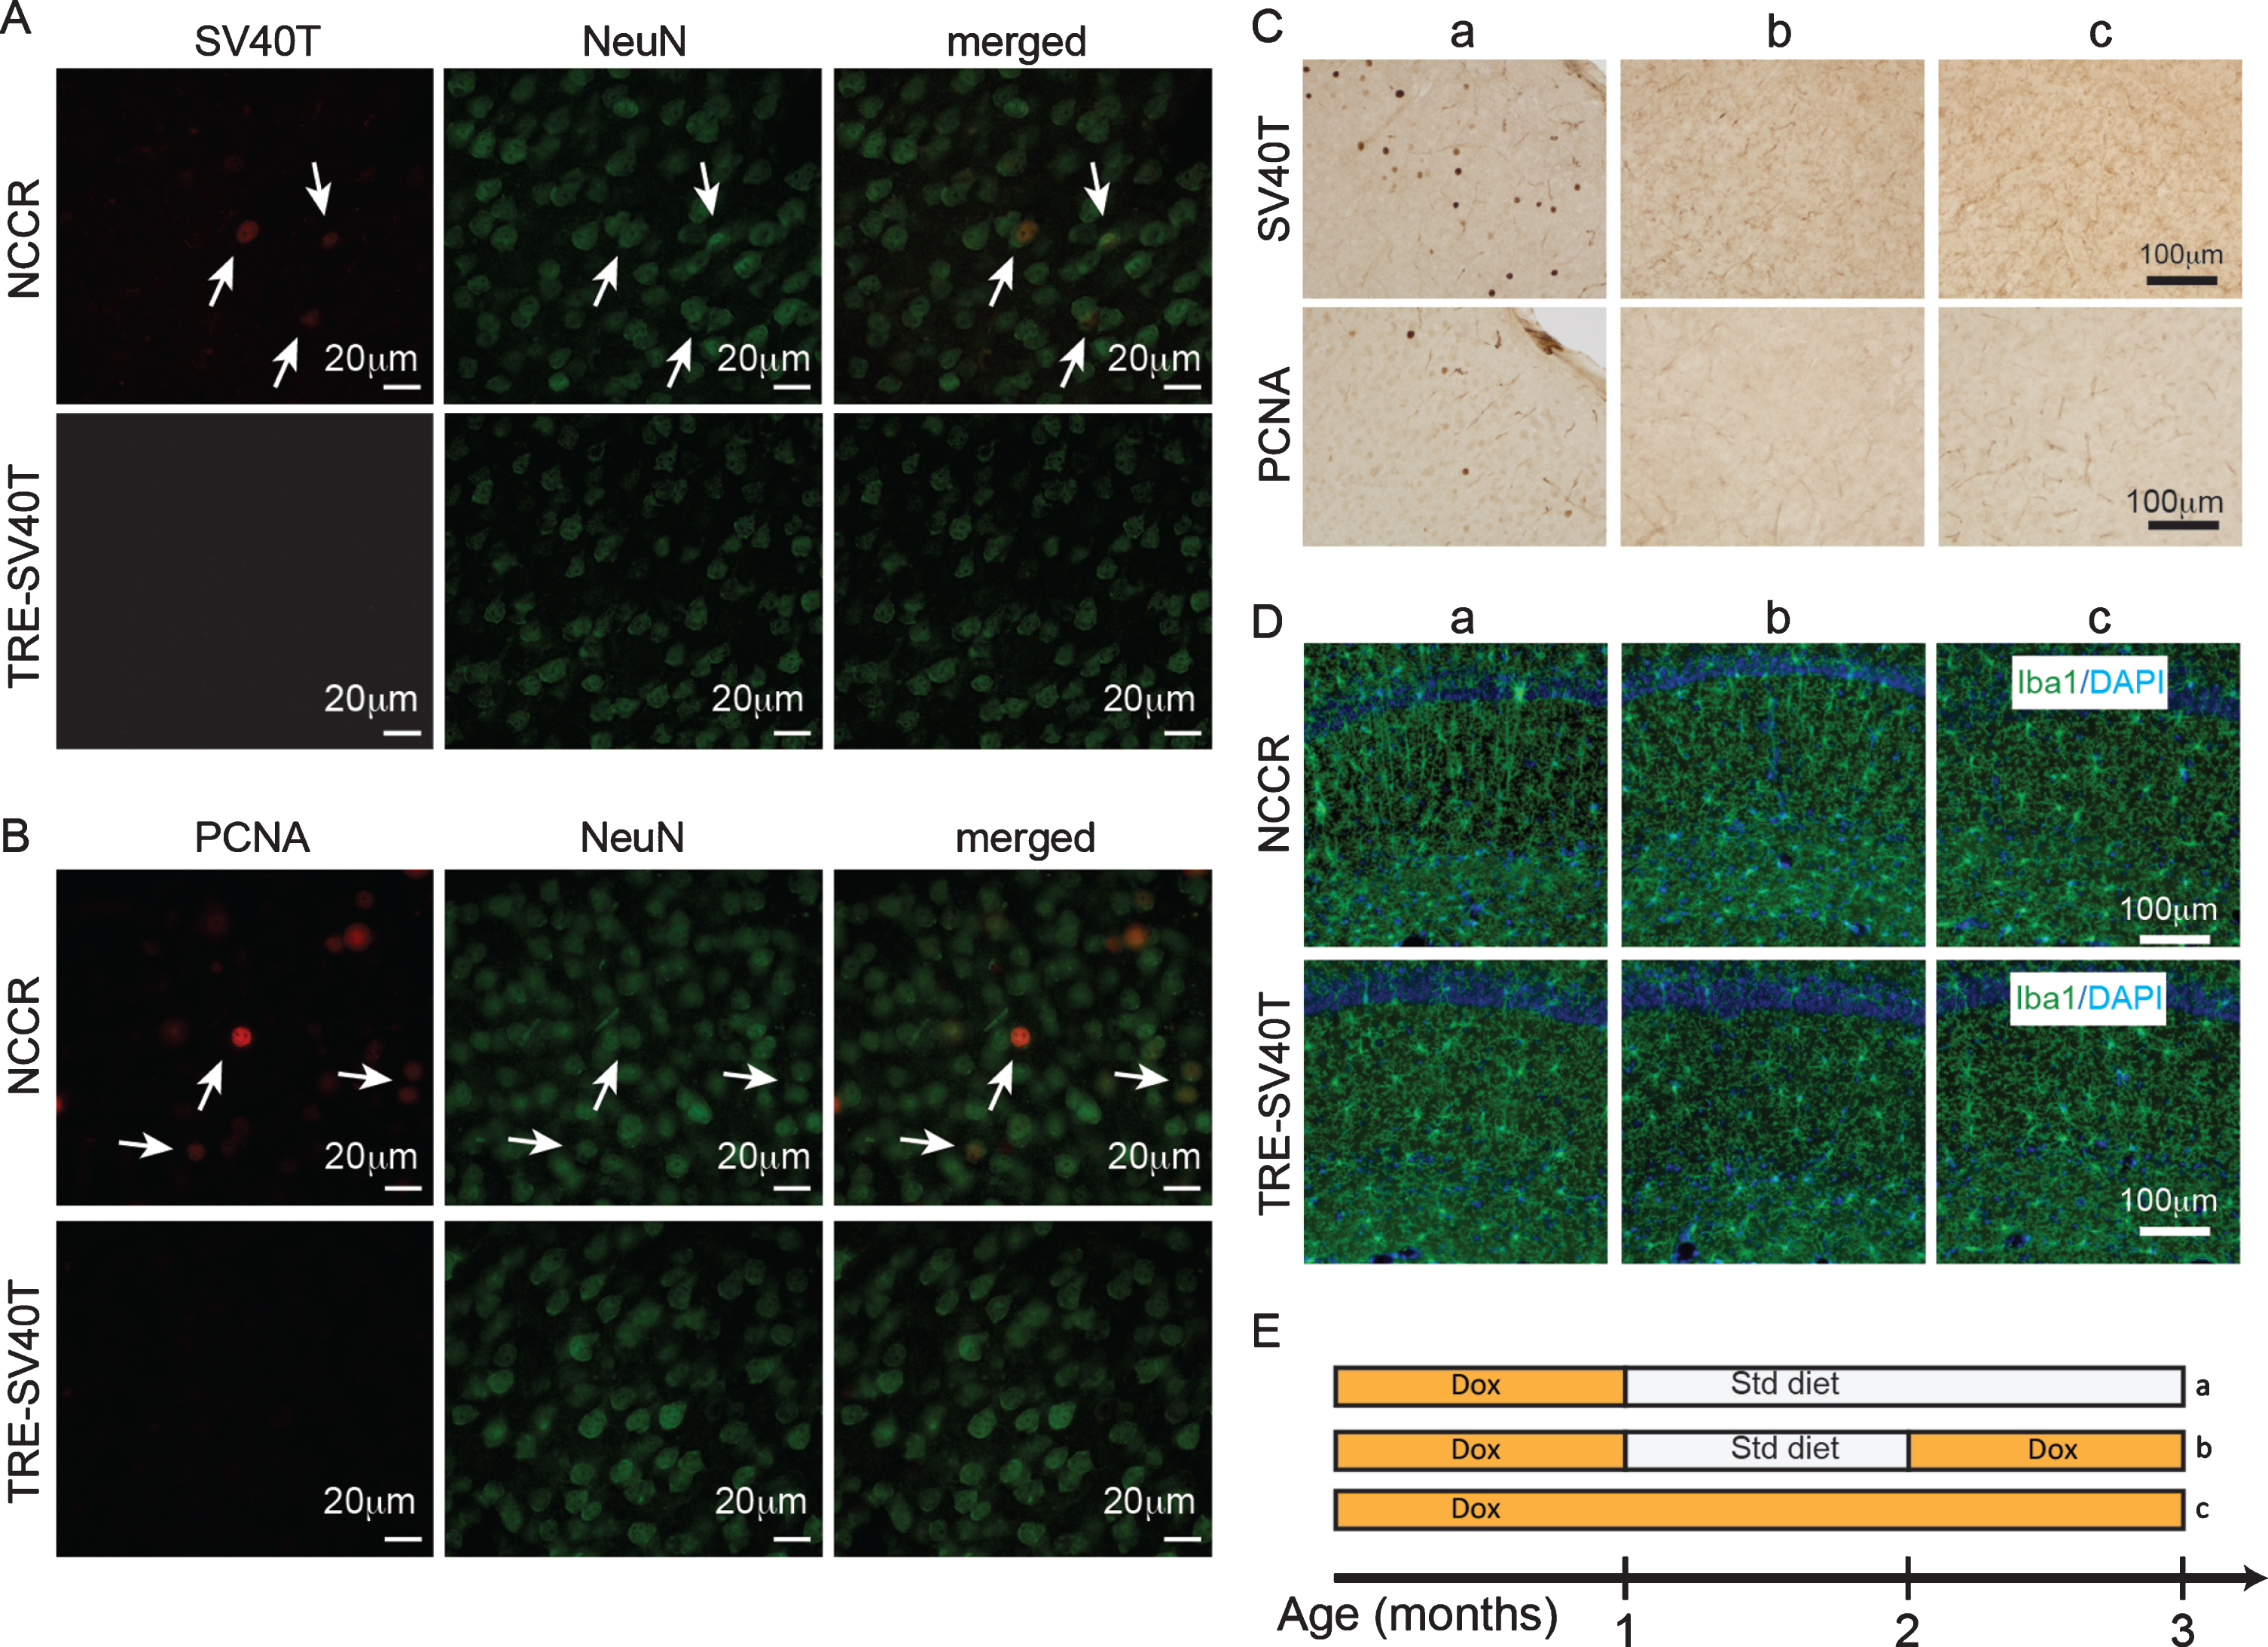
Examination of 3-month-old NCCR animals (n = 3) maintained on std diet starting at 1 month of age show chronically induced neuronal SV40T expression and persistent neuronal cell cycle re-entry as demonstrated by proliferating cell nuclear antigen (PCNA) expression (Fig. 2C, a; 2E, a). Iba1 immunofluorescence show rod-like microglia in the hippocampus in the same animals (Fig. 2D, a). Rod-like microglia are activated microglia associated with neurodegenerative and neurological conditions [37]. It has been demonstrated that rod-like microglia is also associated with astrogliosis and chronic neuroinflammation response [38]. When a separate group of NCCR animals are put back on dox diet at 2 months of age (1-month std diet, then 1 month back on dox diet, n = 3), the SV40T and PCNA expressions are abolished at 3 months of age (Fig. 2C, b; 2E, b). With the halting of the SV40T expression and neuronal cell cycle activation, the rod-like microglia in the hippocampus become morphologically less pronounced (Fig. 2D, b). On the other hand, when the NCCR animals are constantly maintained on dox diet (never put on Std diet, n = 3), neuronal SV40T and PCNA expressions are chronically suppressed (Fig. 2C, c; 2E, c). Under this naïve condition, the microglia morphology and distribution display typical features of resting microglia observed in TAg control littermates (Fig. 2D, c).
SV40T-mediated neuronal cell cycle re-entry induces neuroinflammation
Neuroinflammation is marked by activated and proliferating microglia and reactive astrocytes that are characterized by increased expression of glial fibrillary acidic protein (GFAP). It has been shown that GFAP immunoreactivity in astrocytes are increased with neuroinflammatory signals [39]. Furthermore, astrocyte activation is associated with microglia activation [39]. Therefore, we quantified the percent of area covered by GFAP and Iba-1 immunofluorescence as a measure of neuroinflammation in the NCCR mice using Image J [35]. Evaluation of different regions of interest (Fig. 3A) to determine the percent area covered by GFAP immunofluorescence at 4-, 6-, and 12-month-old NCCR and TAg control animals showed significant age effect (Fig. 3B, two-way ANOVA, F(2,162) = 22.6, p < 0.0001), genotype effect (Fig. 3B, two way ANOVA, F(1,162) = 204.7, p < 0.0001), and interaction effect (Fig. 3B, two-way ANOVA, F(2,162) = 18.82, p < 0.0001). Comparison of NCCR animals at different ages showed statistically significant age-dependent increase in the GFAP immunoreactivity (Fig. 3B). On the other hand, there is no statistical difference between TAg control animals at any of the ages evaluated. Additionally, GFAP immunoreactivity in the NCCR animals were greater than TAg control animals across all ages examined (Fig. 3B).
Fig.3
The time course of neuroinflammation in the NCCR mice was determined by quantifying the percent of areas covered by GFAP and Iba-1 immunofluorescence signal. A) Representative Hoechst stained images showing the rostral and caudal sections stained for quantification. Anatomically matched brain sections were double-immunofluorescence labeled with GFAP and Iba-1. White boxes indicate the regions of interest measured using Image J software. The measures were taken from both hemispheres. B) Representative sample field images of GFAP immunofluorescence from 12-month-old NCCR and TAg control animals used for quantifying the percent area covered using Image J software. Two-way ANOVA analysis on percent area stained with GFAP shows significant age effect (F(2,162) = 22.6, p < 0.0001), genotype effect (F(1,162) = 204.7, p < 0.0001), and interaction effect (F(2,162) = 18.82, p < 0.0001). Tukey’s multiple comparison test demonstrates statistically significant age-dependent increase in the NCCR animals. On the other hand, there is no statistical difference between TAg animals at different age. NCCR animals show significantly greater GFAP-immunoreactive areas compared to TAg animals at all time points. C) Representative sample field images of Iba-1 immunofluorescence from 12-month-old NCCR and TAg control animals used for quantifying the percent area covered using Image J software. Two-way ANOVA analysis on percent area stained with Iba-1 shows significant age effect (F(2,210) = 12.56, p < 0.0001), genotype effect (F(1,210) = 34.91, p < 0.0001), and interaction effect (F(2,210) = 12.56, p < 0.0001). The averaged values for percent area covered by Iba-1 increases with age in the NCCR animals. However, only the values measured at 12-months of age in the NCCR mice were statistically different from age-matched TAg animas and 4 and 6 months of age animals of either genotypes. There was no age-dependent change in the TAg control littermates. p-values in the graphs are adjusted p-values from Tukey’s multiple comparison tests (*p < 0.05; **p < 0.01; ***p < 0.001; ****p < 0.00001). n = 2 animals per group, with 2 sections per animal and 20 regions of interest evaluated per brain section. Values are mean±SEM.
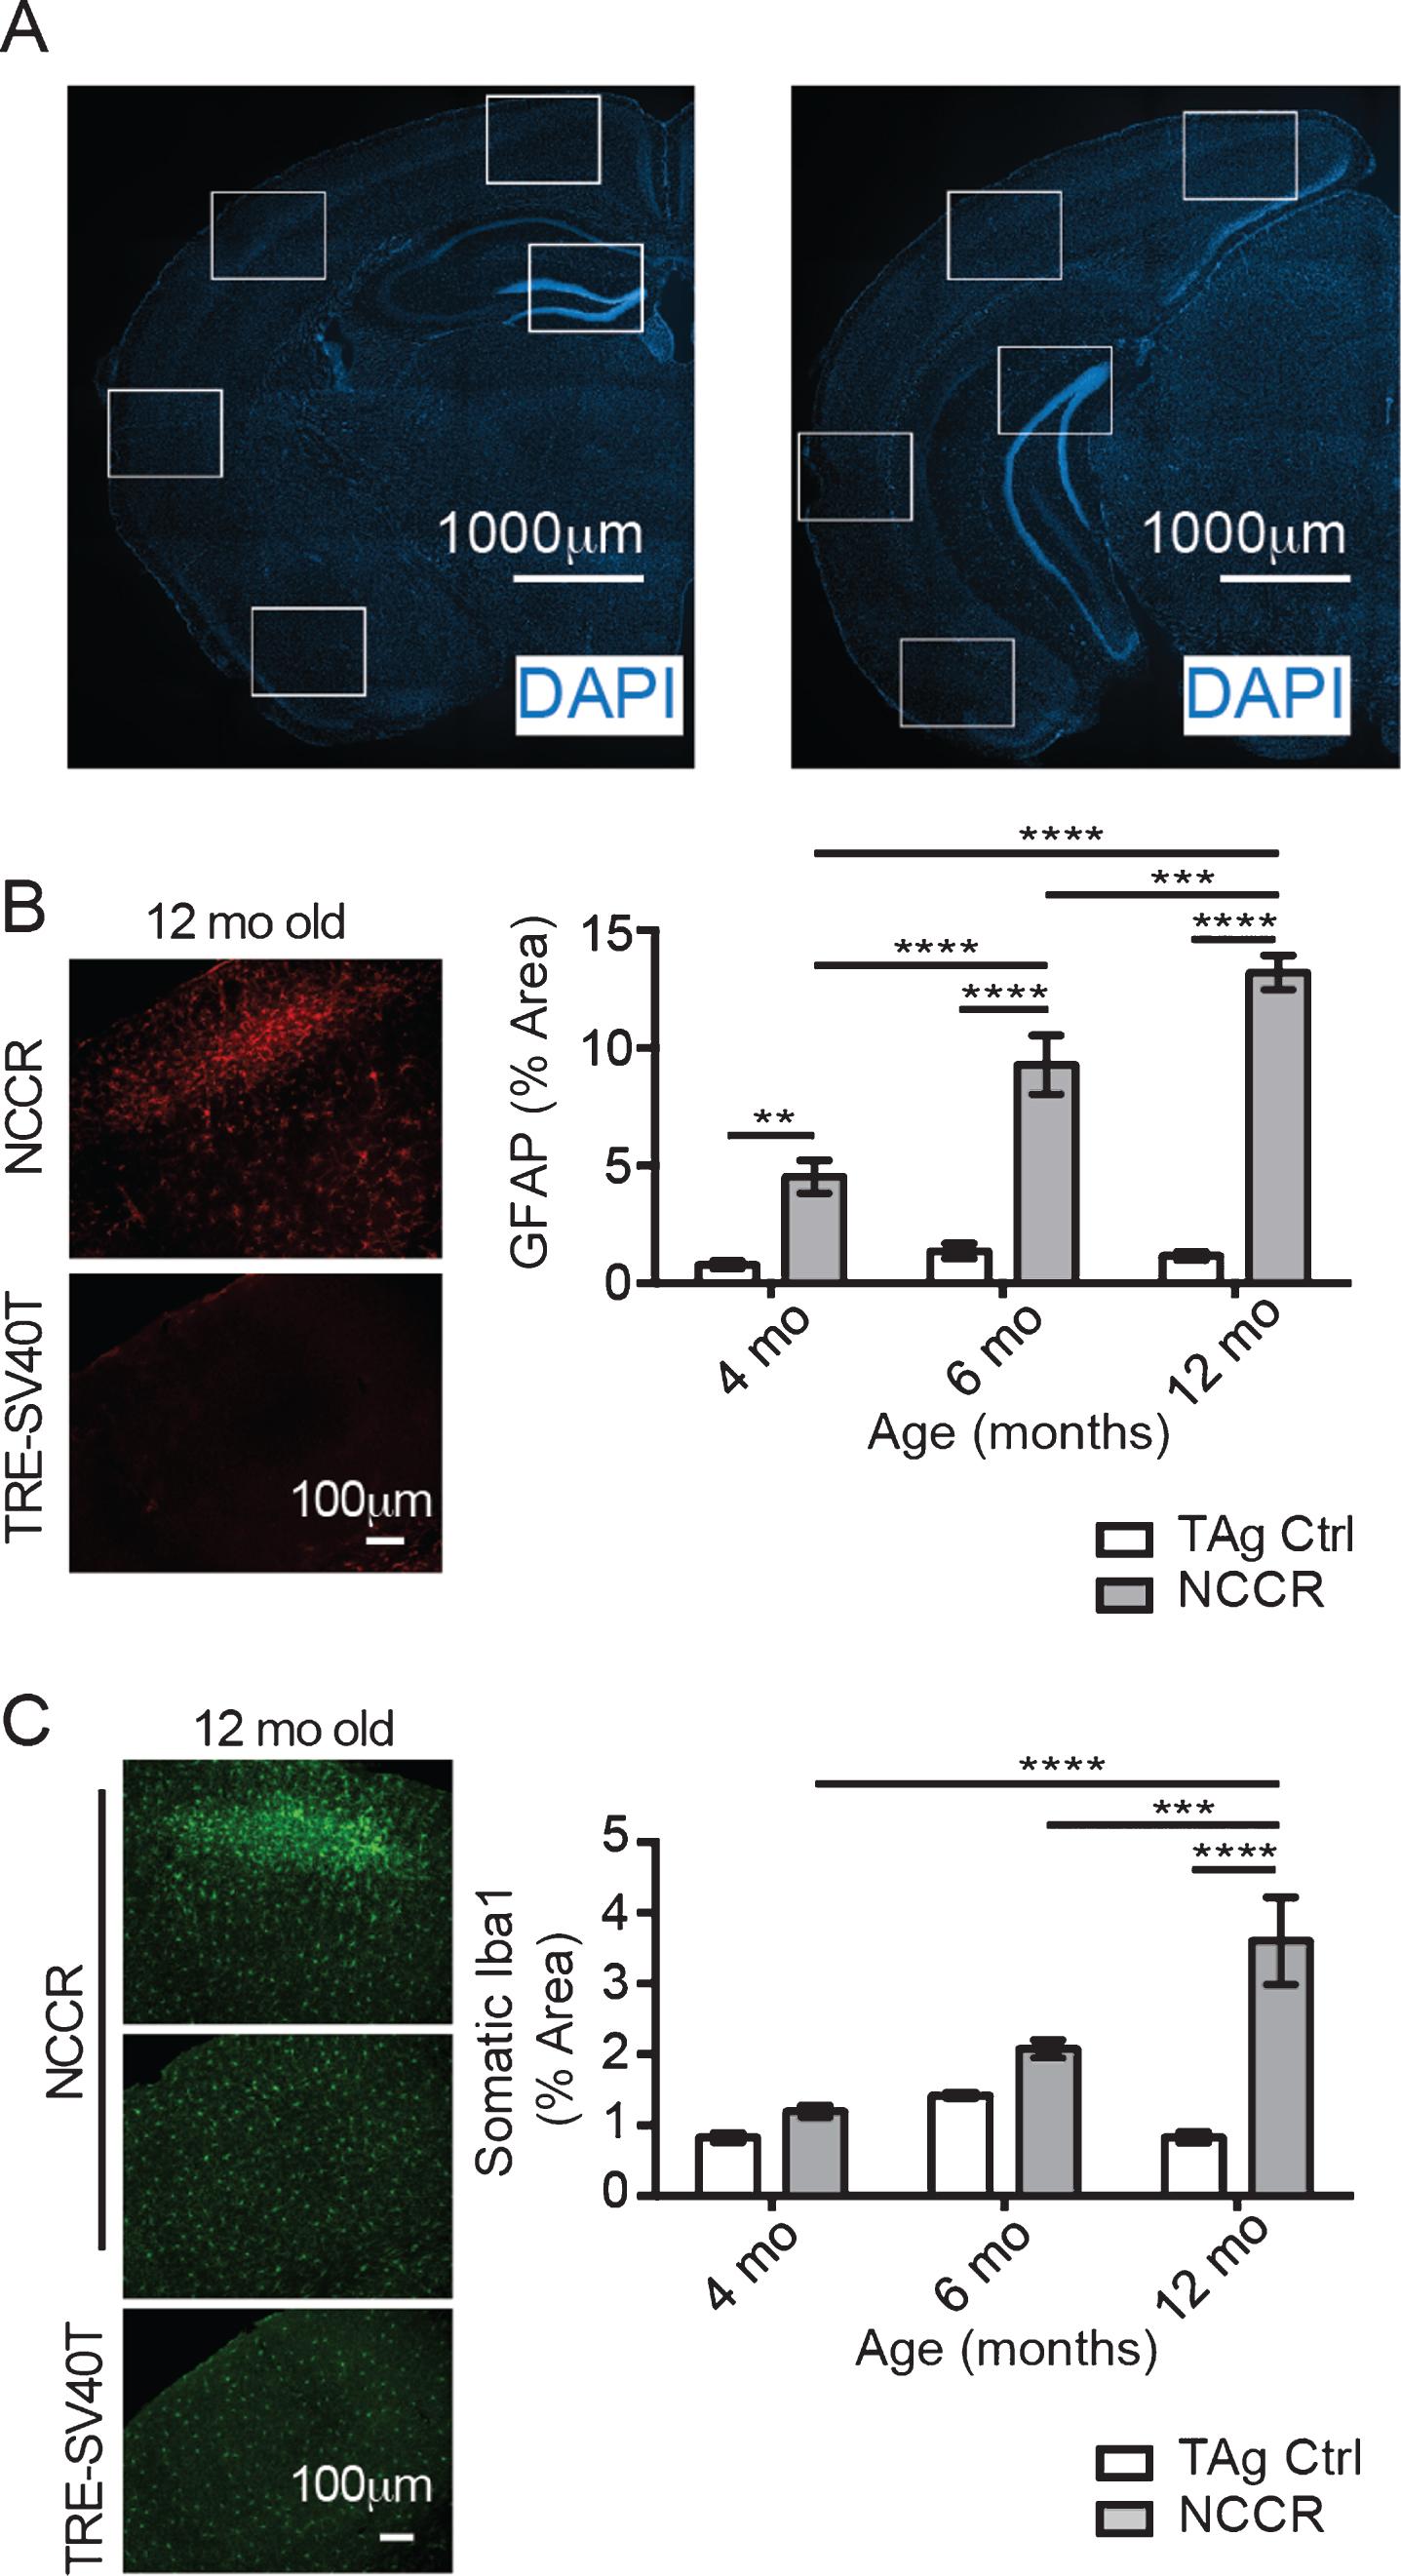
Fig.4
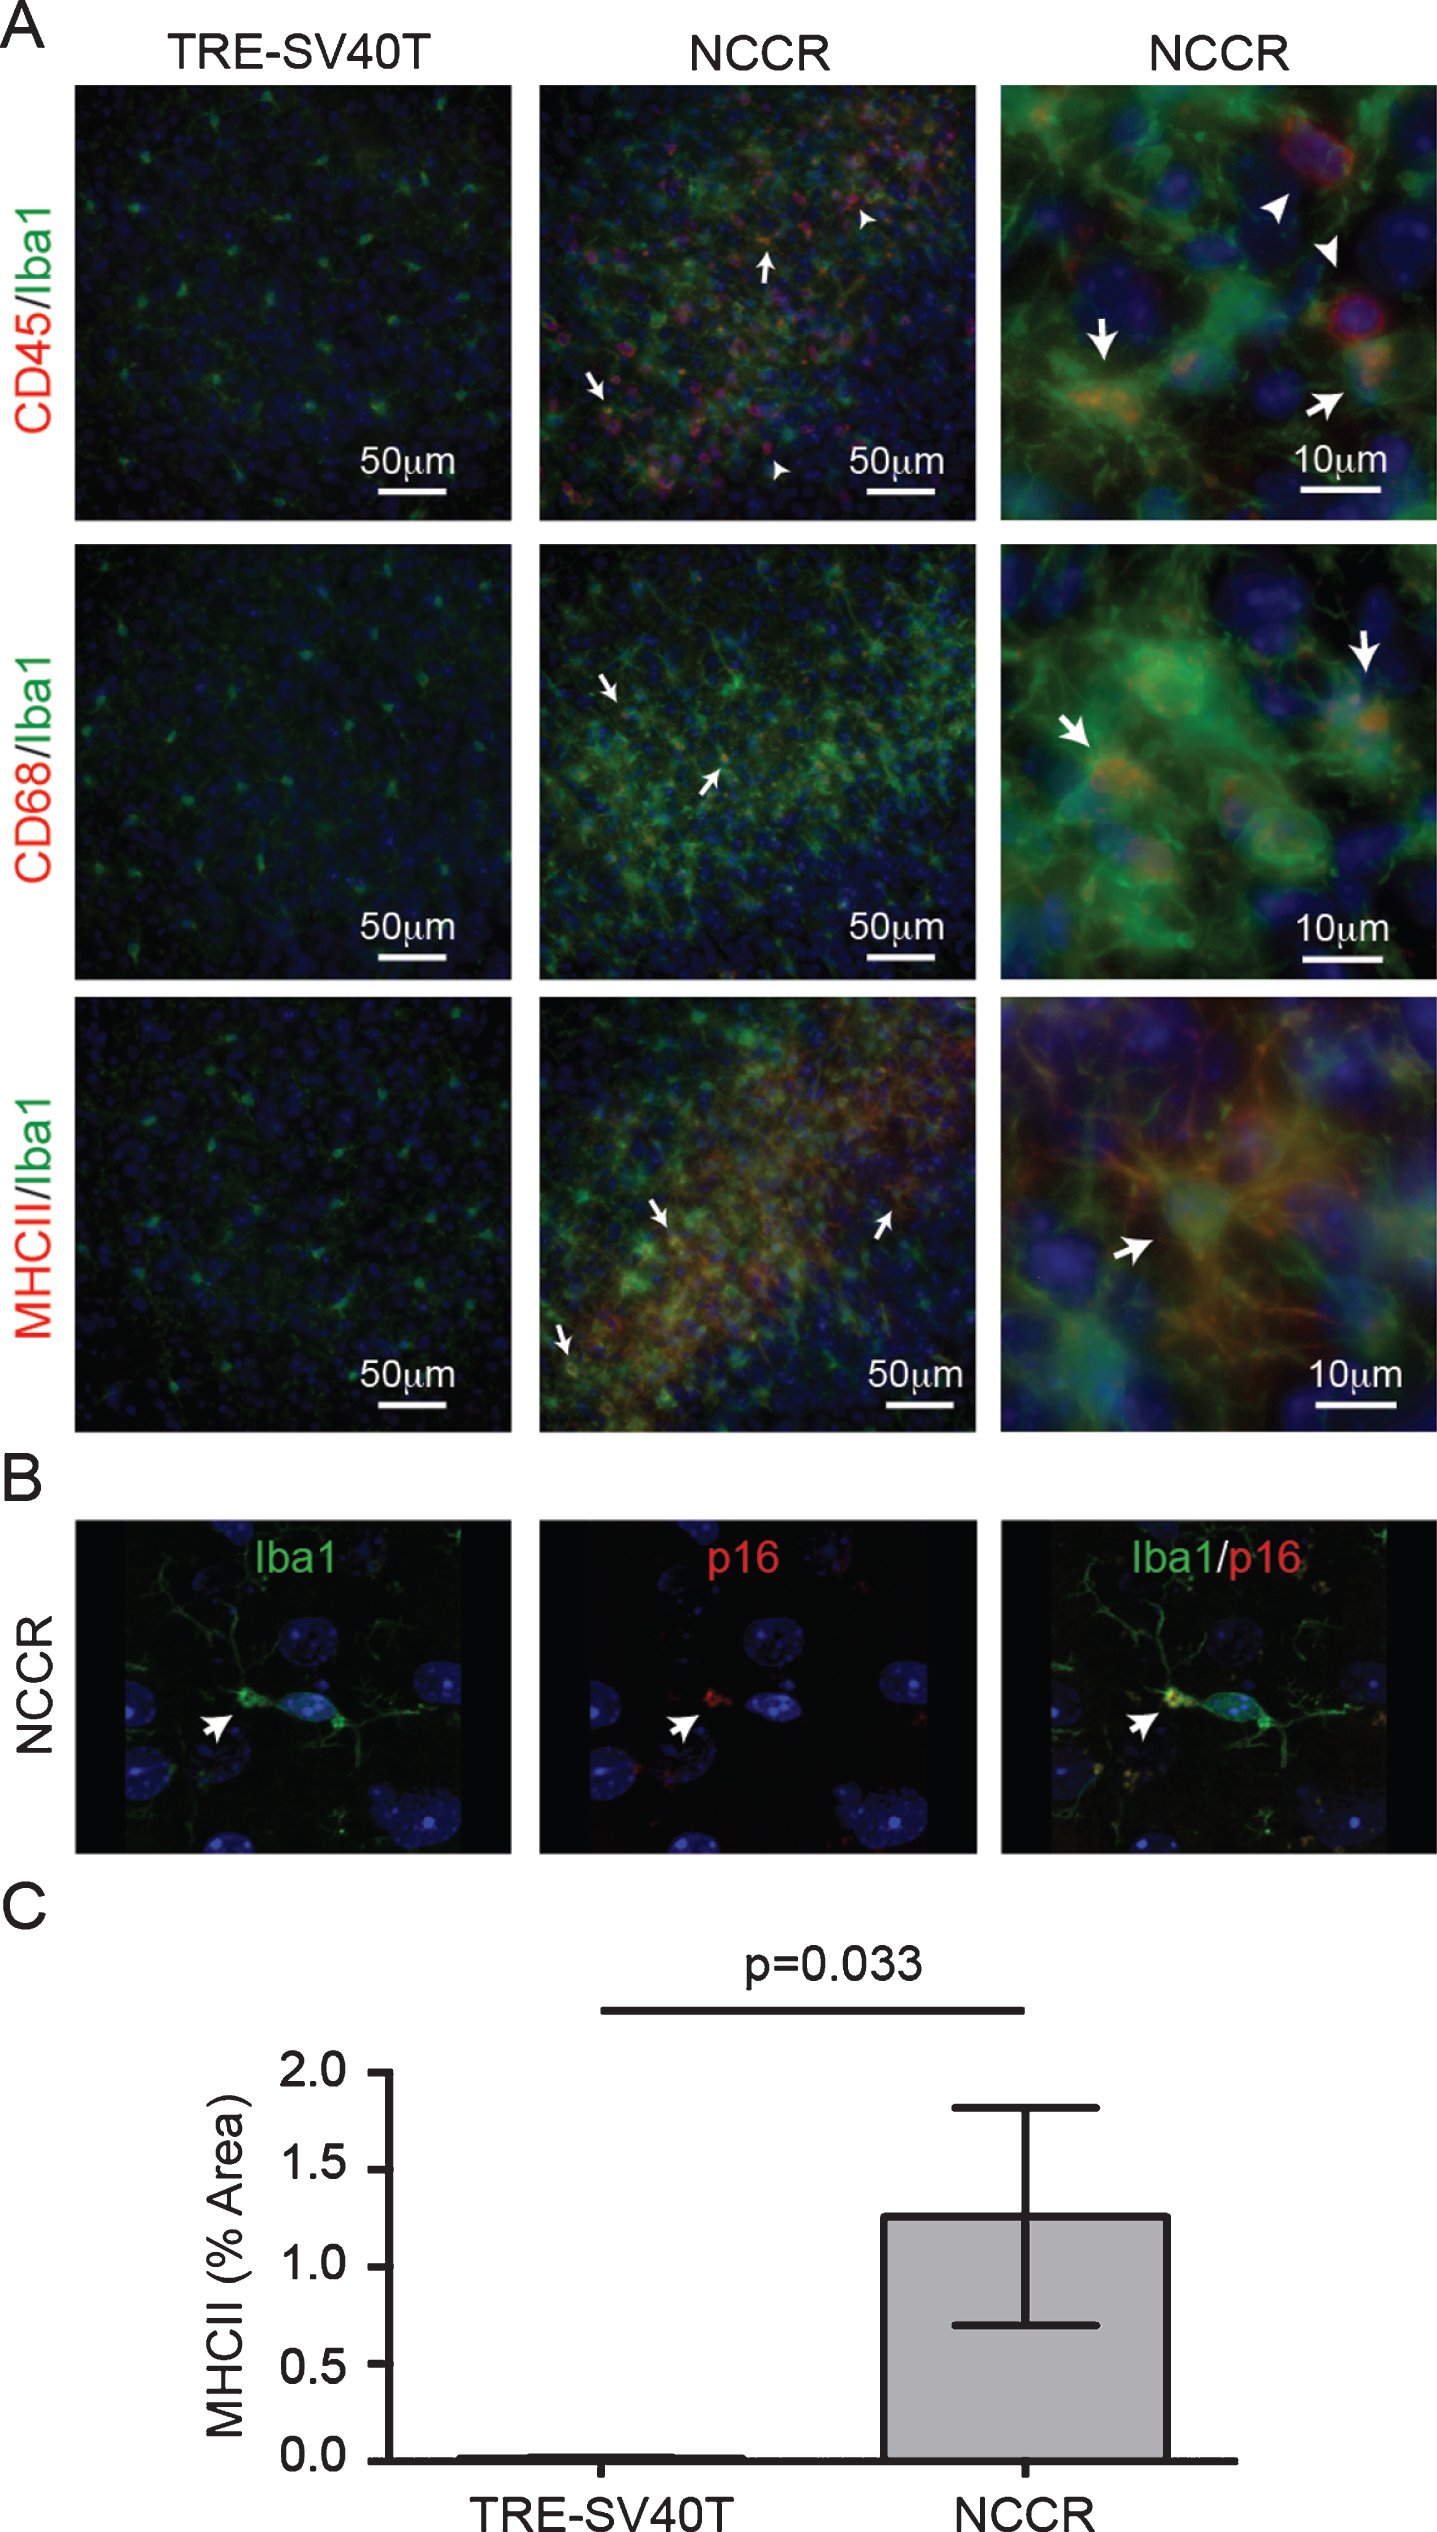
Markers of neuroinflammatory microglia activation is present in the cortex of 12-month-old NCCR mice. A) 12-month-old NCCR mice show clusters of activated microglia compared to TRE-SV40T controls. Iba1-labeled microglia show CD45 co-labeling (arrows). There are also CD45pos/Iba-1neg cells, indicative of brain leukocyte infiltration (arrowheads). Iba-1 labeled microglia also show co-labeling with CD68 (arrows), and MHCII (arrows). Age-matched control brain sections from TRE-SV40T Tg mice littermates (TAg control) that were maintained on the same diet regimen did not show CD45, CD68, or MHCII labeling. B) Confocal imaging shows p16 labeling in a subset of microglia (arrows). The p16 co-labeled microglia also show blebbing, a morphological feature associated with senescent microglia (arrows). Age-matched control brain sections from TRE-SV40T Tg mice littermates (TAg control) that were maintained on the same diet regimen did not showp16 labeling (data not shown). C) Image J software was used to quantify the percent of area covered by MHCII immunofluorescence. MHCII-positive areas were increased by 770% in the NCCR mice compared to TAg control mice at 12 months of age (unpaired t-test with Welch’s correction for unequal variances, p = 0.033). n = 2 animals per group, with 2 sections per animal and 20 individual regions of interest evaluated per brain section, as shown in Fig. 3A.
We also quantified the percent brain areas covered by Iba-1 immunofluorescence in 4-, 6-, and 12-month-old NCCR and TAg control animals. Activated microglia are characterized by larger soma and proliferation, therefore we evaluated the somatic area between the groups. Statistical analysis showed significant age effect (Fig. 3C, two-way ANOVA, F(2,162) = 22.6, p < 0.0001), genotype effect (Fig. 3C, two way ANOVA, F(1, 162) = 204.7, p < 0.0001), and interaction effect (Fig. 3C, two-way ANOVA, F(2,162) = 18.82, p < 0.0001). The mean values for NCCR animals at 4-, 6-, and 12-month-old animals show age-dependent increase (1.194% versus 2.076% versus 3.602%), although the increase is statistically significant only at 12 months of age (Fig. 3C). On the other hand, age-dependent increase is not observed in the TAg control animals (Fig. 3C). Therefore, GFAP and Iba-1 immunofluorescence time course data suggest the presence of chronic neuroinflammation in the NCCR mice.
To assess the activation phenotypes of the microglia in these animals at 12 months of age, we co-immunolabeled Iba1-positive microglia with various markers of pro-inflammatory microglia activation. It has been shown that pro-inflammatory microglia express more MHC-II, CD68, or CD45 [40– 42]. Therefore, we assessed the microglia activation in 12-month-old animals using the following activation markers: CD45, CD68, or MHCII. A subset of Iba1-labeled microglia showed co-labeling with CD45, or CD68, or MHCII antibodies suggesting activated microglia in these mice (Fig. 4A, arrows). Furthermore, we also observed numerous cells that are strongly immunolabeled for CD45 but were not Iba1-positive (Fig. 4A, arrowheads). CD45 is a pan-leukocyte marker, and the presence of these CD45-labeled cells are indicative of brain leukocyte infiltration in the NCCR mice [43]. We also stained the brain sections using p16 antibody. p16 is a tumor suppressor protein and a marker for senescence [44]. We hypothesized that the lack of mitosis in neurons despite chronic cell cycle activation would mimic a state of senescence and demonstrate increased p16 expression in neurons. Our DAB immunohistochemistry showed microglia-like stains (data not shown). Therefore, we performed immunofluorescence co-labeling on the brain sections using Iba-1 and p16, which helped identify a subset of microglia in the 12-month-old animals that show p16 expression (Fig. 4B, arrows). These p16-labeled microglia also displayed blebbing, a morphological hallmark of senescent microglia (Fig. 4B, arrows) [45]. Proinflammatory microglia in the 12-month old NCCR mice were quantified by measuring the percent of area covered by MHCII immunofluorescence. The MHCII fluorescence in the brain was restricted to microglia in the 12-month-old NCCR brains. MHCII-positive areas were 770% greater in the NCCR mice compared to TAg control mice at 12 months of age (Fig. 4C, unpaired t-test with Welch’s correction for unequal variances, p = 0.033).
DISCUSSION
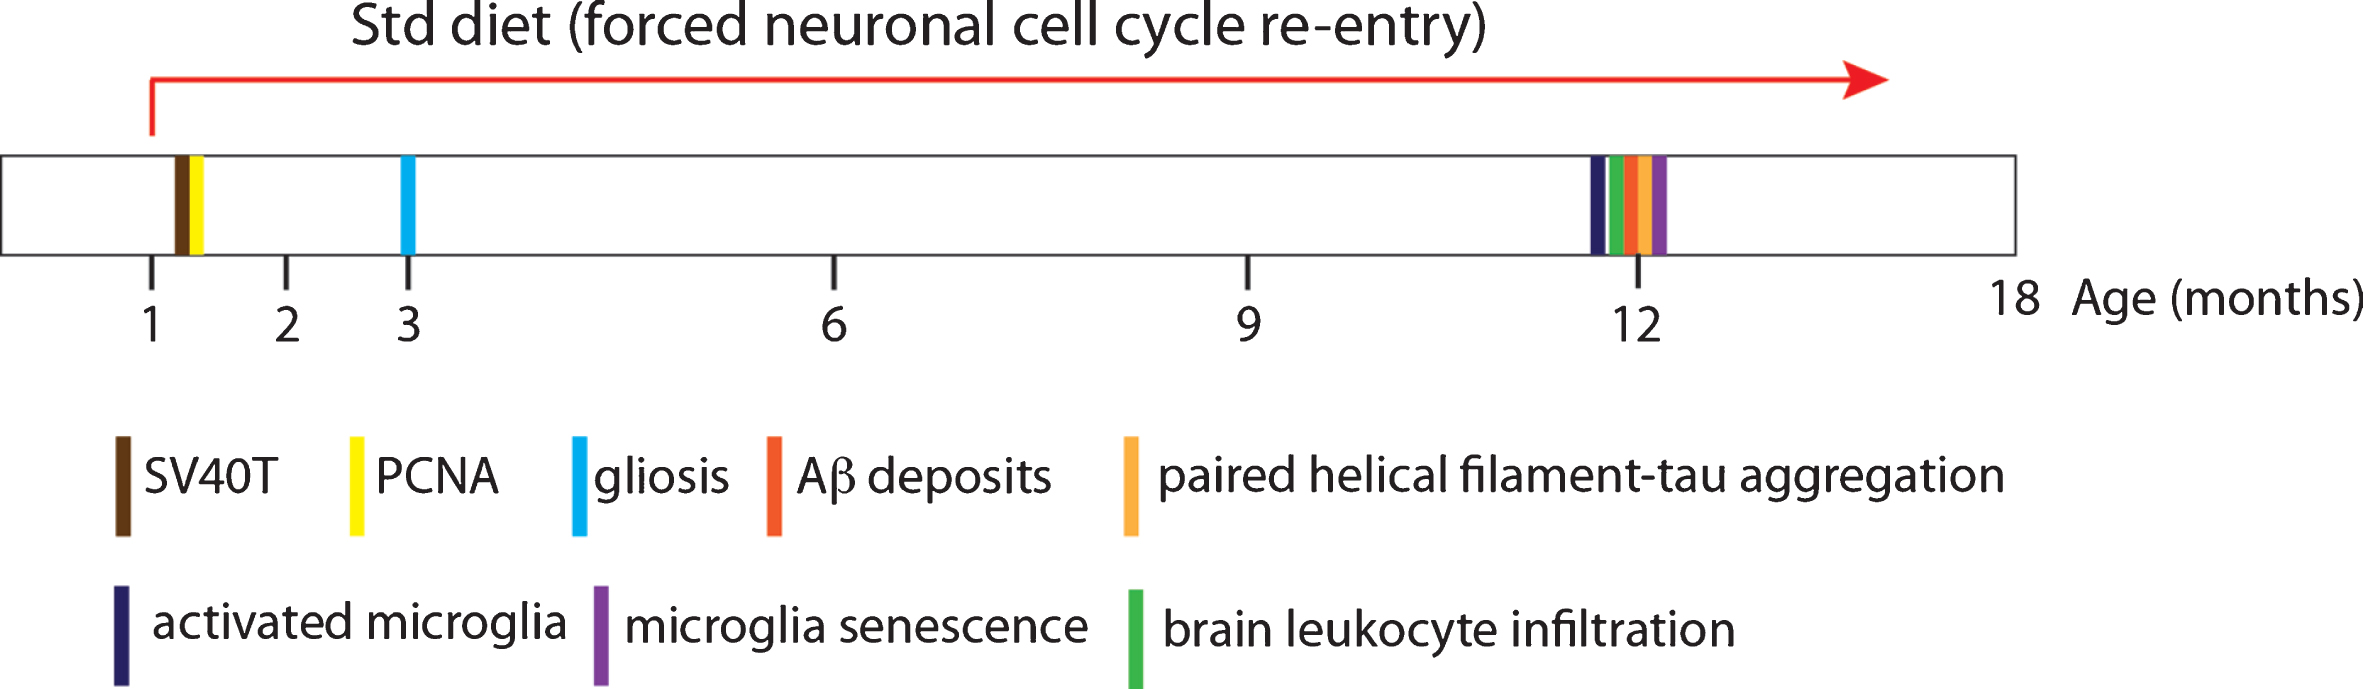
The NCCR mice show Aβ deposits and pathological tau accumulation generated from endogenous mouse proteins in the absence of either AβPP or tau mutations. Furthermore, the NCCR mouse model simultaneously displays a number of pathological features that mirror the main pathological hallmarks of AD: Aβ and tau pathologies, neuroinflammation, and brain leukocyte infiltration. Chronic expression of SV40T induces persistent neuronal cell cycle activation and gliosis at all ages examined (2, 3, 4, 6, and 12 months of age). Aβ and tau pathologies, microglia activation and senescence, and brain leukocyte infiltration are observed around 12 months of age (Fig. 5). The simultaneous manifestation of these AD-related pathologies in the absence of FAD gene mutations highlights the usefulness of the model for studying AD in the context of sporadic AD, also referred to as late-onset AD.
The Aβ and tau pathologies in the NCCR mouse model are milder compared to either Aβ or tau pathologies in AβPP mouse models or mutant tau mouse models, respectively. This is likely due to the differences in AβPP and tau proteins between humans and mice. It has been shown that the difference in the three amino acid sequences between human and mouse Aβ makes human Aβ more pathological and prone to aggregation [46– 50]. Adult mouse and human tau proteins are also different in amino acid sequences, resulting in differences in tau post-translational modification [51]. Additionally, adult mouse brains primarily express 4 microtubule binding repeat domain (4R) tau isoforms whereas adult human brains express 3R and 4R tau isoforms [52– 56]. Tau inclusions in different tauopathies are composed of different tau isoforms. For example, FTD is a 4R tauopathy where the tau inclusions are composed of 4R tau [57]. On the other hand, tau inclusions in Alzheimer’s disease are composed of 3R and 4R tau [57].
It is currently unclear what physiological events are mediating neuroinflammation in the NCCR mouse model. In addition to its ability to induce genes that modulate cell cycle activation, DNA repair, transcription, and chromatin structure [17], it has been shown that SV40T expression is sufficient to induce a panel of interferon stimulated genes in mouse embryonic fibroblasts [58]. A recent study has demonstrated that type I interferon response is present in AD brain samples and this response can drive neuroinflammation in various FAD APP mouse models [59]. Therefore, further study needs to be carried out to tease apart the roles of SV40T and neuronal cell cycle activation on neuroinflammation in the NCCR mice.
Although neuroinflammation is thought to be a risk factor in AD, acute neuroinflammation is thought to be neuroprotective while chronic neuroinflammation is thought to be detrimental [25, 60]. Studies using the FAD mouse models demonstrates that short-term (28 days) ablation of microglia using CSF-1R inhibitor in either APP/PS1 or 5xFAD mice did not reduce Aβ plaque load [61, 62]. On the other hand, longer-term (3 months) inhibition of microglia function either via CSF-1R inhibition mediated microglia ablation or NLRP3 inflammasome inhibition reduced Aβ plaque load in 5×FAD and APP/PS1 mice, respectively [62, 63]. Therefore, chronic neuroinflammation may help promote Aβ pathology in the context of FAD. However, the lack of tau pathology in FAD mouse models poses a challenge for studying the role of chronic inflammation on AD tau pathology, which is different from those of primary tauopathies such as frontal temporal dementia. It has been shown that microglia activation is observed in the prodromal and preclinical stages of AD [23] and microglia activation is positively correlated with tau aggregation and amyloid deposition [24]. However, the role of chronic inflammation in the context of sporadic AD is unclear. The presence of early and persistent gliosis that precede Aβ deposition and tau aggregation in the NCCR mice will allow us to examine the role of chronic neuroinflammation on Aβ and tau pathologies in the context of sporadic AD in our future studies.
Fig.5
Schematic recapitulating the age of appearance of the various neuropathologies observed in the NCCR mice. Number of animals examined at discrete ages: 2 months of age, n = 4; 3 months of age, n = 3; 4months of age, n = 4; 6 months of age, n = 2; 12 months of age, n = 2.
Additionally, in order to increase the relevance of AD pathophysiological processes in the NCCR mice, we have humanized the Aβ domain of the endogenous mouse AβPP using the App knock-in mice [50]. Separately, we have also humanized the endogenous Mapt using the humanized Mapt knock-in mice, which express 6 human tau isoforms composed of 3R and 4R tau and represent a more physiologically relevant model for pathological tau modifications in humans [64]. These animals are currently being evaluated in our laboratory. The goal is to simultaneously humanize Aβ and tau in the NCCR mice, which are expected to develop age-dependent tau pathology formed from wild type human tau without seeding while simultaneously displaying other pathological hallmarks of AD such as ectopic neuronal cell cycle re-entry, humanized Aβ plaques, gliosis, neuroinflammation, and neurodegeneration. The NCCR mice represent a promising alternative AD mouse model for studying the interactions between crucial factors in AD and testing potential therapeutics in the context of sporadic AD.
CONFLICT OF INTEREST
The authors have no conflict of interest to report.
ACKNOWLEDGMENTS
This work was supported by start-up funds and NIH R03AG060144 grant (KP).
REFERENCES
[1] | Games D , Adams D , Alessandrini R , Barbour R , Borthelette P , Blackwell C , Carr T , Clemens J , Donaldson T , Gillespie F , Guido T , Hagopian S , Johnson-Wood K , Khan K , Lee M , Leibowitz P , Lieberburg I , Little S , Masliah E , McConlogue L , Montoya-Zavala M , Mucke L , Paganini L , Penniman E , Power M , Schenk D , Seubert P , Snyder B , Soriano F , Tan H , Vitale J , Wadsworth S , Wolozin B , Zhao J ((1995) ) Alzheimer-type neuropathology in transgenic mice overexpressing V717F beta-amyloid precursor protein. Nature 373: , 523–527. |
[2] | Hsiao K , Chapman P , Nilsen S , Eckman C , Harigaya Y , Younkin S , Yang F , Cole G ((1996) ) Correlative memory deficits, Abeta elevation, and amyloid plaques in transgenic mice. Science 274: , 99–102. |
[3] | Sturchler-Pierrat C , Abramowski D , Duke M , Wiederhold K-H , Mistl C , Rothacher S , Ledermann B , Bürki K , Frey P , Paganetti PA , Waridel C , Calhoun ME , Jucker M , Probst A , Staufenbiel M , Sommer B ((1997) ) Two amyloid precursor protein transgenic mouse models with Alzheimer’s disease-like pathology. Proc Natl Acad Sci U S A 94: , 13287–13292. |
[4] | Jankowsky JL , Zheng H ((2017) ) Practical considerations for choosing a mouse model of Alzheimer’s disease. Mol Neurodegener 12: , 1–22. |
[5] | Vincent I , Rosado M , Davies P ((1996) ) Mitotic mechanisms in Alzheimer’s disease? J Cell Biol 132: , 413–425. |
[6] | McShea A , Harris PL , Webster KR , Wahl AF , Smith MA ((1997) ) Abnormal expression of the cell cycle regulators P16 and CDK4 in Alzheimer’s disease. Am J Pathol 150: , 1933–1939. |
[7] | Tse KH , Herrup K ((2017) ) Re-imagining Alzheimer’s disease – the diminishing importance of amyloid and a glimpse of what lies ahead. J Neurochem 143: , 432–444. |
[8] | Nagy Z , Esiri MM , Cato AM , Smith AD ((1997) ) Cell cycle markers in the hippocampus in Alzheimer’s disease Acta Neuropathol 94: , 6–15. |
[9] | Busser J , Geldmacher DS , Herrup K ((1998) ) Epitopic cell cycle proteins predict the sites of neuronal cell death in Alzheimer’s disease brain. J Neurosci 18: , 2801–2807. |
[10] | Yang Y , Geldmacher DS , Herrup K ((2001) ) DNA replication precedes neuronal cell death in Alzheimer’s disease. J Neurosci 21: , 2661–2668. |
[11] | Yang Y , Mufson EJ , Herrup K ((2003) ) Neuronal cell death is preceded by cell cycle events at all stages of Alzheimer’s disease. J Neurosci 23: , 2557–2563. |
[12] | Kruman II , Wersto RP , Cardozo-Pelaez F , Smilenov L , Chan SL , Chrest FJ , Emokpae R , Gorospe M , Mattson MP ((2004) ) Cell cycle activation linked to neuronal cell death initiated by DNA damage. Neuron 41: , 549–561. |
[13] | Boeras DI , Granic A , Padmanabhan J , Crespo NC , Rojiani AM , Potter H ((2008) ) Alzheimer’s presenilin 1 causes chromosome missegregation and aneuploidy. Neurobiol Aging 29: , 319–328. |
[14] | Arendt T , Brückner MK , Mosch B , Lösche A ((2010) ) Selective cell death of hyperploid neurons in Alzheimer’s disease. Am J Pathol 177: , 15–20. |
[15] | Herrup K , Yang Y ((2007) ) Cell cycle regulation in the postmitotic neuron: Oxymoron or new biology? Nat Rev Neurosci 8: , 368–378. |
[16] | Park KHJ , Hallows JL , Chakrabarty P , Davies P , Vincent I ((2007) ) Conditional neuronal simian virus 40 T antigen expression induces Alzheimer-like tau and amyloid pathology in mice. J Neurosci 27: , 2969–2978. |
[17] | Ahuja D , Saenz-Robles MT , Pipas JM ((2005) ) SV40 large T antigen targets multiple cellular pathways to elicit cellular transformation, Oncogene 24: , 7729–7745. |
[18] | Mayford M , Bach ME , Huang YY , Wang L , Hawkins RD , Kandel ER ((1996) ) Control of memory formation through regulated expression of a CaMKII transgene, Science 274: , 1678–1683. |
[19] | Barrio-Alonso E , Herná ndez-Vivanco A , Walton CC , Perea G , Frade JM ((2018) ) Cell cycle reentry triggers hyperploidization and synaptic dysfunction followed by delayed cell death in differentiated cortical neurons, Sci Rep 8: , 1–14. |
[20] | López-sánchez N , Fontán-lozano Á , Pallé A , González-Álvarez V , R\ensuremathábano A , Trejo JL , Frade JM ((2017) ) Neuronal tetraploidization in the cerebral cortex correlates with reduced cognition in mice and precedes and recapitulates Alzheimer’s-associated neuropathology, Neurobiol Aging 56: , 50–66. |
[21] | Heneka MT , Carson MJ , Khoury J El , Landreth Gary E , Brosseron F , Feinstein DL , Jacobs AH , Wyss-coray T , Vitorica J , Ransohoff RM , Herrup K , Grautschy SA , Finsen B , Brown GC , Verkhratsky A , Yamanaka K , Koistinaho J , Latz E , Halle A , Petzold GC , Town T , Morgan D , Shinohara ML , Perry VH , Holmes C , Bazan NG , Brooks DJ , Hunot S , Joseph B , Deigendesch N , Garaschuk O , Boddeke E , Dinarello CA , Breitner JC , Cole GM , Golenbock DT , Kummer MP ((2015) ) Neuroinflammation in Alzheimer’s disease, Lancet Neurol 14: , 388–405. |
[22] | Wyss-Coray T , Rogers J ((2012) ) Inflammation in Alzheimer disease — A brief review of the basic science and clinical literature, Cold Spring Harb Perspect Med 2: , a006346. |
[23] | Hamelin L , Lagarde J , Dorothée G , Leroy C , Labit M , Comley RA , De Souza LC , Corne H , Dauphinot L , Bertoux M , Dubois B , Gervais P , Colliot O , Potier MC , Bottlaender M , Sarazin M ((2016) ) Early and protective microglial activation in Alzheimer’s disease: A prospective study using 18F-DPA-714 PET imaging, Brain 139: , 1252–1264. |
[24] | Dani M , Wood M , Mizoguchi R , Fan Z , Walker Z , Morgan R , Hinz R , Biju M , Kuruvilla T , Brooks DJ , Edison P ((2018) ) Microglial activation correlates with both tau and amyloid in Alzheimer’s disease, Brain 141: , 2740–2754. |
[25] | Kinney JW , Bemiller SM , Murtishaw AS , Leisgang AM , Salazar AM , Lamb BT ((2018) ) Inflammation as a central mechanism in Alzheimer’s disease, Alzheimers Dement (N Y) 4: , 575–590. |
[26] | Tzioras M , Davies C , Newman A , Jackson R , Spires-Jones T ((2019) ) Invited Review: APOE at the interface of inflammation, neurodegeneration and pathological protein spread in Alzheimer’s disease, Neuropathol Appl Neurobiol 45: , 327–346. |
[27] | Griciuc A , Serrano-Pozo A , Parrado AR , Lesinski AN , Asselin CN , Mullin K , Hooli B , Choi SH , Hyman BT , Tanzi RE ((2013) ) Alzheimer’s disease risk gene cd33 inhibits microglial uptake of amyloid beta, Neuron 78: , 631–643. |
[28] | Jiang Q , Lee CYD , Mandrekar S , Wilkinson B , Cramer P , Zelcer N , Mann K , Lamb B , Willson TM , Collins JL , Richardson JC , Smith JD , Comery TA , Riddell D , Holtzman DM , Tontonoz P , Landreth GE ((2008) ) ApoE promotes the proteolytic degradation of Aβ, Neuron 58: , 681–693. |
[29] | Bailey CC , Devaux LB , Farzan M ((2015) ) The triggering receptor expressed on myeloid cells 2 binds apolipoprotein E, J Biol Chem 290: , 26033–26042. |
[30] | Xiang X , Werner G , Bohrmann B , Liesz A , Mazaheri F , Capell A , Feederle R , Knuesel I , Kleinberger G , Haass C ((2016) ) TREM2 deficiency reduces the efficacy of immunotherapeutic amyloid clearance, EMBO Mol Med 8: , 992–1004. |
[31] | Li P , Marshall L , Oh G , Jakubowski JL , Groot D , He Y , Wang T , Petronis A , Labrie V ((2019) ) Epigenetic dysregulation of enhancers in neurons is associated with Alzheimer’s disease pathology and cognitive symptoms, Nat Commun 10: , 2246. |
[32] | Lee H , Casadesus G , Nunomura A , Zhu X , Castellani RJ , Richardson SL , Perry G , Felsher DW , Petersen RB , Smith MA ((2009) ) The neuronal expression of MYC causes a neurodegenerative phenotype in a novel transgenic mouse, Am J Pathol 174: , 891–897. |
[33] | Schlatterer SD , Tremblay MA , Acker CM , Davies P ((2011) ) Neuronal c-Abl overexpression leads to neuronal loss and neuroinflammation in the mouse forebrain, J Alzheimers Dis 25: , 119–33. |
[34] | Barrett T , Marchalant Y , Park KHJ ((2019) ) p35 hemizygous deletion in 5xFAD mice increases Aβ plaque load in males but not in females, Neuroscience 417: , 45–56. |
[35] | Schindelin J , Arganda-Carrera I , Frise E , Verena K , Mark L , Tobias P , Stephan P , Curtis R , Stephan S , Benjamin S , Jean-Yves T , Daniel JW , Volker H , Kevin E , Pavel T , Albert C ((2012) ) Fiji – an Open platform for biological image analysis, Nat Methods 9: , 676–682. |
[36] | Otvos L , Feiner L , Lang E , Szendrei GI , Goedert M , Lee VM ((1994) ) Monoclonal antibody PHF-1 recognizes tau protein phosphorylated at serine residues 396 and 404, J Neurosci Res 39: , 669–673. |
[37] | Au NPB , Ma CHE ((2017) ) Recent advances in the study of bipolar/rod-shaped microglia and their roles in neurodegeneration, Front Aging Neurosci 9: , 1–16. |
[38] | Witcher KG , Bray CE , Dziabis JE , McKim DB , Benner BN , Rowe RK , Kokiko-Cochran ON , Popovich PG , Lifshitz J , Eiferman DS , Godbout JP ((2018) ) Traumatic brain injury-induced neuronal damage in the somatosensory cortex causes formation of rod-shaped microglia that promote astrogliosis and persistent neuroinflammation, Glia 66: , 2719–2736. |
[39] | Zamanian JL , Xu L , Foo LC , Nouri N , Zhou L , Giffard RG , Barres BA ((2012) ) Genomic analysis of reactive astrogliosis, J Neurosci 32: , 6391–6410. |
[40] | Godbout JP , Chen J , Abraham J , Richwine AF , Berg BM , Kelley KW , Johnson RW ((2005) ) Exaggerated neuroinflammation and sickness behavior in aged mice following activation of the peripheral innate immune system, FASEB J 19: , 1329–1331. |
[41] | Henry CJ , Huang Y , Wynne AM , Godbout JP ((2009) ) Peripheral lipopolysaccharide (LPS) challenge promotes microglial hyperactivity in aged mice that is associated with exaggerated induction of both pro-inflammatory IL-1β and anti-inflammatory IL-10 cytokines, Brain Behav Immun 23: , 309–317. |
[42] | Sarlus H , Heneka MT ((2017) ) Microglia in Alzheimer’s disease, J Clin Invest 127: , 3240–3249. |
[43] | Nakano A , Harada T , Morikawa S , Kato Y ((1990) ) Expression of leukocyte common antigen (CD45) on various human leukemia/lymphoma cell lines, Pathol Int 40: , 107–115. |
[44] | Brenner AJ , Stampfer MR , Aldaz CM ((1998) ) Increased p16 expression with first senescence arrest in human mammary epithelial cells and extended growth capacity with p16 inactivation, Oncogene 17: , 199–205. |
[45] | Streit WJ , Sammons NW , Kuhns AJ ((2004) ) Dystrophic microglia in the aging, Glia 45: , 208–212. |
[46] | Jankowsky JL , Younkin LH , Gonzales V , Fadale DJ , Slunt HH , Lester HA , Younkin SG , Borchelt DR ((2007) ) Rodent Abeta modulates the solubility and distribution of amyloid deposits in transgenic mice, J Biol Chem 282: , 22707–22720. |
[47] | Hilbich C , Kisters-Woike B , Reed J , Masters CL , Beyreuther K ((1991) ) Aggregation and secondary structure of synthetic amyloid beta A4 peptides of Alzheimer’s disease, J Mol Biol 218: , 149–163. |
[48] | Jarrett JT , Berger EP , Lansbury PT ((1993) ) The carboxy terminus of the beta amyloid protein is critical for the seeding of amyloid formation: Implications for the pathogenesis of Alzheimer’s disease, Biochemistry 32: , 4693–4697. |
[49] | Jarrett JT , Lansbury PT ((1993) ) Seeding “one-dimensional crystallization” of amyloid: A pathogenic mechanism in Alzheimer’s disease and scrapie? Cell 73: , 1055–1058. |
[50] | Saito T , Matsuba Y , Mihira N , Takano J , Nilsson P , Itohara S , Iwata N , Saido TC ((2014) ) Single App knock-in mouse models of Alzheimer’s disease, Nat Neurosci 17: , 661–663. |
[51] | Morris M , Knudsen GM , Maeda S , Trinidad JC , Ioanoviciu A , Burlingame AL , Mucke L ((2015) ) Tau post-translational modifications in wild-type and human amyloid precursor protein transgenic mice, Nat Neurosci 18: , 1183–1189. |
[52] | Hong M , Zhukareva V , Vogelsberg-Ragaglia V , Wszolek Z , Reed L , Miller BI , Geschwind DH , Bird TD , McKeel D , Goate A , Morris JC , Wilhelmsen KC , Schellenberg GD , Trojanowski JQ , Lee VM ((1998) ) Mutation-specific functional impairments in distinct tau isoforms of hereditary FTDP-17, Science 282: , 1914–1917. |
[53] | Hutton M , Lendon CL , Rizzu P , Baker M , Froelich S , Houlden H , Pickering-Brown S , Chakraverty S , Isaacs A , Grover A , Hackett J , Adamson J , Lincoln S , Dickson D , Davies P , Petersen RC , Stevens M , de Graaff E , Wauters E , van Baren J , Hillebrand M , Joosse M , Kwon JM , Nowotny P , Che LK , Norton J , Morris JC , Reed LA , Trojanowski J , Basun H , Lannfelt L , Neystat M , Fahn S , Dark F , Tannenberg T , Dodd PR , Hayward N , Kwok JB , Schofield PR , Andreadis A , Snowden J , Craufurd D , Neary D , Owen F , Oostra BA , Hardy J , Goate A , van Swieten J , Mann D , Lynch T , Heutink P ((1998) ) Association of missense and 5’-splice-site mutations in tau with the inherited dementia FTDP-17, Nature 393: , 702–705. |
[54] | Goedert M , Spillantini MG , Jakes R , Rutherford D , Crowther RA ((1989) ) Multiple isoforms of human microtubule-associated protein tau: Sequences and localization in neurofibrillary tangles of Alzheimer’s disease, Neuron 3: , 519–526. |
[55] | Kosik KS , Orecchio LD , Bakalis S , Neve RL ((1989) ) Developmentally regulated expression of specific tau sequences, Neuron 2: , 1389–1397. |
[56] | Takuma H , Arawaka S , Mori H ((2003) ) Isoforms changes of tau protein during development in various species, Dev Brain Res 142: , 121–127. |
[57] | Tolnay M , Probst A ((2003) ) The neuropathological spectrum of neurodegenerative tauopathies, IUBMB Life 55: , 299–305. |
[58] | Rathi AV , Cantalupo PG , Sarkar SN , Pipas JM ((2010) ) Induction of interferon-stimulated genes by simian virus 40 T antigens, Virology 406: , 202–211. |
[59] | Roy ER , Wang B , Wan Y-W , Chiu GS , Cole AL , Yin Z , Propson NE , Xu Y , Jankowsky JL , Liu Z , Lee VMY , Trojanowski JQ , Ginsberg SD , Butovsky O , Zheng H , Cao W ((2020) ) Type I interferon response drives neuroinflammation and synapse loss in Alzheimer disease, J Clin Invest 130: , 1912–1930. |
[60] | Schwartz M , Baruch K ((2014) ) The resolution of neuroinflammation in neurodegeneration: Leukocyte recruitment via the choroid plexus, EMBO J 33: , 7–20. |
[61] | Unger MS , Schernthaner P , Marschallinger J , Mrowetz H , Aigner L ((2018) ) Microglia prevent peripheral immune cell invasion and promote an anti-inflammatory environment in the brain of APP-PS1 transgenic mice, J. Neuroinflammation 15: , 1–23. |
[62] | Spangenberg E , Severson PL , Hohsfield LA , Crapser J , Zhang J , Burton EA , Zhang Y , Spevak W , Lin J , Phan NY , Habets G , Rymar A , Tsang G , Walters J , Nespi M , Singh P , Broome S , Ibrahim P , Zhang C , Bollag G , West BL , Green KN ((2019) ) Sustained microglial depletion with CSF1R inhibitor impairs parenchymal plaque development in an Alzheimer’s disease model, Nat Commun 10: , 1–21. |
[63] | Dempsey C , Rubio Araiz A , Bryson KJ , Finucane O , Larkin C , Mills EL , Robertson AAB , Cooper MA , O’Neill LAJ , Lynch MA ((2017) ) Inhibiting the NLRP3 inflammasome with MCC950 promotes non-phlogistic clearance of amyloid-β and cognitive function in APP/PS1 mice, Brain Behav Immun 61: , 306–316. |
[64] | Saito T , Mihira N , Matsuba Y , Sasaguri H , Hashimoto S , Narasimhan S , Zhang B , Murayama S , Higuchi M , Lee VMY , Trojanowski JQ , Saido TC ((2019) ) Humanization of the entire murine Mapt gene provides a murine model of pathological human tau propagation, J Biol Chem 294: , 12754–12765. |

