
Driving Safety of Cognitively-Impaired Drivers Based on Near Collisions in Naturalistic Driving
Abstract
Background:
Controlled naturalistic driving for examining impacts of cognitive impairment on driving safety is rare.
Objective:
Evaluating the safety among drivers with mild cognitive impairment based on near collision incidents using naturalistic driving, and investigating its correlation with cognitive measures.
Methods:
Frequency of near collisions of 44 cognitively impaired [Age = 75.1(±6.7), MMSE = 25.5(±2.5)] and 19 control group drivers [Age = 72.5(±7.8), MMSE = 29.3(±0.8)] were obtained from two weeks of recorded driving. Survival time free of predicted collision based on a previously established near-collision to collision estimate ratio of 11 : 1, for 140 hours of driving exposure was calculated. Participants were also tested using Mini-Mental Status Examination (MMSE), Trail A, and Trail B. Spearman correlation and Cox survival analysis were conducted.
Results:
Near collision frequency per driving hour was correlated with MMSE (r = –0.258, p = 0.041). Survival analyses showed that cognitively impaired drivers might be prone to higher probability of having collision (p = 0.056) with a hazard ratio of 5.78 (p = 0.092). When all participants were combined, there was a significant difference (p < 0.017) in all the three cognitive measures between drivers with and without predicted collision, which were not significant within patient or control group alone (p > 0.186). Cox regression analysis showed MMSE as the only significant factor (p < 0.025) for survival time of predicted collision, but not age, gender, or driving experience.
Conclusion:
The association between driving critical events and cognitive measures suggests that some drivers with mild cognitive impairment might have an elevated driving collision risk compared to control drivers. Standard clinical cognitive measures may be reasonable predictors.
INTRODUCTION
For many, driving is crucial for having an independent life, and this applies to the aging population. Studies have shown that, considering driven mileage, older adults “have a higher risk of crash involvement than middle-age drivers” [1], making it important to examine and understand older drivers’ fitness to drive. Additionally, older drivers’ frailty can increase the likelihood of death due to collisions [1, 2]. In 2017 alone, there were more than 7,600 fatalities and more than 210,000 injuries due to traffic related collisions among people 65 years old and older in the United States [3]. Older drivers self-regulate their driving, by changing or restricting their driving [4–7]. However, the overall driving mileage of drivers 65 years old and older has been increasing [8, 9]. Since driving exposure directly impacts driving safety outcome, it is important to investigate driving safety performance normalized to driving exposure.
In the United States alone, there are more than 5 million people with Alzheimer’s disease, and with the aging population the prevalence of cognitive impairment is increasing [10]. Cognitive impairment is one of the potential changes that impact safe driving in older drivers which can lead to less safe driving performance [11, 12].
Studies have used different methods for examining older adults and cognitively impaired drivers including evaluation of their driving performance (usually considered as drivers’ ability and typically examined using a driving simulator or road test), or driving behavior (drivers’ actual choices and behaviors while driving, typically examined using more naturalistic driving methods) or driving safety history outcomes (safety record review, driving cessation, and postmortem examination) [11, 13–15]. Different methods used for investigation of driving are necessary for a comprehensive understanding of performance and outcome of driving. A robust method for examining drivers’ performance is naturalistic driving which provides a unique opportunity to examine driving performance of drivers in their daily driving activities over a long period of time. In naturalistic driving studies, recording devices are installed in participants’ vehicles, and their daily driving performance is recorded and examined [16–20].
The most direct measure of driving safety is road collisions; however, the rare nature of collisions make them difficult to use as the only measure for examining drivers’ safe performance, even for naturalistic driving studies that record weeks or months of driving. Consequently, recent studies have begun using near collisions as a surrogate measure for collisions and as a predictor of unsafe driving outcomes [21–23].
Evaluating drivers’ naturalistic recordings is demanding work, with hundreds or thousands of hours of driving data to analyze. Past studies have shown that, by extracting unsafe-behavior-prone situations (such as rapid stops, lane deviations, turns, and intersections), an automated data reduction method can be used to make the review of driving videos practical and possible [23–25]. This method was used in our previous study on cognitively impaired and healthy older adult drivers and revealed risky behaviors that were highly associated with cognitive status [13].
This study focuses on near-collision events, made by both cognitively impaired and healthy older adult drivers, which were confirmed in the manual review of naturalistic driving. We compared driving safety in these groups based on near-collisions controlling for driving exposure. It was predicted that cognitively impaired drivers would demonstrate worse driving performance compared to control group drivers.
METHODS
Data used were from a larger study [26] investigating the driving performance of cognitively impaired and healthy older adult participants. Only participants who did not have at-fault collision over the past year were enrolled in that study, as suggested in guidelines on older cognitively impaired drivers [27].
There were 44 older adult participants [21 male and 23 female, Mean age (SD) = 75.1 (6.7), MMSE (Mini-Mental State Exam) (SD) = 25.5 (2.5)] diagnosed with mild cognitive impairment (MCI) or mild Alzheimer’s disease and 19 healthy older adults (relatives of the patient group) without any cognitive or visual impairment [6 male and 13 female, Mean age (SD) = 72.5 (7.8), MMSE (SD) = 29.3 (0.8)] as control group participants. The severity of dementia was rated using the Clinical Dementia Rating (CDR) scale [28], with CDR = 0.5 (questionable dementia or mild cognitive impairment) or 1 (mild dementia) recruited for the cognitively impaired group and CDR = 0 for healthy research participants. Patients were excluded if, over the previous year, they had other conditions that might impact their driving abilities such as reversible causes of dementia, physical or ophthalmologic disorders, intellectual disability, schizophrenia, bipolar disorder, or alcohol/substance abuse. So, the patients included in this study were mildly impaired and likely to have early Alzheimer’s disease. Participants were instructed on procedures, risks, and benefits prior to the study and written consent forms were obtained from them. The study was conducted in accordance with the Declaration of Helsinki, and the protocol was approved by the Institutional Review Board at Rhode Island Hospital.
In each participant’s vehicle one GPS device and four cameras connected to a digital video recorder (DVR) were installed which provided road view, driver’s face, and both sides of the vehicle. On their first visit, participants were asked to take a road test with a professional driving instructor. The recording devices were installed in participants’ vehicles and were recorded for around two weeks. Drivers were instructed to drive in their usual driving routes and routines.
After completion of the recording period, recorded videos were then reduced to sections of interest using the automated driving reduction system [13, 29]. The data reduction was conducted using video, speed, and GPS data for the four types of events: 1) Turning events: situations where drivers make a turn, criterion for extraction is change in nonadjacent segments were between 40° and 150° was detected; 2) Intersections events: when participants are approaching/at an intersection, this data is extracted using the GPS recordings of drivers as well as the GIS information of the driving locations; 3) Rapid stop events: sections of the drive that had a speed drop of 6 mph or more within 3 seconds, a liberal criterion was used for this event to reduce the possibility of missing important events; 4) Lane change events: when drivers made a lane or passing change maneuver, this data was extracted using matched filter, the lane markers were determined and the lane change was extracted using the videos. GPS devices sometimes fail to record the data. Because our data reduction relied on GPS data, only participants who had sufficient GPS data were included in this paper. This data reduction and review processing was able to identify driving behaviors which prior studies have shown to be associated with cognitive status [13].
The extracted data were then reviewed and scored for risky behaviors using the Mockingbird Scoring system. The Mockingbird Scoring System was developed to characterize and monitor driving of ambulance drivers, using naturalistic driving [30] and has since been used in naturalistic driving studies to examine cognitively impaired drivers. Four reviewers rated the patient videos, and a fifth reviewer, who was trained to be consistent with the other four reviewers based on a subset of patient videos, rated the control participants’ videos. The fifth evaluator was trained by iteratively rating a subset of the patient videos until his ratings reached consensus with the four evaluators. After the training, to examine the inter-rater reliability, three participants from the patient group who were already reviewed by the four reviewers, were reviewed by the fifth reviewer. The measure of agreement Kappa of reviewing between the new reviewer and the main reviewing team was 0.84. The evaluators were not masked to the subject group. Thus, there may be a risk of bias. However, the potential bias was minimized by two means: 1) all evaluators strictly followed the structured Mockingbird assessment protocol, which includes clear definition of near collision; and 2) the patient videos were rated first by the four evaluators together, and the fifth evaluator rated the control participants only. Thus, the evaluators were masked to the rating for the group they did not rate.
In line with participants’ reports, no collisions were observed during the review of the recordings; however, a number of near collision events were found. Near collision events, according to the Mockingbird Scoring method [13, 30], were defined as “drivers failed to assess and/or react appropriately to a developing hazard and a collision was narrowly avoided either through late but effective input from the driver or by happenstance.” For instance, cognitively impaired participants had difficulty with fundamentals of driving, particularly lane maintenance and looking far enough ahead to anticipate traffic situations and maneuvers, such as turns, which could lead to collisions [13]. In this study, only the near collision events were used to examine driving safety performance.
Building on Heinrich’s accident triangle theory [31], the near collision rate is roughly proportional to collision rate. According to the 100-car study [16], the overall ratio of near collisions to collisions was about 11 to 1; therefore, this value was used to predict at what time point a collision could occur according to the near collision frequency of a driver. For instance, if the near collision frequency for one driver is once per 10 hours of driving, it can be estimated that by the time of cumulative 110 hours of driving, the driver is likely to have a “predicted” collision. While the 100-car study [16] showed that the ratio of near collisions and collision is about 11, this number is used as an evidence-based extrapolation scale in this paper rather than an absolute predictor of collisions.
Using the data of time to the first “predicted” collision (or estimated survival time free of collision), survival analyses, Kaplan–Meier and Cox regression, were conducted to compare the cognitively impaired drivers against normal controls and to examine possible predictors of Time to Predicted Collision. Also, the collision hazard ratios between both groups and the correlation between near collision rate and cognitive measures were examined. SPSS version 23 was used for the analysis of the results.
According to AAA survey, on average, American drivers of all age groups, as well as the 65 to 74 years old, similar to this study’s age group, drive around 140 hours every six months [32]. For the analyses, the observation time window was set to 140 hours of driving exposure. In other words, two-weeks of driving data were used to predict the safety outcome of driving for approximately half year.
In addition to MMSE, two other cognitive measures were used in the analyses of this study, Trail Making Test part A (Trails A) and B (Trails B) [33]. Trail Making part A is a test of visual search and psychomotor speed in which participants are asked to connect a series of encircled numbers in order. In Part B, participants connect a series of encircled numbers and letters in order, alternating between number and letter. Part B is considered an executive functioning task, as it requires more complex attention and set shifting. Performance is measured in time to complete the test (maximum time set at 180 s for A and 300 s for B). Time to completion served as the dependent variable in analyses. Finally, the correlation was conducted between cognitive measures (MMSE, Trails A, Trails B) and near collision rate.
RESULTS
Analysis of the reduced data (detected events) revealed that, 13 out of the 44 cognitively impaired participants had near collision events, and 3 out of the 19 control group participants had near collision events. Cognitively impaired participants had a mean (SD) of 7.8(5.4) hours of driving, and control group participants had a mean (SD) of 8.9(6.2) hours of driving for two weeks of recording their driving.
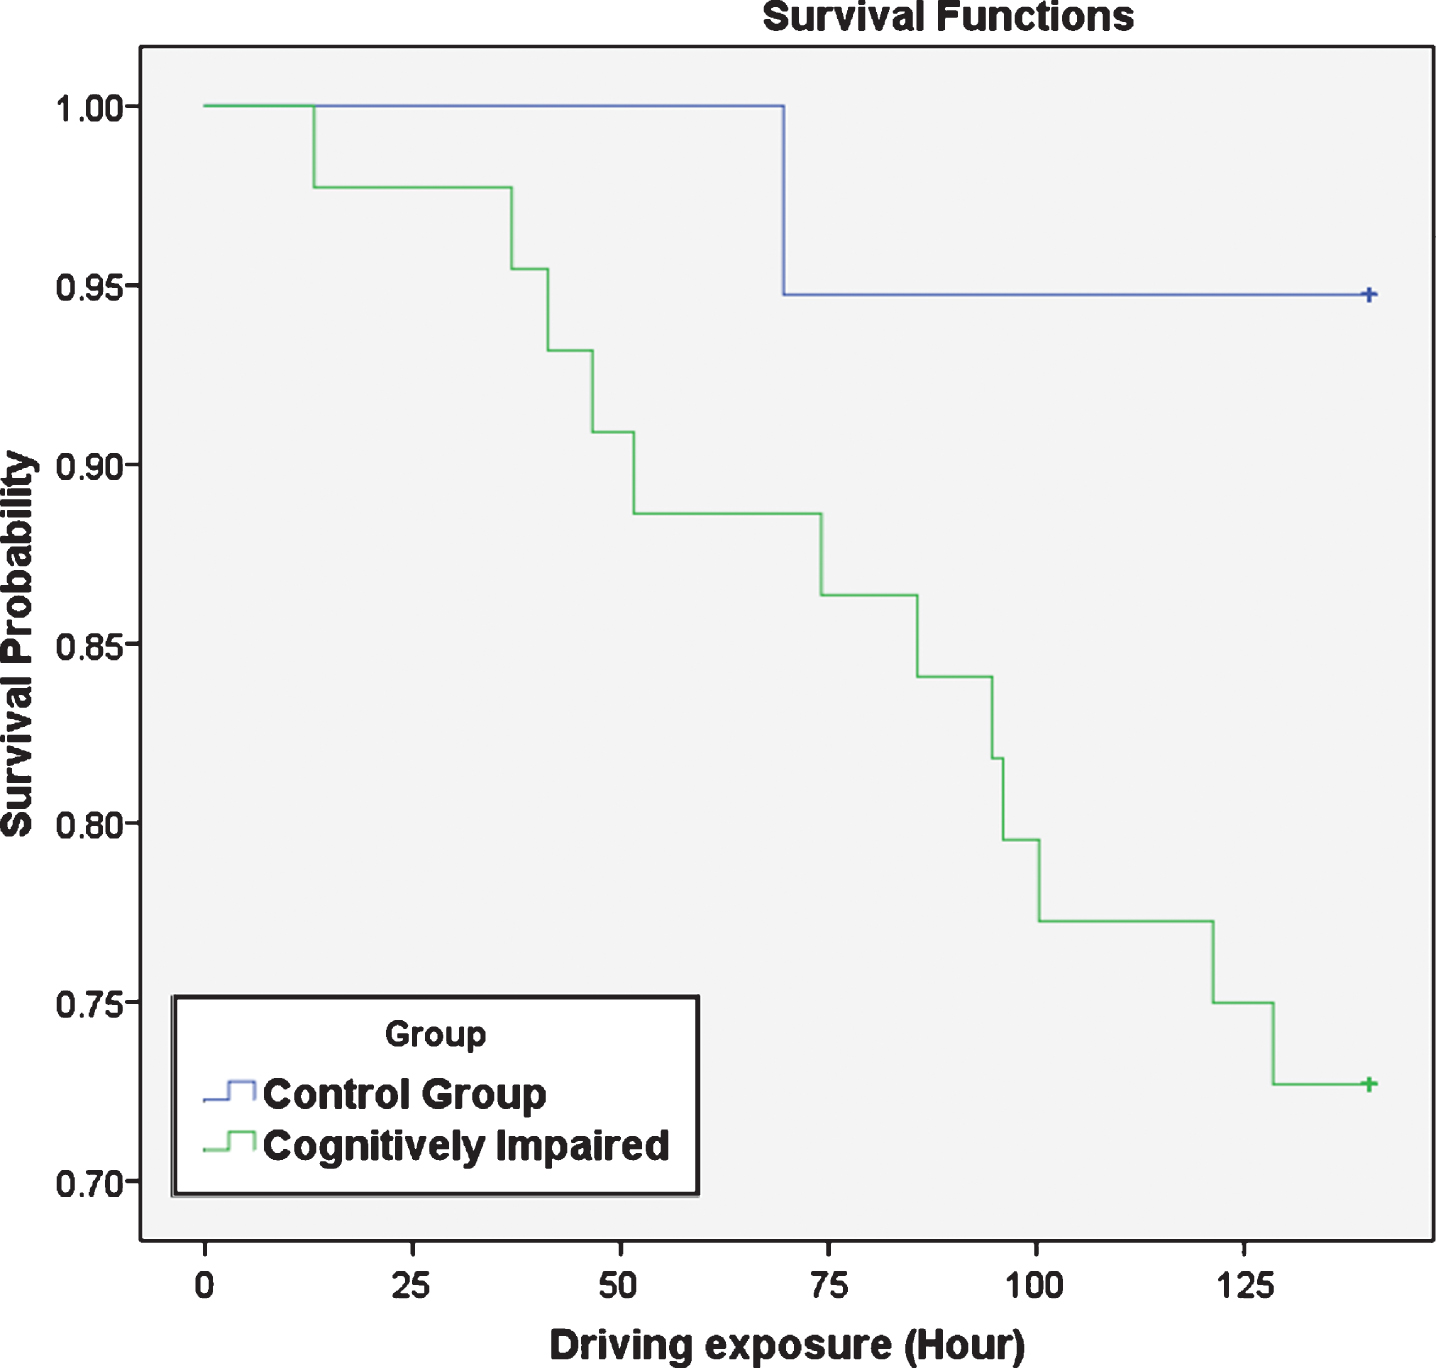
Participants’ predicted collision for 140-hour driving exposure was calculated, using the number of near collision events and their actual driving exposure. Among cognitively impaired participants, 12 had predicted collisions and among control group participants 1 driver had predicted collisions. Log Rank Kaplan Meier analysis showed a trend for the control group drivers to have longer survival time (Mean = 136.3 hours, SD = 34.8, CI = 129.2, 143.4) than cognitively impaired drivers (Mean = 122.1 hours, SD = 16.1, CI = 111.9, 132.2), as Fig. 1 shows (p = 0.056 and Chi-Squared = 3.646). The hazard ratio between cognitively impaired and control groups was 5.78 (p = 0.092). Backward stepwise Cox regression analysis was conducted for time to predicted collision, with MMSE, age, gender, and years of driving experience included as co-variances. The only significant predictor was MMSE (p < 0.025).
Fig.1
Survival probability of predicted collision for 140 hours of driving exposure.
The correlations between near collision rate and MMSE, Trails A, and Trails B, were conducted using Spearman’s correlation. It was found that near-collision rate was significantly correlated with MMSE (r = –0.258, p = 0.041), Trails A (r = 0.283, p = 0.025), and Trails B (r = 0.264, p = 0.036).
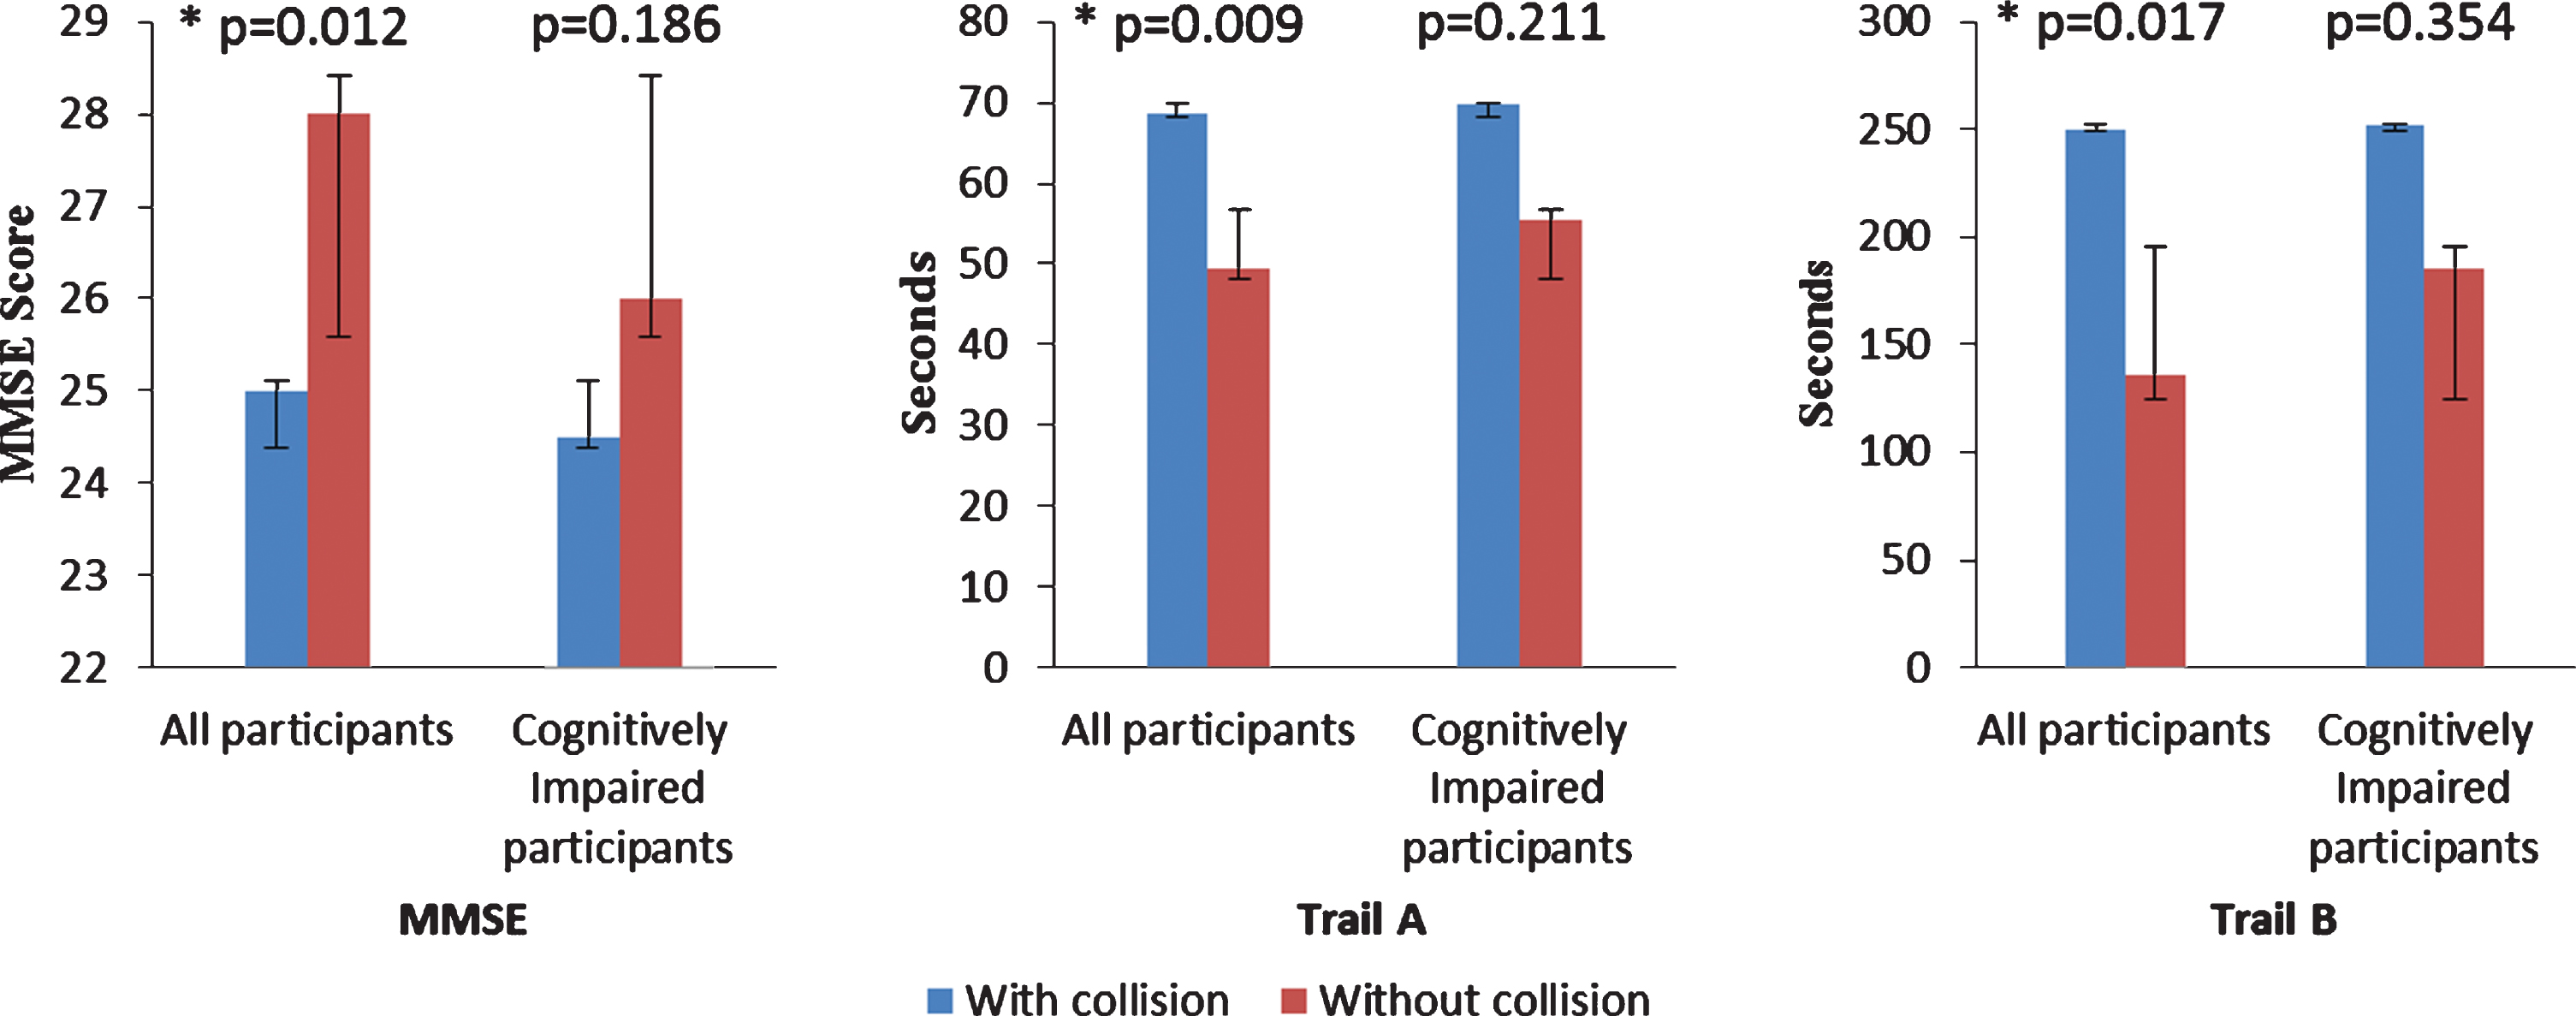
MMSE, Trails A and B between participants with and without predicted collision were compared on two types of participant samples; first, among all participants and, second, among only cognitively impaired participants (Fig. 2). None of the cognitive measures were significantly different between participants with and without predicted collision, if only the cognitively impaired participants are considered MMSE (p = 0.186), Trail A (p = 0.211), and Trail B (p = 0.354), although the trends were in the same direction. However, all three cognitive measures showed significant difference, if normal control participants were also included MMSE (p = 0.012), Trail A (p = 0.009), and Trail B (p = 0.017).
Fig.2
Comparing cognitive measures medians using Man Whitney U analysis between participants with and without predicted collision. In each figure, the left two columns show comparison among all participants and the right two columns show the comparison among cognitively impaired drivers. All three measures showed significant difference when comparing all participants while none of them showed significant difference when comparing only cognitively impaired participants. *indicates significant difference. The values of columns are MMSE: All participants (with collision 25, without collision 28), cognitively impaired participants (with collision 24.5, without collision 26). Trail A: all participants (with collision 68.5, without collision 49.4), cognitively impaired participants (with collision 69.6, without collision 55.5). Trail B: all participants: (with collision 250, without collision 135.6), cognitively impaired participants (with collision 251.9, without collision 185.5.)
DISCUSSION
This study examined the driving safety performance of cognitively impaired drivers based on near collision events captured by naturalistic driving recording and analysis systems. Drivers’ potential hazardous events were first extracted and then reviewed for near collision events. Combining our findings from Kaplan-Meier survival analysis of estimated survival time free of predicted collision (p = 0.056) and significant correlation between clinical cognitive measures and near-collision rate (p < 0.041), it is suggested that cognitively impaired participants might trend towards a higher probability of collisions than the control group. Despite a p value slightly above statistical significance, a hazard ratio of 5.78 (p = 0.092) can be concerning. It should be noted that patients who had at-fault collisions within the past one year were excluded at the time of enrollment for sake of subject protection, and this might have contributed to the fact that some of the analyses did not show significance. Nevertheless, the finding is qualitatively consistent with previous studies showing poorer driving performance in cognitively impaired participants under more artificial driving conditions [12, 26, 34, 35]. For instance, Frittelli et al. [34] found in a simulator study that cognitively impaired drivers had worse performance than healthy drivers. In another study, Duchek et al. [12] found that cognitively impaired drivers failed their road test due to unsafe rating sooner than their control group counterparts.
As Fig. 2 shows, this study found significant differences in cognitive measures between survivors (no predicted collision) and non-survivors (with at least one predicted collision) when both cognitively impaired and control group participants were included in the analysis, but not when looking at patients only. Cox regression analysis of predicted collision also found MMSE significant when both groups are included. It suggests that cognitive performance may have a role in driving safety, but because of the great variability in individuals as well as driving conditions the significance could not found when sample was reduced to patients only and the range of cognitive was narrow. Taken together, the findings on cognitive measures further suggest a potentially higher risk among cognitively impaired drivers compared to normal control.
In this study, the majority of the patients, 31 out 44, with mild cognitive impairment did not have any predicted collisions when considering 140 hours of driving exposure, which may indicate that not all cognitively impaired individuals are unsafe to drive. The question remains as to how we can predict with a high accuracy the risk of motor vehicle crash for a given patient. A single cognitive measure such as MMSE, Trail A, or B seems to be inadequate predictors of driving risk. Near collision rate in naturalistic driving might serve as one of the references to validate the new evaluation matrices that still need to be developed.
A significant strength of this study is the focus on critical near collision events accurately controlled for driving exposure. Presumably, this method could be more predictive of actual collisions than other driving performance investigations based on maneuver controlling or traffic violation, etc. Using predicted collision by hours of driving exposure may provide a measure to estimate potential risk in the context of a driver’s usual driving routine (i.e., time on the road).
Naturalistic driving examines drivers’ daily natural behaviors, rather than forcing them to drive in predefined sets of scenarios or locations, which allows considering drivers’ choice in the evaluation of their performance beyond test environment. Drivers might be aware of their limitations and avoid specific situations, by for example keeping a larger gap with surrounding vehicles or avoiding risky situations. A recent study [36] examined the naturalistic driving behaviors and habits of drivers with preclinical Alzheimer’s disease over 2.5 years, and found that they travelled less, travelled to fewer destinations, and depended more on other people to drive them, as compared to control group drivers. Drivers’ daily natural choices may also contribute to the difference in research study findings between standard road tests and evaluation based on naturalistic driving data.
There are some limitations in this study that is suggested to be considered in future studies on safe driving of cognitively impaired drivers. The control group participants were not balanced in terms of gender due to recruitment challenges which should be considered in future studies. The analysis of this study shows some clear trends; however, some of the results are slightly above statistical significance. It is suggested to have a larger sample size with longer recording duration for future studies in order to have stronger results. Also, considering the limitations of MMSE [37] and lack of clear driving safety threshold for a single cognitive measure [38], future studies with larger sample should also include other cognitive tests in order to create stronger and more comprehensive sets of measures for examining safe driving of cognitively impaired individuals.
CONFLICT OF INTEREST
The authors declare no conflict of interest.
ACKNOWLEDGMENTS
This study was supported in part by NIH grant R03AG046472 to Drs. Ott and Luo.
REFERENCES
[1] | Mayhew DR , Simpson HM , Ferguson SA ((2006) ) Collisions involving senior drivers: High-risk conditions and locations. Traffic Inj Prev 7: , 117–124. |
[2] | Kent R , Henary B , Matsuoka F ((2005) ) On the fatal crash experience of older drivers. Annu Proc Assoc Adv Automot Med 49: , 371–391. |
[3] | Centers for Disease Control and Prevention, National Center for Injury Prevention and Control. Web-based Injury Statistics Query and Reporting System (WISQARS). Centers for Disease Control and Prevention, Atlanta, GA. https://www.cdc.gov/injury/wisqars/index.html, Accessed on 16 August 2019. |
[4] | Baldock MRJ , Mathias JL , McLean AJ , Berndt A ((2006) ) Self-regulation of driving and its relationship to driving ability among older adults. Accid Anal Prev 38: , 1038–1045. |
[5] | Baldock MRJ , Mathias JL , McLean J , Berndt A ((2006) ) Self-regulation of driving and older drivers’ functional abilities. Clin Gerontol 30: , 53–70. |
[6] | Molnar LJ , Eby DW , Charlton JL , Langford J , Koppel S , Marshall S , Man-Son-Hing M ((2013) ) Driving avoidance by older adults: Is it always self-regulation? Accid Anal Prev 57: , 96–104. |
[7] | Molnar LJ , Eby DW , Roberts JS , St Louis RM , Langford J ((2009) ) A new approach to assessing self-regulation by older drivers: Development and testing of a questionnaire instrument. University of Michigan. |
[8] | McGuckin N , Fucci A ((2018) ) Summary of Travel Trends: 2017 National Household Travel Survey. Federal Highway Administration, Report Number: FHWA-PL-18-019. https://nhts.ornl.gov/assets/2017_nhts_summary_travel_trends.pdf |
[9] | Federal Highway Administration ((2008) ) 2008 status of the Nation’s highways, bridges, and transit: Conditions & performance. Report to Congress. U.S. Department of Transportation Federal Highway Administration. |
[10] | Hebert LE , Weuve J , Scherr PA , Evans DA ((2013) ) Alzheimer disease in the United States (2010–2050) estimated using the 2010 census. Neurology 80: , 1778–1783. |
[11] | Piersma D ((2018) ) Fitness to drive of older drivers with cognitive impairments (thesis). Rijksuniversiteit Groningen, Groningen. |
[12] | Duchek JM , Carr DB , Hunt L , Roe CM , Xiong C , Shah K , Morris JC ((2003) ) Longitudinal driving performance in early-stage dementia of the Alzheimer type. J Am Geriatr Soc 51: , 1342–1347. |
[13] | Davis J , Wang S , Festa E , Luo G , Moharrer M , Bernier J , Ott B ((2018) ) Detection of risky driving behaviors in the naturalistic environment in healthy older adults and mild Alzheimer’s disease. Geriatrics 3: , 13. |
[14] | Roe CM , Barco PP , Head DM , Ghoshal N , Selsor N , Babulal GM , Fierberg R , Vernon EK , Shulman N , Johnson A , Fague S , Xiong C , Grant EA , Campbell A , Ott BR , Holtzman DM , Benzinger TL , Fagan AM , Carr DB , Morris JC ((2017) ) Amyloid imaging, cerebrospinal fluid biomarkers predict driving performance among cognitively normal individuals. Alzheimer Dis Assoc Disord 31: , 69–72. |
[15] | Ott BR , Jones RN , Noto RB , Yoo DC , Snyder PJ , Bernier JN , Carr DB , Roe CM ((2017) ) Brain amyloid in preclinical Alzheimer’s disease is associated with increased driving risk. Alzheimers Dement (Amst) 6: , 136–142. |
[16] | Dingus TA , Klauer SG , Neale VL , Petersen A , Lee SE , Sudweeks J , Perez MA , Hankey J , Ramsey D , Gupta S , Bucher C , Doerzaph ZR , Jermeland J , Knipling RR ((2006) ) The 100-Car Naturalistic Driving Study, Phase II - Results of the 100-Car Field Experiment. Virginia Tech Transportation Institute. Report Number: DOT HS 810 593. |
[17] | Eby DW , Silverstein NM , Molnar LJ , LeBlanc D , Adler G ((2012) ) Driving behaviors in early stage dementia: A study using in-vehicle technology. Accid Anal Prev 49: , 330–337. |
[18] | Marshall SC , Wilson KG , Man-Son-Hing M , Stiell I , Smith A , Weegar K , Kadulina Y , Molnar FJ ((2013) ) The Canadian Safe Driving Study—Phase I pilot: Examining potential logistical barriers to the full cohort study. Accid Anal Prev 61: , 236–244. |
[19] | Marshall SC , Man-Son-Hing M , Bédard M , Charlton J , Gagnon S , Gélinas I , Koppel S , Korner-Bitensky N , Langford J , Mazer B , Myers A , Naglie G , Polgar J , Porter MM , Rapoport M , Tuokko H , Vrkljan B , Woolnough A ((2013) ) Protocol for Candrive II/Ozcandrive, a multicentre prospective older driver cohort study. Accid Anal Prev 61: , 245–252. |
[20] | Li G , Eby DW , Santos R , Mielenz TJ , Molnar LJ , Strogatz D , Betz ME , DiGuiseppi C , Ryan LH , Jones V , Pitts SI , Hill LL , DiMaggio CJ , LeBlanc D , Andrews HF , Bogard S , Chihuri S , Engler A-M , Feng M , Gessner R , Grabowski JG , Guralnik J , Hewitt B , Johnson A , Kostyniuk LP , Lang BH , Leu C , Merlel D , Nyquist LV , Parnham T , Scott K , Renée M , Ventura M , Yung R , Zanier N , Zakrajsek J , LongROAD Research Team ((2017) ) Longitudinal Research on Aging Drivers (LongROAD): study design and methods. Injury Epidemiology 4: , 22. |
[21] | Tarko AP ((2018) ) Surrogate measures of safety. In Safe Mobility: Challenges, Methodology and Solutions, pp. 383–405. |
[22] | Guo F , Klauer SG , McGill MT , Dingus TA ((2010) ) Evaluating the relationship between near-crashes and crashes: Can near-crashes serve as a surrogate safety metric for crashes? Virginia Tech Transportation Institute. Report Number: DOT HS 811 382. |
[23] | Wu K-F , Aguero-Valverde J , Jovanis PP ((2014) ) Using naturalistic driving data to explore the association between traffic safety-related events and crash risk at driver level. Accid Anal Prev 72: , 210–218. |
[24] | Luo G , Peli E ((2012) ) Methods for automated identification of informative behaviors in natural bioptic driving. IEEE Trans Biomed Eng 59: , 1780–1786. |
[25] | Dingus TA , Guo F , Lee S , Antin JF , Perez M , Buchanan-King M , Hankey J ((2016) ) Driver crash risk factors and prevalence evaluation using naturalistic driving data. Proc Natl Acad Sci U S A 113: , 2636–2641. |
[26] | Davis J , Papandonatos GD , Miller LA , Hewitt SD , Festa EK , Heindel WC , Ott BR ((2012) ) Road test and naturalistic driving performance in healthy and cognitively impaired older adults: does environment matter? J Am Geriatr Soc 60: , 2056–2062. |
[27] | Carr DB , Ott BR ((2010) ) The older adult driver with cognitive impairment: “It’s a very frustrating life”. JAMA 303: , 1632–1641. |
[28] | Morris JC ((1993) ) The Clinical Dementia Rating (CDR): current version and scoring rules. Neurology 43: , 2412–2414. |
[29] | Wang S , Ott BR , Luo G ((2018) ) Detection of lane-change events in naturalistic driving videos. Intern J Pattern Recognit Artif Intell 32: , 1850030. |
[30] | Myers LA , Russi CS , Will MD , Hankins DG ((2012) ) Effect of an onboard event recorder and a formal review process on ambulance driving behaviour. Emerg Med J 29: , 133–135. |
[31] | Heinrich HW ((1941) ) Industrial Accident Prevention. A Scientific Approach. McGraw-Hill Book Company, Inc., New York & London. |
[32] | Triplett T , Santos R , Rosenbloom S , Tefft B ((2016) ) American driving survey: 2014–2015. AAA Foundation for Traffic Safety. https://aaafoundation.org/wp-content/uploads/2017/12/AmericanDrivingSurvey2015FS.pdf |
[33] | Reitan RM ((1956) ) Trail Making Test: Manual for Administration, Scoring and Interpretation. Indiana University Press. |
[34] | Frittelli C , Borghetti D , Iudice G , Bonanni E , Maestri M , Tognoni G , Pasquali L , Iudice A ((2009) ) Effects of Alzheimer’s disease and mild cognitive impairment on driving ability: a controlled clinical study by simulated driving test. Int J Geriatr Psychiatry 24: , 232–238. |
[35] | O’Connor MG , Duncanson H , Hollis AM ((2019) ) Use of the MMSE in the prediction of driving fitness: relevance of specific subtests. J Am Geriatr Soc 67: , 790–793. |
[36] | Roe CM , Stout SH , Rajasekar G , Ances BM , Jones JM , Head D , Benzinger TLS , Williams MM , Davis JD , Ott BR , Warren DK , Babulal GM ((2019) ) A 2.5-year longitudinal assessment of naturalistic driving in preclinical Alzheimer’s disease. J Alzheimers Dis 68: , 1625–1633. |
[37] | Nieuwenhuis-Mark RE ((2010) ) The death knoll for the MMSE: has it outlived its purpose? J Geriatr Psychiatry Neurol 23: , 151–157. |
[38] | Molnar FJ , Patel A , Marshall SC , Man-Son-Hing M , Wilson KG ((2006) ) Clinical utility of office-based cognitive predictors of fitness to drive in persons with dementia: a systematic review. J Am Geriatr Soc 54: , 1809–1824. |

