
Identification of Superficial White Matter Abnormalities in Alzheimer’s Disease and Mild Cognitive Impairment Using Diffusion Tensor Imaging
Abstract
Background:
Diffusion tensor imaging (DTI) estimates the microstructural alterations of the brain, as a magnetic resonance imaging (MRI)-based neuroimaging technique. Prior DTI studies reported decreased structural integrity of the superficial white matter (SWM) in the brain diseases.
Objective:
This study aimed to determine the diffusion characteristics of SWM in Alzheimer’s disease (AD) and mild cognitive impairment (MCI) using tractography and region of interest (ROI) approaches.
Methods:
The diffusion MRI data were downloaded from the Alzheimer’s Disease Neuroimaging Initiative (ADNI) database on 24 patients with AD, 24 with MCI, and 24 normal control (NC) subjects. DTI processing was performed using DSI Studio software. First, for ROI-based analysis, The superficial white matter was divided into right and left frontal, parietal, temporal, insula, limbic and occipital regions by the Talairach Atlas, Then, for tractography-based analysis, the tractography of each of these regions was performed with 100000 seeds. Finally, the average diffusion values were extracted from voxels within the ROIs and tracts.
Results:
Both tractography and ROI analyses showed a significant difference in radial, axial and mean diffusivity values between the three groups (p < 0.05) across most of the SWM. Furthermore, The Mini-Mental State Examination was significantly correlated with radial, axial, and mean diffusivity values in parietal and temporal lobes SWM in the AD group (p < 0.05).
Conclusion:
DTI provided information indicating microstructural changes in the SWM of patients with AD and MCI. Therefore, assessment of the SWM using DTI may be helpful for the clinical diagnosis of patients with AD and MCI.
INTRODUCTION
Diffusion tensor imaging (DTI) has been used in recent years as a strong and non-invasive neuroimaging technique, which can provide useful information for detecting damage to white matter in neurodegenerative diseases by measuring the diffusion properties of water molecules [1, 2]. Four important quantitative measures of DTI are axial diffusivity (AxD), radial diffusivity (RD), mean diffusivity (MD), and fractional anisotropy (FA). FA describes the degree of anisotropy of water diffusion. MD is the average rate of diffusion along all directions and is typically increased with damage to myelin sheaths. AD is diffusion parallel to axons, while radial diffusivity (RD) reflects the two vectors of diffusion perpendicular to the axon [3].
DTI tractography is a potential 3D tool for detecting white matter pathology and evaluating the microstructural integrity of white matter fiber bundles using information collected by DTI [4] that was developed by Mori et al. [5]. DTI and fiber tractography may be used in the diagnosis of Alzheimer’s disease (AD) and mild cognitive impairment (MCI).
AD is the most prevalent form of dementia in the elderly population that caused by the presence of amyloid-β (Aβ) plaque and hyperphosphorylated tau protein as neurofibrillary tangles in the brain and finally cause neuronal death and damage to the brain tissue [6].
MCI is a type of cognitive decline characterized by significant memory loss without functional impairments. Individuals with MCI do not fulfill the clinical criteria for dementia but they have a high risk for progression to dementia. This fact shows that the detection of MCI is important [7, 8]. It is believed that differential diagnosis of between normal subject and MCI and between MCI and AD are difficult and very important, and clinical neuroimaging techniques can be used to make these distinctions [9].
AD and MCI affect certain regions of the brain. Therefore, the atlas-based method for the study of white matter integrity invariant regions of interest (ROI) has been widely used [10]. Superficial white matter (SWM) is one of the regions that may play an important role in the diagnosis of AD [11, 12] and MCI.
SWM is located between gray matter and deep white matter and mainly consists of short-range association fibers (such as U-shaped fibers which connect neighboring gyri). The cellular and structural arrangement of the SWM differs from the deep white matter. For example, according to the retrogenesis model, fibers that myelinate later in development are the first to be affected by damage [13, 14]. The SWM, unlike the deep white matter, is comprised of late-myelinating fibers. Therefore, they are vulnerable to neurodegenerative processes. Furthermore, oligodendrocytes that produce the myelin sheath insulating neuronal axons tend to myelinate with fewer wraps in the SWM than the deep white matter. Accordingly, SWM axons are more sensitive to impairments [11].
Recent studies showed decreased structural integrity and high sensitivity of SWM in multiple sclerosis [15], autism [16], schizophrenia [17, 18], Huntington’s disease [19], AD [11, 12], and cognitive decline in aging [20, 21]. According to our knowledge, no studies have assessed DTI values in this region in MCI.
There are many different methods for analyzing DTI data with their own advantages and restrictions. As different information and results are provided by different methods, performing more than one type of analysis is often valuable to earn insight into the results of each method [22]. Methods used in recent studies include Tract-Based-Spatial-Statistics (TBSS) [23], connectivity analysis [24–27], voxel-based and ROI analyses [28], tractography analysis [18, 21], and other methods. In the present study, we performed ROI and tractography approaches of the SWM region.
The purpose of the present study was the detection of SWM microstructural changes in AD and MCI using DTI through the region of interest and tractography techniques.
MATERIALS AND METHODS
Clinical data and demographics
Data used in the preparation of this article were obtained from the ADNI database (http://adni.loni.usc.edu). The ADNI was launched in 2003 as a public-private partnership, led by Principal Investigator Michael W. Weiner, MD. The primary goal of ADNI has been to test whether serial MRI, positron emission tomography, other biological markers, and clinical and neuropsychological assessment can be combined to measure the progression of MCI and early AD. For up-to-date information, see http://www.adni-info.org.
The diffusion MRI, clinical, and neuropsychological data of subjects were downloaded from the ADNI database. Subjects including AD (n = 24), MCI (n = 24), and control (n = 24) groups were obtained from ADNI2 project (Table 1).
Table 1
Demographics and clinical scores for the participants
| NC (n = 24) Mean (SD) | MCI (n = 24) Mean (SD) | AD (n = 24) Mean (SD) | p | |
| Age | 75.3 (8.3) | 76 (8.6) | 76.4 (8.2) | 0.89 |
| Sex | 11 M/13 F | 12 M/12 F | 16 M/8 F | 0.3 |
| Global CDR | 0.021 (0.1) | 0.58 (0.19) | 1.1 (0.116) | <0.001 |
| FAQ Total Score | 0.08 (0.4) | 4.9 (6.9) | 19.7 (6.2) | <0.001 |
| MMSE | 29 (1.2) | 26.7 2) | 20.1 (4.9) | <0.001 |
CDR, Clinical Dementia Rating; FAQ, Functional Activities Questionnaire; MMSE, Mini-Mental State Examination; NC, normal controls; MCI, mild cognitive impairment; AD, Alzheimer’s disease; M, male; F, female. p < 0.05 was considered statistically significant and bold font indicates statistical significance.
Statement of ethics
The study was reviewed and approved by the Ethical Committee of Mashhad University of Medical Sciences (Ethical number: IR.MUMS.MEDICAL.REC.1397.320).
MRI and DTI scanning
The diffusion MRI data originated from ADNI2 project with the following parameters: Axial diffusion-weighted image data were acquired with an echo-planar imaging sequence. Scan parameters were: Manufacturer = GE MEDICAL SYSTEMS; field strength = 3.0T; Pulse Sequence = EP/SE flip angle = 90°; b = 1000 s/mm2; gradient directions = 41; pixel size = 1.36×1.36 mm2; repetition time (TR) = 9050 ms; echo time (TE) = 62.8 ms; slice thickness = 2.7 mm; Matrix X = 256.0 pixels; Matrix Y = 256.0 pixels; Matrix Z = 2714.0.
DTI processing
Preprocessing and reconstruction steps
The diffusion MRI data were preprocessed using DSI-Studio software (developed by Fang-Cheng Yeh from the Advanced Biomedical MRI Lab, National Taiwan University Hospital, Taiwan, Supported by Fiber Tractography Lab, University of Pittsburgh, and made available at http://dsi-studio.labsolver.org/Download/). For skull stripping and filtering the background region, we used the masks provided by DSI-Studio. Prior to DTI parameter measurement, head motion and eddy current effects were corrected using the DSI-Studio toolbox. DSI Studio (http://dsi-studio.labsolver.org) supports several reconstruction methods and categorizes them into model-based and model-free methods. Model-based methods suppose a specific diffusion distribution pattern [29]. In the present study, the DTI reconstruction approach performed as a model-based method and tensor calculation carried out by the linear equation system using least square fitting which can be a very effective and very fast tool in data analysis [30].
Next, the average DTI values were extracted from voxels within the ROIs and tracts.
ROI approach
We used Superficial White Matter Mask which was obtained from a similar study [18, 21] in Montreal Neurological Institute (MNI) space (Fig. 1). Based on the Terminologia Anatomica 1998 [31] and Terminologia Neuroanatomical 2017 (FIPAT, Terminologia Neuroanatomica, FIPAT.library.dal.ca. Federative International Programme for Anatomical Terminology, February 2017) that divided cerebrum into 6 lobes, including frontal, parietal, temporal, occipital, limbic, and insular lobes. We divided these areas into right and left hemispheres for a more detailed review by the Talairach Atlas [32] (Fig. 2). In total, 12 SWM regions and average DTI values were calculated for each region.
Fig.1
Three-plane view of whole brain Superficial White Matter Mask which was obtained from the similar study [18, 21] in Montreal Neurological Institute space.
![Three-plane view of whole brain Superficial White Matter Mask which was obtained from the similar study [18, 21] in Montreal Neurological Institute space.](https://content.iospress.com:443/media/adr/2020/4-1/adr-4-1-adr190149/adr-4-adr190149-g001.jpg)
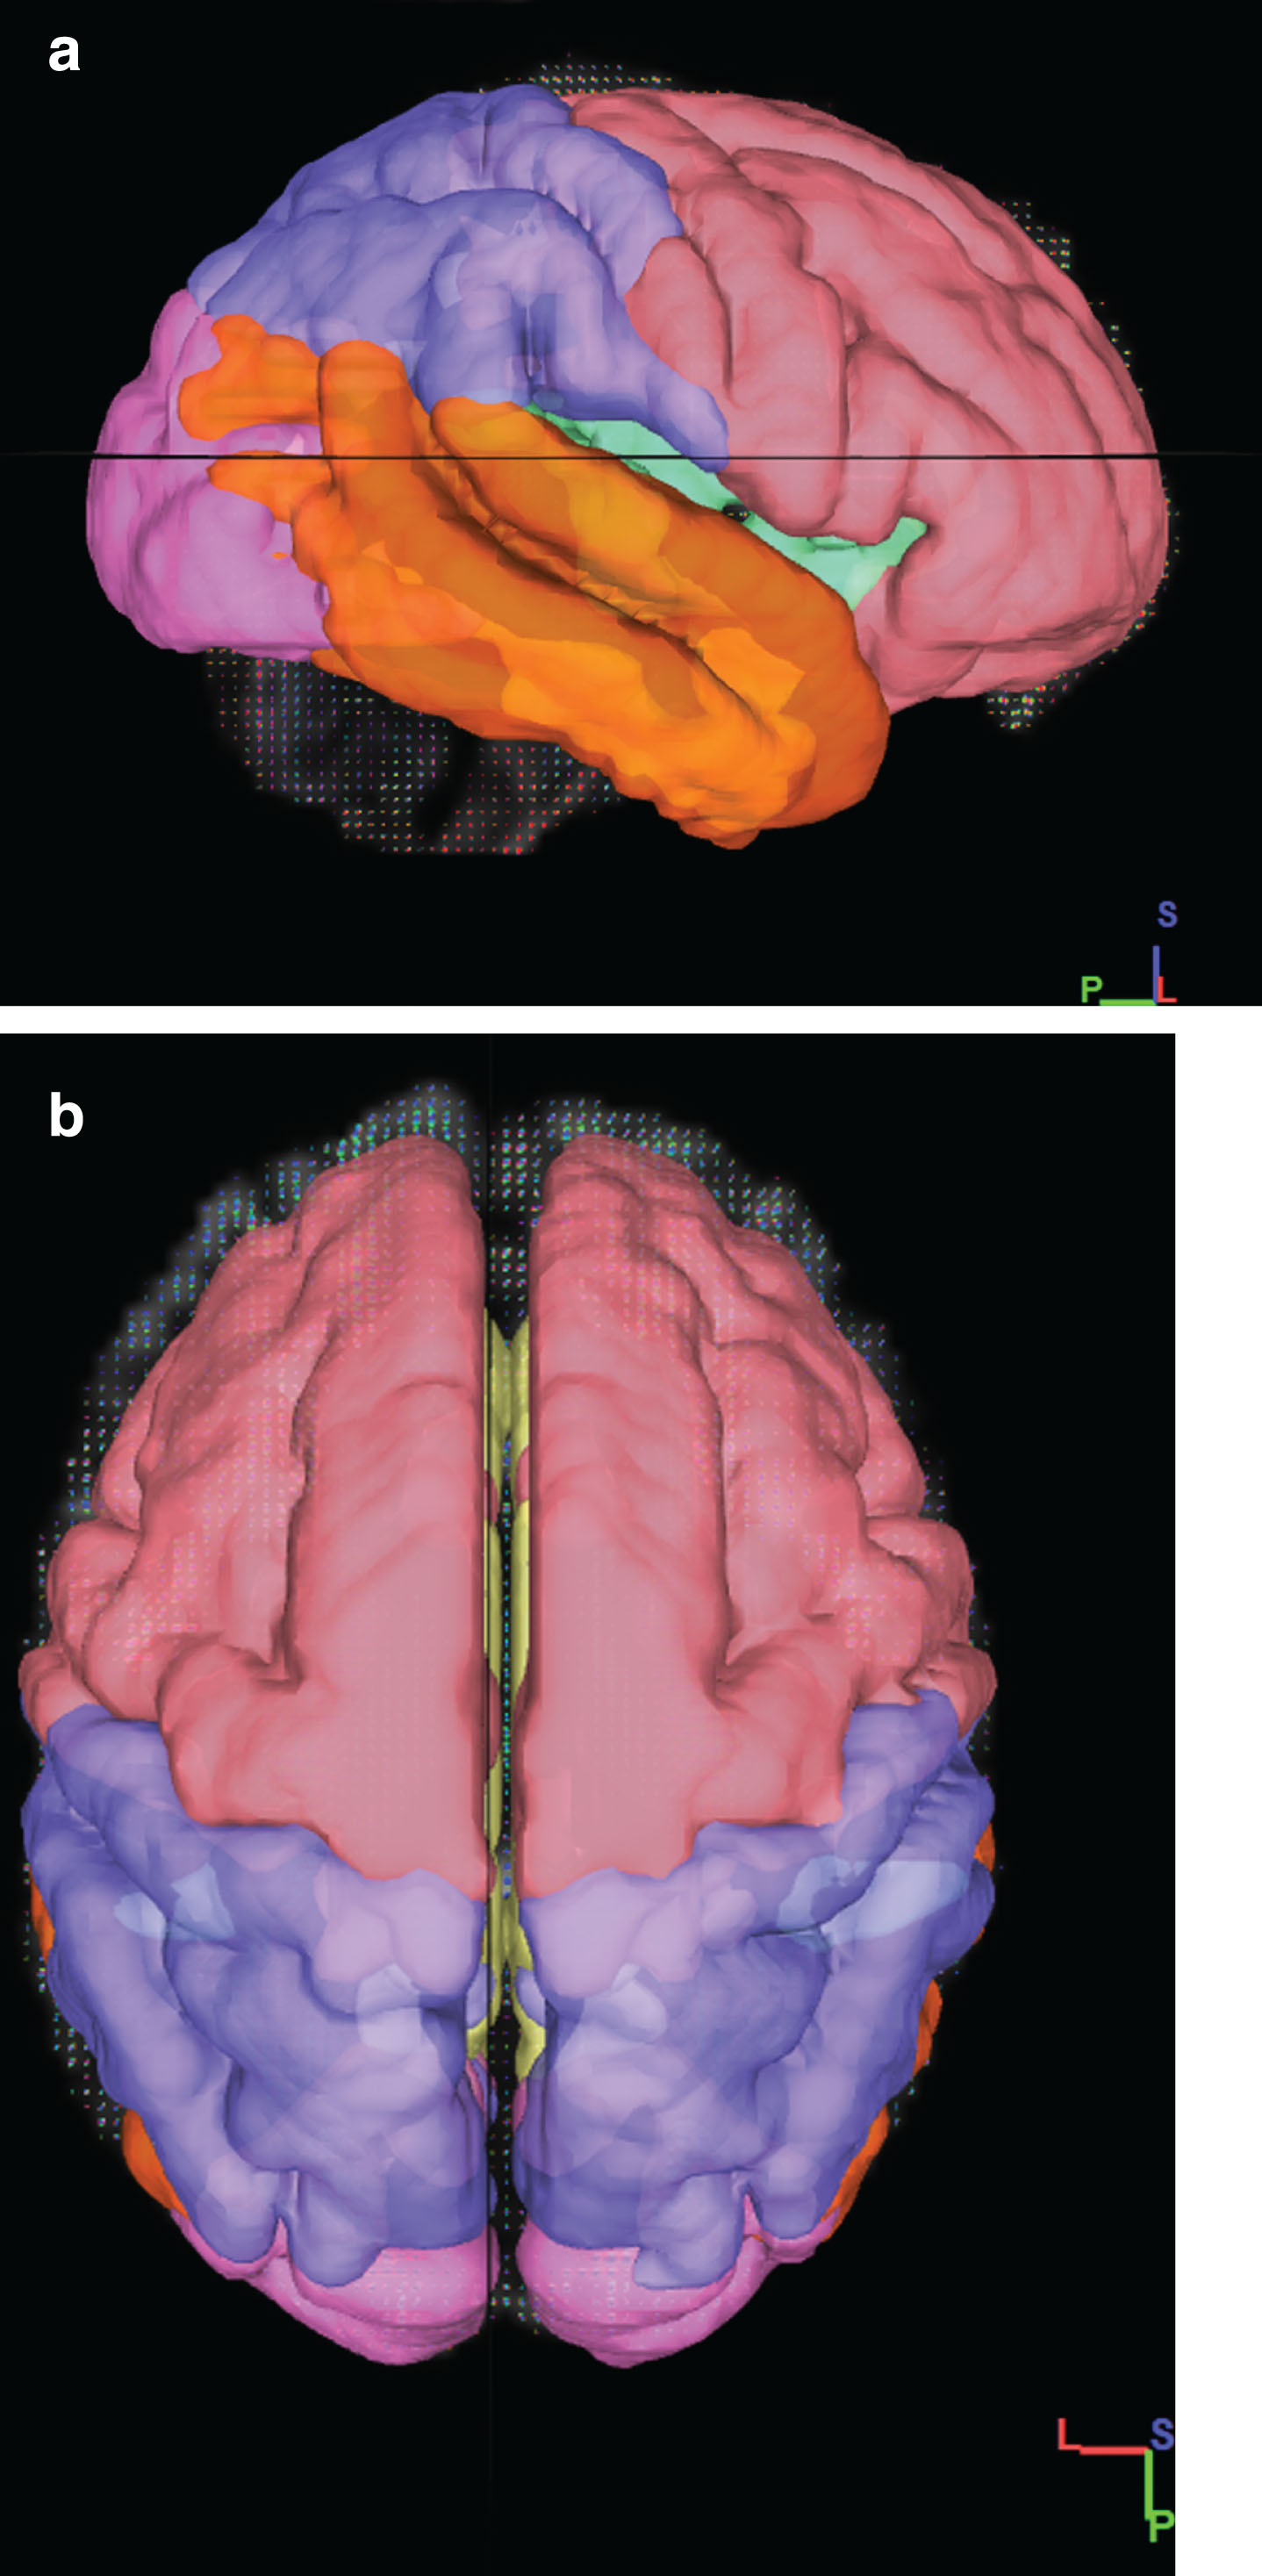
Fig.2
Overview of the division of the SWM of the brain into the frontal (pink), insula (green), limbic (yellow), parietal (blue), temporal (orange), occipital (Purple) lobes. a) 3D sagittal view b) 3D Axial View.
Tractography approach
FA index was used to determine the fiber tracking threshold and Otsu’s method was used to set the anisotropy (FA) threshold to stop the fiber tracking. In other words, tracking was terminated if the anisotropy of the next step fell below the defined threshold. Then the tractography of each SWM region was performed with 100000 seeds was randomly generated at subvoxel positions and the seeds were placed across all SWM regions, step size of 0 (0.5 voxel to 1.5 voxel distance) and smoothing of 1. The tracking from the primary fiber of a seeding point was set to streamline (Euler), and the direction interpolation was set to trilinear. Fibers length range was set between 30 to 300 mm.
In order to obtain the exact fiber pathway of the region, The SWM mask was selected as ROI and the other areas of the brain defined as ROA (region of avoidance). Finally, with this method, fiber tracking restricted in the SWM mask (i.e., U-fibers and intraregional fibers) and all passing fibers through the exclusion region (ROA) mask were deleted. Examples of total SWM tracts are shown in Figure 3. The average of the DTI measure, e.g., FA, is calculated from all voxels that are part of the delineated tract
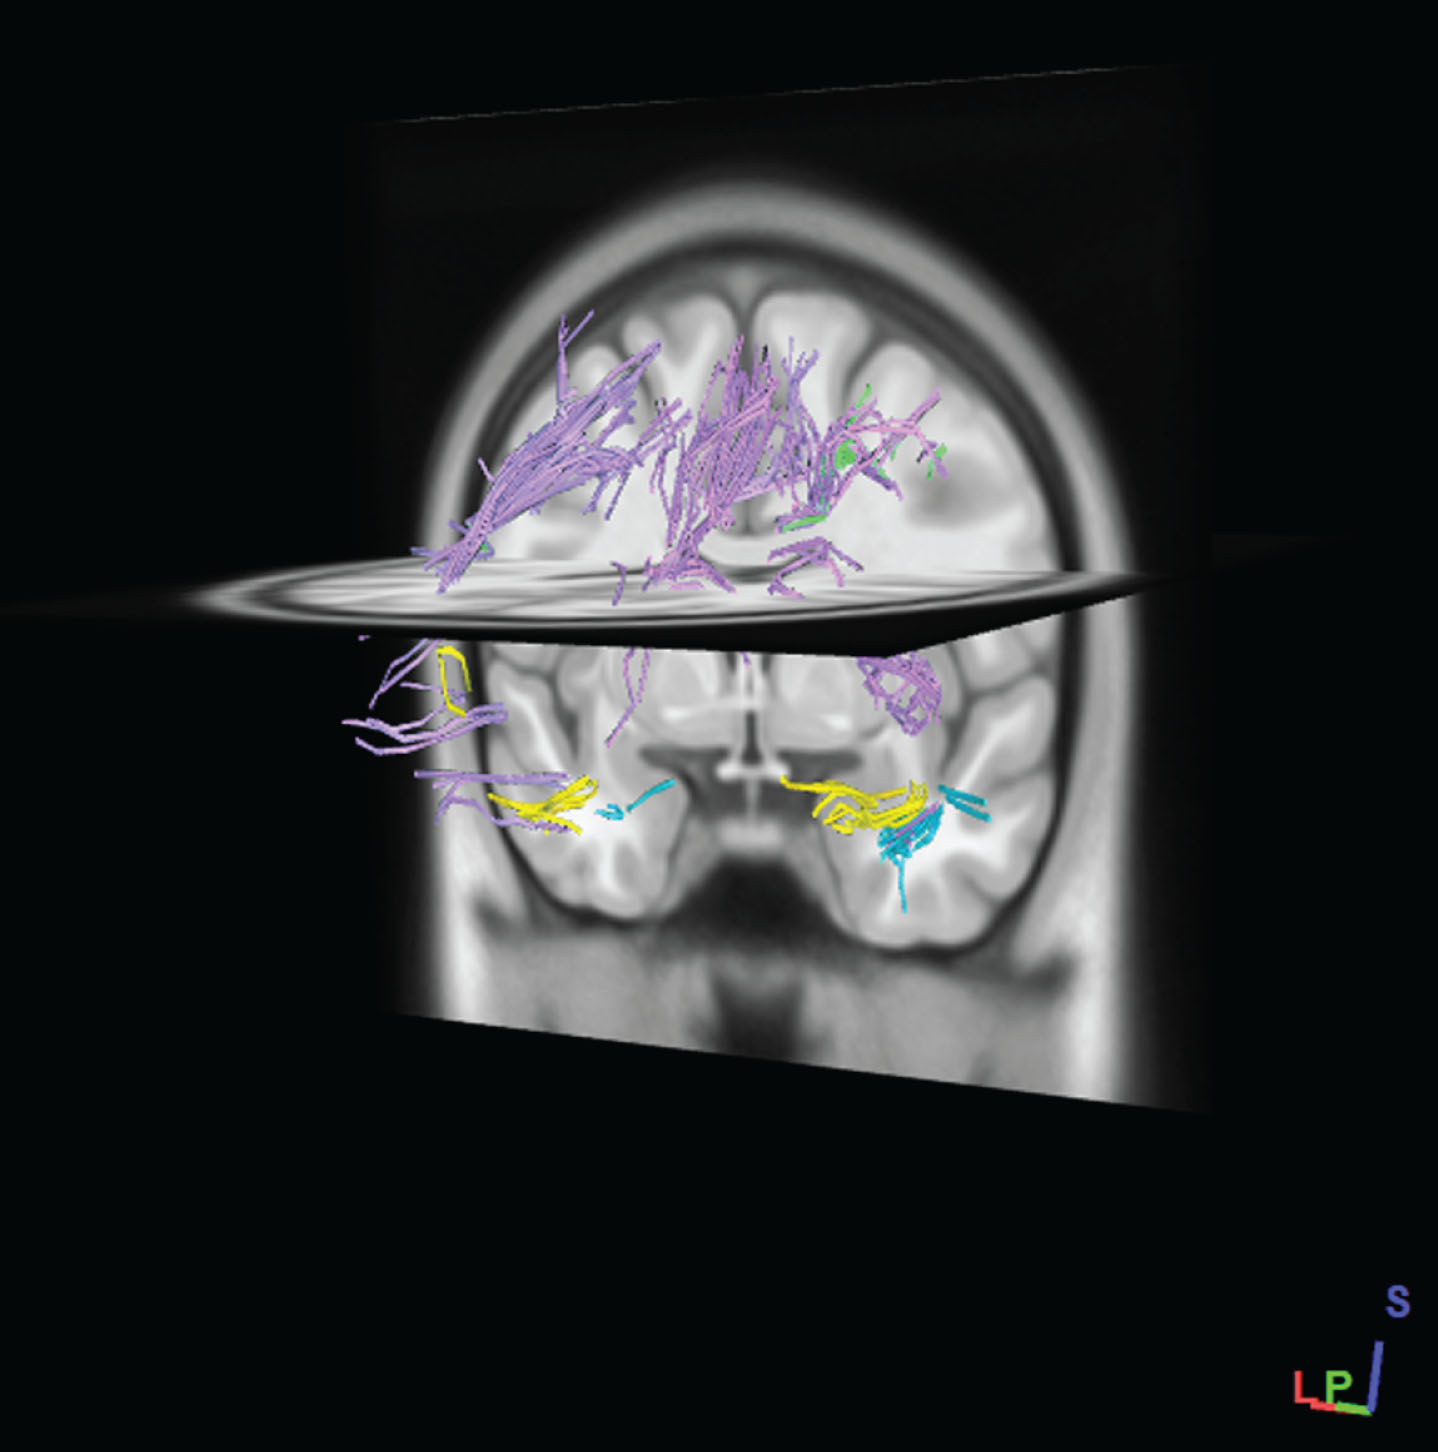
Fig.3
Example of SWM fibers pathways which generated by tractography of total SWM regions in standard MNI-ICBM152 template. Fibers pathways were recognized automatically according to an atlas-based tractography segmentation. (After performing the tractography of SWM regions, regions have been removed to better fibers pathways appear.)
Statistical analysis
We conducted between-group comparisons of demographic variables and neuropsychological scores using One-way analysis of variance (ANOVA) statistics for continuous variables (age and cognitive scores) and chi-squared tests for the qualitative variable (gender). After calculating the DTI values (FA, MD, RD, and AxD) per ROIs and along the extracted tracts as the response variables (dependent variables) in all three groups (independent variables), the normality of this data was assessed using the Kolmogorov-Smirnov test. Then for those variables in which normality assumption was satisfied, ANOVA with the post hoc multiple comparison (Bonferroni) test was used. In other words, ANOVA was first used to compare the means of the normal variables in the three groups. Subsequently, the pairwise post-hoc multiple comparison (Bonferroni) test was used to determine which of the two groups were significantly different in each value. The nonparametric method (Kruskal Wallis test) was used for non-normality values. Finally, spearman’s correlation coefficients were performed between the Mini-Mental State Examination (MMSE) scores and DTI indices of SWM ROIs. p-value <0.05 was considered statistically significant and all statistical analyses were performed using SPSS 24.0 software (SPSS Inc., Chicago, IL).
RESULTS
Subject demographics and clinical data
Demographics and clinical scores of participants are shown in Table 1. Age and sex as the confounding variables (nuisance variables) were not significantly different between the normal controls (NC), MCI, and AD groups. MMSE, Functional Activities Questionnaire (FAQ) Total, and Global Clinical Dementia Rating (CDR) scores were significantly different between the three groups (MMSE scores: CN group versus MCI Group, p = 0.036; MCI group versus AD group, p < 0.001; NC group versus AD group, p < 0.001; FAQ Total scores: CN group versus MCI Group, p = 0.007; MCI group versus AD group, p < 0.001; NC group versus AD group, p < 0.001; Global CDR scores: CN group versus MCI Group, p < 0.001; MCI group versus AD group, p < 0.001; NC group versus AD group, p < 0.001).
ROI analysis
ANOVA demonstrated a significant difference in AxD, MD, and RD values in many regions between the three groups (p < 0.05). In contrast, the FA was not significantly different between the groups in none of the regions (Table 2).
Table 2
Multiple comparisons of DTI measures of ROI (dependent variables) in MCI, AD, and control groups
| CN Mean (SD) | MCI Mean (SD) | AD Mean (SD) | p | |
| AxD | ||||
| Left frontal | 1.21 (0.12) | 1.24 (0.08) | 1.29 (0.12) | 0.074 |
| Left insula | 1.21 (0.17)* | 1.23 (0.11) | 1.31 (0.11) | 0.026 |
| Left limbic | 1.37 (0.21)* | 1.52 (0.33)* | 1.75 (0.32) | <0.001 |
| Left occipital | 1.21 (0.16) | 1.26 (0.16) | 1.33 (0.19) | 0.057 |
| Left parietal | 1.25 (0.18) | 1.26 (0.11) | 1.26 (0.11) | 0.054 |
| Left temporal | 1.27 (0.14)* | 1.35 (0.17)* | 1.35 (0.17) | <0.001 |
| Right frontal | 1.22 (0.12) | 1.26 (0.09) | 1.26 (0.09) | 0.051 |
| Right insula | 1.26 (0.21)* | 1.31 (0.15) | 1.31 (0.15) | 0.007 |
| Right limbic | 1.33 (0.19)* | 1.48 (0.35) | 1.48 (0.35) | 0.001 |
| Right occipital | 1.19 (0.14) | 1.19 (0.11) | 1.19 (0.11) | 0.19 |
| Right parietal | 1.27 (0.19) | 1.28 (0.13) | 1.28 (0.13) | 0.072 |
| Right temporal | 1.24 (0.16)* | 1.31 (0.18)* | 1.31 (0.18) | <0.001 |
| MD | ||||
| Left frontal | 0.96 (0.11) | 0.98 (0.07) | 1.03 (0.11) | 0.085 |
| Left insula | 0.92 (0.11)* | 0.94 (0.08) | 0.97 (0.08) | 0.038 |
| Left limbic | 1.04 (0.16)* | 1.19 (0.31)* | 1.36 (0.29) | <0.001 |
| Left occipital | 0.96 (0.13)* | 1.01 (0.14) | 1.09 (0.17) | 0.013 |
| Left parietal | 0.99 (0.16) | 1.01 (0.09) | 1.08 (0.14) | 0.061 |
| Left temporal | 0.98 (0.11)* | 1.06 (0.14)* | 1.29 (0.18) | <0.001 |
| Right frontal | 0.95 (0.11)* | 1.01 (0.07) | 1.03 (0.11) | 0.024 |
| Right insula | 0.97 (0.14)* | 1.02 (0.12) | 1.12 (0.16) | 0.002 |
| Right limbic | 1.01 (0.15)* | 1.15 (0.33) | 1.31 (0.29) | 0.001 |
| Right occipital | 0.95 (0.12) | 0.96 (0.09) | 1.02 (0.12) | 0.018 |
| Right parietal | 0.99 (0.18)* | 1.02 (0.11) | 1.11 (0.14) | 0.043 |
| Right temporal | 0.96 (0.14)* | 1.03 (0.15)* | 1.23 (0.22) | <0.001 |
| RD | ||||
| Left frontal | 0.84 (0.11) | 0.86 (0.11) | 0.89 (0.11) | 0.11 |
| Left insula | 0.81 (0.11) | 0.79 (0.11) | 0.81 (0.08) | 0.97 |
| Left limbic | 0.91 (0.16)* | 1.02 (0.16) | 1.17 (0.08) | 0.003 |
| Left occipital | 0.87 (0.14) | 0.86 (0.13) | 0.97 (0.16) | 0.051 |
| Left parietal | 0.88 (0.15) | 0.87 (0.16) | 0.94 (0.13) | 0.13 |
| Left temporal | 0.86 (0.11)* | 0.92 (0.11)* | 1.13 (0.17) | <0.001 |
| Right frontal | 0.84 (0.11) | 0.87 (0.11) | 0.91 (0.09) | 0.074 |
| Right insula | 0.85 (0.14)* | 0.88 (0.14) | 0.96 (0.16) | 0.026 |
| Right limbic | 0.86 (0.14)* | 0.97 (0.15) | 1.12 (0.29) | 0.005 |
| Right occipital | 0.85 (0.12) | 0.85 (0.12) | 0.91 (0.11) | 0.21 |
| Right parietal | 0.89 (0.16) | 0.89 (0.18) | 0.97 (0.14) | 0.14 |
| Right temporal | 0.84 (0.13)* | 0.89 (0.14)* | 1.08 (0.21) | <0.001 |
| FA | ||||
| Left frontal | 0.27 (0.02) | 0.27 (0.01) | 0.27 (0.02) | 0.76 |
| Left insula | 0.30 (0.05) | 0.29 (0.04) | 0.30 (0.05) | 0.08 |
| Left limbic | 0.28 (0.05) | 0.27 (0.05) | 0.28 (0.05) | 0.32 |
| Left occipital | 0.24 (0.02) | 0.24 (0.02) | 0.24 (0.02) | 0.41 |
| Left parietal | 0.26 (0.02) | 0.27 (0.01) | 0.26 (0.02) | 0.57 |
| Left temporal | 0.27 (0.02) | 0.26 (0.01) | 0.27 (0.02) | 0.21 |
| Right frontal | 0.28 (0.02) | 0.27 (0.01) | 0.28 (0.02) | 0.31 |
| Right insula | 0.28 (0.03) | 0.26 (0.03) | 0.28 (0.03) | 0.26 |
| Right limbic | 0.30 (0.04) | 0.29 (0.03) | 0.30 (0.04) | 0.69 |
| Right occipital | 0.24 (0.02) | 0.24 (0.02) | 0.24 (0.02) | 0.78 |
| Right parietal | 0.26 (0.02) | 0.26 (0.01) | 0.26 (0.02) | 0.64 |
| Right temporal | 0.27 (0.02) | 0.26 (0.01) | 0.27 (0.02) | 0.09 |
Multiple comparisons of DTI measures of ROI in MCI, AD, and control groups. NC, normal controls; MCI, mild cognitive impairment; AD, Alzheimer’s disease; AxD, axial diffusion; MD, mean diffusion; RD, radial diffusion; FA, fractional anisotropy. p < 0.05 was considered statistically significant and bold font indicates statistical significance. Post-hoc multiple comparison analysis: *statistically significant versus AD; #statistically significant versus MCI.
Group comparison between MCI and Control
None of the DTI measures of SWM regions was significantly different between MCI and control groups.
Group comparison between MCI and AD
We found a significant increase in AxD values of the left limbic (p = 0.023), left and right temporal (p < 0.001, p = 0.001) in the AD group compared to MCI. MD and RD values had a significant increase in the left and right temporal (MD: p < 0.001, p = 0.001 and RD: p = 0.001, p = 0.001) in the AD group. In addition to the temporal lobe, MD value showed a significant difference in the left limbic (p = 0.043).
Group comparison between control and AD
Compared with control, AD subjects showed significant increases in AxD value of the left and right limbic (p < 0.001), insula (p = 0.028, p = 0.008), and temporal (p < 0.001) regions and MD value of the left and right limbic (p < 0.001, p = 0.001), temporal (p < 0.001), insula (p = 0.032, p = 0.001), right frontal (p = 0.02), and parietal (p = 0.047) regions and RD value of the left limbic (p = 0.003), temporal (p < 0.001), right insula (p = 0.029), and right limbic (p = 0.003) regions.
Tractography analysis
AxD, RD, MD, and FA values extracted from SWM tracts and these parameters were significantly different between the three groups (Table 3).
Table 3
Multiple comparisons of DTI measures of tractography (dependent variables) in MCI, AD, and control groups
| CN Mean (SD) | MCI Mean (SD) | AD Mean (SD) | p | |
| AxD | ||||
| Left frontal | 1.14 (0.12) | 1.17 (0.08) | 1.21 (0.16) | 0.11 |
| Left insula | 1.17 (0.17)* | 1.17 (0.11) | 1.28 (0.16) | 0.009 |
| Left limbic | 1.18 (0.21)* | 1.24 (0.33) | 1.34 (0.14) | <0.001 |
| Left occipital | 1.18 (0.16)* | 1.22 (0.16) | 1.29 (0.18) | 0.041 |
| Left parietal | 1.13 (0.18)* | 1.21 (0.11) | 1.23 (0.14) | 0.013 |
| Left temporal | 1.17 (0.14)* | 1.23 (0.17) | 1.37 (0.17) | <0.001 |
| Right frontal | 1.16 (0.12)* | 1.19 (0.09) | 1.24 (0.12) | 0.026 |
| Right insula | 1.15 (0.21)* | 1.27 (0.15) | 1.26 (0.11) | 0.007 |
| Right limbic | 1.18 (0.19)* | 1.27 (0.35) | 1.32 (0.12) | 0.001 |
| Right occipital | 1.16 (0.14)* | 1.22 (0.11) | 1.27 (0.11) | 0.003 |
| Right parietal | 1.12 (0.19)* | 1.21 (0.13) | 1.23 (0.11) | 0.006 |
| Right temporal | 1.15 (0.16)* | 1.22 (0.18) | 1.29 (0.11) | <0.001 |
| MD | ||||
| Left frontal | 0.84 (0.07) | 0.86 (0.06) | 0.89 (0.09) | 0.11 |
| Left insula | 0.85 (0.12)* | 0.86 (0.06) | 0.94 (0.13) | 0.003 |
| Left limbic | 0.89 (0.09)* | 0.94 (0.11)* | 1.02 (0.13) | 0.001 |
| Left occipital | 0.86 (0.08)* | 0.92 (0.11) | 0.97 (0.14) | 0.009 |
| Left parietal | 0.81 (0.07)* | 0.88 (0.11) | 0.88 (0.11) | 0.019 |
| Left temporal | 0.86 (0.06)* | 0.91 (0.08)* | 1.01 (0.15) | <0.001 |
| Right frontal | 0.86 (0.09) | 0.88 (0.08) | 0.92 (0.11) | 0.11 |
| Right insula | 0.86 (0.11) | 0.95 (0.21) | 0.93 (0.11) | 0.082 |
| Right limbic | 0.89 (0.08)* | 0.95 (0.12) | 0.99 (0.11) | 0.007 |
| Right occipital | 0.86 (0.11)* | 0.91 (0.11) | 0.94 (0.09) | 0.016 |
| Right parietal | 0.82 (0.09)# | 0.88 (0.14) | 0.88 (0.08) | 0.027 |
| Right temporal | 0.85 (0.07)* | 0.92 (0.11) | 0.96 (0.09) | <0.001 |
| RD | ||||
| Left frontal | 0.69 (0.07) | 0.71 (0.06) | 0.73 (0.09) | 0.021 |
| Left insula | 0.69 (0.12)* | 0.71 (0.06) | 0.76 (0.12) | 0.012 |
| Left limbic | 0.75 (0.09)* | 0.78 (0.11) | 0.85 (0.13) | 0.005 |
| Left occipital | 0.71 (0.09) | 0.76 (0.11) | 0.81 (0.13) | 0.073 |
| Left parietal | 0.66 (0.08) | 0.72 (0.09) | 0.71 (0.09) | 0.067 |
| Left temporal | 0.71 (0.07)* | 0.74 (0.08) | 0.83 (0.14) | <0.001 |
| Right frontal | 0.71 (0.09) | 0.73 (0.08) | 0.76 (0.11) | 0.19 |
| Right insula | 0.71 (0.11) | 0.81 (0.18) | 0.77 (0.11) | 0.051 |
| Right limbic | 0.74 (0.09)* | 0.79 (0.11) | 0.83 (0.11) | 0.015 |
| Right occipital | 0.71 (0.11)* | 0.76 (0.11) | 0.78 (0.09) | .034 |
| Right parietal | 0.67 (0.09) | 0.74 (0.12) | 0.71 (0.09) | 0.002 |
| Right temporal | 0.71 (0.07)* | 0.75 (0.08) | 0.81 (0.09) | |
| FA | 0.76 | |||
| Left frontal | 0.27 (0.02) | 0.27 (0.01) | 0.27 (0.02) | 0.08 |
| Left insula | 0.30 (0.05) | 0.29 (0.04) | 0.30 (0.05) | 0.32 |
| Left limbic | 0.28 (0.05) | 0.27 (0.05) | 0.28 (0.05) | 0.41 |
| Left occipital | 0.24 (0.02) | 0.24 (0.02) | 0.24 (0.02) | 0.57 |
| Left parietal | 0.26 (0.02) | 0.27 (0.01) | 0.26 (0.02) | 0.21 |
| Left temporal | 0.27 (0.02) | 0.26 (0.01) | 0.27 (0.02) | 0.31 |
| Right frontal | 0.28 (0.02) | 0.27 (0.01) | 0.28 (0.02) | 0.26 |
| Right insula | 0.28 (0.03) | 0.26 (0.03) | 0.28 (0.03) | 0.69 |
| Right limbic | 0.30 (0.04) | 0.29 (0.03) | 0.30 (0.04) | 0.78 |
| Right occipital | 0.24 (0.02) | 0.24 (0.02) | 0.24 (0.02) | 0.64 |
| Right parietal | 0.26 (0.02) | 0.26 (0.01) | 0.26 (0.02) | 0.09 |
| Right temporal | 0.27 (0.02) | 0.26 (0.01) | 0.27 (0.02) |
NC, normal controls; MCI, mild cognitive impairment; AD, Alzheimer’s disease; AxD, axial diffusion; MD, mean diffusion; RD, radial diffusion; FA, fractional anisotropy. p < 0.05 was considered statistically significant and bold font indicates statistical significance. Post-hoc multiple comparison analysis: *statistically significant versus AD; #statistically significant versus MCI.
Group comparison between MCI and Control
MD values had a significant increase in the right parietal SWM tracts only (p = 0.03) in the MCI group compared to the CN group and no significant difference was found in other regions and DTI measures.
Group comparison between MCI and AD
MD values had a significant increase in the left limbic (p = 0.048) and left temporal (p = 0.024) SWM tracts in the AD group.
Group comparison between control and AD
We found a significant increase in AxD value for the entire SWM region fibers except for the right frontal lobe fibers (p = 0.11) in the AD group.
MD value tracts in most regions of the brain included left and right limbic (p = 0.001, p = 0.005), left and right temporal (p < 0.001), left and right occipital (p = 0.008, p = 0.013), left and right parietal (p = 0.04, p = 0.032), and left insula (p = 0.002) showed significant increases in the AD group compared to the CN group.
Also, RD value had significant increase in tracts of the left and right limbic (p = 0.004, p = 0.012), left and right temporal (p < 0.001, p = 0.01), left and right occipital (p = 0.004, p = 0.033), and left insula (p = 0.01) in the AD group.
Correlations with MMSE
MMSE was significantly correlated with MD, RD, and AxD of parietal and temporal SWM in the AD group. There was no significant correlation between MMSE score and DTI indices in the control and MCI subjects (Table 4).
Table 4
The correlation coefficient between superficial white matter AxD, MD, RD, FA, and MMSE scores
| NC | MCI | AD | |||||
| r | p | r | p | r | p | ||
| AxD | frontal | 0.07 | 0.74 | .130 | 0.51 | –0.24 | 0.24 |
| insula | 0.05 | 0.80 | –0.14 | 0.51 | –0.37 | 0.07 | |
| limbic | –0.05 | 0.81 | –0.004 | 0.98 | –0.45 | 0.05 | |
| occipital | 0.09 | 0.67 | –0.18 | 0.37 | –0.39 | 0.05 | |
| parietal | 0.05 | 0.78 | 0.02 | 0.92 | –0.42 | 0.04 | |
| temporal | –0.1 | 0.61 | 0.21 | 0.30 | –0.53 | 0.007 | |
| MD | frontal | 0.12 | 0.55 | 0.19 | 0.36 | –0.29 | 0.16 |
| insula | 0.02 | 0.90 | –0.25 | 0.23 | –0.14 | 0.50 | |
| limbic | 0.12 | 0.56 | –0.03 | 0.86 | –0.39 | 0.05 | |
| occipital | 0.04 | 0.83 | –0.12 | 0.54 | –0.40 | 0.05 | |
| parietal | 0.11 | 0.59 | –0.02 | 0.91 | –0.49 | 0.01 | |
| temporal | 0.01 | 0.96 | 0.17 | 0.41 | –0.49 | 0.01 | |
| RD | frontal | 0.07 | 0.72 | 0.14 | 0.50 | –0.30 | 0.14 |
| insula | –0.004 | 0.98 | –0.22 | 0.28 | –0.02 | 0.91 | |
| limbic | 0.06 | 0.76 | –0.003 | 0.98 | –0.37 | 0.07 | |
| occipital | 0.09 | 0.65 | –0.07 | 0.74 | –0.39 | 0.05 | |
| parietal | 0.11 | 0.60 | –0.02 | 0.90 | –0.51 | 0.01 | |
| temporal | –0.08 | 0.69 | 0.17 | 0.41 | –0.48 | 0.01 | |
| FA | frontal | –0.07 | 0.72 | –0.28 | 0.17 | 0.12 | 0.57 |
| insula | –0.08 | 0.69 | 0.21 | 0.31 | 0.46 | 0.06 | |
| limbic | –0.1 | 0.57 | –0.1 | 0.63 | 0.19 | 0.35 | |
| occipital | 0.08 | 0.68 | –0.11 | 0.58 | 0.29 | 0.16 | |
| parietal | –0.2 | 0.32 | 0.002 | 0.99 | 0.37 | 0.07 | |
| temporal | 0.006 | 0.97 | 0.1 | 0.62 | 0.17 | 0.41 | |
MMSE, Mini-Mental State Examination; AxD, axial diffusion; MD, mean diffusion; RD, radial diffusion; FA, fractional anisotropy; NC, normal controls; MCI, mild cognitive impairment; AD, Alzheimer’s disease. p < 0.05 was considered statistically significant and bold font indicates statistical significance.
DISCUSSION
Earlier studies in AD assessed whole-brain white matter that likely consisted of both SWM and deep white matter, but a few studies assessed only SWM.
SWM fibers included late myelinating fibers and are vulnerable to the neurodegenerative disease processes, based on the retrogenesis hypothesis [12]. Therefore, we evaluated the SWM in MCI and AD groups in this study.
Our findings showed that AxD, MD, and RD values were higher in patients with AD in comparison with control subjects and these values were much more different than in FA. The results are consistent with two previous studies [11, 12]. They believed that increased axial diffusivity is associated with axonal damage and Wallerian degeneration in patients and increased RD is related to myelin sheath disruption and increased MD reflects the brain tissue atrophy. Accordingly, our findings also demonstrate brain tissue atrophy, Wallerian degeneration, and myelin sheath disruption in SWM in AD. The highest increase in MD values was seen in the left temporal and limbic regions (both increased by 32%), and in the left limbic region for AxD and RD values (28% and 44%, respectively) between ADr and control groups average an ROI approach.
On the other hand, SWM fiber tractography results also showed that the highest increase in AxD and RD values was in the left temporal (by 17%) and MD value increased in the left limbic (15%) in patients compared to the healthy controls. FA value was reduced in patients with AD in comparison with healthy controls and MCI subjects, but it was not statistically significant.
Tractography is a powerful tool for studying white matter pathways can be used for SWM fibers. These fibers often included short association U-fibers and intraregional fibers. In some studies [33, 34], short association fiber pathways (U-fibers) identified separately, but we evaluated all the fibers of SWM in any region in the present study.
To our knowledge, this is the first study evaluating the SWM changes in MCI using DTI. AxD, MD, and RD values were higher in MCI in comparison with control subjects. Nevertheless, we found a significant difference in MD value only in the right parietal SWM tracts.
These results are in agreement with a perfusion study that showed significant regional hypoperfusion in patients suffering from MCI compared to the CN group in the parietal lobe [35]. Also in another study, the scores on the working memory domain correlated inversely with the parietal lobe atrophy score in MCI patients [36], which confirms the damage to the parietal lobe in MCI patients, similar to our results.
Most studies reported DTI values changes in AD and MCI groups compared to the healthy controls and emphasized the earliest pathological changes in specific regions notably temporal lobe [37, 38]. Following these studies, we evaluated the SWM as a specific region that can help in the diagnosis of AD. Finally, compared to MCI, patients with AD had the highest increase in diffusivity values in the bilateral temporal lobe. In other words, the SWM of the temporal lobe in AD subjects can be a valuable biomarker for the detection of AD and MCI.
Previous studies have suggested the MMSE score as a useful tool for the identification of cognitive impairment in individuals with memory or other cognitive impairment [10]. However, according to the results of the study by Phillips et al., the SWM microstructure may be vulnerable to age-related processes of demyelination [20]. So, we detected associations between anatomic regions of SWM and MMSE score and we showed a significant association between changes in the axial, radial, and mean diffusivity of parietal and temporal SWM and the MMSE score in AD subjects. That is, in AD subjects, a decrease of the MMSE score was negatively associated with increased RD, MD, and AxD in temporal and parietal SWM (negative correlation). Phillips et al. believed that the correlation between SWM and MMSE suggested that the microstructural abnormalities could be seen as a manifestation of the disease evolution [11]. Our findings showed a negative correlation between MMSE and diffusivity, which supports this conclusion.
Caution is needed when interpreting the results, since fiber architecture of superficial white matter containing multiple fiber populations (termed “crossing fibers”), reveals the more complex arrangement than in the deep white matter. The complex fiber arrangement can affect the estimation of the diffusion properties [19]. For example, the FA value is strongly affected and is lower in such areas [39] and similar results were reported by Wheeler-Kingshott et al. that demonstrated the challenges of interpreting changes in axial and radial diffusivity in crossing fiber regions [40]. These created effects depend on the microstructure features of white matter pathways such as the degree of orientational coherence of fibers and pose severe challenges for tractography [41]. Thus the interpretation of the diffusion data is complex and requires a prior knowledge about the architecture of the white matter pathways. Further research oriented on the anatomical specificity of superficial white matter architecture will help to complement DTI findings.
Conclusion
DTI offers a wide set of biomarkers for identifying and monitoring of the disease. Given that the DTI values changes in some regions of SWM, it can play an important role in the diagnosis of AD and MCI. To support this conclusion, we showed that there is major abnormality across the brain in patients and it is associated with MMSE score in AD subjects. So, the SWM microstructural changes are related to the clinical symptoms in AD.
Limitation
In the present study, DTI images were reconstructed with DTI as a model-based method. The results of model-based methods are limited by the model, while the diffusion pattern does not follow the assumption. A recent comparison study has shown that generalized q-sampling imaging is more accurate in voxels containing multiple fiber populations, compared to DTI reconstruction methods (e.g., crossing-fibers regions) [42].
CONFLICT OF INTEREST
The authors disclose no conflicts of interest.
ACKNOWLEDGMENTS
The authors would like to thank Dr. Arash Nazari (E-mail: ) for sharing the superficial white matter mask with us.
Data collection and sharing for this project was funded by the Alzheimer’s Disease Neuroimaging Initiative (ADNI) (National Institutes of Health Grant U01 AG024904) and DOD ADNI (Department of Defense award number W81XWH-12-2-0012). ADNI is funded by the National Institute on Aging, the National Institute of Biomedical Imaging and Bioengineering, and through generous contributions from the following: AbbVie, Alzheimer’s Association; Alzheimer’s Drug Discovery Foundation; Araclon Biotech; BioClinica, Inc.; Biogen; Bristol-Myers Squibb Company; CereSpir, Inc.; Cogstate; Eisai Inc.; Elan Pharmaceuticals, Inc.; Eli Lilly and Company; EuroImmun; F. Hoffmann-La Roche Ltd and its affiliated company Genentech, Inc.; Fujirebio; GE Healthcare; IXICO Ltd.; Janssen Alzheimer Immunotherapy Research & Development, LLC.; Johnson & Johnson Pharmaceutical Research & Development LLC.; Lumosity; Lundbeck; Merck & Co., Inc.; Meso Scale Diagnostics, LLC.; NeuroRx Research; Neurotrack Technologies; Novartis Pharmaceuticals Corporation; Pfizer Inc.; Piramal Imaging; Servier; Takeda Pharmaceutical Company; and Transition Therapeutics. The Canadian Institutes of Health Research is providing funds to support ADNI clinical sites in Canada. Private sector contributions are facilitated by the Foundation for the National Institutes of Health (http://www.fnih.org). The grantee organization is the Northern California Institute for Research and Education, and the study is coordinated by the Alzheimer’s Therapeutic Research Institute at the University of Southern California. ADNI data are disseminated by the Laboratory for Neuro Imaging at the University of Southern California.
REFERENCES
[1] | Tang SX , Feng QL , Wang GH , Duan S , Shan BC , Dai JP ((2017) ) Diffusion characteristics of the fornix in patients with Alzheimer’s disease. Psychiatry Res Neuroimaging 265: , 72–76. |
[2] | Schouten TM , Koini M , Vos F , Seiler S , Rooij M , Lechner A , Schmidt R , Heuvel MVD , Grond JV , Rombouts S ((2017) ) Individual classification of Alzheimer’s disease with diffusion magnetic resonance imaging. Neuroimage 152: , 476–481. |
[3] | Alexander AL , Lee JE , Lazar M , Field AS ((2007) ) Diffusion tensor imaging of the brain. Neurotherapeutics 4: , 316–329. |
[4] | Hesseltine SM , Ge Y , Law M ((2007) ) Applications of diffusion tensor imaging and fiber tractography. Appl Radiol 36: , 8. |
[5] | Mori S , Crain BJ , Chacko VP , van Zijl PC ((1999) ) Three-dimensional tracking of axonal projections in the brain by magnetic resonance imaging. Ann Neurol 45: , 265–269. |
[6] | Nir TM , Jahanshad N , Villalon-Reina JE , Toga AW , Jack CR , Weiner MW , Thompson PM ((2013) ) Effectiveness of regional DTI measures in distinguishing Alzheimer’s disease, MCI, and normal aging. Neuroimage Clin 3: , 180–195. |
[7] | Nestor PJ , Scheltens P , Hodges JR ((2004) ) Advances in the early detection of Alzheimer’s disease. Nat Med 10 Suppl: , S34–41. |
[8] | Lee W , Park B , Han K ((2013) ) Classification of diffusion tensor images for the early detection of Alzheimer’s disease. Comput Biol Med 43: , 1313–1320. |
[9] | Albert MS , DeKosky ST , Dickson D , Dubois B , Feldman HH , Fox NC , Gamst A , Holtzman DM , Jagust WJ , Petersen RC ((2011) ) The diagnosis of mild cognitive impairment due to Alzheimer’s disease: Recommendations from the National Institute on Aging-Alzheimer’s Association workgroups on diagnostic guidelines for Alzheimer’s disease. Alzheimers Dement 7: , 270–279. |
[10] | Patil RB , Ramakrishnan S ((2013) ) Correlation of diffusion tensor imaging indices with MMSE score in Alzheimer patients: A sub-anatomic region based study on ADNI database. In International Conference on Biomedical Informatics and Technology Springer, pp. 150–160. |
[11] | Phillips OR , Joshi SH , Piras F , Orfei MD , Iorio M , Narr KL , Shattuck DW , Caltagirone C , Spalletta G , Di Paola M ((2016) ) The superficial white matter in Alzheimer’s disease. Hum Brain Mapp 37: , 1321–1334. |
[12] | Reginold W , Luedke AC , Itorralba J , Fernandez-Ruiz J , Islam O , Garcia A ((2016) ) Altered superficial white matter on tractography MRI in Alzheimer’s disease. Dement Geriatr Cogn Dis Extra 6: , 233–241. |
[13] | Stricker NH , Schweinsburg BC , Delano-Wood L , Wierenga CE , Bangen KJ , Haaland KY , Frank LR , Salmon DP , Bondi MW ((2009) ) Decreased white matter integrity in late-myelinating fiber pathways in Alzheimer’s disease supports retrogenesis. Neuroimage 45: , 10–16. |
[14] | Gao J , Cheung RT-F , Lee T , Chu L-W , Chan Y-S , Mak HK-F , Zhang JX , Qiu D , Fung G , Cheung C ((2011) ) Possible retrogenesis observed with fiber tracking: An anteroposterior pattern of white matter disintegrity in normal aging and Alzheimer’s disease. J Alzheimers Dis 26: , 47–58. |
[15] | Miki Y , Grossman RI , Udupa JK , Wei L , Kolson DL , Mannon LJ , Grossman M ((1998) ) Isolated U-fiber involvement in MS: Preliminary observations. Neurology 50: , 1301–1306. |
[16] | Ismail MM , Keynton RS , Mostapha MM , ElTanboly AH , Casanova MF , Gimel’farb GL , El-Baz A ((2016) ) Studying autism spectrum disorder with structural and diffusion magnetic resonance imaging: A survey. Front Hum Neurosci 10: , 211. |
[17] | Phillips OR , Nuechterlein KH , Asarnow RF , Clark KA , Cabeen R , Yang Y , Woods RP , Toga AW , Narr KL ((2011) ) Mapping corticocortical structural integrity in schizophrenia and effects of genetic liability. Biol Psychiatry 70: , 680–689. |
[18] | Nazeri A , Chakravarty MM , Felsky D , Lobaugh NJ , Rajji TK , Mulsant BH , Voineskos AN ((2013) ) Alterations of superficial white matter in schizophrenia and relationship to cognitive performance. Neuropsychopharmacology 38: , 1954–1962. |
[19] | Phillips OR , Joshi SH , Squitieri F , Sanchez-Castaneda C , Narr K , Shattuck DW , Caltagirone C , Sabatini U , Di Paola M ((2016) ) Major superficial white matter abnormalities in Huntington’s disease. Front Neurosci 10: , 197. |
[20] | Phillips OR , Clark KA , Luders E , Azhir R , Joshi SH , Woods RP , Mazziotta JC , Toga AW , Narr KL ((2013) ) Superficial white matter: Effects of age, sex, and hemisphere. Brain Connect 3: , 146–159. |
[21] | Nazeri A , Chakravarty MM , Rajji TK , Felsky D , Rotenberg DJ , Mason M , Xu LN , Lobaugh NJ , Mulsant BH , Voineskos AN ((2015) ) Superficial white matter as a novel substrate of age-related cognitive decline. Neurobiol Aging 36: , 2094–2106. |
[22] | Van Hecke W , Emsell L , Sunaert S ((2015) ) Diffusion tensor imaging: A practical handbook, Springer. |
[23] | Smith SM , Jenkinson M , Johansen-Berg H , Rueckert D , Nichols TE , Mackay CE , Watkins KE , Ciccarelli O , Cader MZ , Matthews PM , Behrens TE ((2006) ) Tract-based spatial statistics: Voxelwise analysis of multi-subject diffusion data. Neuroimage 31: , 1487–1505. |
[24] | Daianu M , Jahanshad N , Nir TM , Toga AW , Jack CR Jr. , Weiner MW , Thompson PM ((2013) ) Breakdown of brain connectivity between normal aging and Alzheimer’s disease: A structural k-core network analysis. Brain Connect 3: , 407–422. |
[25] | Daianu M , Dennis EL , Jahanshad N , Nir TM , Toga AW , Jack CR Jr. , Weiner MW , Thompson PM ((2013) ) Alzheimer’s disease disrupts rich club organization in brain connectivity networks. Proc IEEE Int Symp Biomed Imaging, pp. 266–269. |
[26] | Daianu M , Jahanshad N , Nir TM , Dennis E , Toga AW , Jack CR Jr , Weiner MW , Thompson PM ((2012) ) Analyzing the structural k-core of brain connectivity networks in normal aging and Alzheimer’s disease. 15th MICCAI NIBAD Workshop, Nice, France, pp. 52–62. |
[27] | Nir TM , Jahanshad N , Toga AW , Jack CR , Weiner MW , Thompson PM ((2012) ) Connectivity network breakdown predicts imminent volumetric atrophy in early mild cognitive impairment. In International Workshop on Multimodal Brain Image Analysis Springer, pp. 41–50. |
[28] | Nir TM , Jahanshad N , Villalon-Reina JE , Toga AW , Jack CR , Weiner MW , Thompson PM , Initiative AsDN ((2013) ) Effectiveness of regional DTI measures in distinguishing Alzheimer’s disease, MCI, and normal aging. Neuroimage Clinl 3: , 180–195. |
[29] | Yeh FC , Wedeen VJ , Tseng W-YI ((2010) ) Generalized q-sampling imaging. IEEE Trans Med Imaging 29: , 1626–1635. |
[30] | Hansen PC , Pereyra V , Scherer G ((2013) ) Least squares data fitting with applications, JHU Press. |
[31] | Ribas GC ((2010) ) The cerebral sulci and gyri. Neurosurg Focus 28: , E2. |
[32] | Talairach J ((1988) ), Co-Planar Stereotaxic Atlas of the Human Brain: 3-D Proportional System: An Approach to Cerebral Imaging, Thieme. |
[33] | Zhang T , Chen H , Guo L , Li K , Li L , Zhang S , Shen D , Hu X , Liu T ((2014) ) Characterization of U-shape streamline fibers: Methods and applications. Med Image Anal 18: , 795–807. |
[34] | Song AW , Chang H-C , Petty C , Guidon A , Chen N-K ((2014) ) Improved delineation of short cortical association fibers and gray/white matter boundary using whole-brain three-dimensional diffusion tensor imaging at submillimeter spatial resolution. Brain Connect 4: , 636–640. |
[35] | Johnson NA , Jahng G-H , Weiner MW , Miller BL , Chui HC , Jagust WJ , Gorno-Tempini ML , Schuff N ((2005) ) Pattern of cerebral hypoperfusion in Alzheimer disease and mild cognitive impairment measured with arterial spin-labeling MR imaging: Initial experience. Radiology 234: , 851–859. |
[36] | Flak MM , Hol HR , Hernes SS , Chang L , Ernst T , Engvig A , Bjuland KJ , Madsen BO , Lindland EMS , Knapskog AB , Ulstein ID , Lona TEE , Skranes J , Løhaugen GCC ((2019) ) Cognitive profiles and atrophy ratings on MRI in senior patients with mild cognitive impairment. Front Aging Neurosci 11: , 384. Erratum in: Front Aging Neurosci 11, 37, 2019. |
[37] | Huang J , Friedland R , Auchus A ((2007) ) Diffusion tensor imaging of normal-appearing white matter in mild cognitive impairment and early Alzheimer disease: Preliminary evidence of axonal degeneration in the temporal lobe. Am J Neuroradiol 28: , 1943–1948. |
[38] | Nowrangi MA , Rosenberg PB ((2015) ) The fornix in mild cognitive impairment and Alzheimer’s disease. Front Aging Neurosci 7: , 1. |
[39] | Pierpaoli C , Basser PJ ((1996) ) Toward a quantitative assessment of diffusion anisotropy. Magn Reson Med 36: , 893–906. |
[40] | Wheeler-Kingshott CA , Cercignani M ((2009) ) About “axial” and “radial” diffusivities. Magn Reson Med 61: , 1255–1260. |
[41] | Pierpaoli C , Barnett A , Pajevic S , Chen R , Penix L , Virta A , Basser P ((2001) ) Water diffusion changes in Wallerian degeneration and their dependence on white matter architecture. Neuroimage 13: , 1174–1185. |
[42] | Zhang H , Wang Y , Lu T , Qiu B , Tang Y , Ou S , Tie X , Sun C , Xu K , Wang Y ((2013) ) Differences between generalized q-sampling imaging and diffusion tensor imaging in the preoperative visualization of the nerve fiber tracts within peritumoral edema in brain. Neurosurgery 73: , 1044–1053. |


