
A Novel Approach of Diffusion Tensor Visualization Based Neuro Fuzzy Classification System for Early Detection of Alzheimer’s Disease
Abstract
This study examined early detection of Alzheimer’s disease (AD) by diffusion tensor visualization-based methodology and neuro-fuzzy tools. Initially, we proposed a model for the early detection of AD using the measurement of apparent diffusion coefficient, fractional anisotropy, and gray matter, which can determine neurological disorder patterns and abnormalities in brain white matter. These are used as input parameters into fuzzy tools, and using fuzzy rules, we evaluate the AD score as an output variable that provides a useful platform to physicians in determining the status of the disease. In the second stage, we present an investigative study on AD and used the neuro-fuzzy classification system for pattern recognition of either AD or healthy control. The experimental results are from 20 samples (14 for training, 3 for validation, and 3 for testing) used in an artificial neural network classification system. The neural network is trained with a training algorithm and the performance of the training algorithm is obtained by executing a fuzzy expert system. Out of 20 patients, 9 are AD patients and 11 are healthy control patients. We present a neuro-fuzzy tool as a better classifier for early detection of AD and obtain a satisfactory performance with 100% accuracy.
INTRODUCTION
This study investigated Alzheimer’s disease (AD) where cognitive features are impaired and clinical features are detected by neuroimaging from CT and MR images of brain of the affected patients [1, 2]. These images show a gross reduction of volume of brain matter with enlarged lateral ventricle. We conducted the experiment of registration using T 1/ T 2weighted MR and CT imaging modalities of ventricular region of brain in AD patients [3]. Diffusion magnetic resonance imaging (DMRI) and diffusion tensor imaging (DTI) of brain provide a cognitive assessment in white matter fibers tract integrity as a biomarker for AD. These findings are correlated with cognitive assessments and rates of AD progression and differentiate between mild cognitive impairment, AD, and other dementias. DTI provides information about anatomical microstructures changes in tissues with aging and aging-related cognitive decline in the brain of AD patients [4, 5]. Diffusion process of water molecules in tissue is either isotropic or anisotropic. In isotropic diffusion, water molecules diffuse equally in all directions and are found in the gray matter (GM) of the brain. In the anisotropic process, water molecules have a preferred direction of diffusion and are found in the white matter of the brain. In such tissue, diffusion is normally highly restricted along the fiber membranes. DTI measures of diffusion anisotropic movement of water in white matter of brain provides more information about white matter fiber tract integrity [6]. DTI provides the parameters such as fractional anisotropy (FA) and apparent diffusion coefficient (ADC) or mean diffusivity to quantify the degree of preferred water diffusion restriction in different tissues. FA have values with ranges from 0 to 1, indicating the degree of anisotropy, and tissues with high anisotropy in white matter tracts have a value closer to 1. FA values were found to be significantly reduced in AD patients, especially in the posterior of the brain. These findings may provide image methods to diagnose patients with early stage AD. Mean diffusivity, which is calculated as the mean of the three eigen values in the three different axes of the diffusion tensor [7] and its value max, increase or decrease depending on the histopathological progression of the lesion [8, 9]. This paper proposes a model for early detection of AD using the measurements of ADC, FA, and GM from the diffusion magnetic resonance images of brain white matter. These are taken as input parameters into fuzzy tools, and using fuzzy rules, we evaluate the AD score as an output variable. We have presented a neural network (NN) system which is an important model for the purpose of classification of AD. Levenberg-Marquardt (LM) is a feed forward back propagation learning algorithm which is used to train the NN for the diagnosis of AD [10, 11]. The performance of the feature extraction method is evaluated on an experimental data set of 20 samples, taken from a database in the literature [12]. Out of 20 subjects, 9 are AD patients and 11 are healthy controls. We present a neuro-fuzzy tool as a better classifier for early detection of AD and gets satisfactory performance.
Research background and clinical significance
In our research work, we have undertaken the task of developing a screening test for the early detection of AD when cognitive features such as the intelligent behavior, power of rational thinking, and effective dealing with intellectual and higher integrative faculties are impaired. In this study, we have proposed a model of diffusion tensor visualization-based neuro-fuzzy classification system for early detection of AD [13]. We used the fuzzy (if–then) rules by taking three extracted features of ADC, FA, and GM values from the DMRI images of brain as input variables and evaluated the AD score as an output variable, which provides a useful platform to physicians in determining the status of the disease. The patterns were classified as either AD or healthy control patient. The experimental results show that out of the 20 samples, 14 for training, 3 for validation, and 3 for testing were used in the artificial neural network (ANN) classification system. The proposed network is trained and fed into the ANN with three input neurons, one hidden layer of thirty neurons, and two output neurons. The NN is trained with a training algorithm and the performance of the training algorithm is obtained by executing a fuzzy expert system (FES). The results show that the LM training algorithm gave a satisfactory performance for the diagnosis of AD, and it is an efficient tool as predictive accuracy equaled 100%.
DTI based neuro-fuzzy classification system of AD
A number of different tools or methods have been developed and investigated over the years as alternative screening tests for AD such as CT scan, traditional MR images [14], and DMRI of brain. They have served extensively for screening of AD patients or healthy controls. DTI-based neuro-fuzzy diagnostic systems of brain other than traditional tools have an important role in the cognitive assessment in brain white matter fibers tract integrity as a biomarker and in early detection of AD [15]. DTI provides information about anatomical microstructure changes in tissues with aging and aging-related cognitive decline in the brain of AD patients. DTI is an important tool to map the anisotropic water diffusion in the tissues. It visualizes the brain white matter tracts and tracks the diseased fibers or trauma. DTI can reveal abnormalities in white matter fiber structure or neurological disorder patterns in a variety of diseases including stroke, multiple sclerosis, dyslexia, schizophrenia, and tumor in brain white matter and provides a model of brain connectivity. FA is used to measure the rate of water diffusion in white matter tracts and characterize the DTI changes in each voxel of the tissue. It maps the axonal tracts and architecture and locates any injured part of the axon in myelin of the white matter. DTI provides the parameters such as FA and ADC to quantify the degree of preferred water diffusion restriction in different tissues. These findings may provide image methods to diagnose patients with early stage of AD.
MATERIALS AND METHODS
Study population
We have used the clinical and laboratory database as ADC, FA, and GM of 20 patients from literature. The subjects utilized in this study were obtained from the Alzheimer’s Disease Neuroimaging Initiative (ADNI) database (http://adni.loni.usc.edu/). The study has been made for AD patients. One hundred and fifty brain scan images were downloaded from the ADNI database including the scans of AD patients (n = 95) and healthy controls (n = 55). Out of 150 patients (aged 65 to 96 years), we have taken 20 samples for the proposed work and experiment for classification of AD patients or healthy controls subjects (Tables 2 and 3). A summary of subject demographics and dementia status is shown in Table 1.
Table 1
Summary of subject demographics and dementia status
| Alzheimer’s disease | Healthy controls | |
| Number of subjects | 95 | 55 |
| Sex (M/F) | 60/35 | 30/25 |
| Age | 80.4 (69–96) | 76.47 (65–89) |
| Education | 2.66 (1–5) | 2.93 (1–5) |
| Socioeconomic status | 2.8 (1–5) | 2.9 (1–5) |
| Mini-Mental State Examination | 21.92 (15–28) | 28.5 (28–30) |
In this section, we reviewed this paper which has proposed a methodology for early detection of AD for 20 samples data set of patients from the literature using the measurement of ADC, FA, and GM of diffusion MR images of brain white matter [16]. These are used as input parameters into fuzzy tools, and using fuzzy rules, we evaluate the AD score in patients as an output variable which provides a useful platform to physicians in determining the status of the disease. In the second stage, the authors present an investigative study on AD and used the neuro-fuzzy classification system for pattern recognition of either AD or healthy control (Fig. 1).
Fig.1
Segmentation results of a normal individual and an AD patient. AD, Alzheimer’s disease; GM, gray matter; WM, white matter; CSF, cerebrospinal fluid.
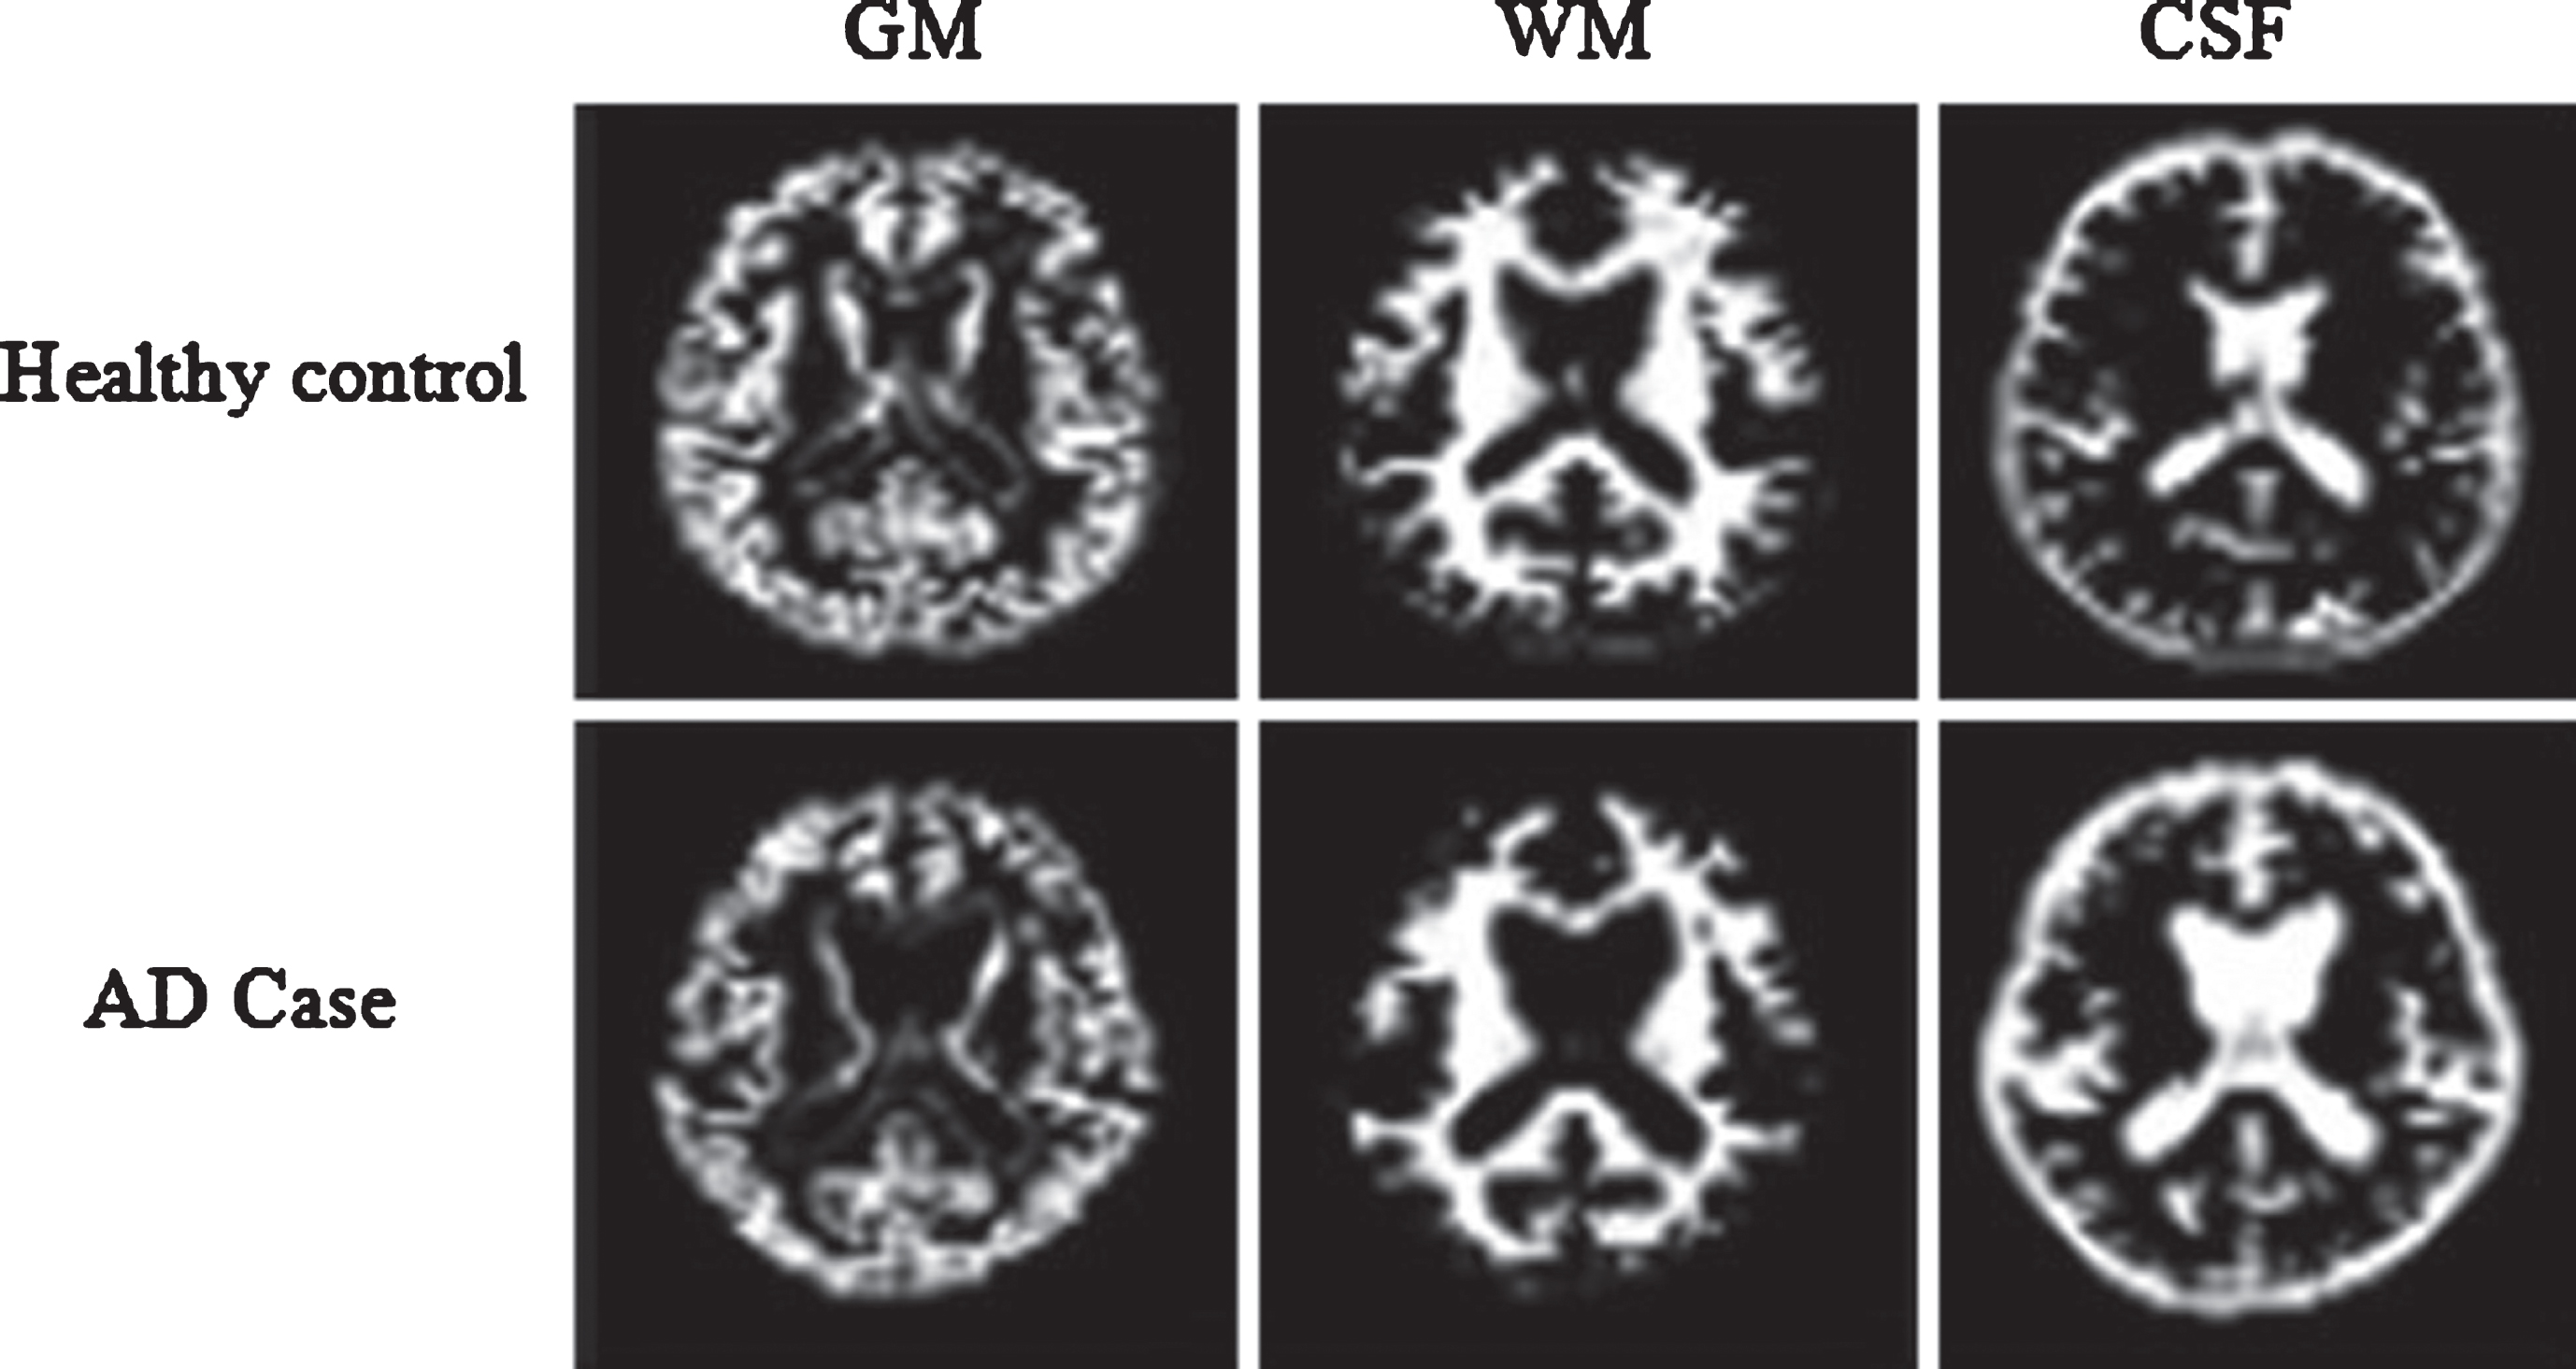
From Table 2, the mean value and standard deviation of the ADC, FA, and GM values for AD patients (n = 95) are 1.97±0.82, 0.53±0.05, and 48.67±2.50, respectively; and for healthy control subjects (n = 55) are 0.69±0.25, 0.89±0.35, and 43.45±50.23, respectively. The actual values of ADC, FA, and GM for AD patients and healthy control subjects together is 150 each. Out of the 150–sample database, we have taken 20 samples database consisting of AD patients and healthy control subjects. The values of ADC, FA, and GM for individual patients were calculated from the mean value and standard deviation of ADC, FA, and GM from Table 2. It is shown in Table 3 where patient-III is the healthy control and patient-IX is the AD patient.
Table 2
Statistical results of features
| Features | Alzheimer’s disease | Healthy control |
| ADC (10-3mm2/s) | 1.97±0.82 | 0.69±0.25 |
| FA | 0.53±0.05 | 0.89±0.35 |
| GM | 48.67±2.50 | 43.45±50.23 |
ADC, apparent diffusion coefficient; FA, fractional anisotropy; GM, gray matter.
Table 3
Database of the individual patient
| Patient number | ADC (10-3mm2/s) | FA | GM |
| Patient-I | 0.0776 | 0.0326 | –79.59 |
| Patient-II | 0.3838 | 0.4613 | –18.07 |
| Patient-III | 0.69 | 0.89 | 43.45 |
| Patient-IV | 0.9962 | 1.3187 | 104.97 |
| Patient-V | 1.3024 | 1.7474 | 166.49 |
| Patient-VI | –1.042 | 0.3464 | 38.77 |
| Patient-VII | –0.038 | 0.4076 | 42.07 |
| Patient-VIII | 0.966 | 0.4688 | 45.37 |
| Patient-IX | 1.97 | 0.53 | 48.67 |
| Patient-X | 2.974 | 0.5912 | 51.97 |
| Patient-XI | 3.978 | 0.6524 | 55.27 |
| Patient-XII | 4.982 | 0.7136 | 58.57 |
| Patient-XIII | 5.986 | 0.7748 | 61.87 |
| Patient-XIV | 6.99 | 0.836 | 65.17 |
| Patient-XV | 7.994 | 0.8972 | 68.47 |
| Patient-XVI | 8.998 | 0.9584 | 71.77 |
| Patient-XVII | 10.002 | 1.0196 | 75.07 |
| Patient-XVIII | 11.006 | 1.0808 | 78.37 |
| Patient-XIX | 12.01 | 1.142 | 81.67 |
| Patient-XX | 13.014 | 1.2032 | 84.97 |
ADC, apparent diffusion coefficient; FA, fractional anisotropy; GM, gray matter.
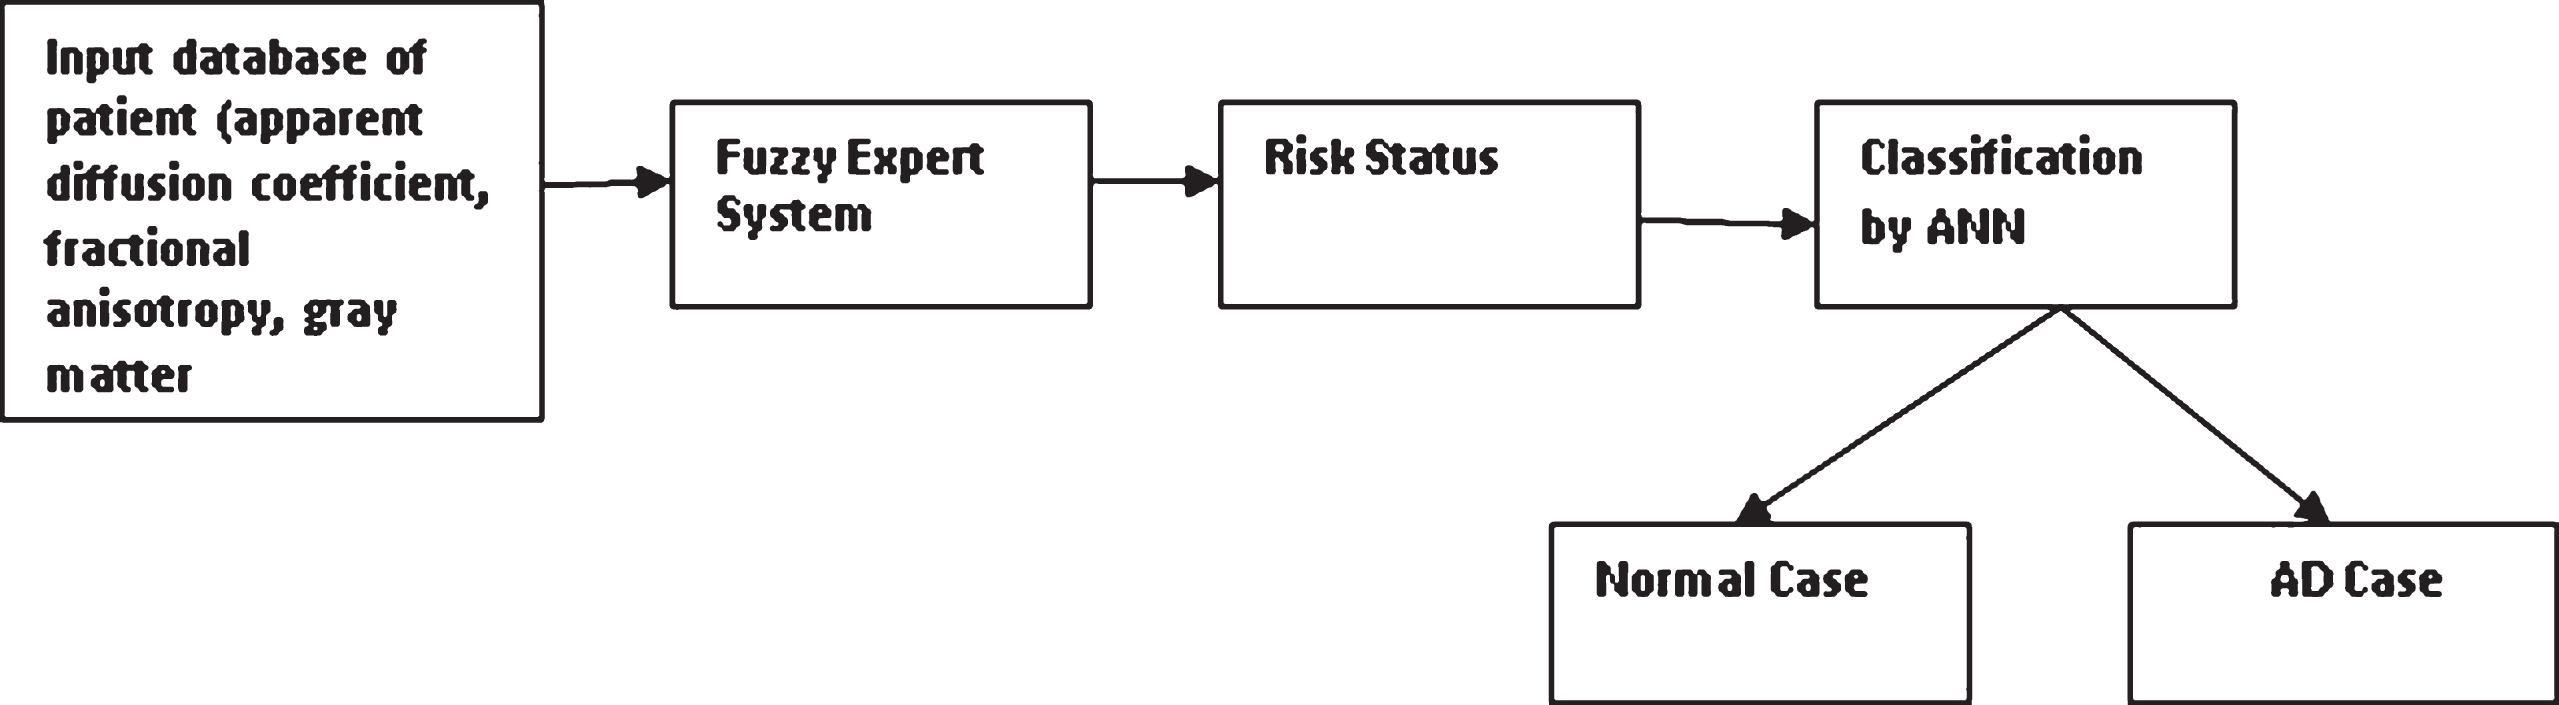
The proposed methodology for the AD classification process using the neuro-fuzzy system is shown in Fig. 2.
Fig.2
Proposed methodology for AD classification process by using neuro-fuzzy system. AD, Alzheimer’s disease; ANN, artificial neural network.
The procedures involving experiments on human subjects are done in accord with the ethical standards of the Committee on Human Experimentation of the institution in which the experiments were done or in accord with the Helsinki Declaration of 1975.
Preprocessing and segmentation of CT and MR images of AD patient
Preprocessing of images is required before segmentation of region of interest (ROI), feature extraction, and recognition. The processed images appear better in quality for diagnostics purpose and to distinguish more clearly the superimposed structures of the images. For certain specific application, the digital radiographs are modified by image enhancement and restoration to get more suitable results. Enhancement techniques convolve the gray level of a pixel independently of its neighbors using spatial masks. Enhancement includes image smoothing by two-dimensional filtering of images, sharpening, edge detection, and contrast stretching. Image segmentation is the process of localization of the ROI in the images. This is particularly true in radiographic image analysis where one needs accurate outlines of an object which is not too clearly defined in the original image. Edge segmentation of brain of AD patients plays an important role in recognition as edges of brain images holding much information of the brain image to get the information of the shape, size, and texture [17, 18].
Registration of CT and MR images of AD patient
The digitized images of axial sections of the same region of the brain of an AD patient obtained from T1weighted MR, T2weighted MR and CT modalities are used of pixel dimension 173 x 230. The three images under consideration are shown in Fig. 3a-c. The ventricular region (ROI) is shown in Fig. 4. The segmented edges of the ROI using canny edge segmentation [19] and their contours are shown in Fig. 5.
Fig.3
(a) T1weighted MR image of brain of an AD patient, (b) T2weighted MR image of brain of the same AD patient, and (c) CT image of brain of an AD patient.
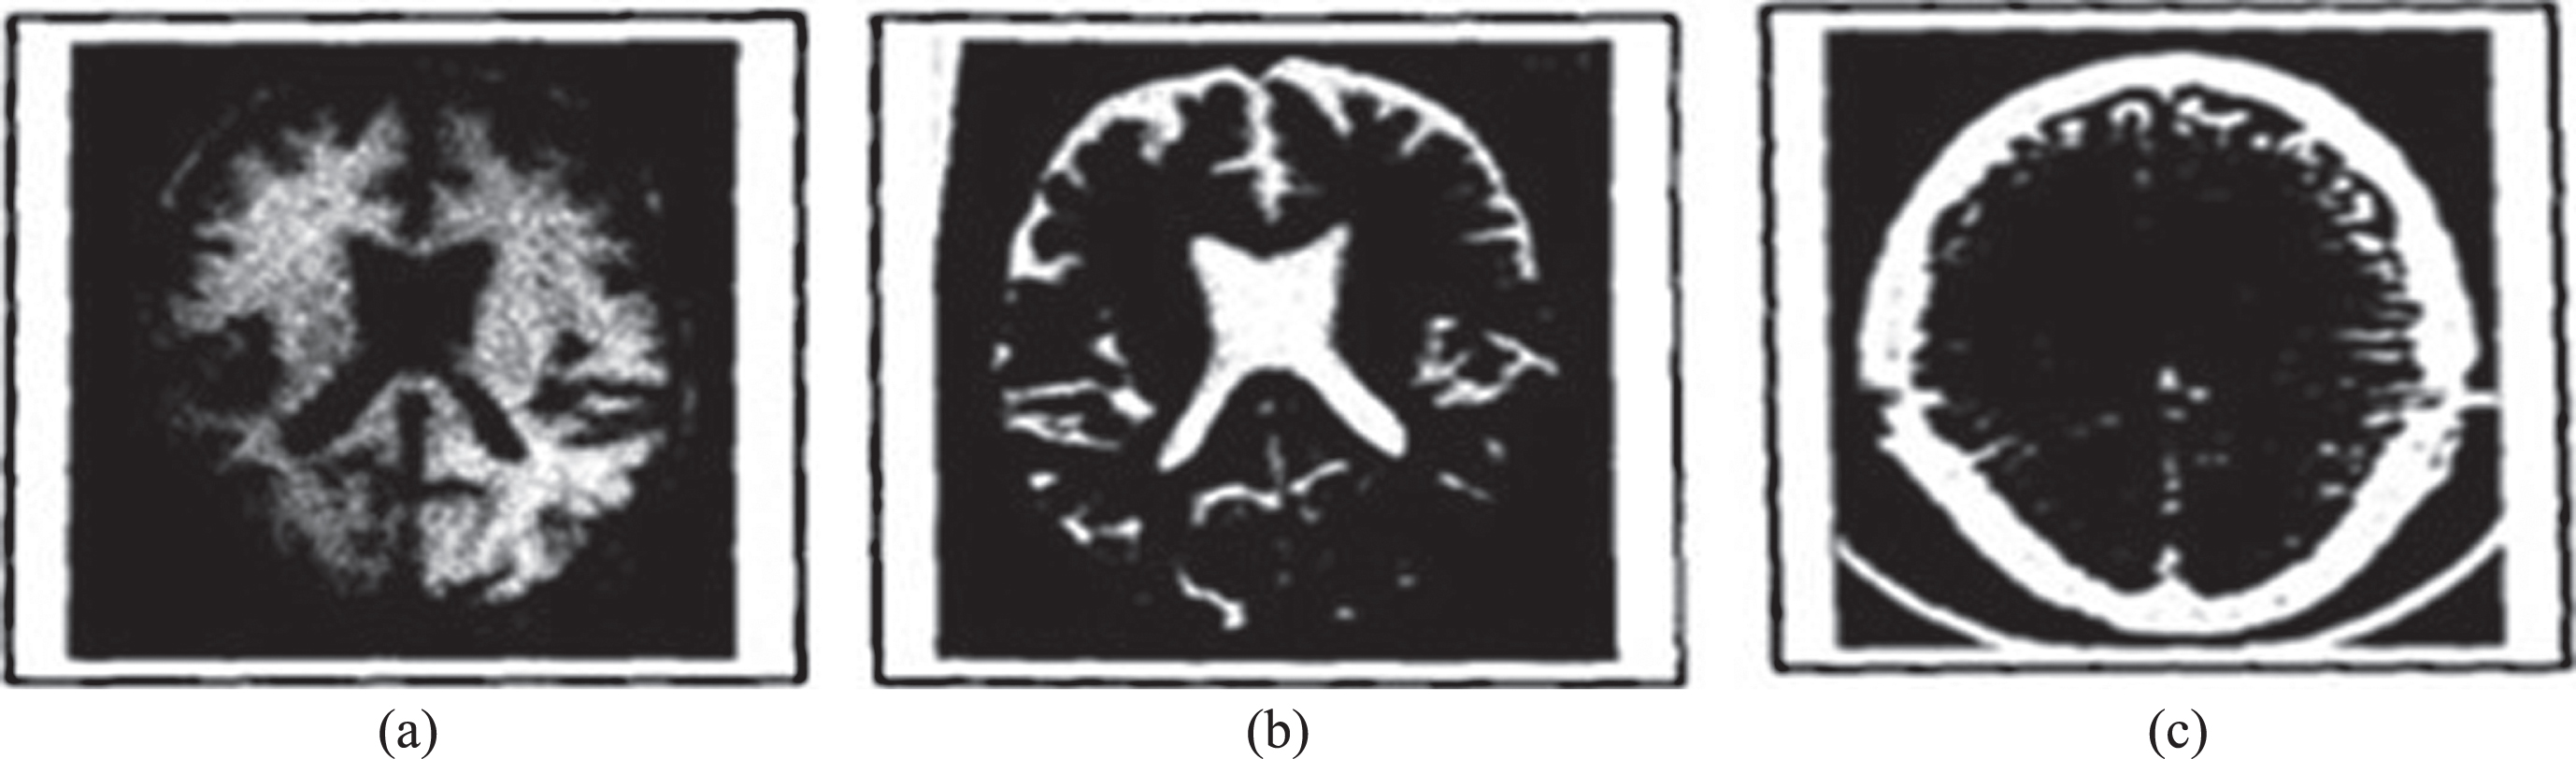
Fig.4
Ventricular region of MR and CT images.
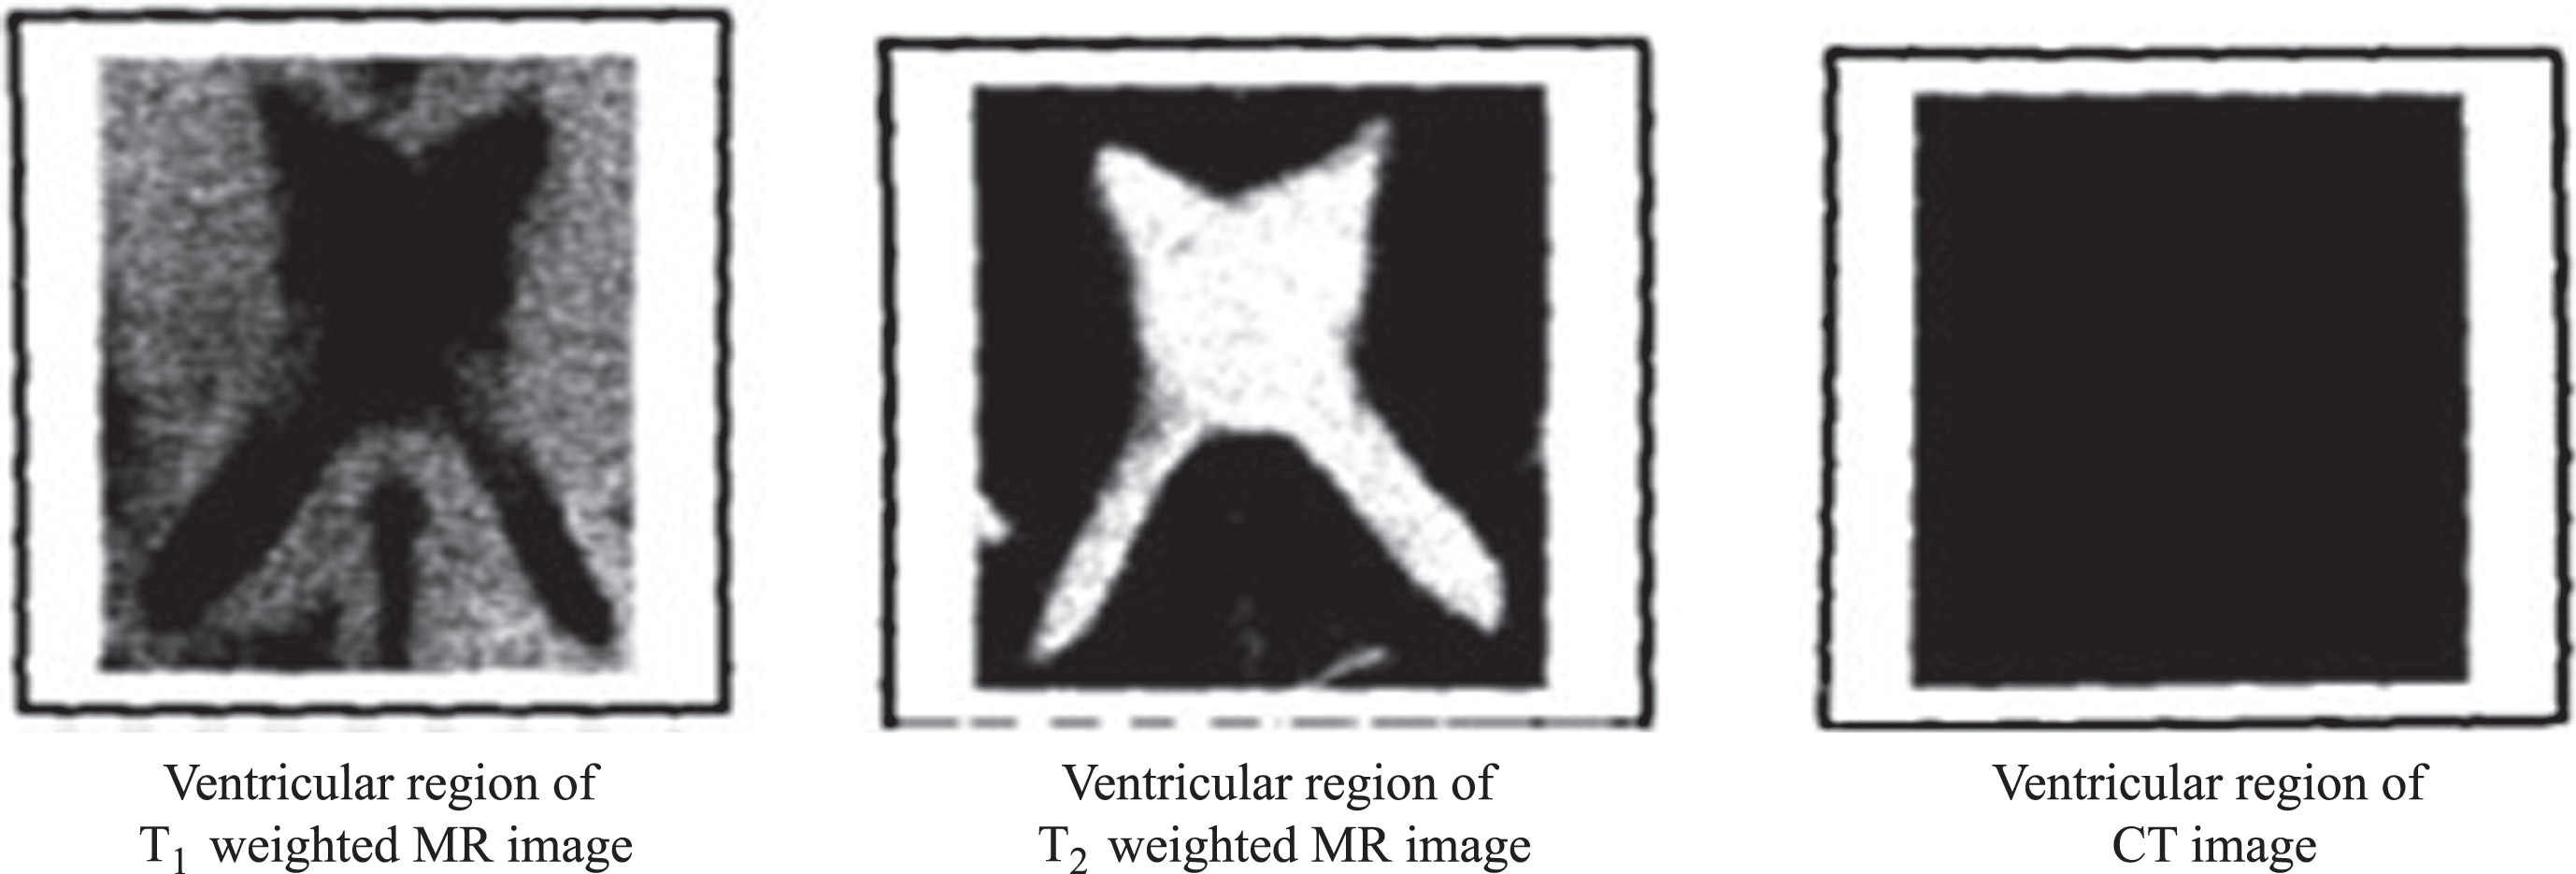
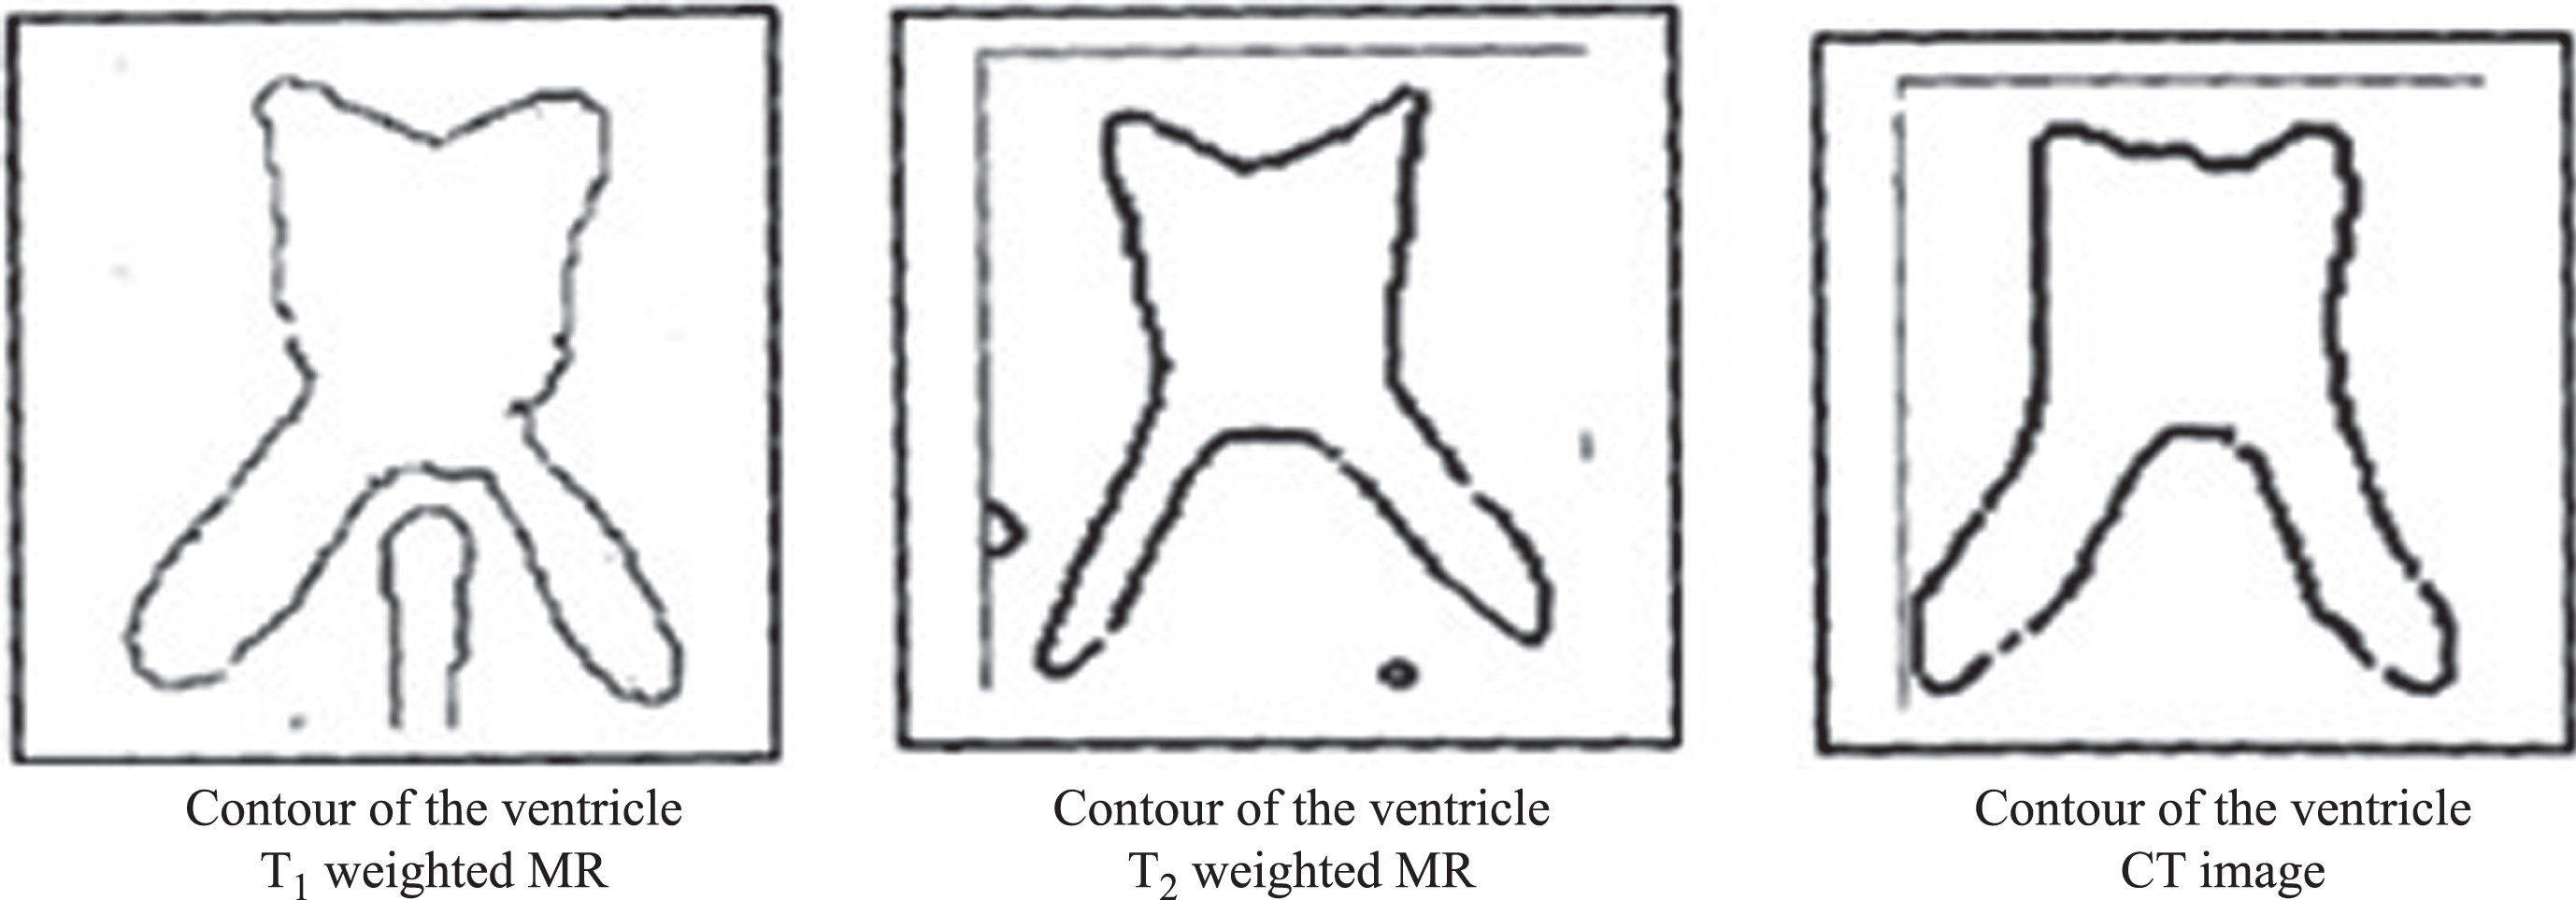
Fig.5
Contour of the ventricular region of MR and CT images.
Fuzzy expert system
Fuzziness is relevant to complexity because the nature of a system when its complexity exceeds a certain threshold, it becomes impractical or computationally infeasible to make precise assertions about it. Fuzzy control is based on fuzzy logic— a logical system which is much closer in spirit to human thinking and natural language than traditional logical systems. The fuzzy logic controller based on fuzzy logic provides a means of converting a linguistic control strategy based on expert knowledge into an automatic control strategy. The fuzzy inference system (FIS) has a vital role in the medical field to provide medical assistance to the radiologist to diagnose the abnormality in the medical images. Decision support systems through information technology has become a part of classification of AD [20].
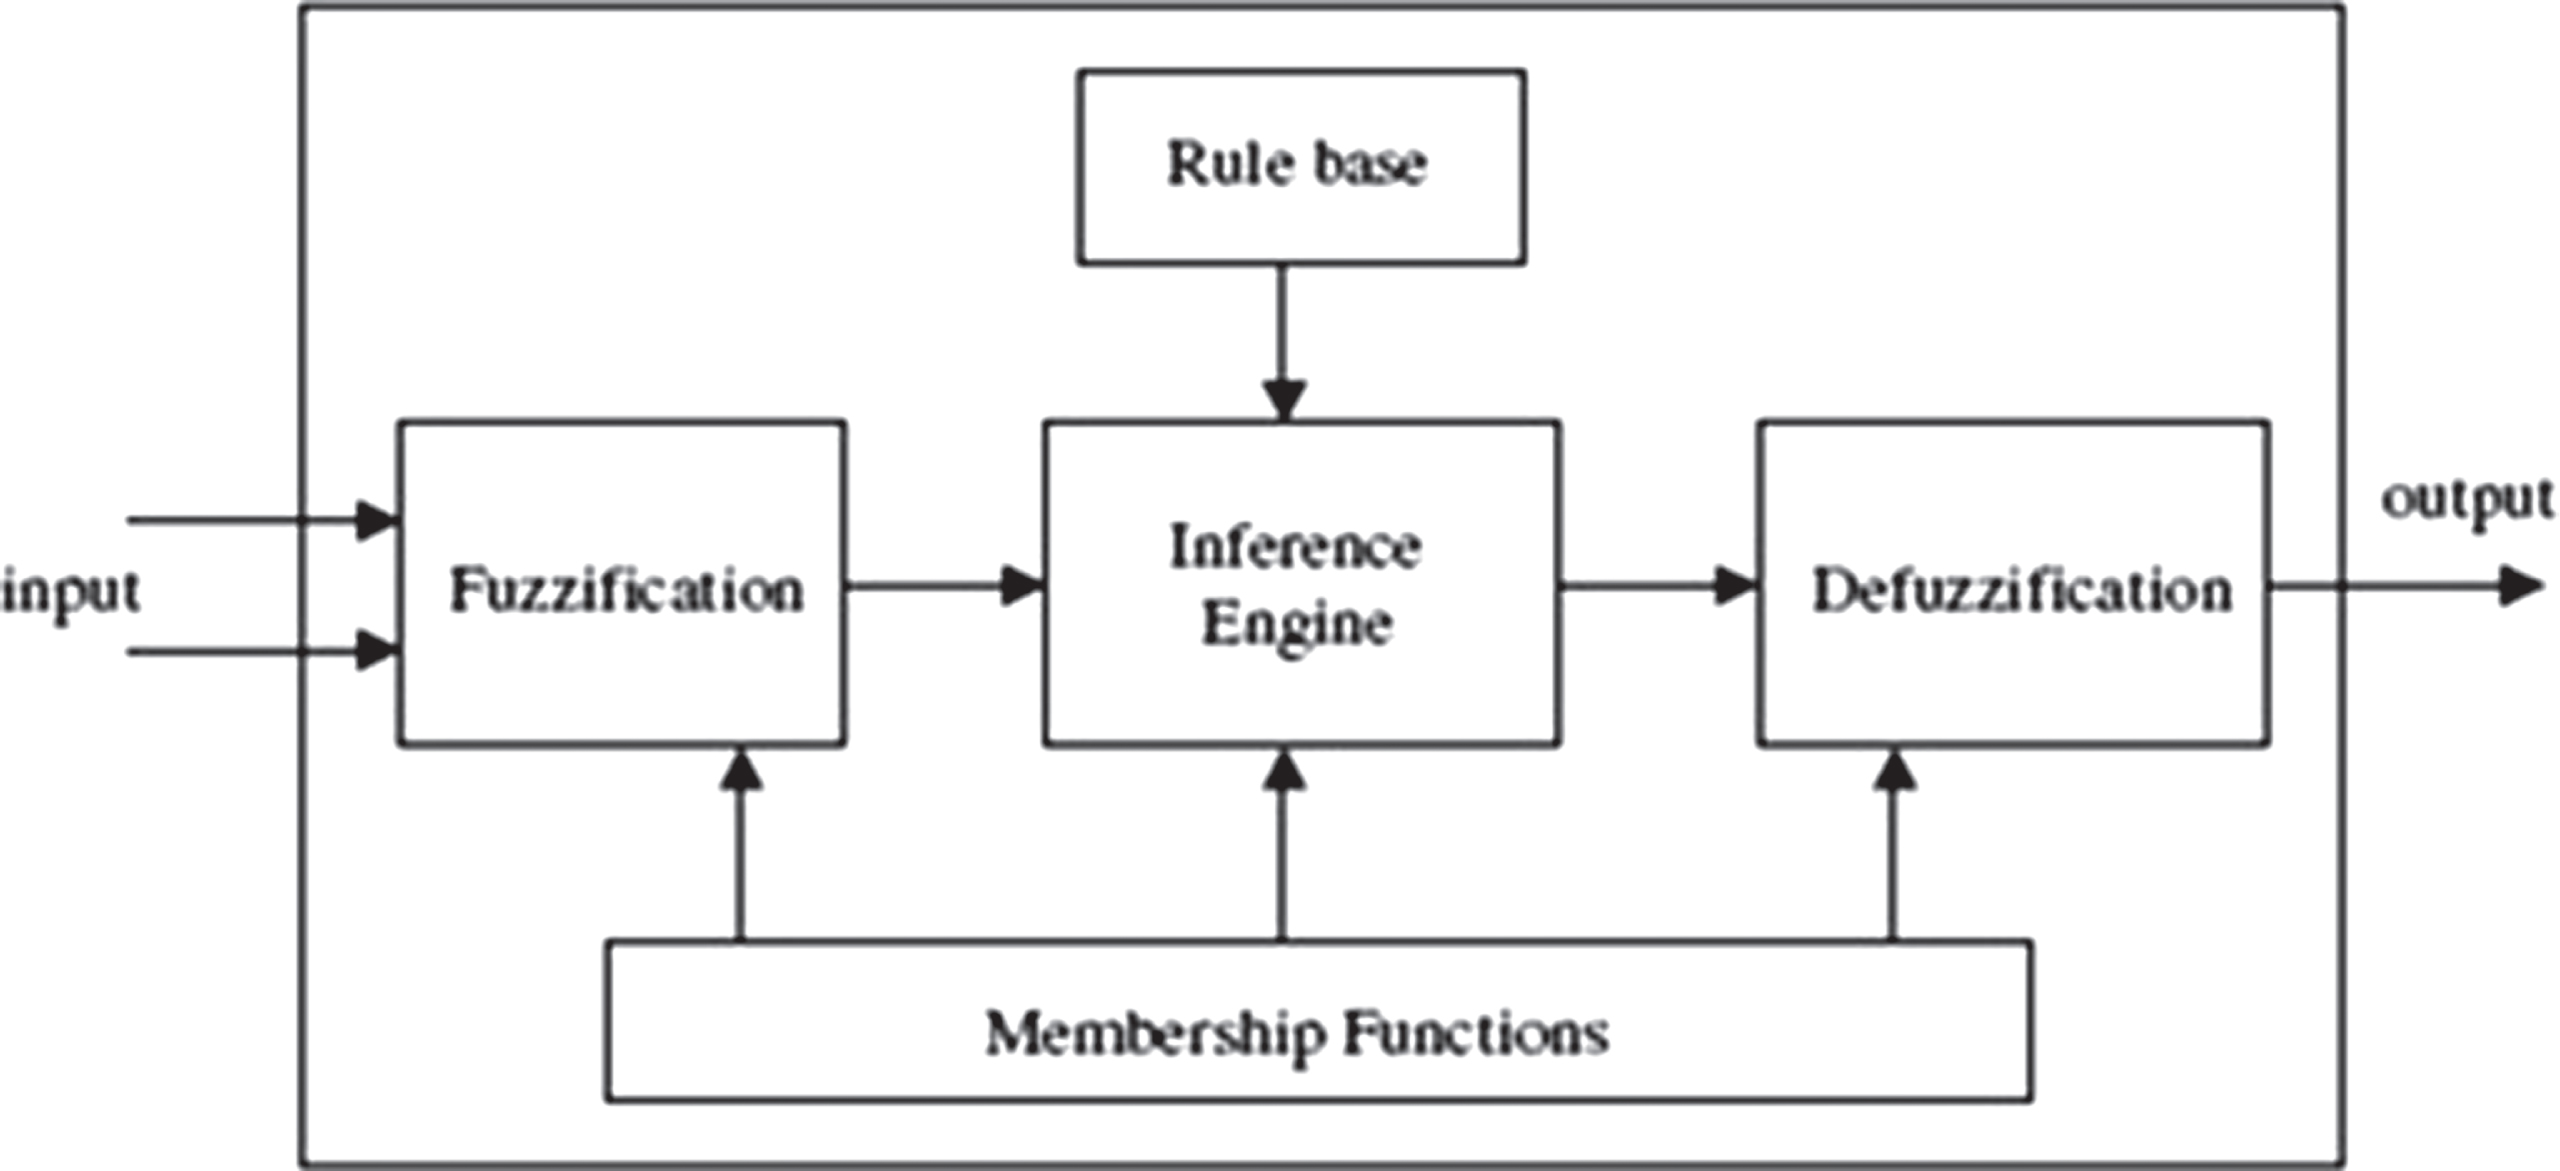
In the first phase, we have used the process fuzzy (IF-THEN) rules by taking ADC, FA, and GM as input parameters and AD score as output variable. The second phase carries the classification of the AD score as either normal case or AD case by feeding the above input parameters to the FIS (Fig. 6).
Fig.6
Fuzzy inference system.
Input variables
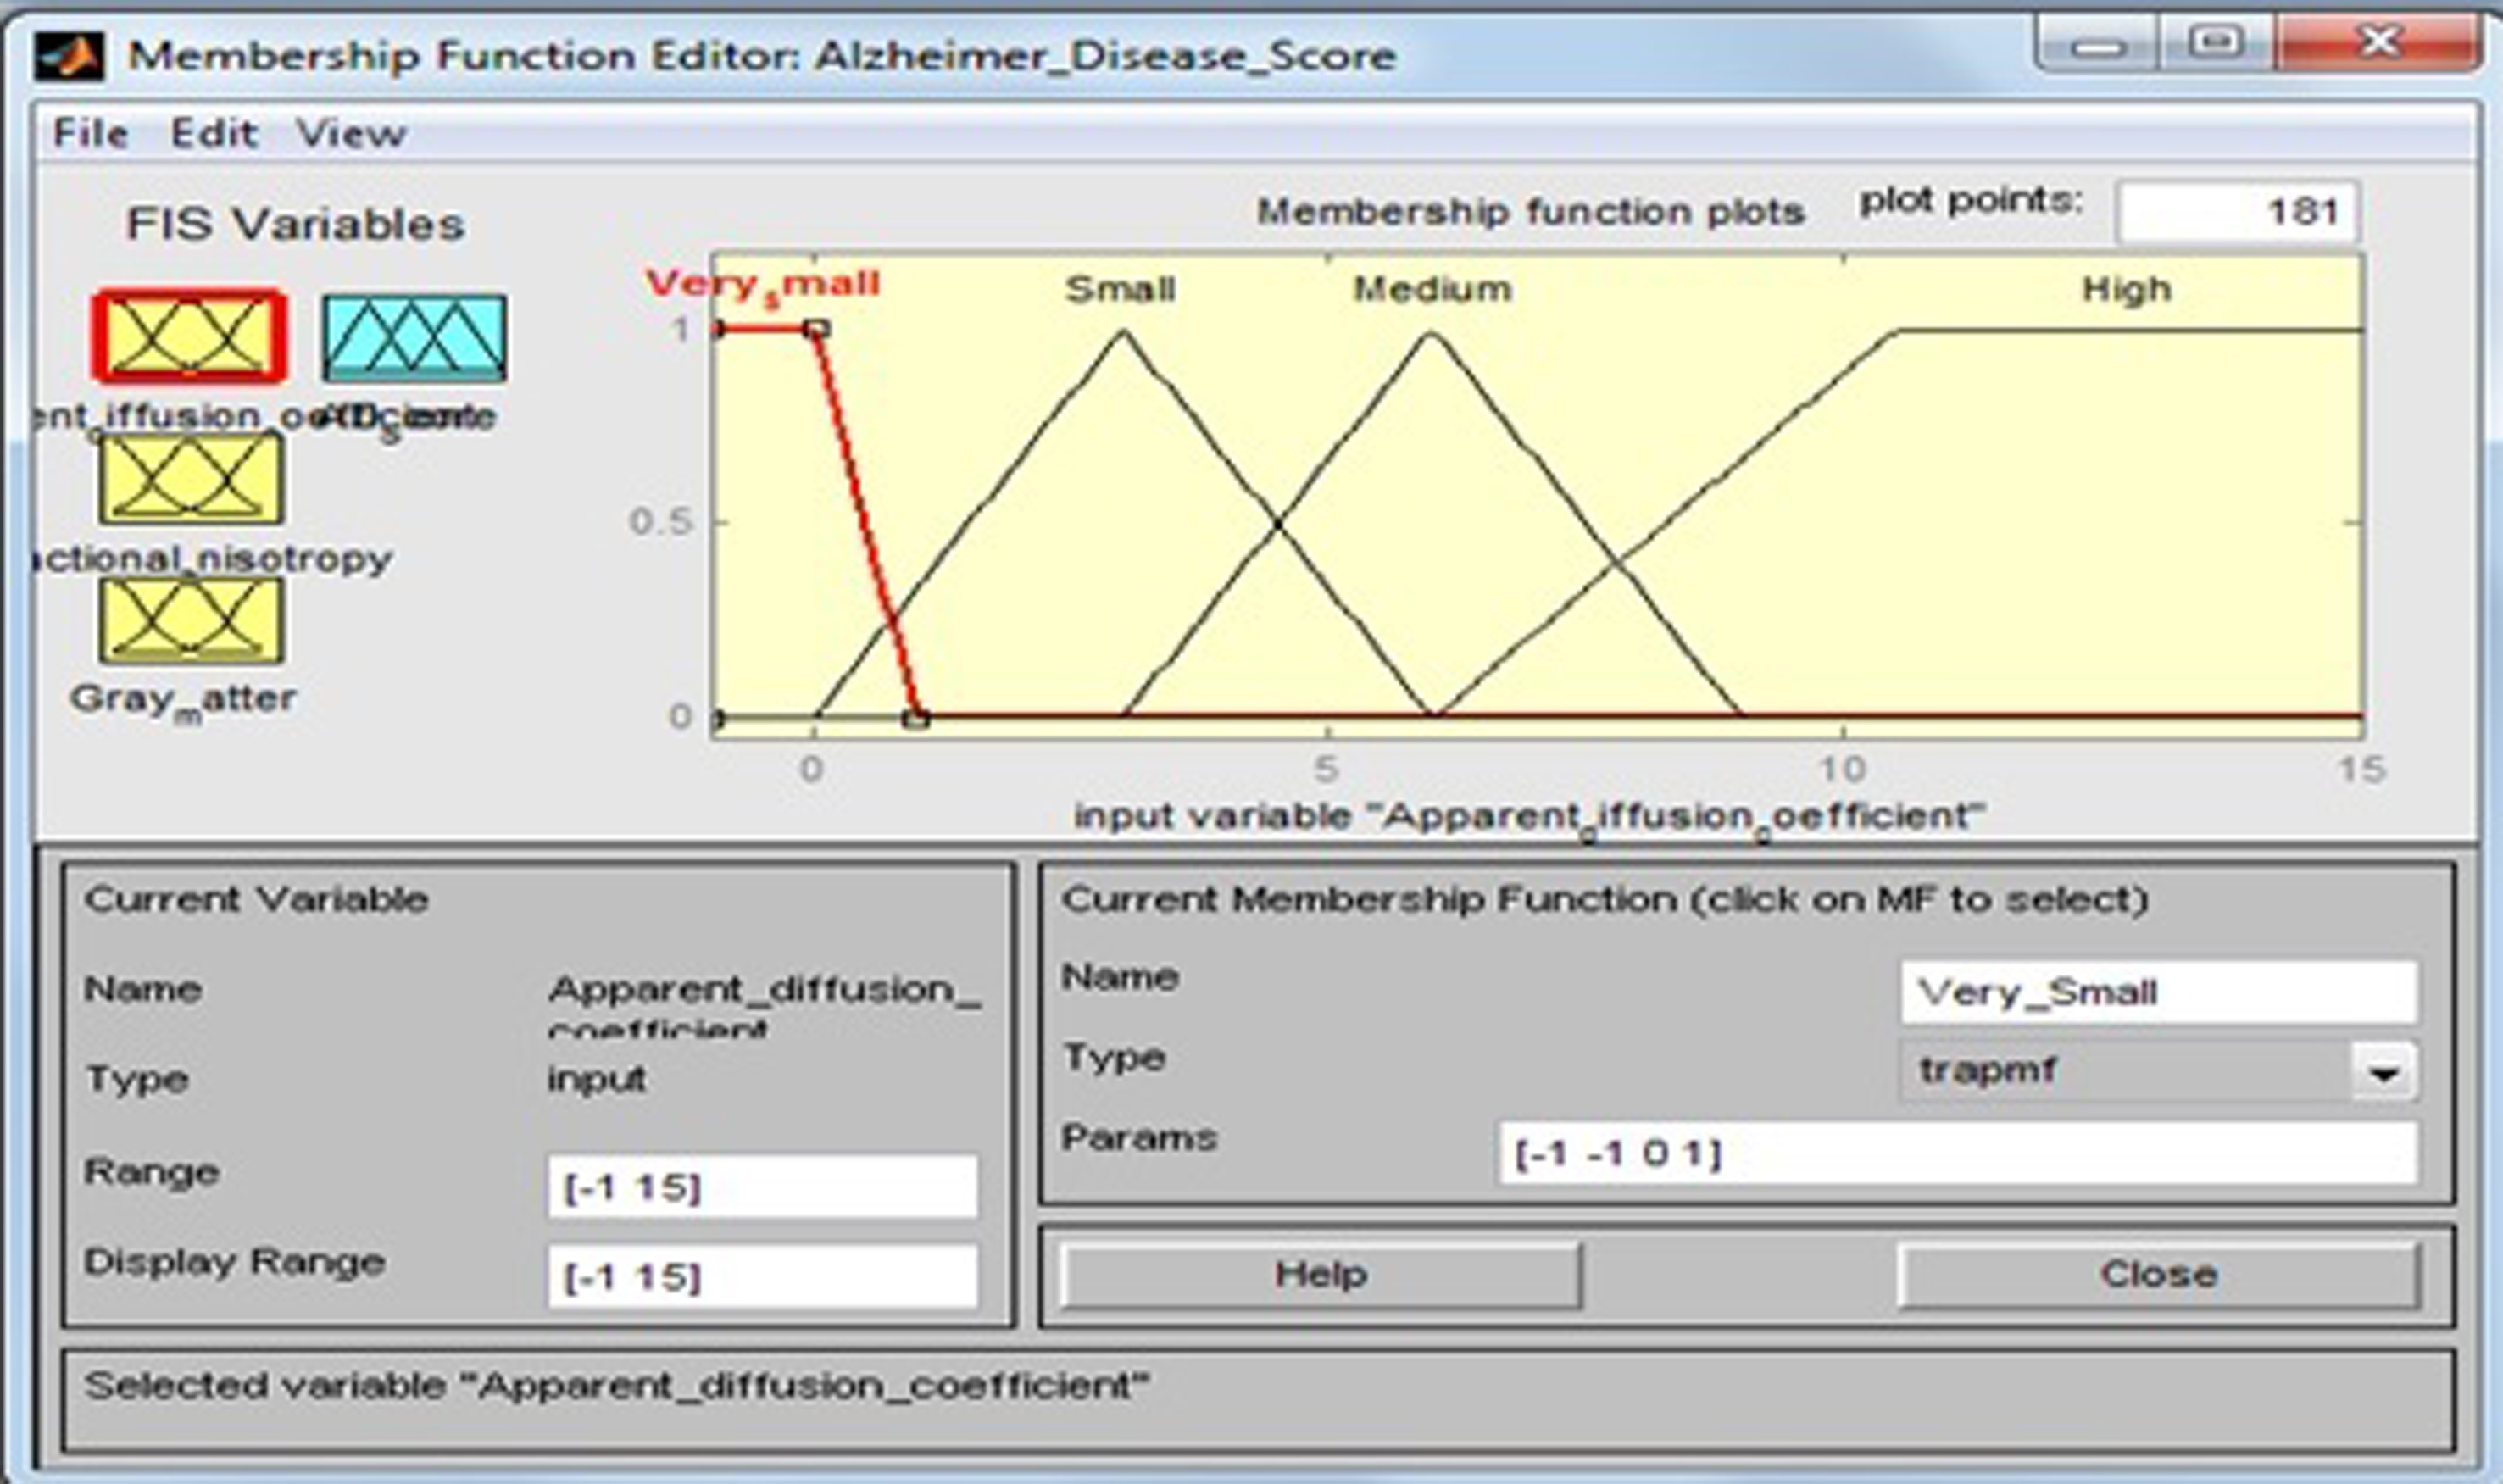
2.5.1Apparent diffusion coefficient
This input variable has four fuzzy sets: “Very Small”, “Small”, “Medium”, and “High”. Membership functions include trapezoidal and triangular fuzzy numbers [21]. Fuzzy sets, support sets, and membership functions of ADC are identified in Table 4 and Fig. 7.
Table 4
Fuzzy set of input variable ‘Apparent diffusion coefficient’
| Input field | Support set | Fuzzy set |
| Apparent diffusion coefficient | –1–1 | Very Small |
| 0–6 | Small | |
| 3–9 | Medium | |
| 6–15 | High |
Fig.7
Membership function for apparent diffusion coefficient.
The membership functions of the fuzzy sets are given below:
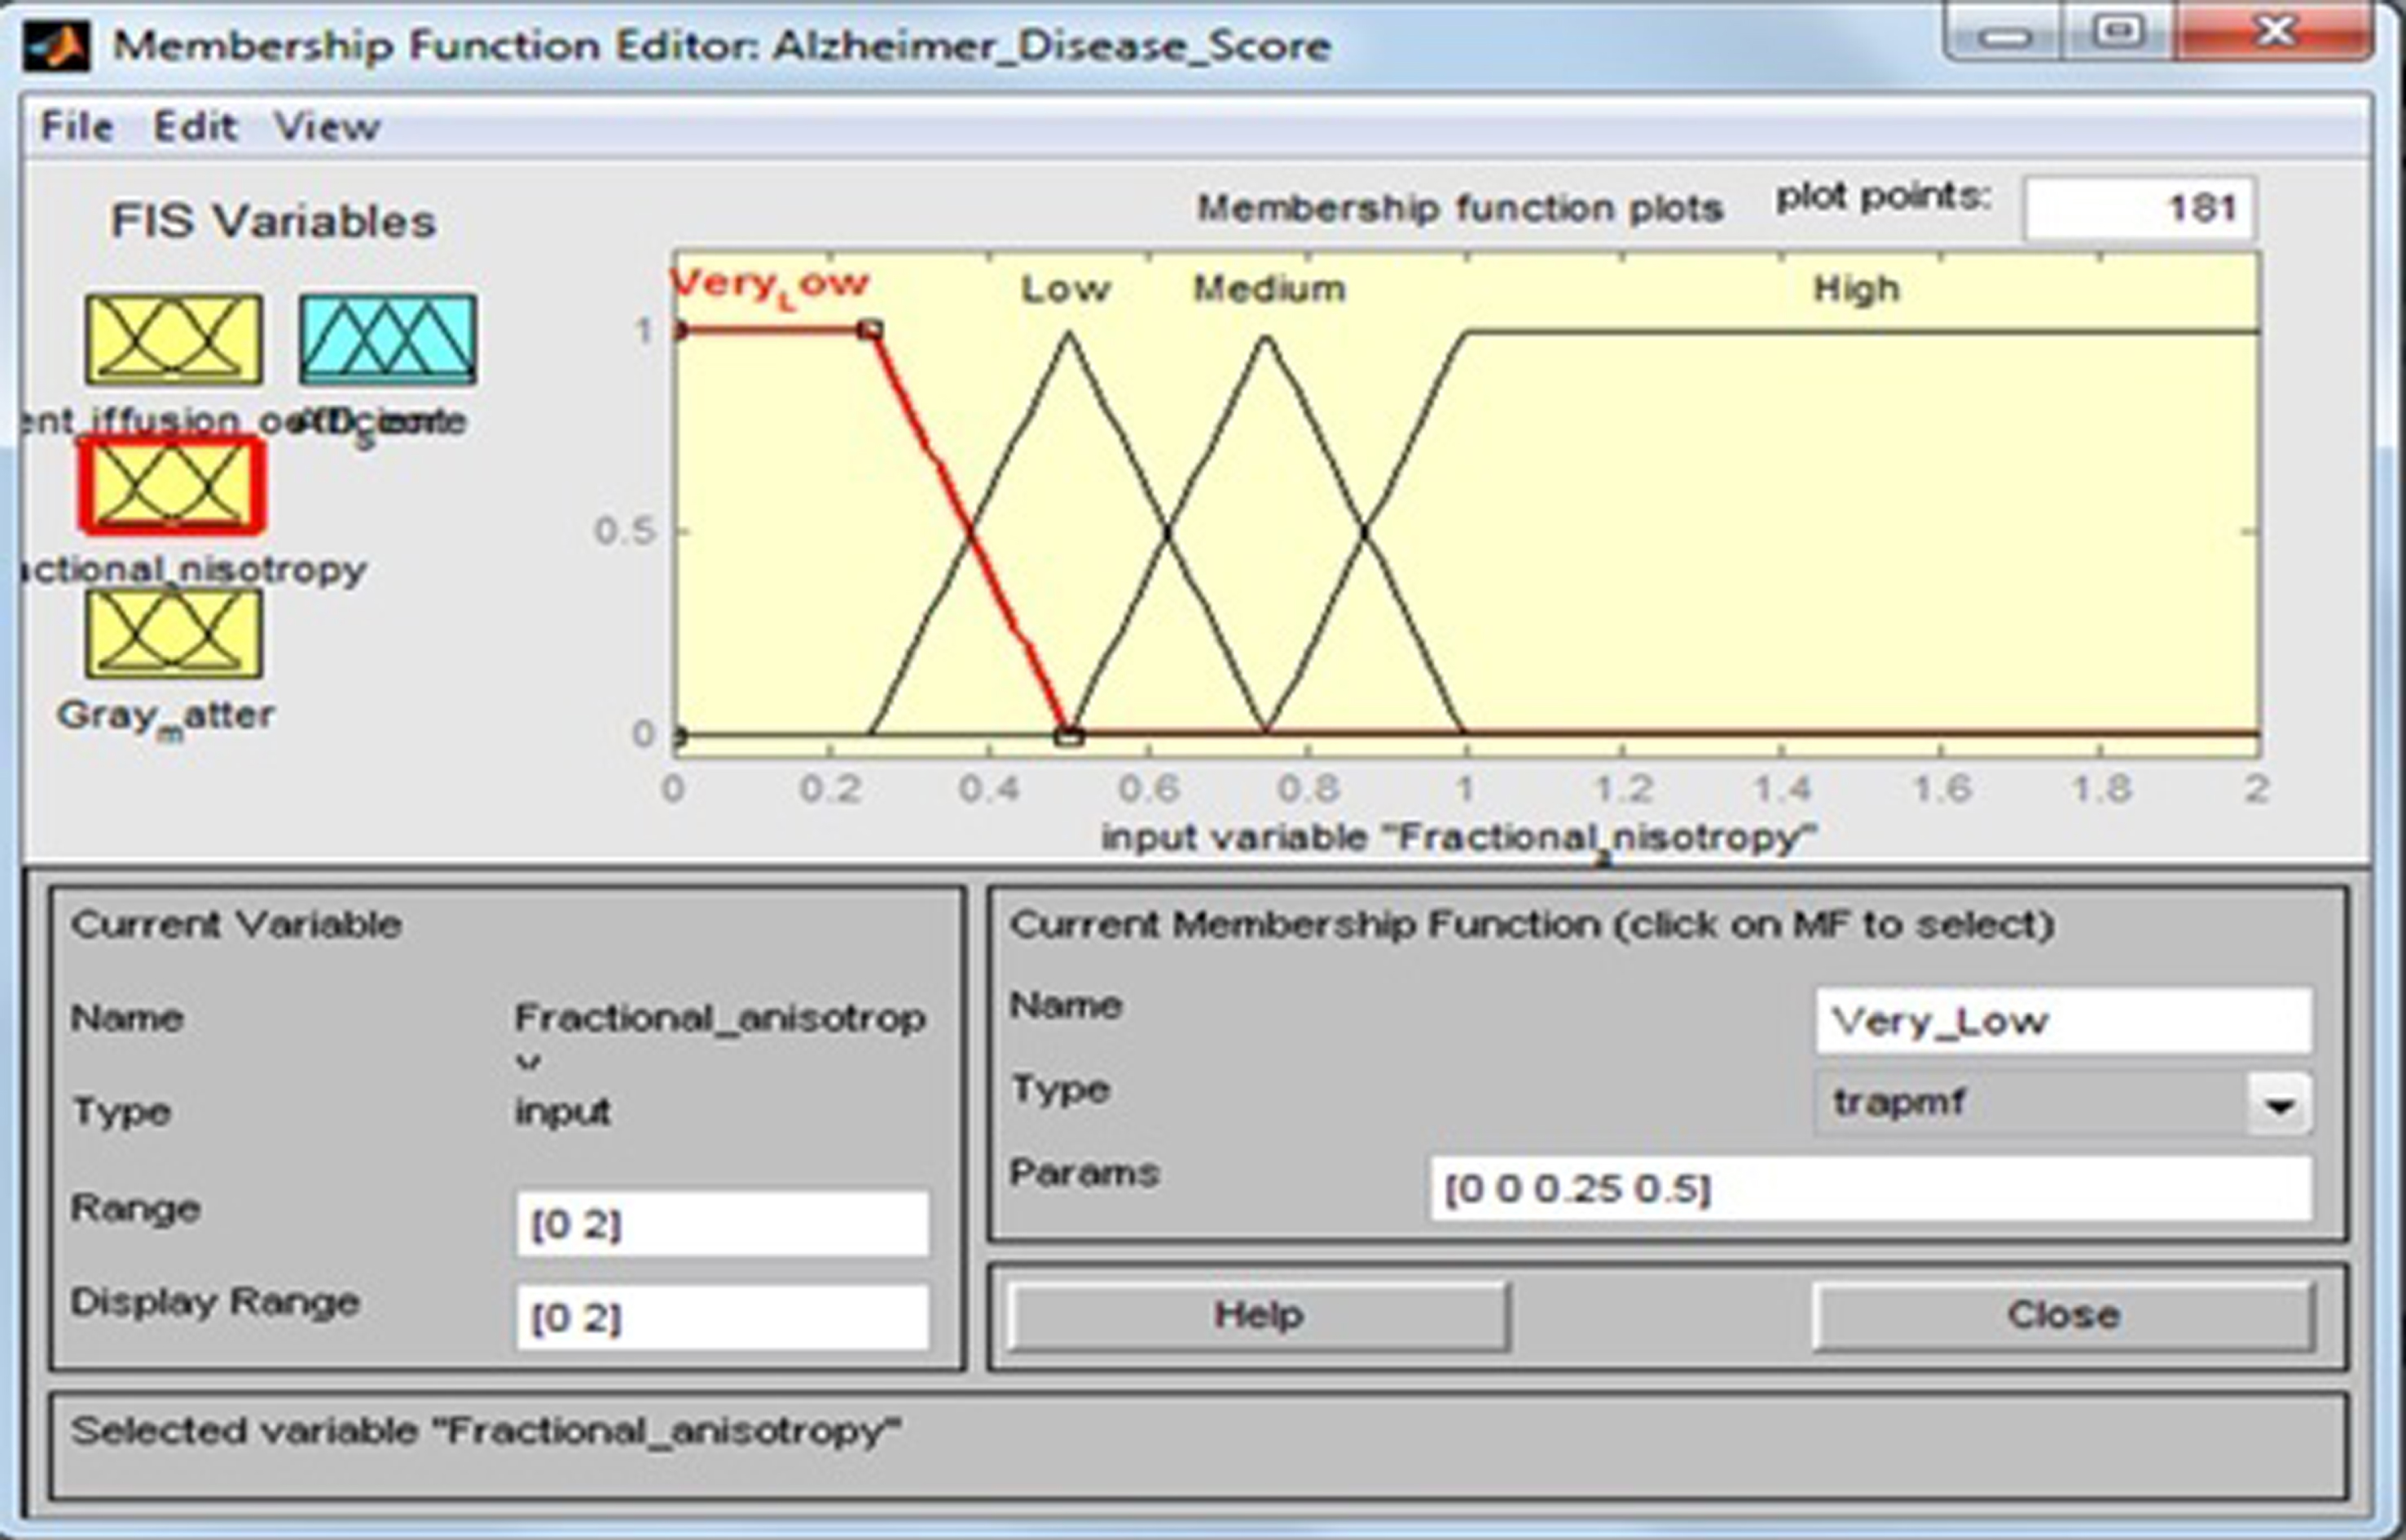
Fractional anisotropy
This input variable has four fuzzy sets: “Very Low”, “Low”, “Medium”, and “High”. Membership functions include trapezoidal and triangular fuzzy numbers. Fuzzy sets, support sets, and membership functions of FA are identified in Table 5 and Fig. 8.
Table 5
Fuzzy set of input variable ‘Fractional anisotropy’
| Input field | Support set | Fuzzy set |
| Fractional anisotropy | 0–0.5 | Very Low |
| 0.25–0.75 | Low | |
| 0.5–1 | Medium | |
| 0.75–2 | High |
Fig.8
Membership function for fractional anisotropy.
The membership functions of the fuzzy sets are given below:
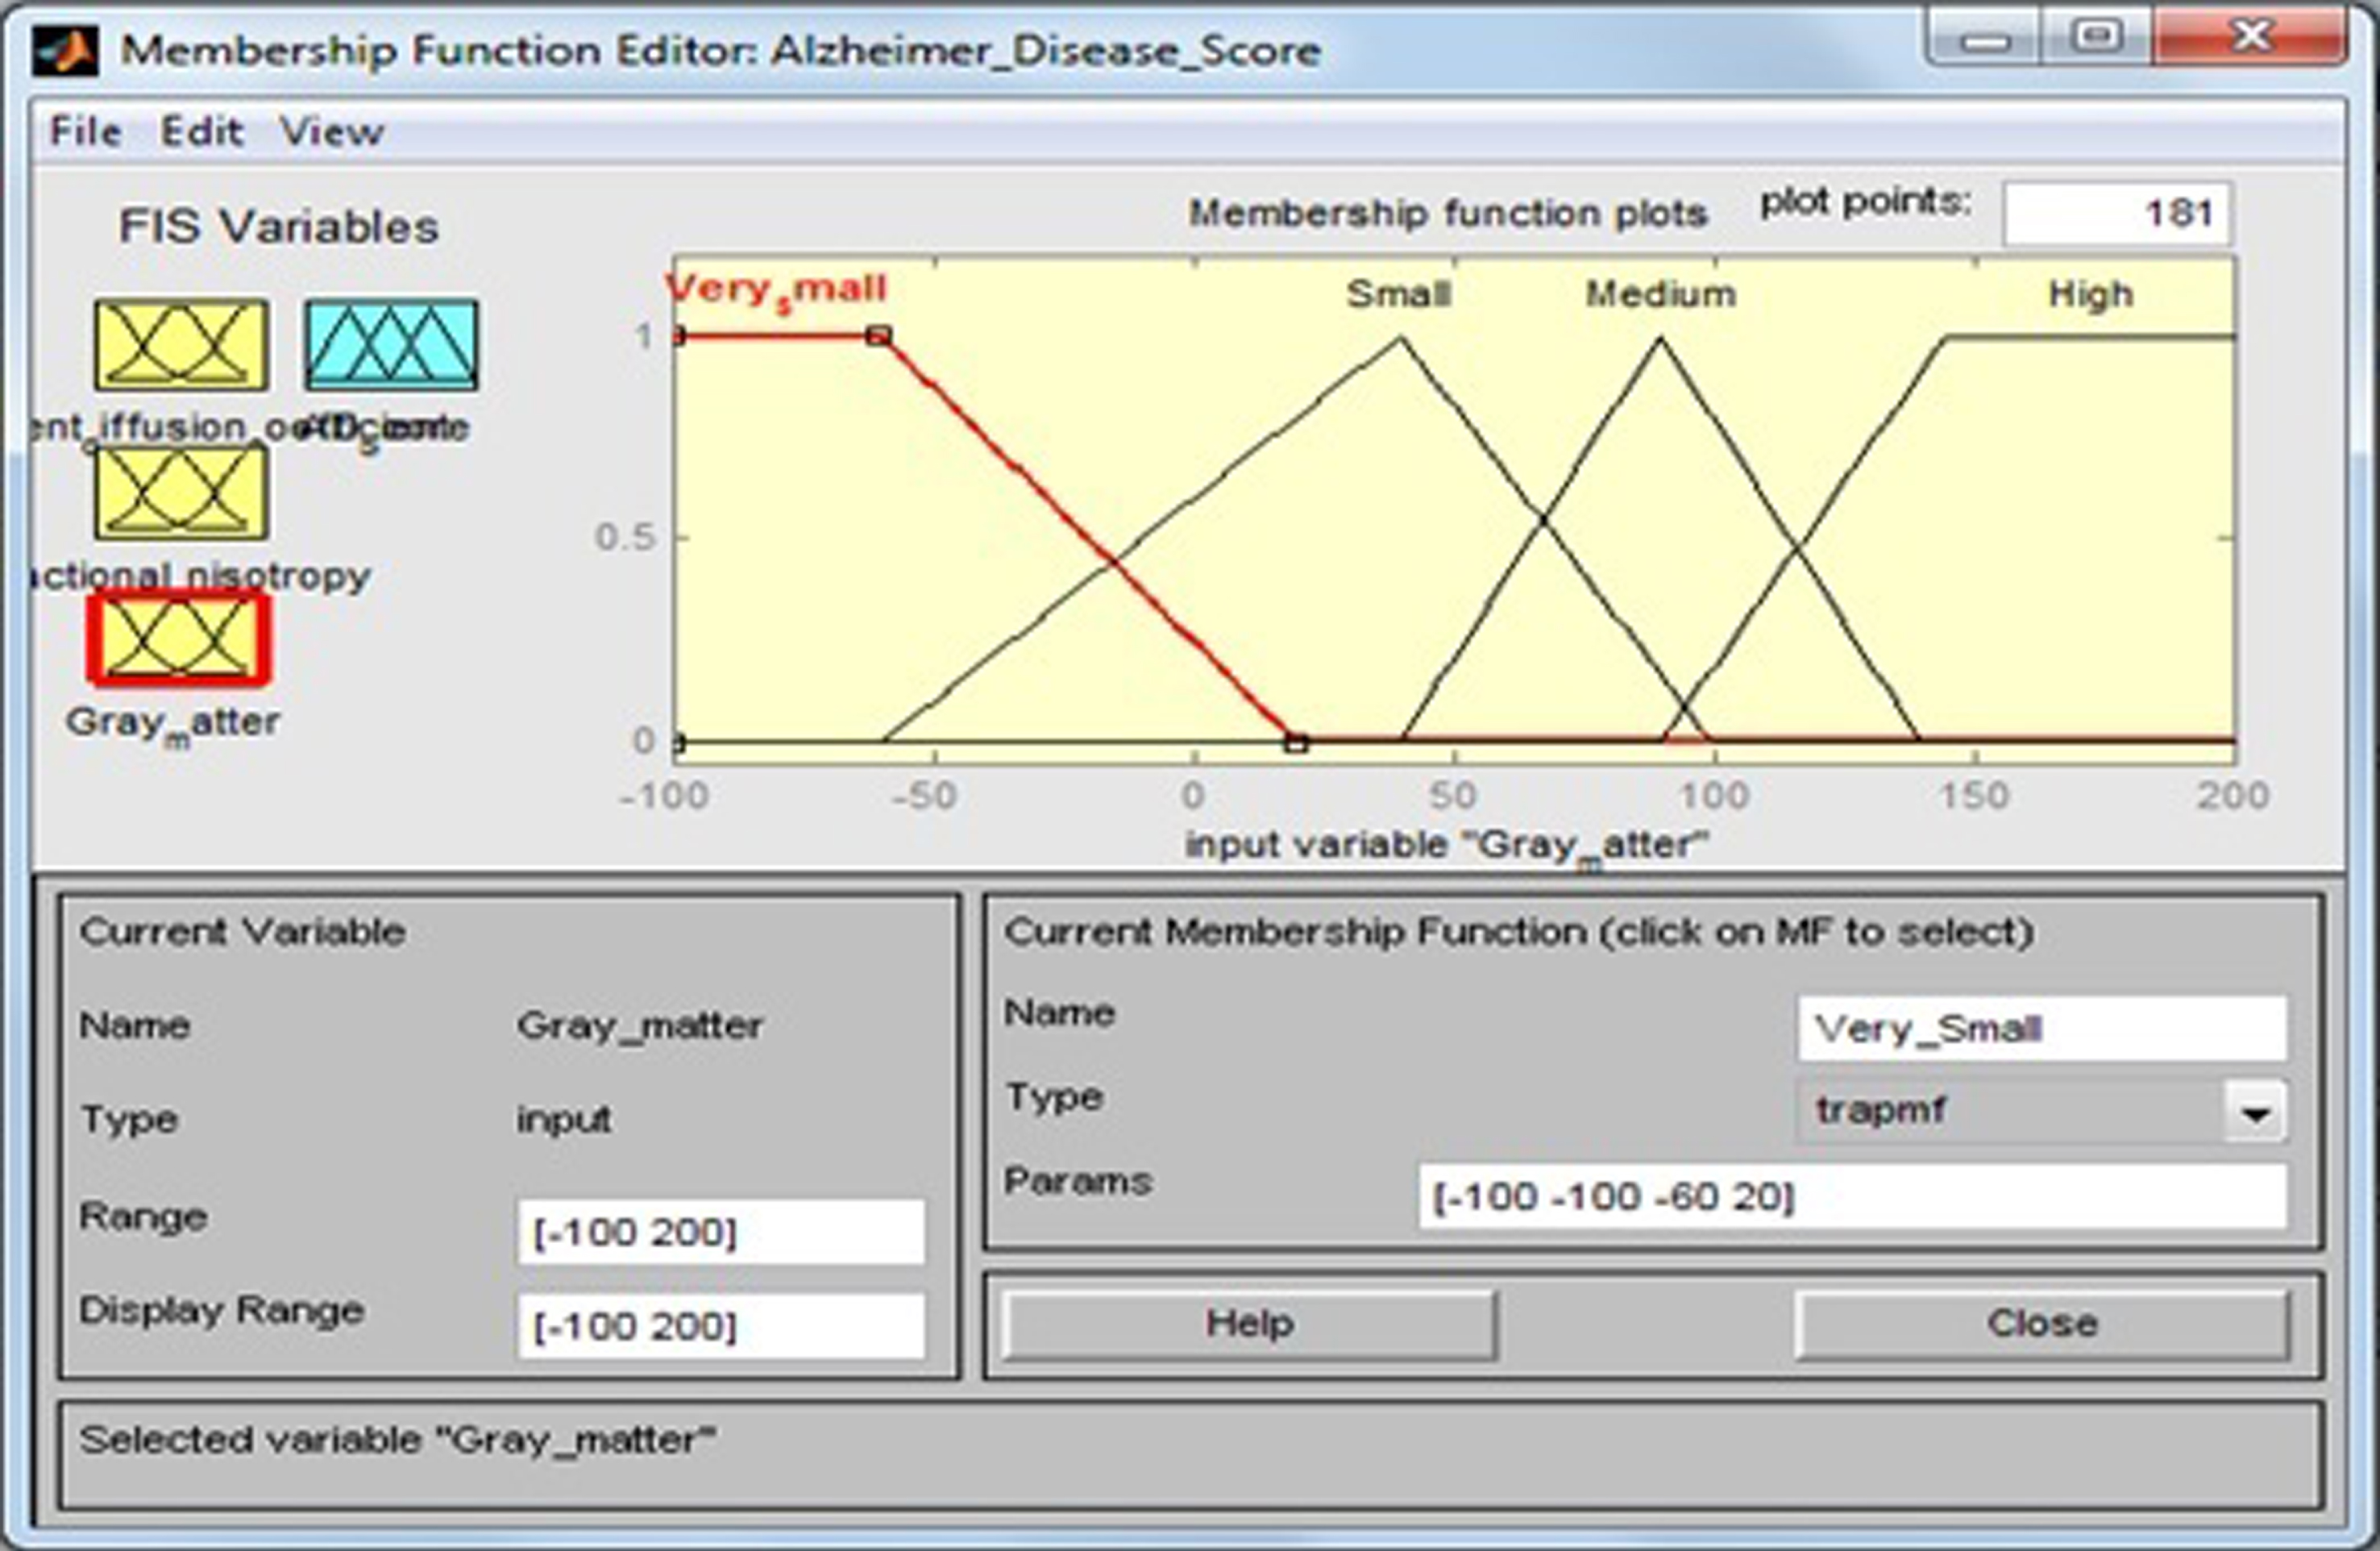
Gray matter
This input variable has four fuzzy sets: “Very Small”, “Small”, “Medium”, and “High”. Membership functions include trapezoidal and triangular fuzzy numbers. Fuzzy sets, support sets, and membership functions of GM are identified in Table 6 and Fig. 9.
Table 6
Fuzzy set of input variable ‘Gray matter’
| Input field | Support set | Fuzzy set |
| Gray matter | –100–20 | Very Small |
| –60–100 | Small | |
| 40–140 | Medium | |
| 90–200 | High |
Fig.9
Membership function for gray matter.
The membership functions of the fuzzy sets are given below:
Output variable
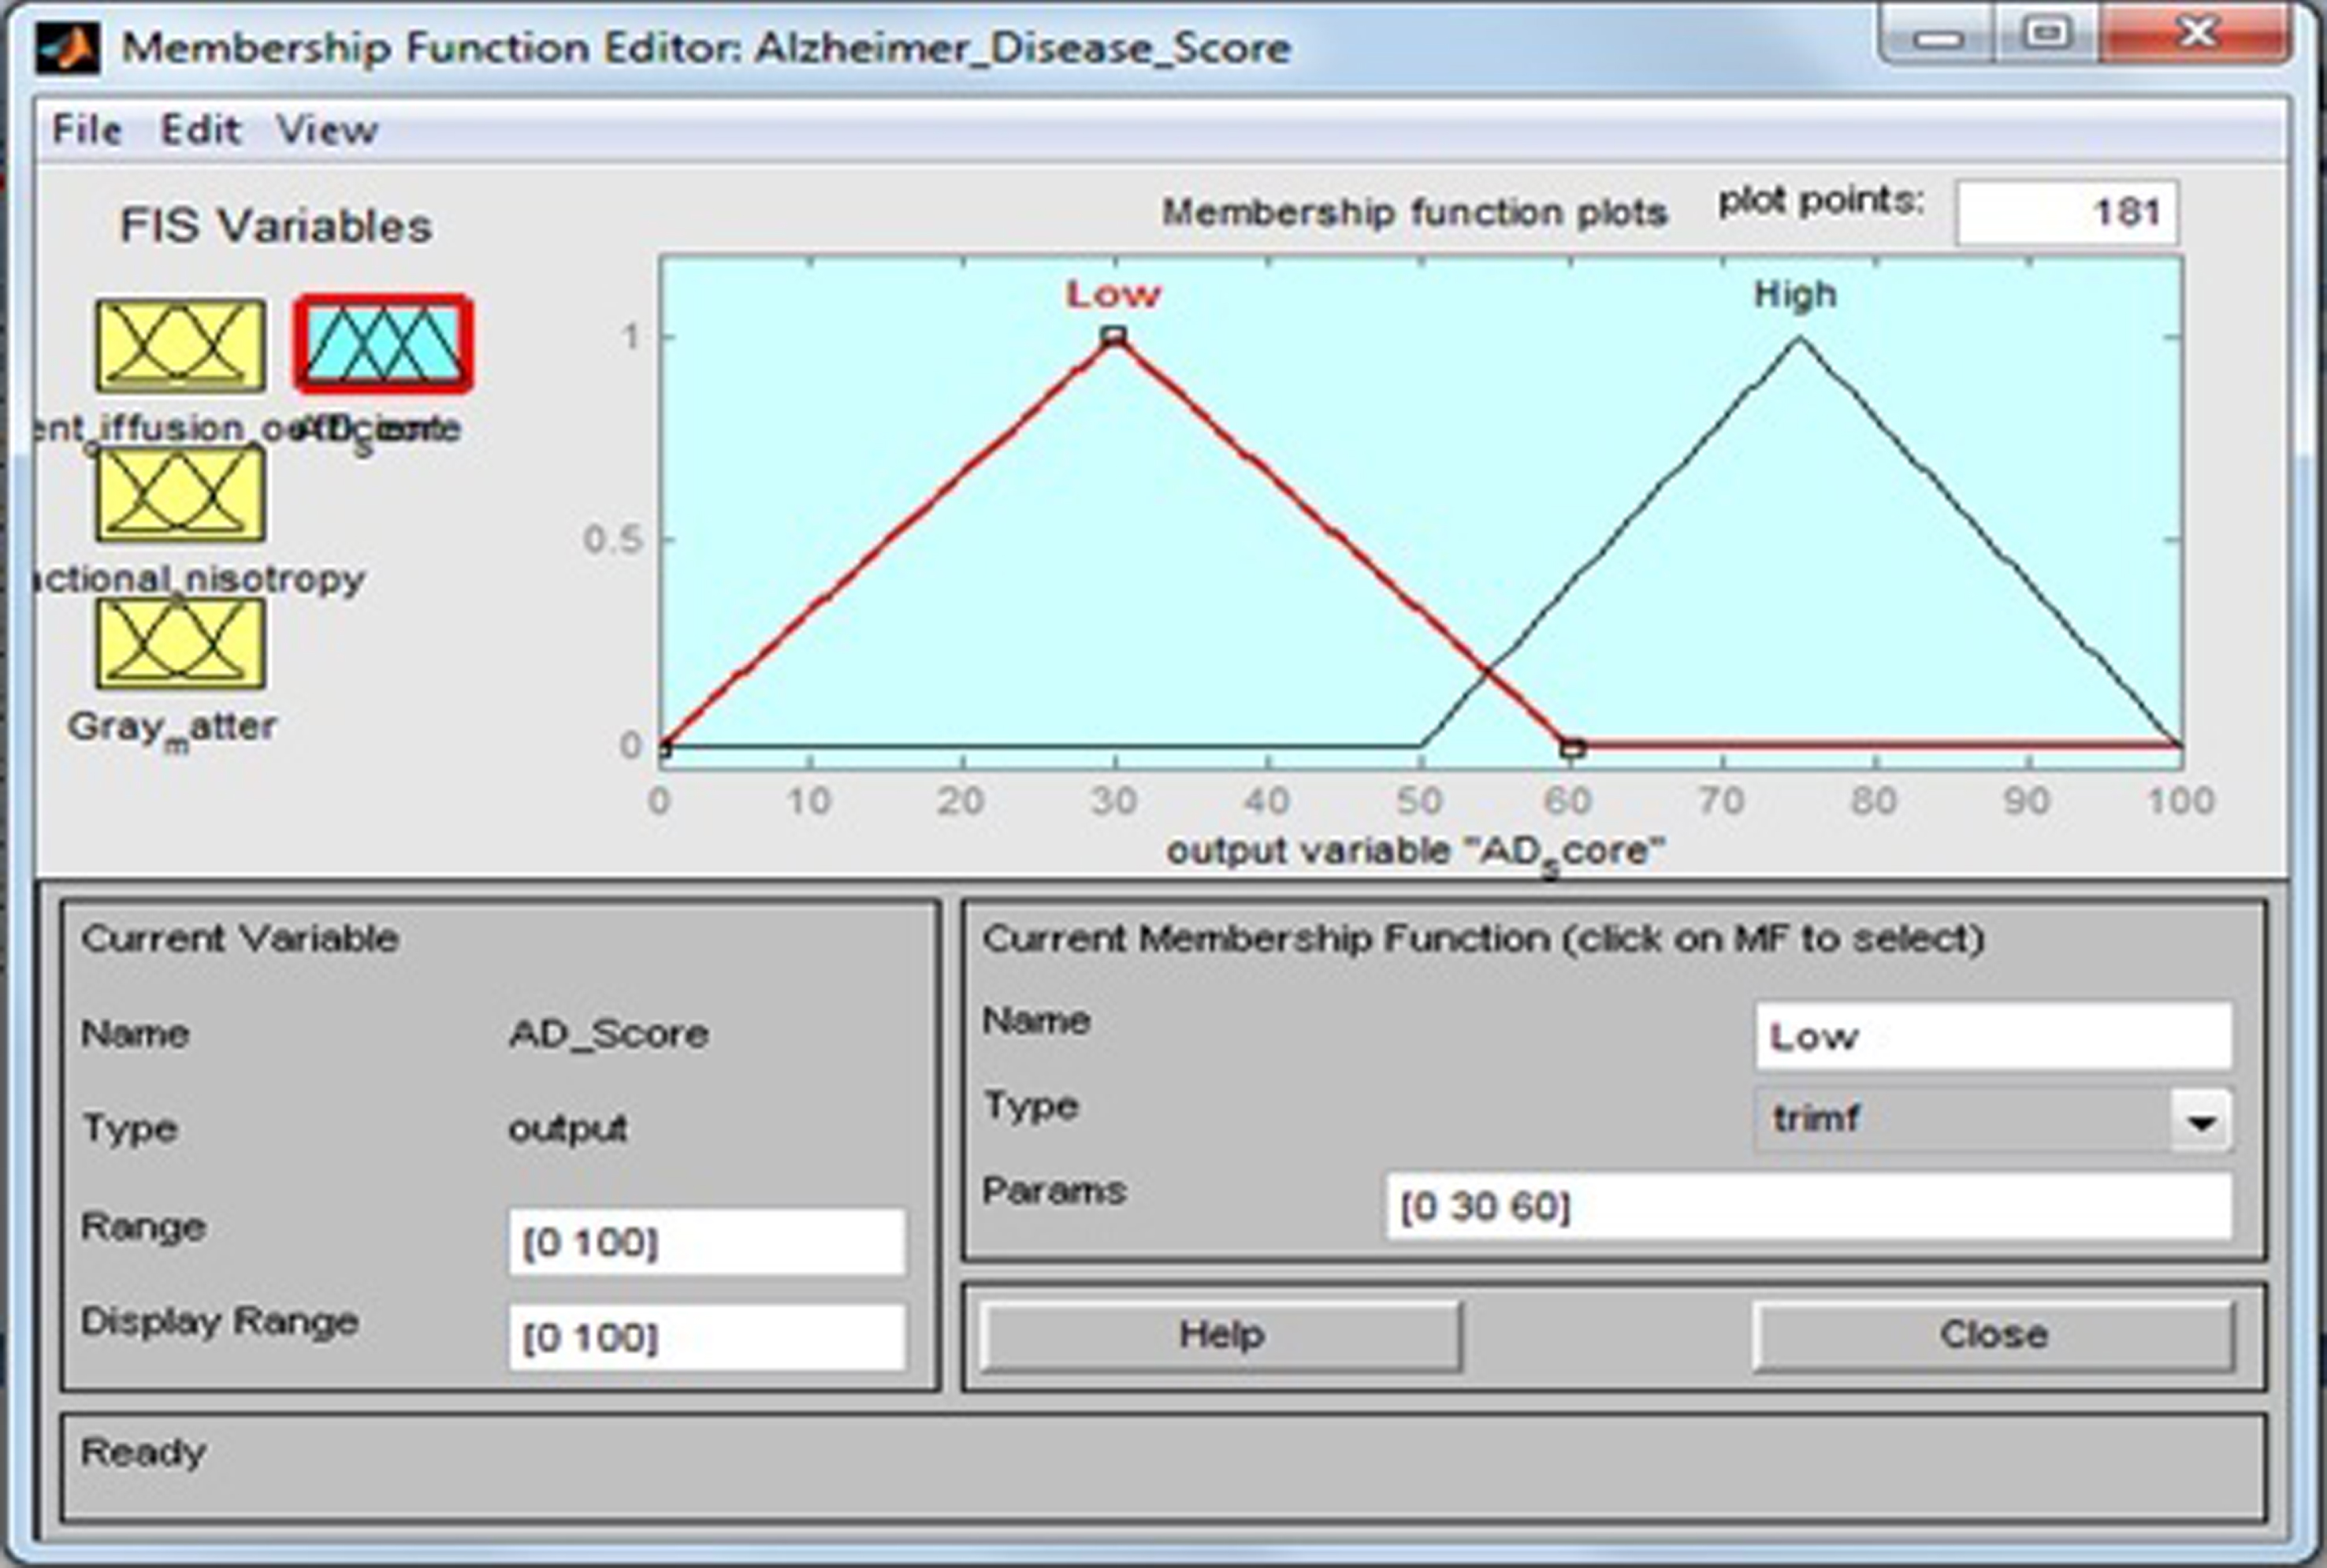
Alzheimer’s disease score
AD scores are calculated on the basis of the input variables ADC, FA, and GM fed into fuzzy inference system. This output variable has two fuzzy sets: “Low” (healthy control) and “High” (AD). Membership function include triangular fuzzy numbers. Fuzzy sets, support sets, and membership functions of AD scores are identified in Table 7 and Fig. 10.
Table 7
Fuzzy set of output variable ‘Alzheimer’s disease score’
| Output field | Support set | Fuzzy set |
| Alzheimer’s disease score | 0 –60 | Low |
| 50 –100 | High |
Fig.10
Membership function for AD score.
The membership functions of the fuzzy sets are given below:
Fuzzy rule base
The fuzzy rule base consists of 16 rules that determine the AD scores (Low, High) by evaluation of the input variables ADC, FA, and GM, and it plays an important role in further treatment decision. The rule base of the system is shown in Table 8.
Table 8
Rule base of the system
| Rule no. | ADC | FA | GM | AD score |
| Rule 1 | Very Small | Very Low | Very Small | Low |
| Rule 2 | Very Small | Low | Small | High |
| Rule 3 | Very Small | Medium | Medium | Low |
| Rule 4 | Very Small | High | High | High |
| Rule 5 | Small | Very Low | Very Small | Low |
| Rule 6 | Small | Low | Small | High |
| Rule 7 | Small | Medium | Medium | Low |
| Rule 8 | Small | High | High | High |
| Rule 9 | Medium | Very Low | Very Small | Low |
| Rule 10 | Medium | Low | Small | High |
| Rule 11 | Medium | Medium | Medium | Low |
| Rule 12 | Medium | High | High | High |
| Rule 13 | High | Very Low | Very Small | Low |
| Rule 14 | High | Low | Small | High |
| Rule 15 | High | Medium | Medium | Low |
| Rule 16 | High | High | High | High |
Rule 1: If the ADC is Very Small, FA is Very Low, and GM is Very Small, then AD score is Low. Rule 2: If the ADC is Very Small, FA is Low, and GM is Small, then AD score is High. Rule 4: If the ADC is Very Small, FA is High, and GM is High, then AD score is High. Rule 6: If the ADC is Small, FA is Low, and GM is Small, then AD score is High. Rule 8: If the ADC is Small, FA is High, and GM is High, then AD score is High. Rule 14: If the ADC is High, FA is Low, and GM is Small, then AD score is High. Rule 16: If the ADC is High, FA is High, and GM is High, then AD score is High. ADC, apparent diffusion coefficient; FA, fractional anisotropy; GM, gray matter; AD, Alzheimer’s disease.
The linguistics variables such as Very Small, Small, Medium, and High of input variable ADC are determined. For the output variable AD score, the linguistics expressions are Low and High, respectively. For example, for Small (APC), Medium (FA), and High (GM), the membership functions will have to form respectively
The tested values of the system are shown in Table 9. Mamdani inference engine is used for rule evaluation purpose. The linguistic variables used in this system are like very small, small, medium, and high for input variables and low and high output variable. This study uses 16 rules in designing fuzzy rule base as shown in Fig. 11.
Table 9
Tested values of the system
| Patient number | ADC (10-3mm2/s) | FA | GM | AD Score (Risk status %) |
| Patient-I | 0.0776 | 0.0326 | –79.59 | 30 |
| Patient-II | 0.3838 | 0.4613 | –18.07 | 59.8 |
| Patient-III | 0.69 | 0.89 | 43.45 | 30 |
| Patient-IV | 0.9962 | 1.3187 | 104.97 | 75 |
| Patient-V | 1.3024 | 1.7474 | 166.49 | 75 |
| Patient-VI | –1.042 | 0.3464 | 38.77 | 75 |
| Patient-VII | –0.038 | 0.4076 | 42.07 | 75 |
| Patient-VIII | 0.966 | 0.4688 | 45.37 | 75 |
| Patient-IX | 1.97 | 0.53 | 48.67 | 64.7 |
| Patient-X | 2.974 | 0.5912 | 51.97 | 58.5 |
| Patient-XI | 3.978 | 0.6524 | 55.27 | 52.6 |
| Patient-XII | 4.982 | 0.7136 | 58.57 | 41.7 |
| Patient-XIII | 5.986 | 0.7748 | 61.87 | 30 |
| Patient-XIV | 6.99 | 0.836 | 65.17 | 30 |
| Patient-XV | 7.994 | 0.8972 | 68.47 | 30 |
| Patient-XVI | 8.998 | 0.9584 | 71.77 | 30 |
| Patient-XVII | 10.002 | 1.0196 | 75.07 | 50 |
| Patient-XVIII | 11.006 | 1.0808 | 78.37 | 50 |
| Patient-XIX | 12.01 | 1.142 | 81.67 | 50 |
| Patient-XX | 13.014 | 1.2032 | 84.97 | 50 |
ADC, apparent diffusion coefficient; FA, fractional anisotropy; GM, gray matter; AD, Alzheimer’s disease.
Fig.11
Developed fuzzy rules.
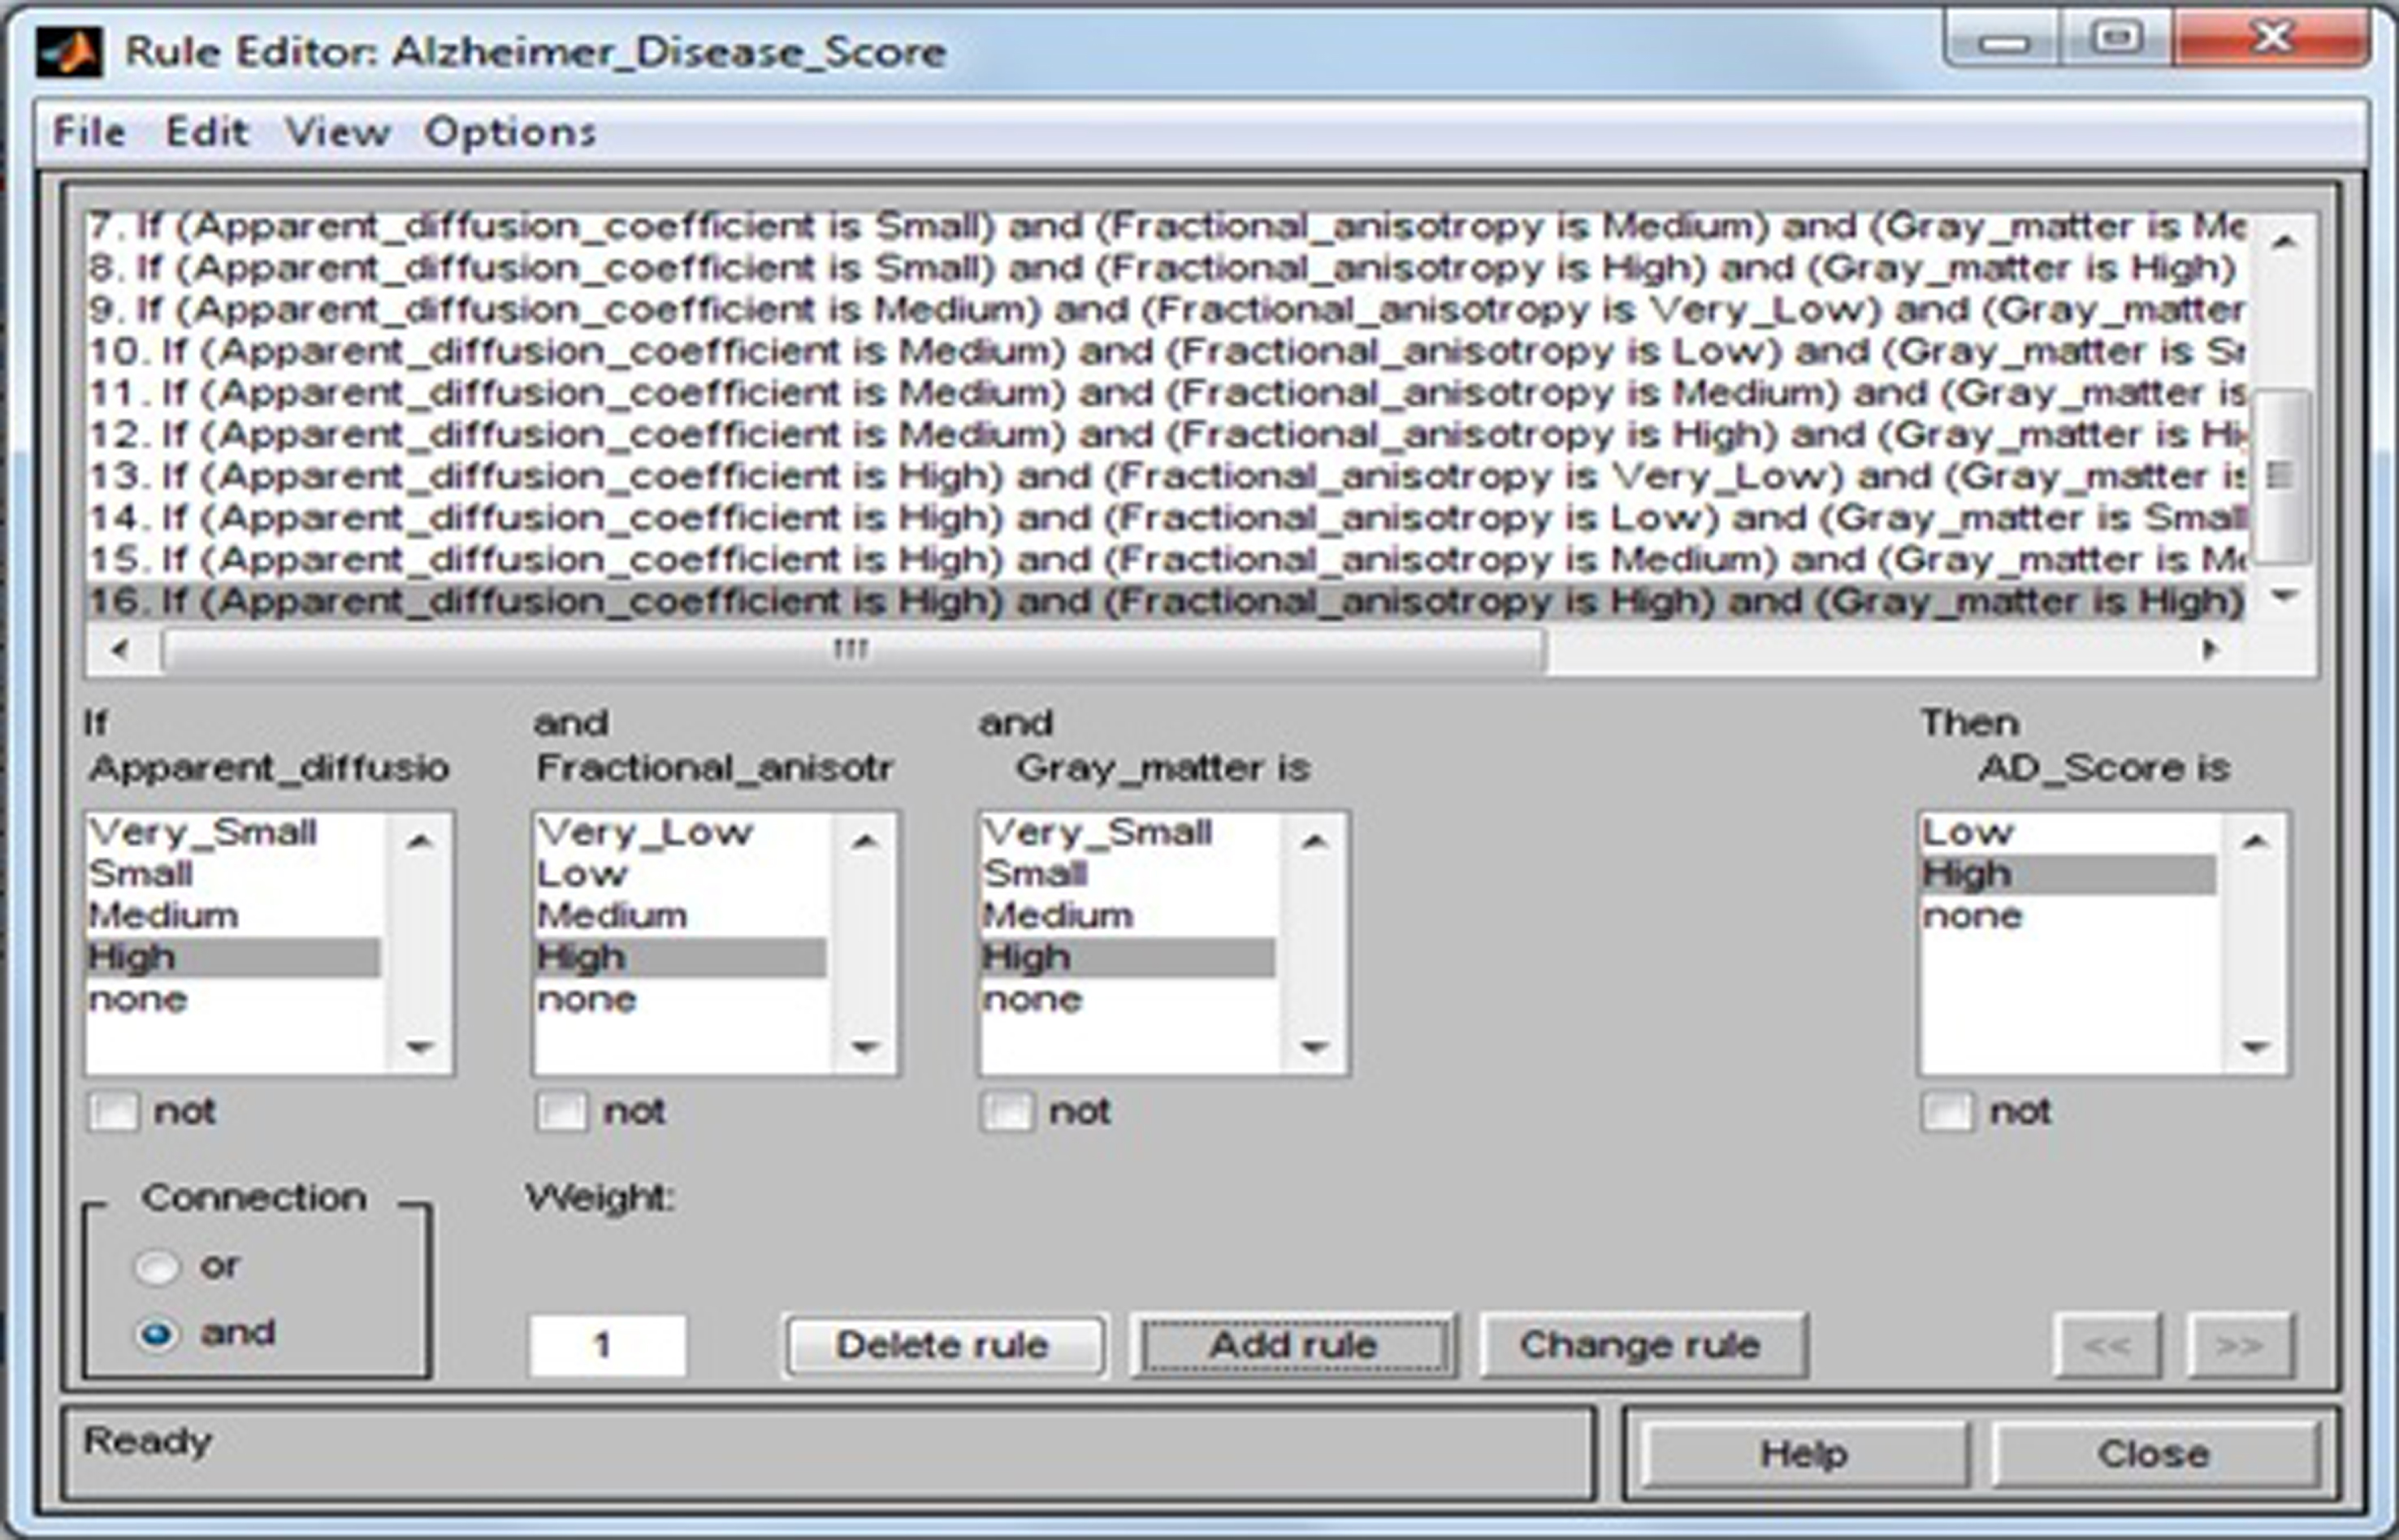
The rules have been developed using if-then method. Figure 12 show a rule view of this proposed design. For example, from Fig. 11, if ADC is high, FA is high, and GM is high, then output AD score is high. Using these rules, the result AD score in terms of percentage (%) has been computed. Surface views of this design are presented in Figs. 13–15. As also seen from Fig. 12, the value of AD score = 75. This means that the patients have AD score with a possibility 75%. Because each case is a quite high percentage and its tendency goes to severe AD stage, the doctor has to take necessary steps for the earliest possible treatment.
Fig.12
Calculation of the value of AD score for the values of apparent diffusion coefficient = –0.038, fractional anisotropy = 0.4076 and gray matter = 42.67.
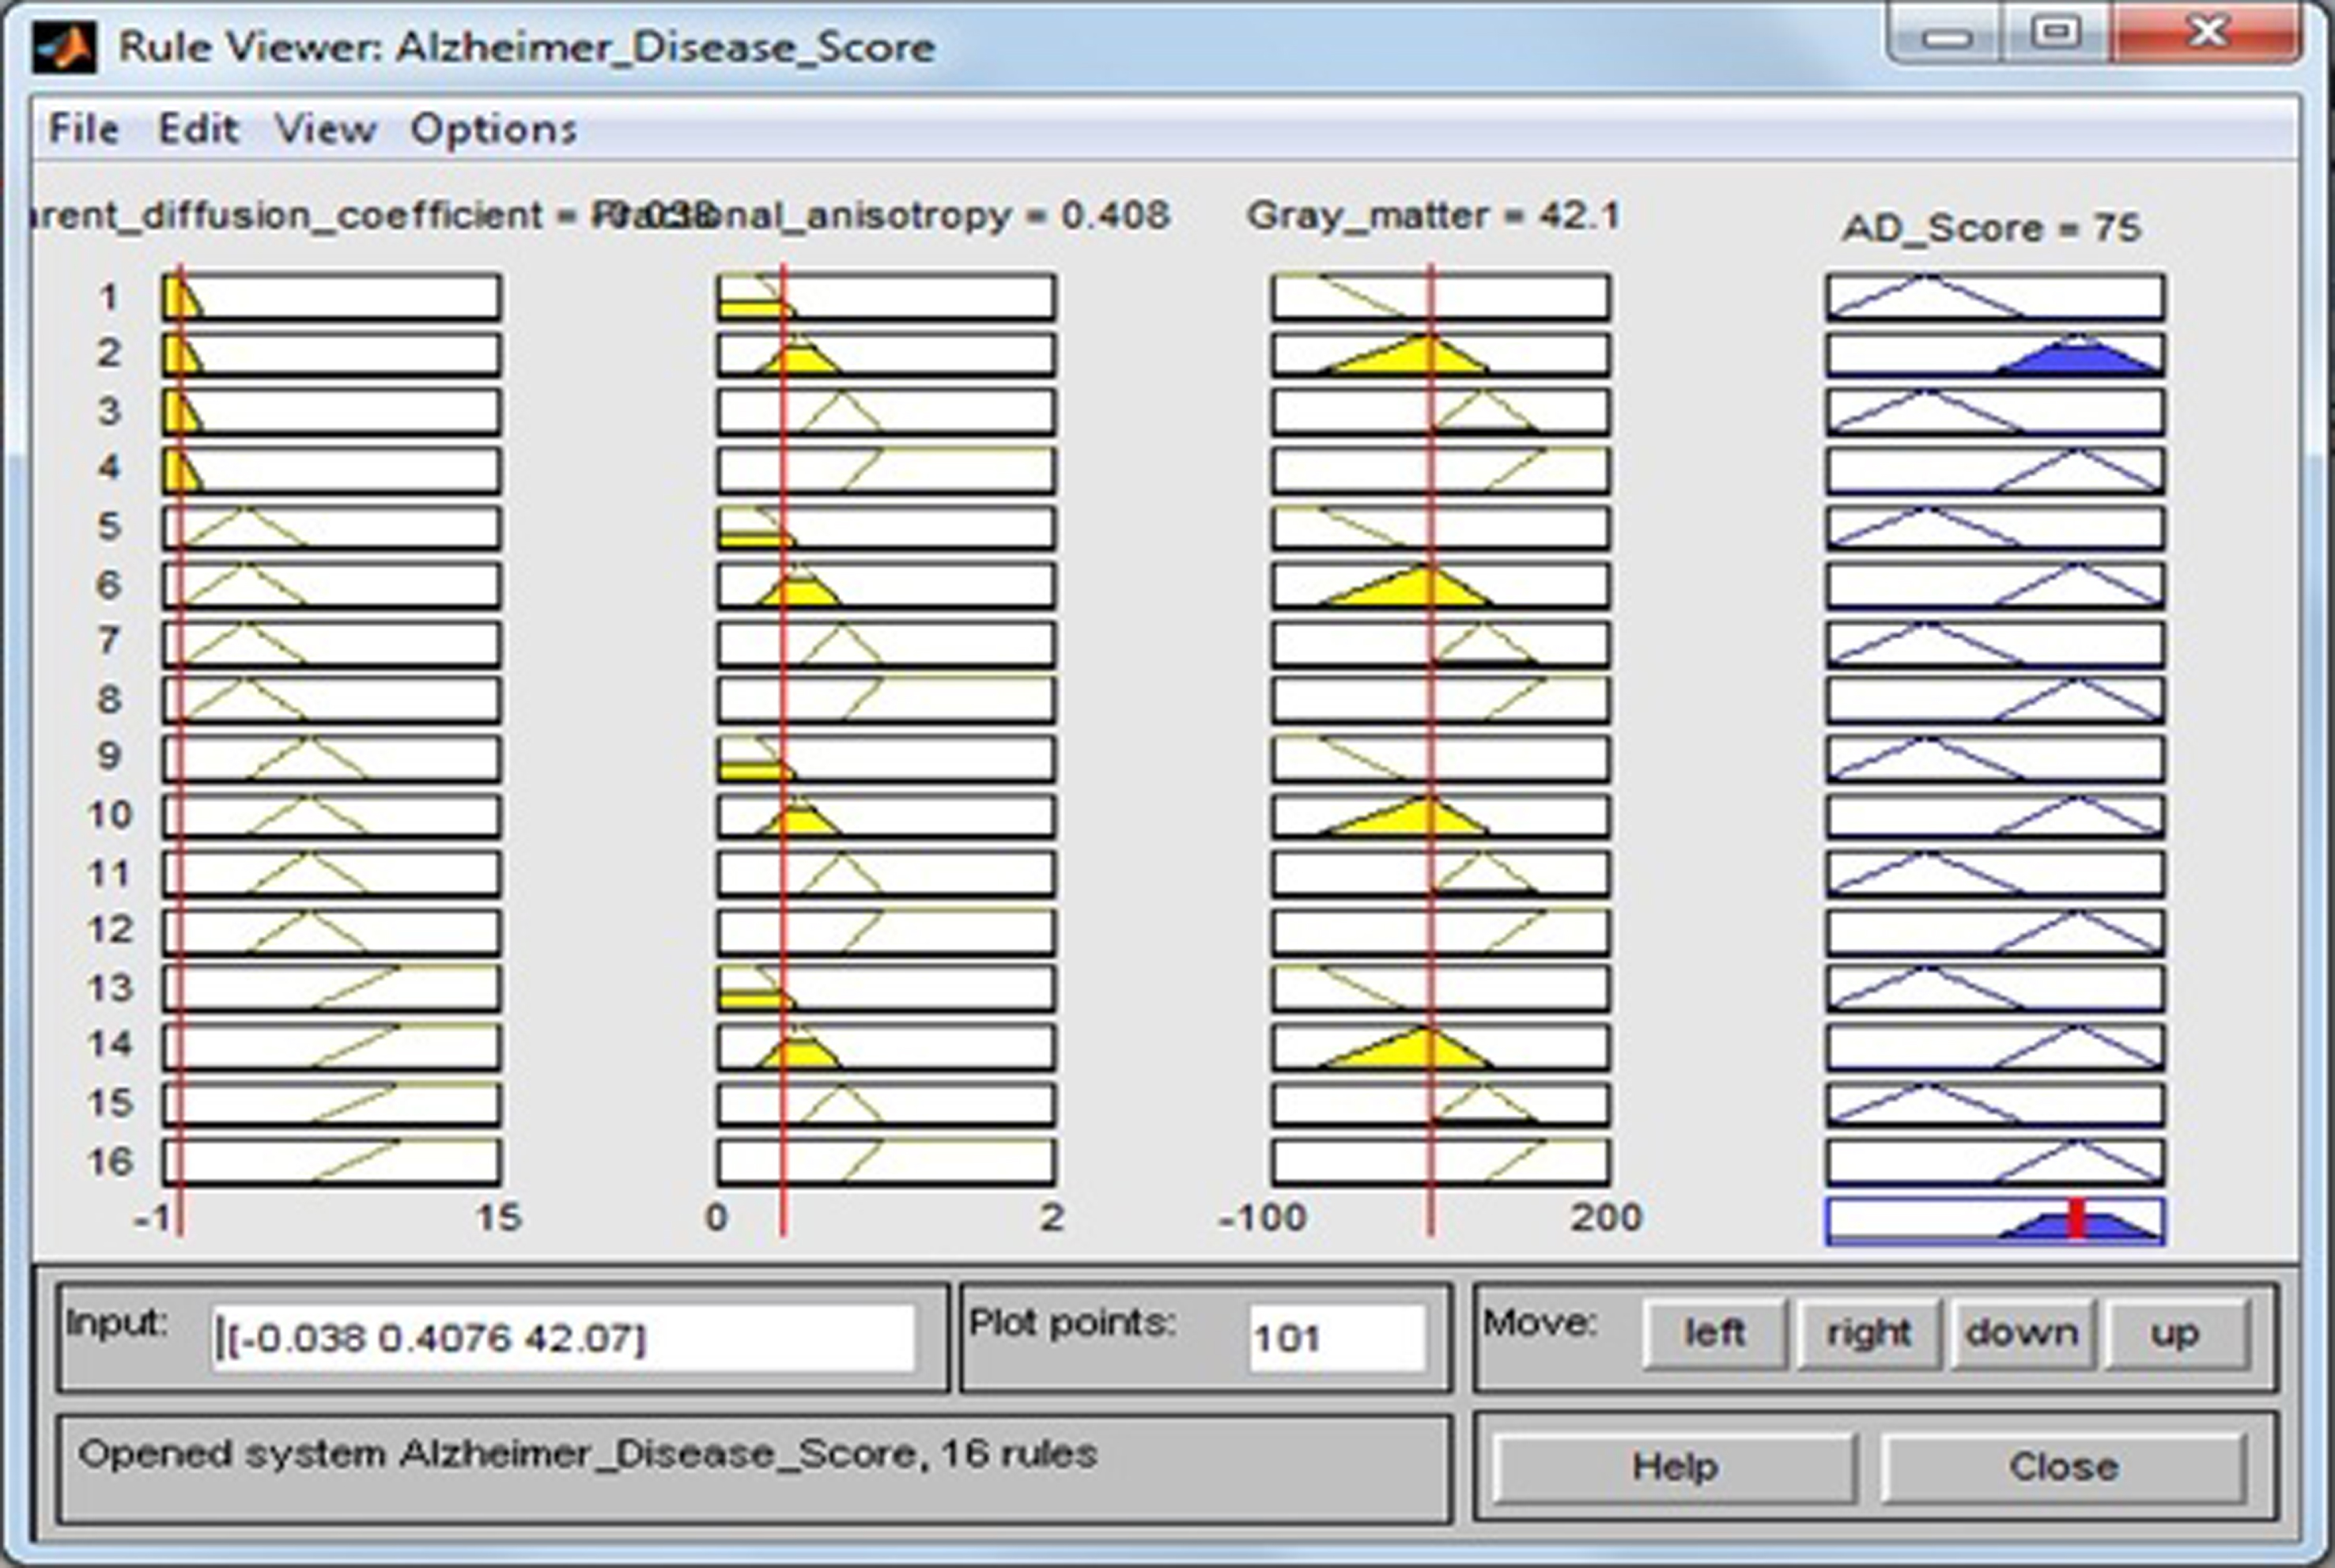
Fig.13
Surface viewer of apparent diffusion coefficient and fractional anisotropy.
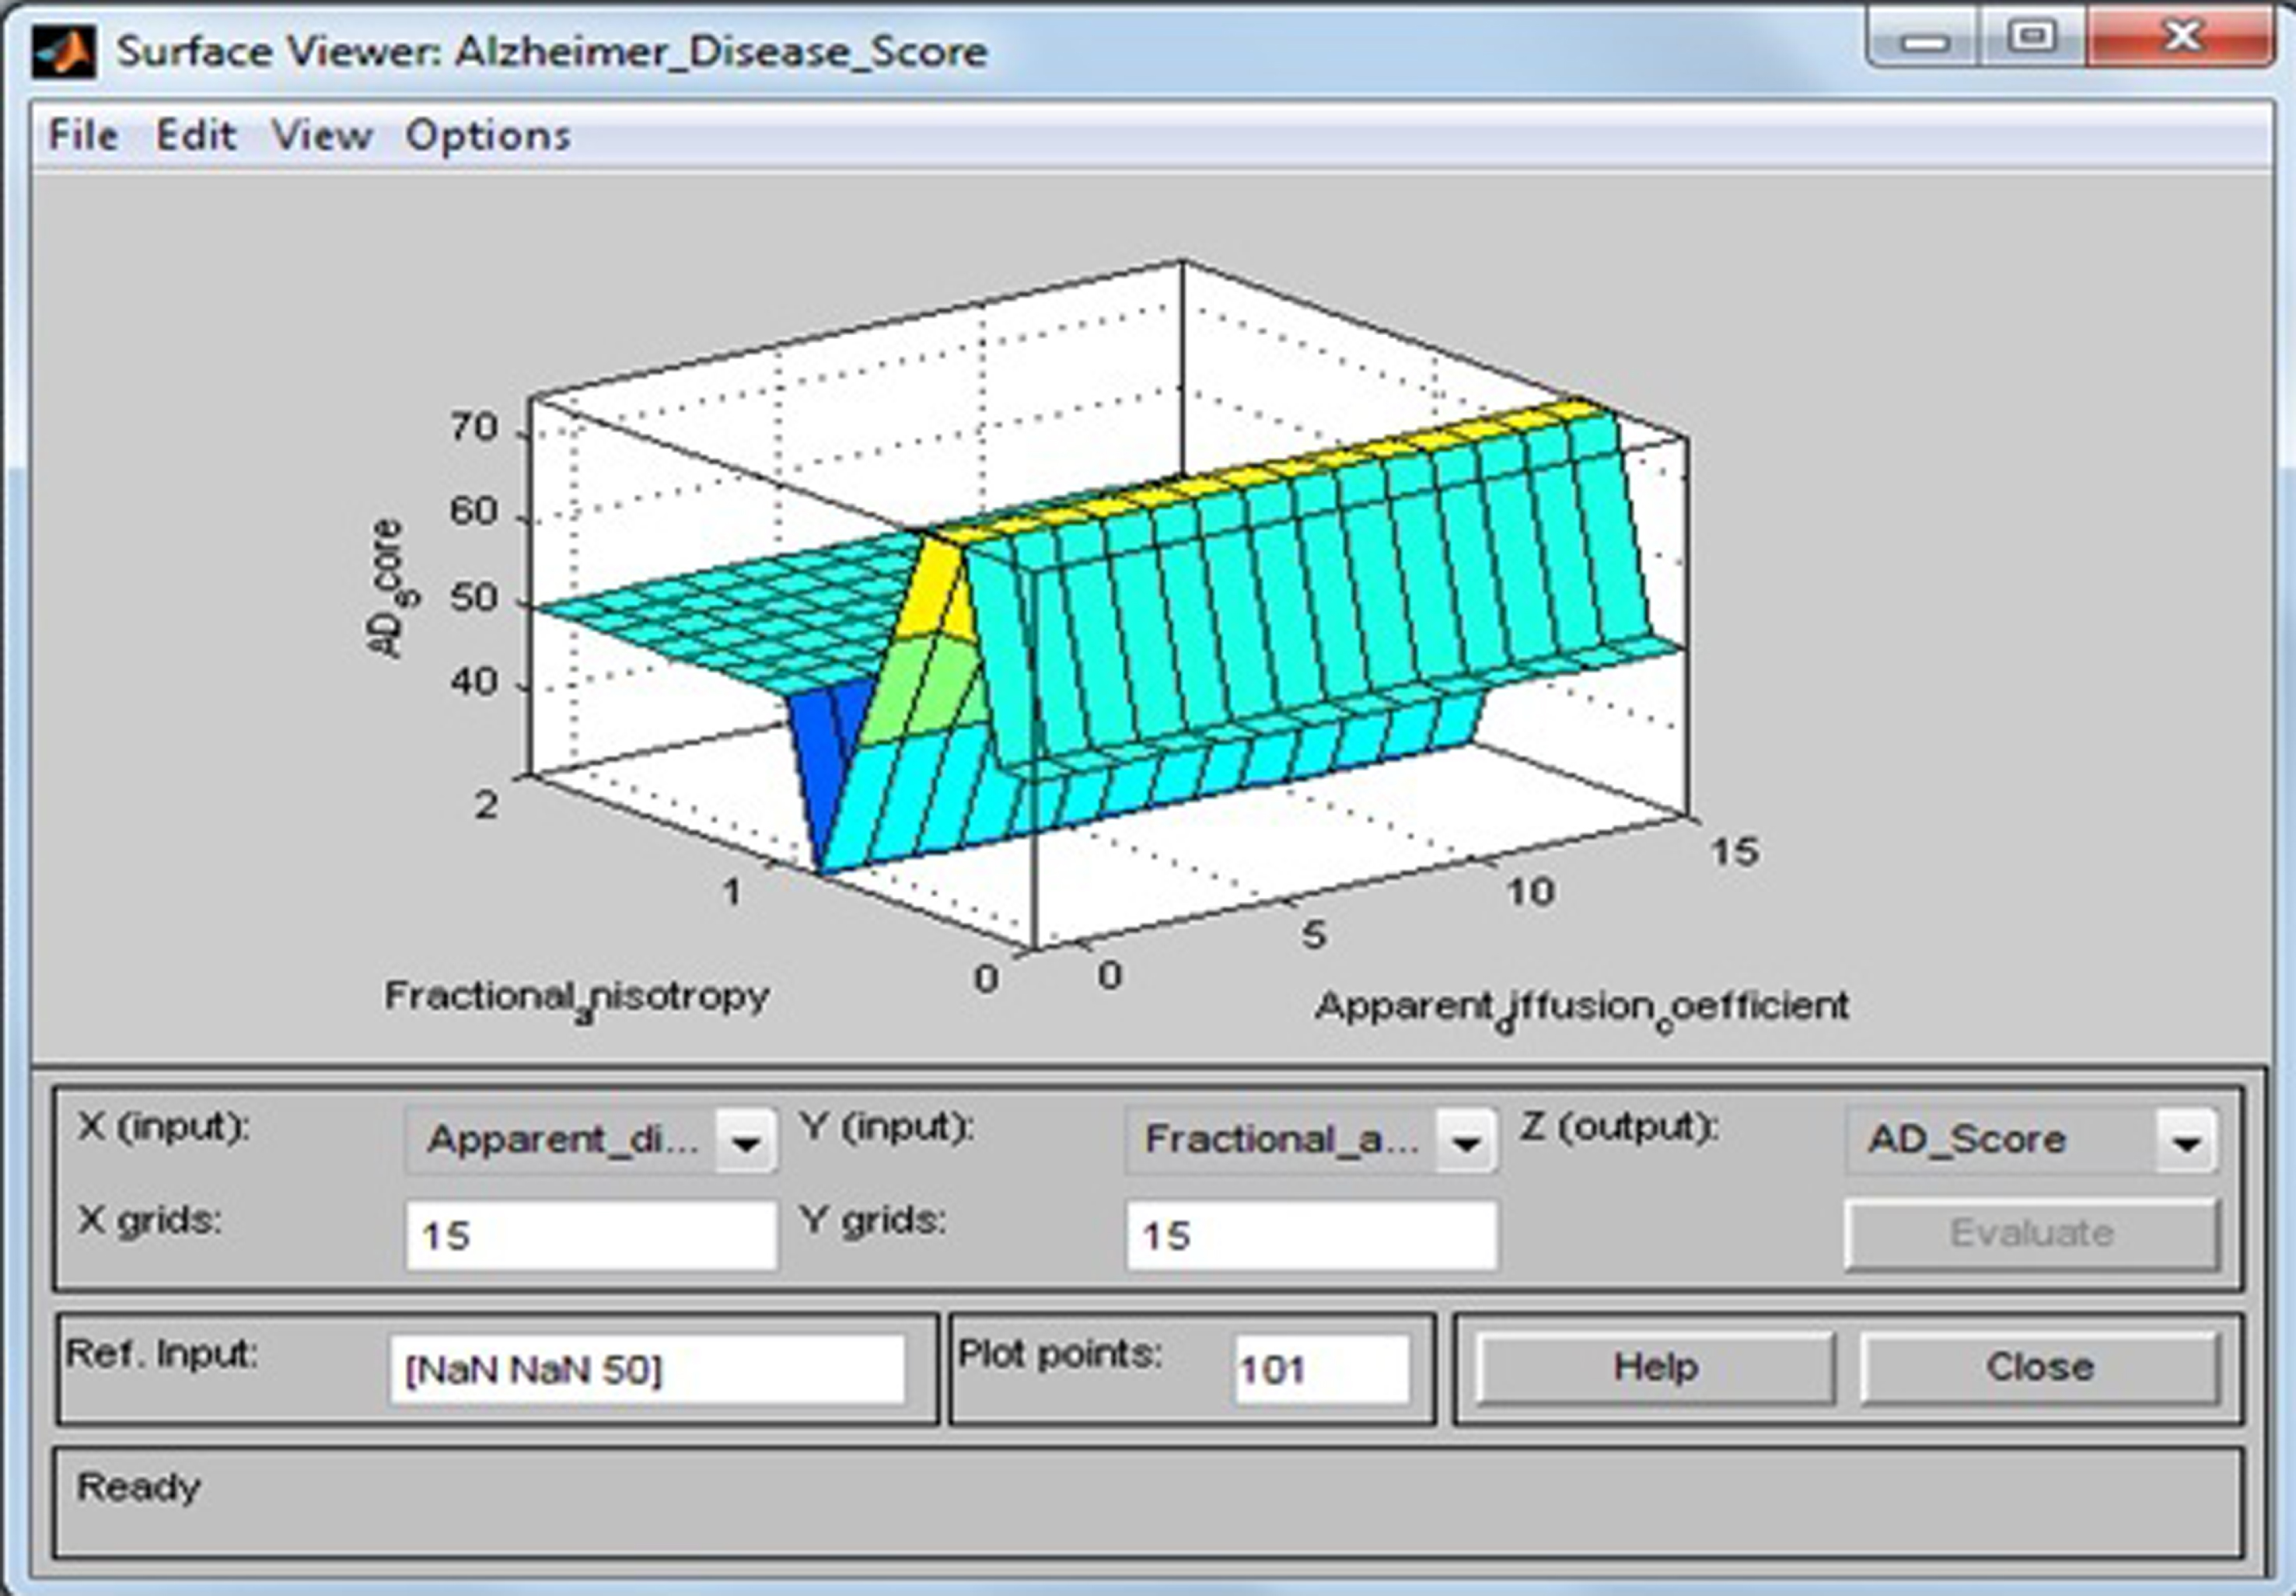
Fig.14
Surface viewer of apparent diffusion coefficient and gray matter.
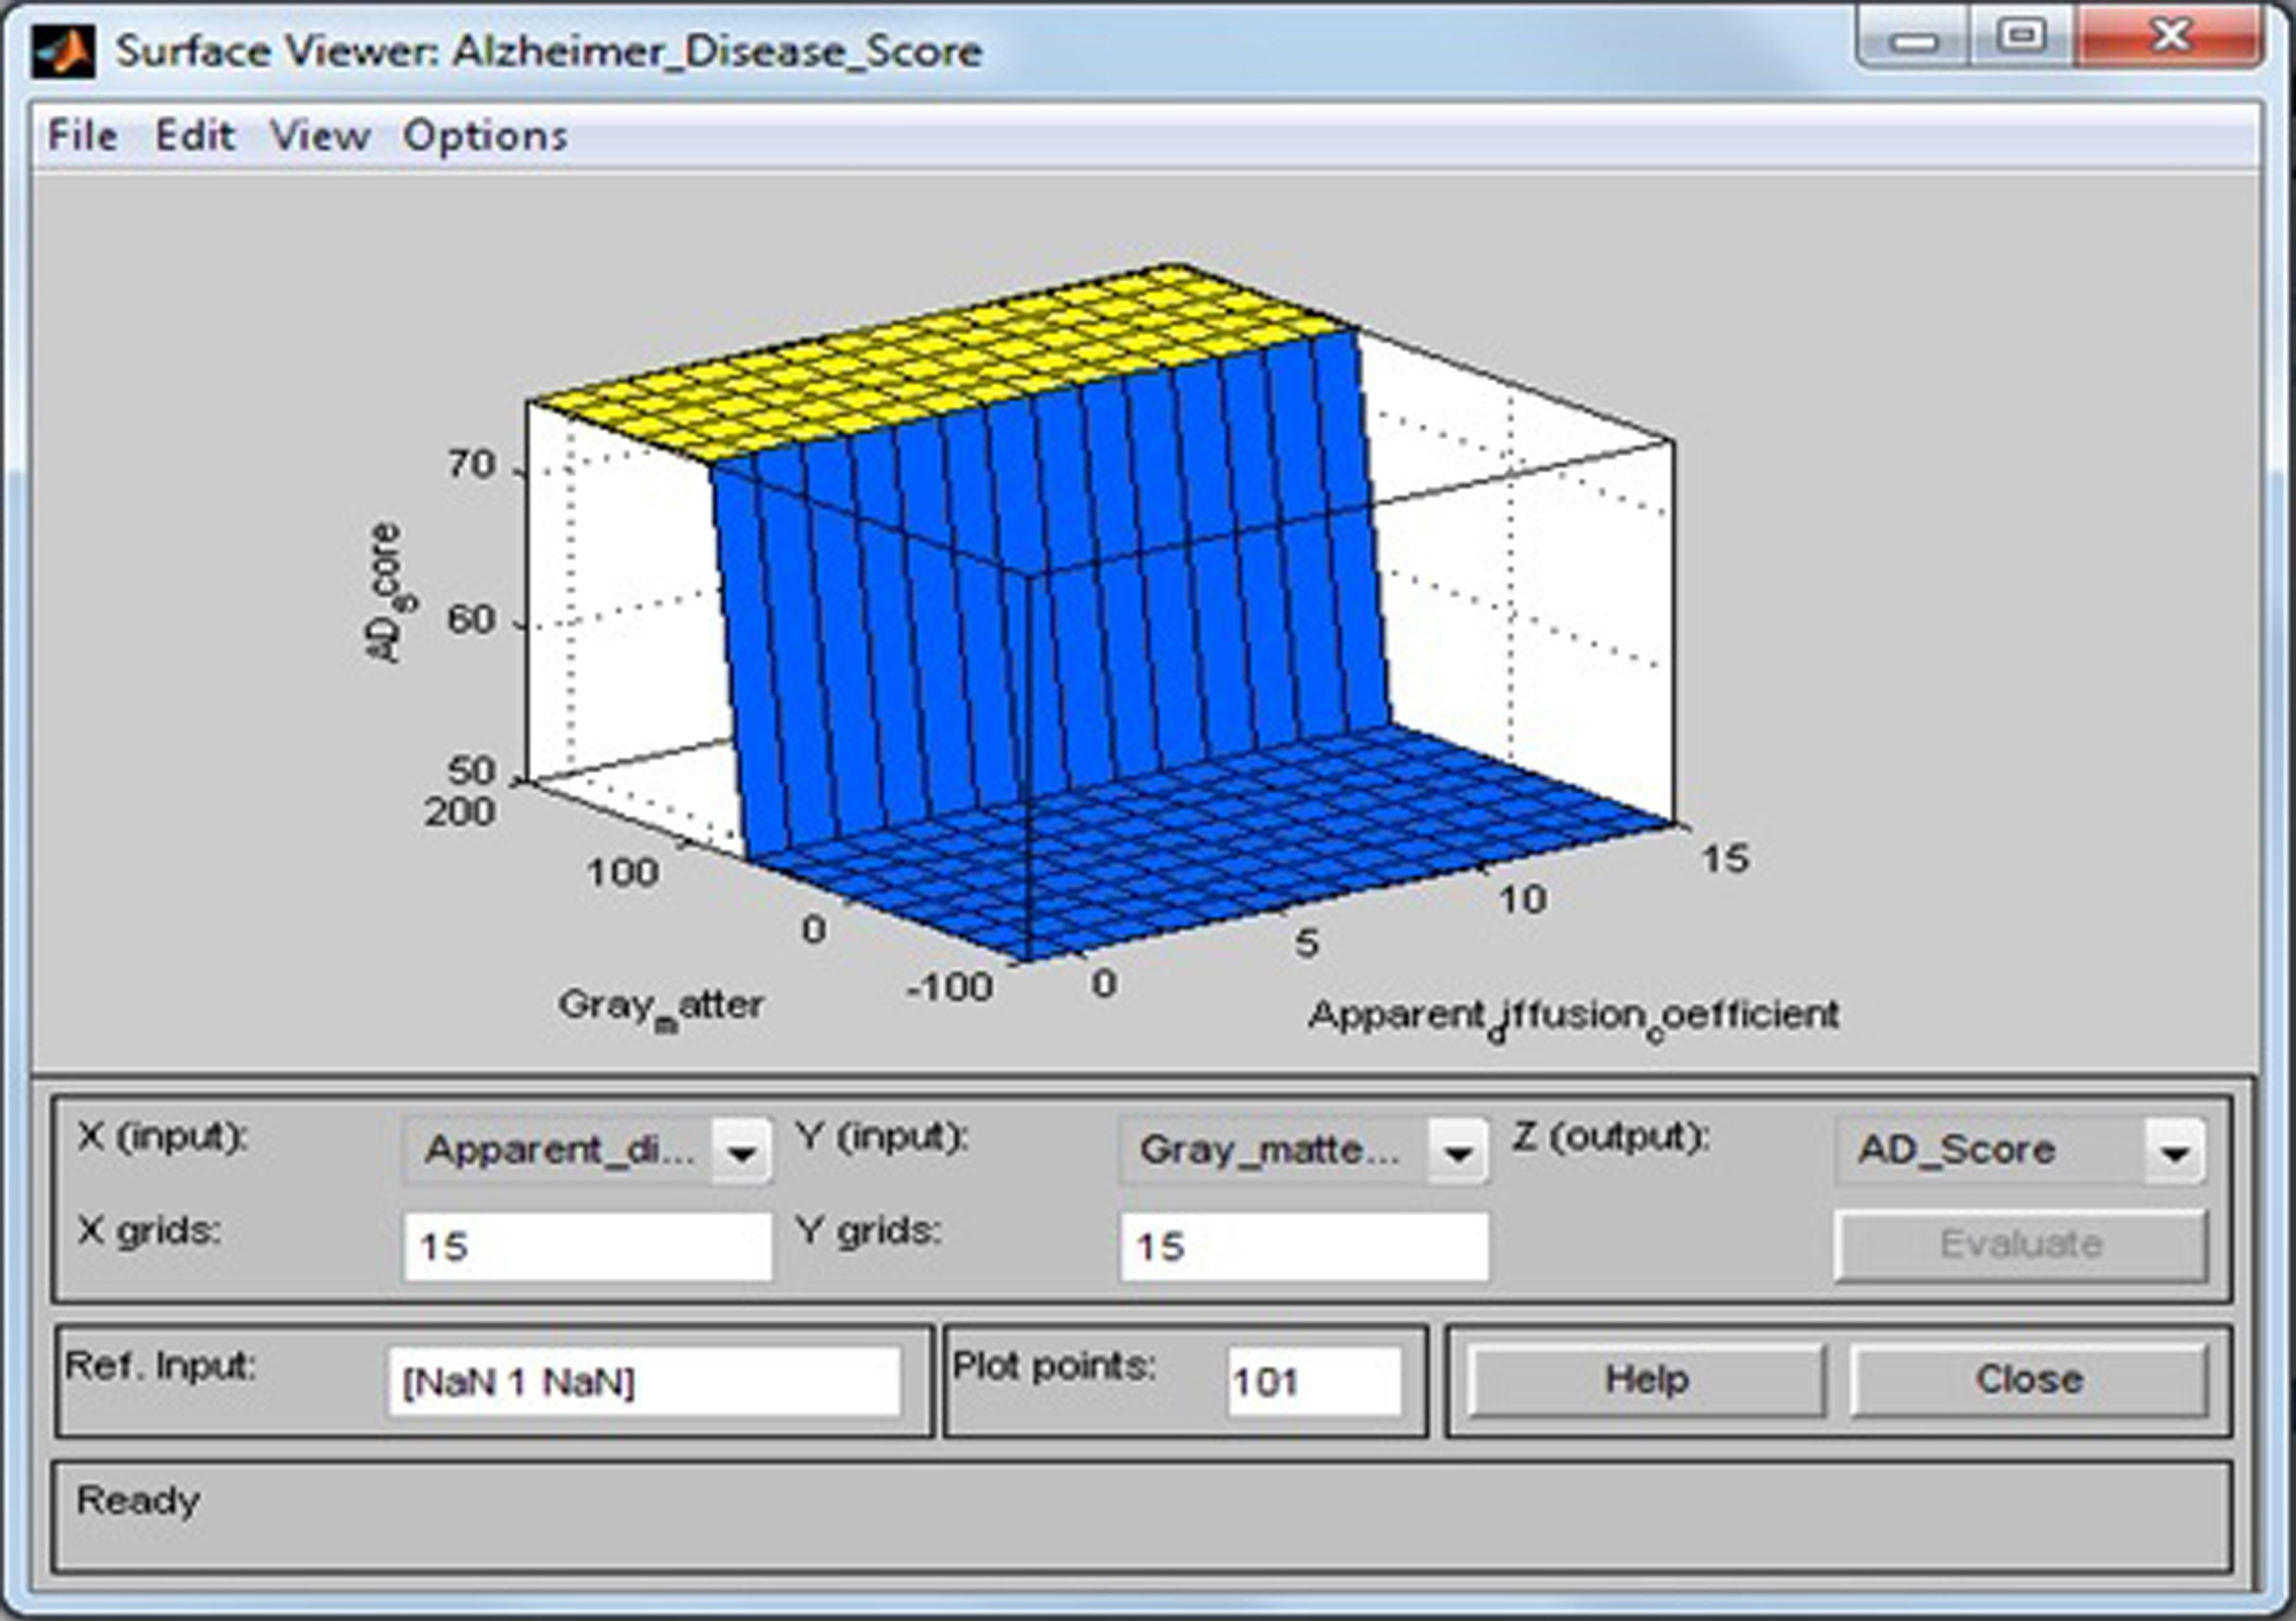
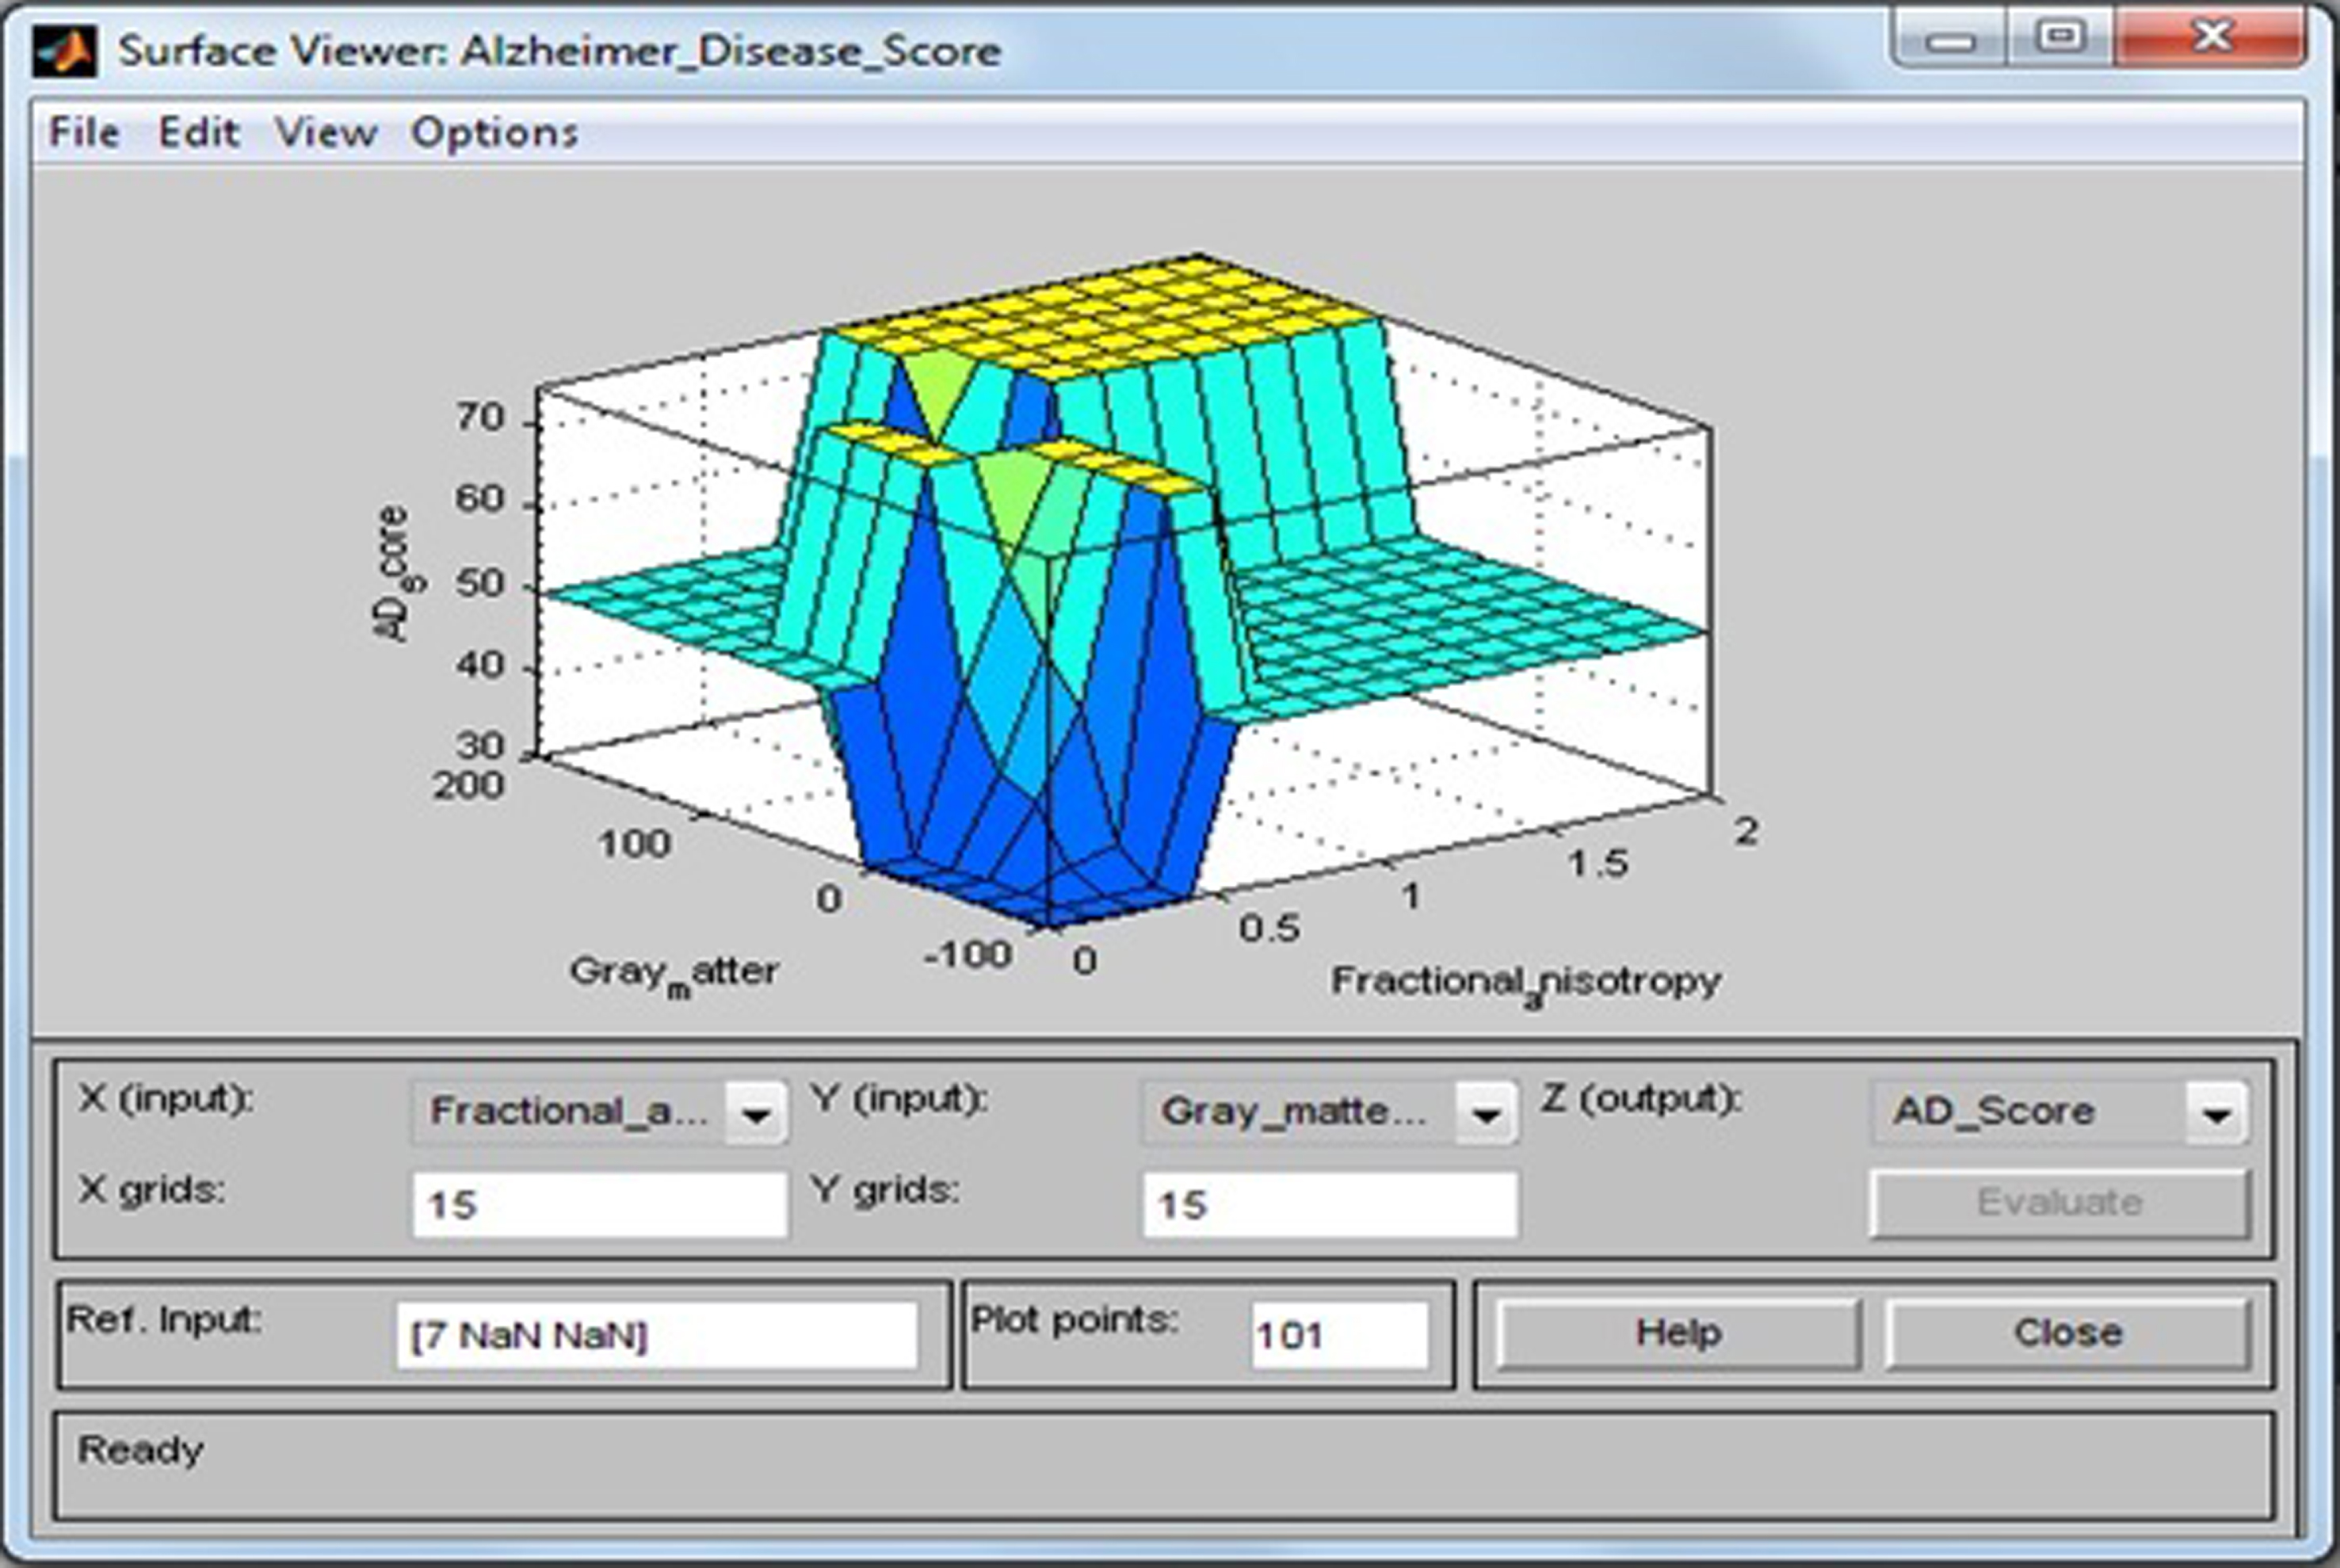
Fig.15
Surface viewer of fractional anisotropy and gray matter.
Defuzzification
In this stage, truth degrees (α) of the rules are determined for each rule by aid of the min and then by taking max between working rules. For examples, for case-I where ADC = 0.966, FA = 0.4688, and GM = 45.37, Rule 2 and Rule 6 will be fired and we will obtain: α 2 = min{Very Small (ADC), Low (FA), Small (GM)} = min{0.034, 0.8752, 0.9105} = 0.034 α 6 = min{Small (ADC), Low(FA), Small (GM)} = min{0.966, 0.8752, 0.9105} = 0.8752. From Mamdani max-min inference, we will obtain the membership function of our system as max(α 2,α 6) = max(0.034, 0.8752) = 0.8752 that means Very High AD score. For case-II where ADC = 1.97, FA = 0.53, and GM = 48.67, Rule 6 and Rule 10 will be fired and we will obtain: α 6 = min{Small (ADC), Low (FA), Small (GM)} = min{1.97, 0.88, 0.8555} = 0.8555,α 10 = min{Medium (ADC), Low (FA), Small (GM)} = min{0, 0.88, 0.8555} = 0. From Mamdani max-min inference, we will obtain the membership function of our system as max(α 6,α 10) = max(0.8555,0) = 0.8555, that means Very High AD score. Then for both cases, we can calculate the crisp outputs. The crisp values of the AD score are calculated by the method center of gravity defuzzifier by the formula
RESULTS
Study population
For screening, we used here a 20 sample dataset of patients with ADC, FA, and GM as input variables from the literature, and risk status as output variables were evaluated using fuzzy rules to classify them as either AD or healthy control (shown in Table 9).
Neuro-fuzzy classifier and back-propagation learning algorithm
A neuro-fuzzy classifier is used to diagnose the AD patients at an early stage. The ANN is a network that interconnect all nodes. The input of a specific node is the weighted sum of the output of all the nodes to which it is connected. The output value of a node is a non-linear function, which is known as ‘transfer function’ or it is called ‘sigmoid function’
Design and architecture of neuro-fuzzy system
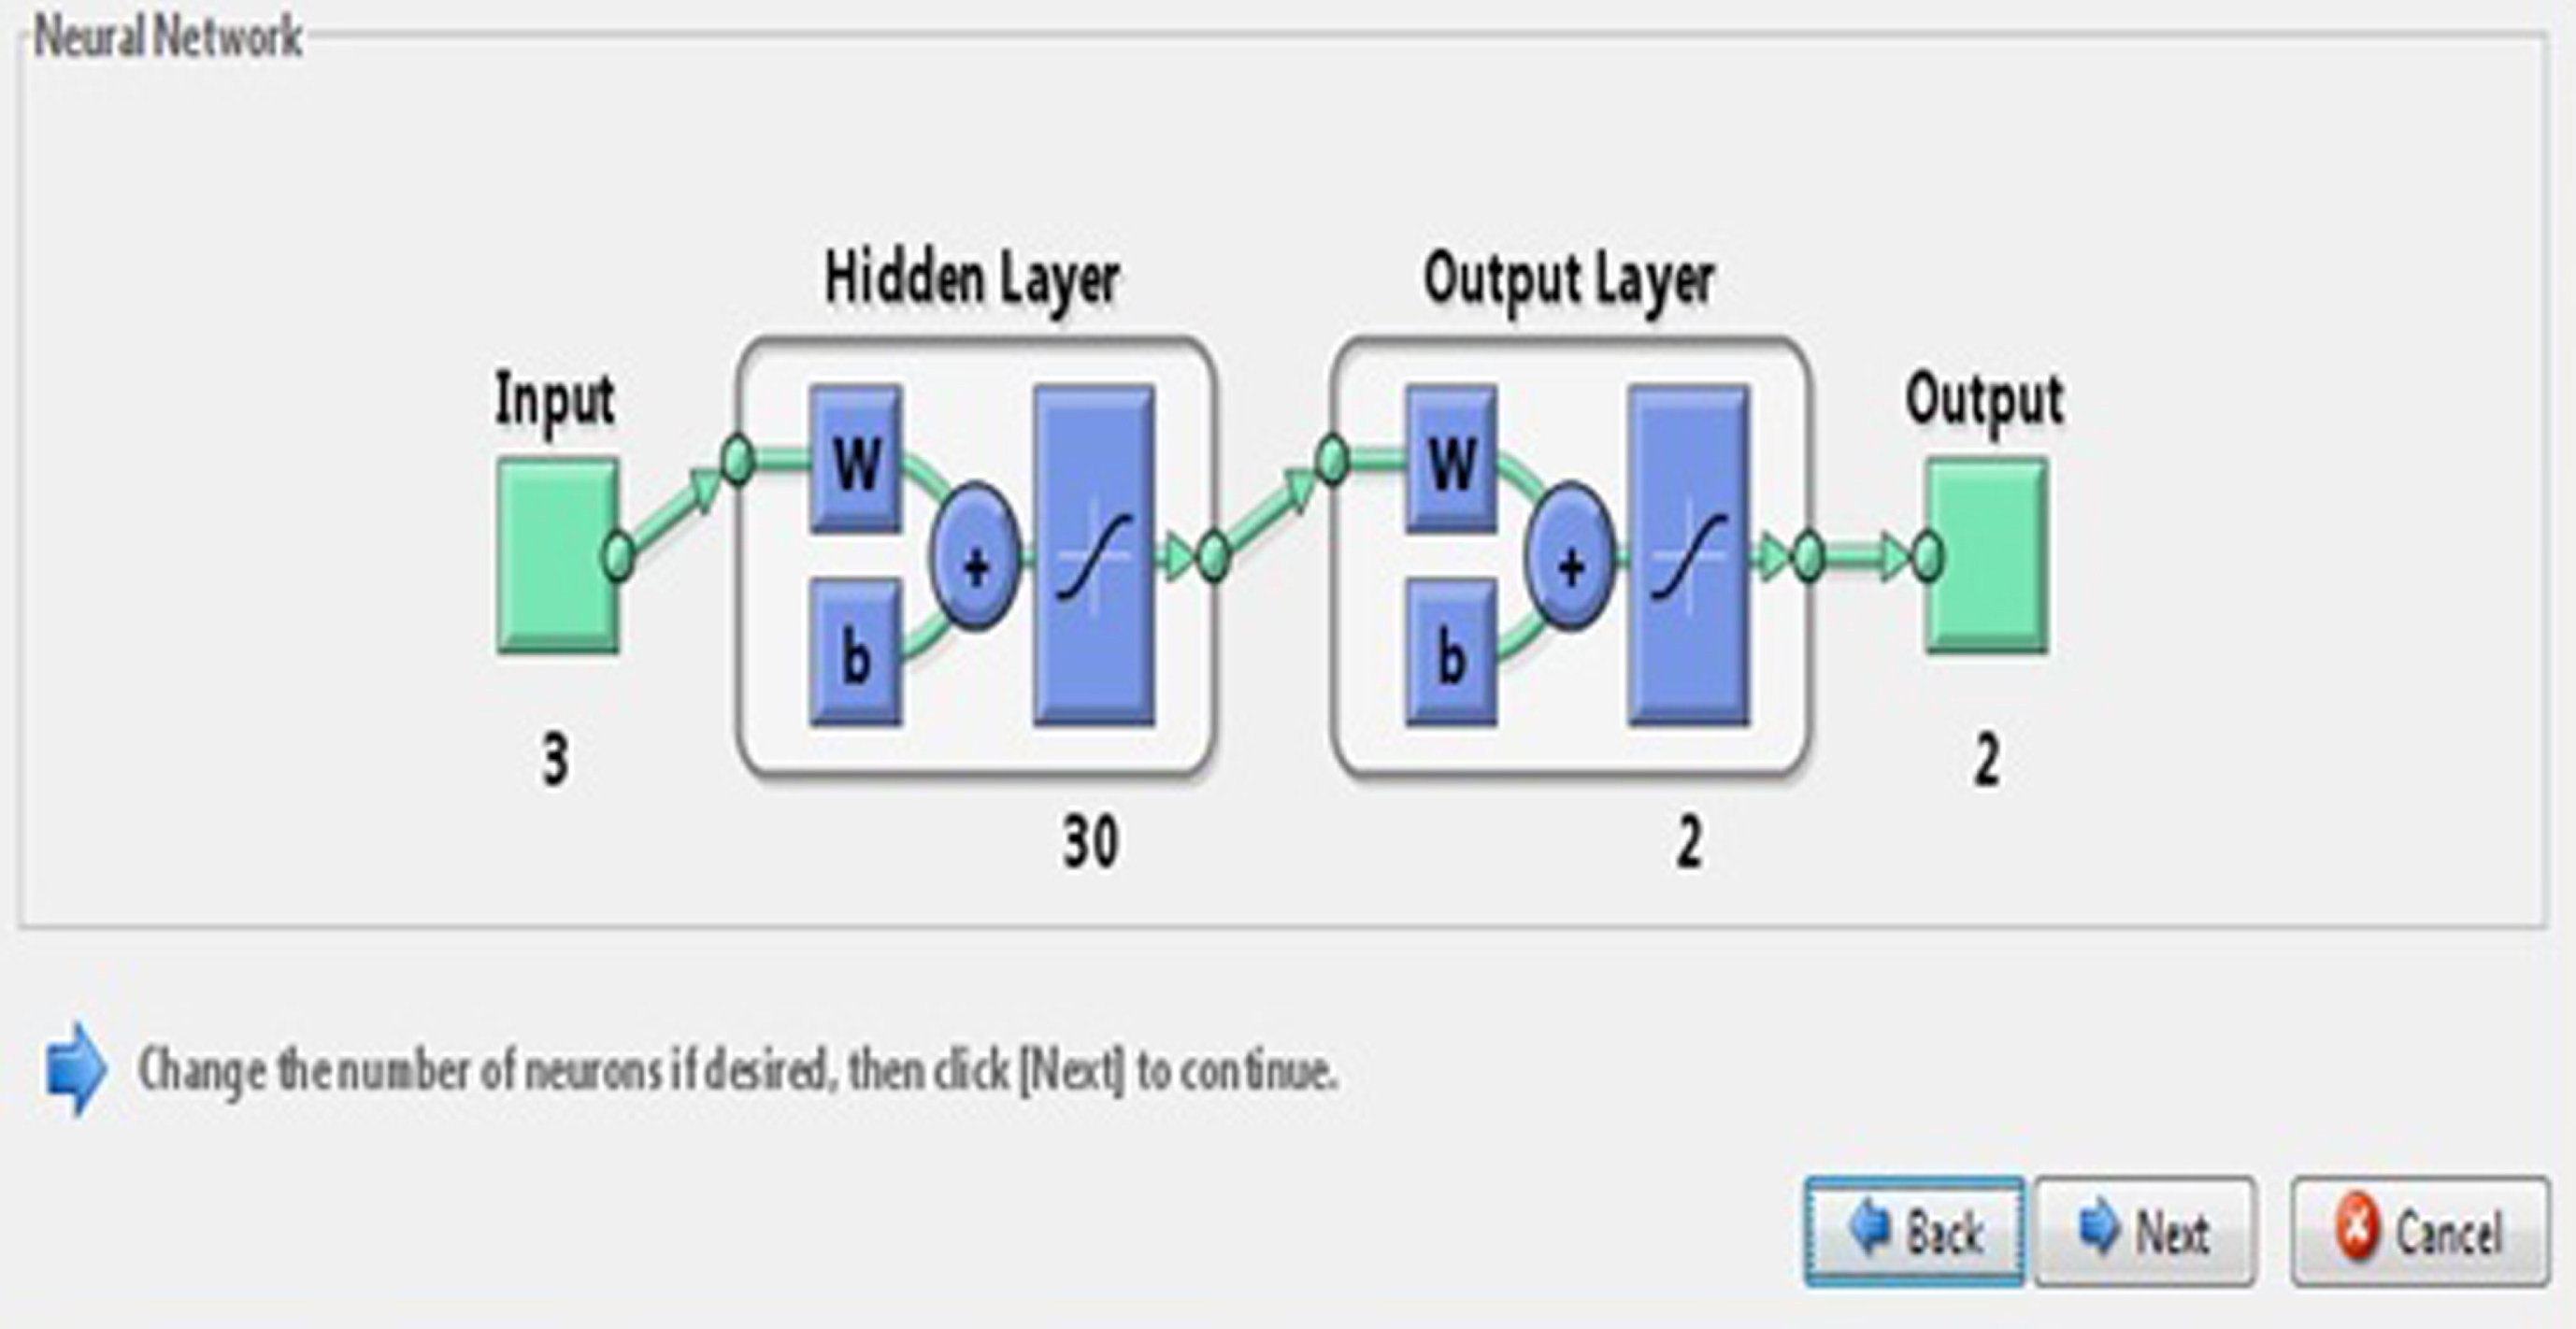
In this paper, we developed a FIS where input variables like ADC, FA, and GM are three clinical features obtained from patients fed into the network using fuzzy toolbox. We used NN toolbox from Matlab 2009 to evaluate the performance of the proposed networks where a three layer (one input, one hidden, and one output) feed forward network with three inputs and sigmoid hidden neurons and linear output neurons is suggested. The proposed NN is simulated with a set of 30 numbers of hidden neurons and the network is evaluated with a learning function LM in Fig. 16, which shows a model of the NN with 30 hidden neurons.
Fig.16
Neural network model.
Measures for performance
There are three performance measure, accuracy (AC), sensitivity (SE), and specificity (SP), which are used to evaluate the performance of the neuro-fuzzy classifier. These measures are calculated from the confusion matrix. SE and SP are the proportion of positive and negative cases that are well detected by the test. Classification AC depends on the number of samples correctly classified and they are defined as:
where TP is the number of true positive, FP is the number of false positive, TN is the number of true negative, and FN is the number of false negative. The confusion matrix is given in Table 9.
Experimental results
The experimental results show that the NN based on three extracted features of brain (ADC, FA, and GM) give a 100% classification rate. The confusion matrix of the clinical data is presented in Table 10. The confusion matrix of the predictive model of AD is shown in Table 11. The performance measures are calculated for the above clinical data of 20 patients from the NN that are shown in Figs. 17–19. The proposed network was trained and fed into the ANN with 3 input neurons, one hidden layer of 30 neurons, and 2 output neurons. Out of the 20 sample database, 14 for training, 3 for validation, and 3 for testing were used in the ANN classification system. In Table 9, the confusion matrix of the clinical data sets obtained the number of output of data sets of true positive (TP), false positive (FP), true negative (TN), and false negative (FN) as 9, 0, 11, and 0, respectively. The sensitivity, specificity, and accuracy are equal to 100% each. The NN is trained with a training algorithm and the performance of the training algorithm is obtained by executing an FES. The result shows that the LM training algorithm gives a satisfactory performance with 100% accuracy.
Table 10
Confusion matrix of clinical data sets
| Actual | Predicted | |
| Alzheimer’s desease (Positive) | Healthy control (Negative) | |
| Alzheimer’s disease (Positive) | 9 (TP) | 0 (FP) |
| Healthy control (Negative) | 0 (FN) | 11 (TN) |
Table 11
Confusion matrix of predictive model of Alzheimer’s disease
| Predictive model | Partition set | Alzheimer’s disease (Nr1) | Healthy control (Nr2) | Total no. (N) | Accuracy (%) | Sensitivity (%) | Specificity (%) |
| ANN | Training set | 08 | 06 | 14 | 100 | 100 | 100 |
| Validation set | 01 | 02 | 03 | 100 | 100 | 100 | |
| Testing set | 0 | 03 | 03 | 100 | 100 | 100 |
Fig.17
Results from neural network.
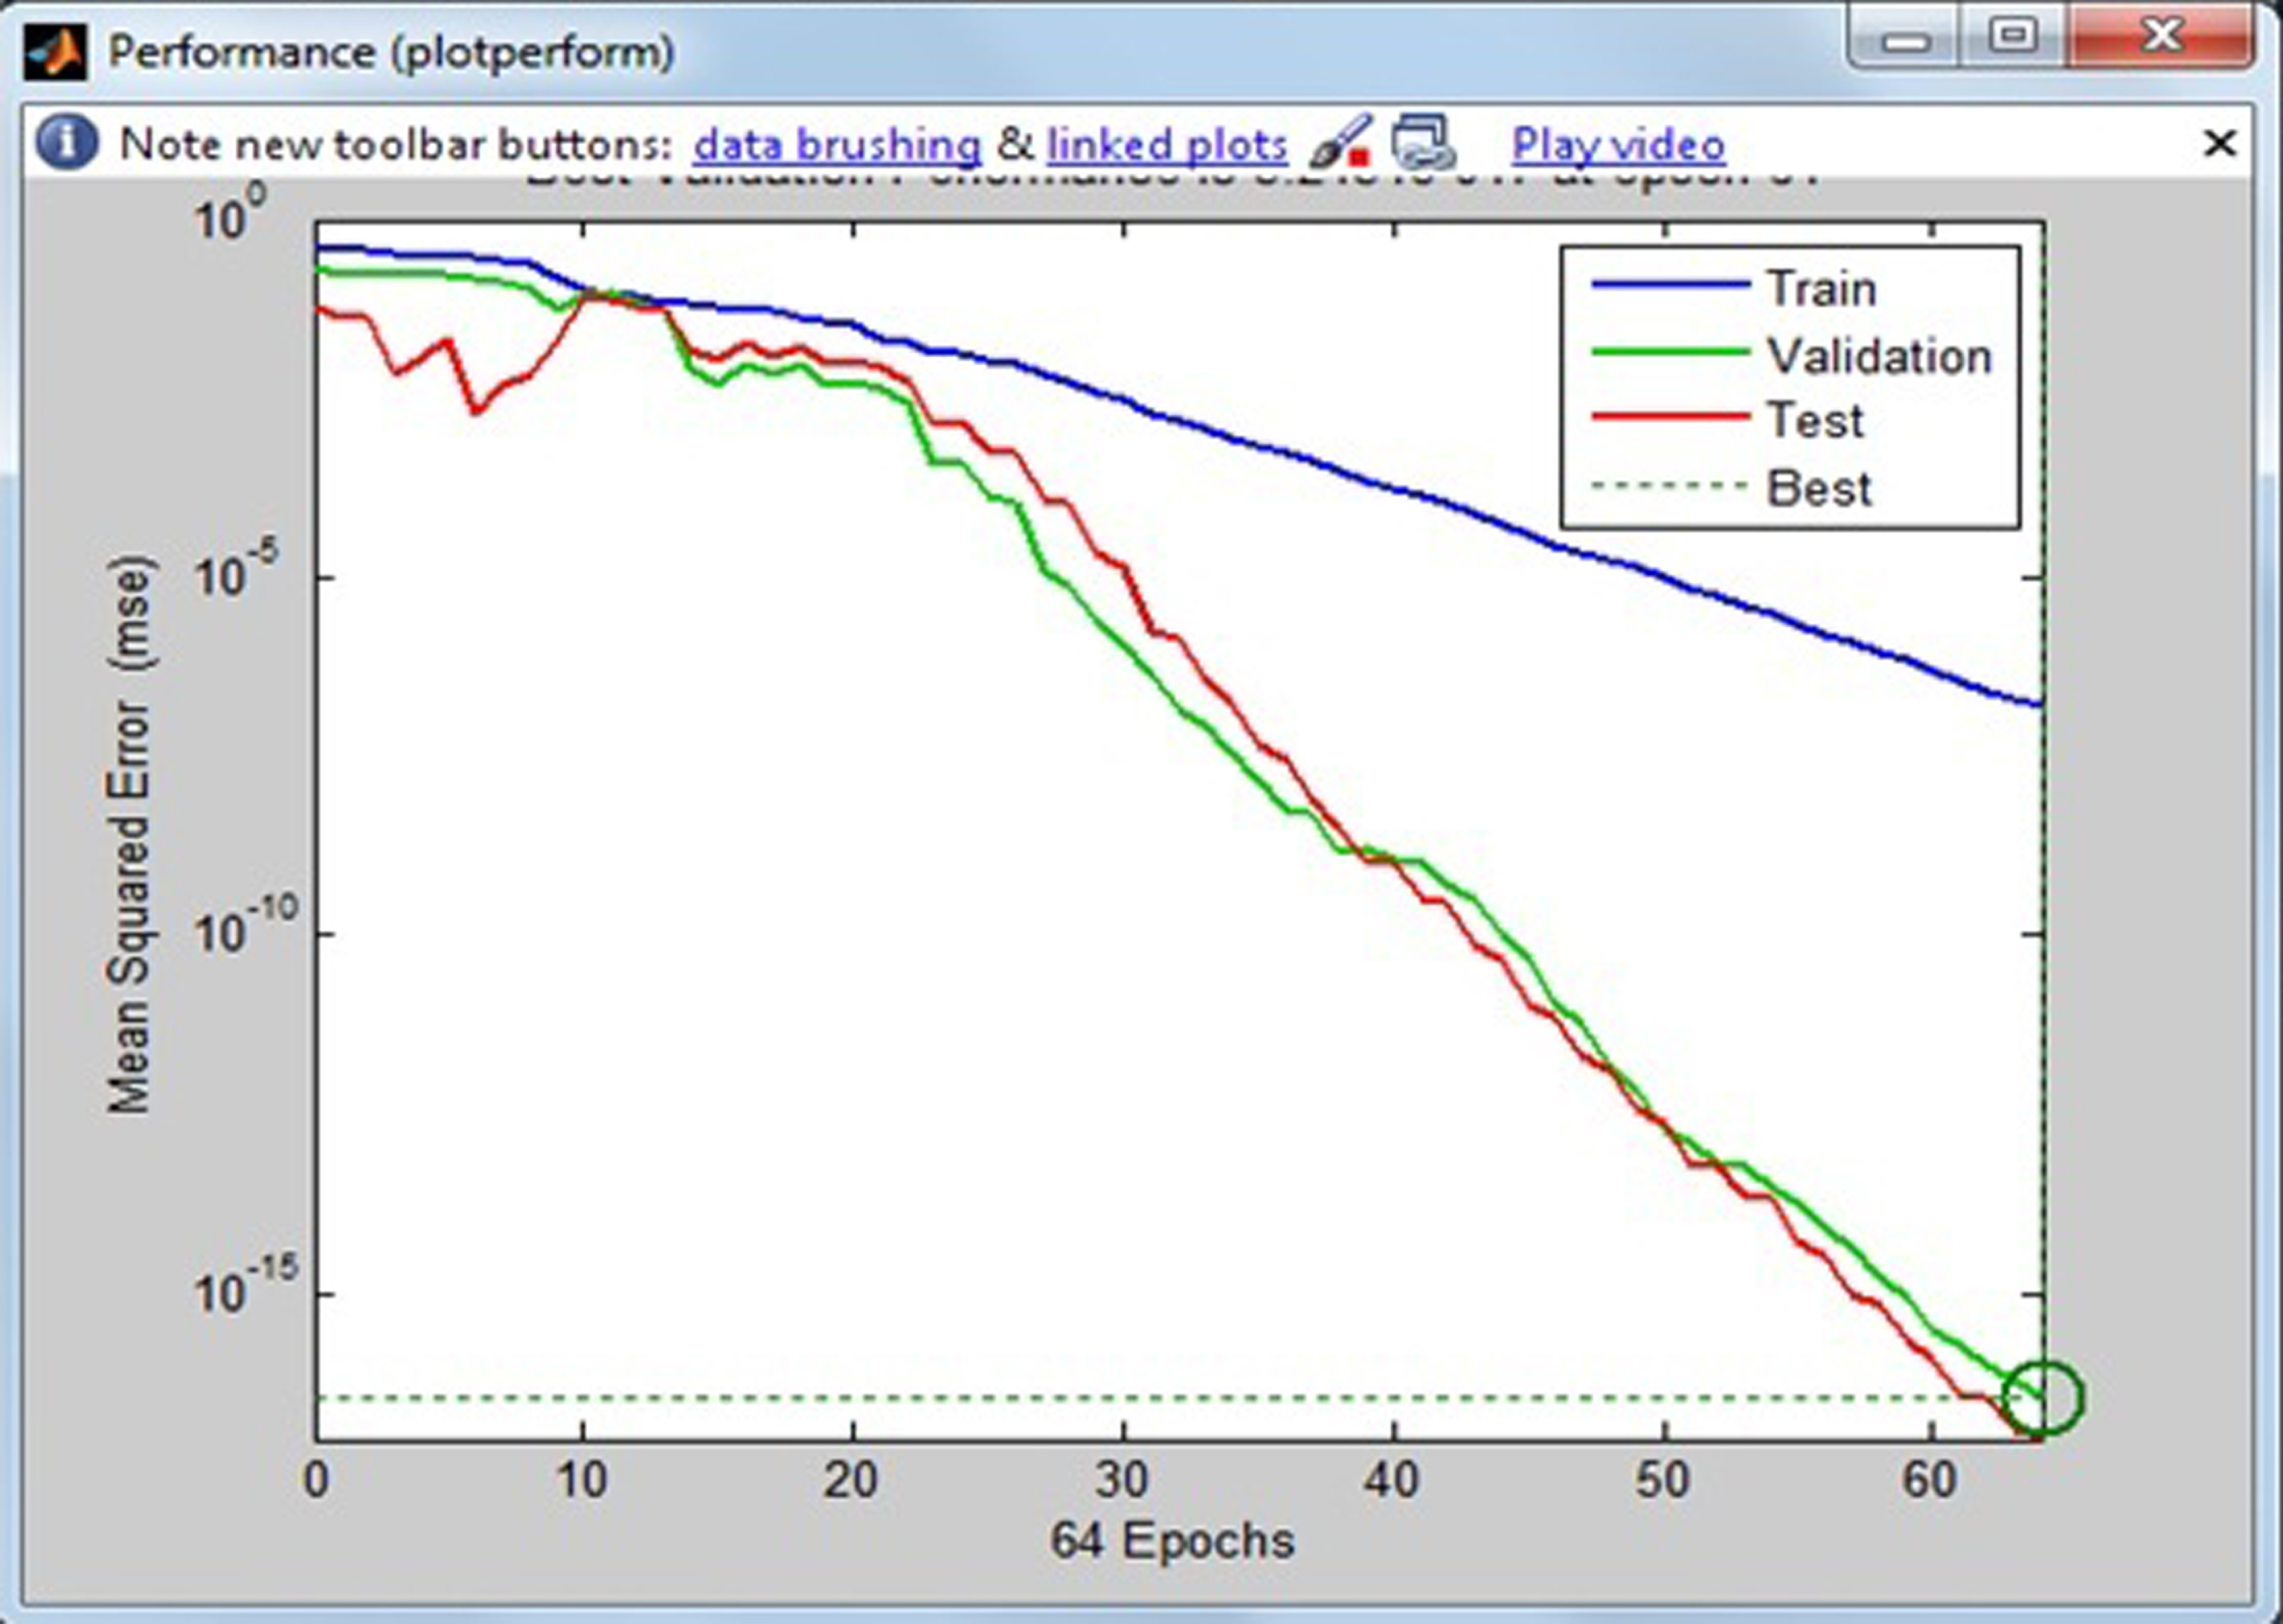
Fig.18
Confusion matrix of the neural network.
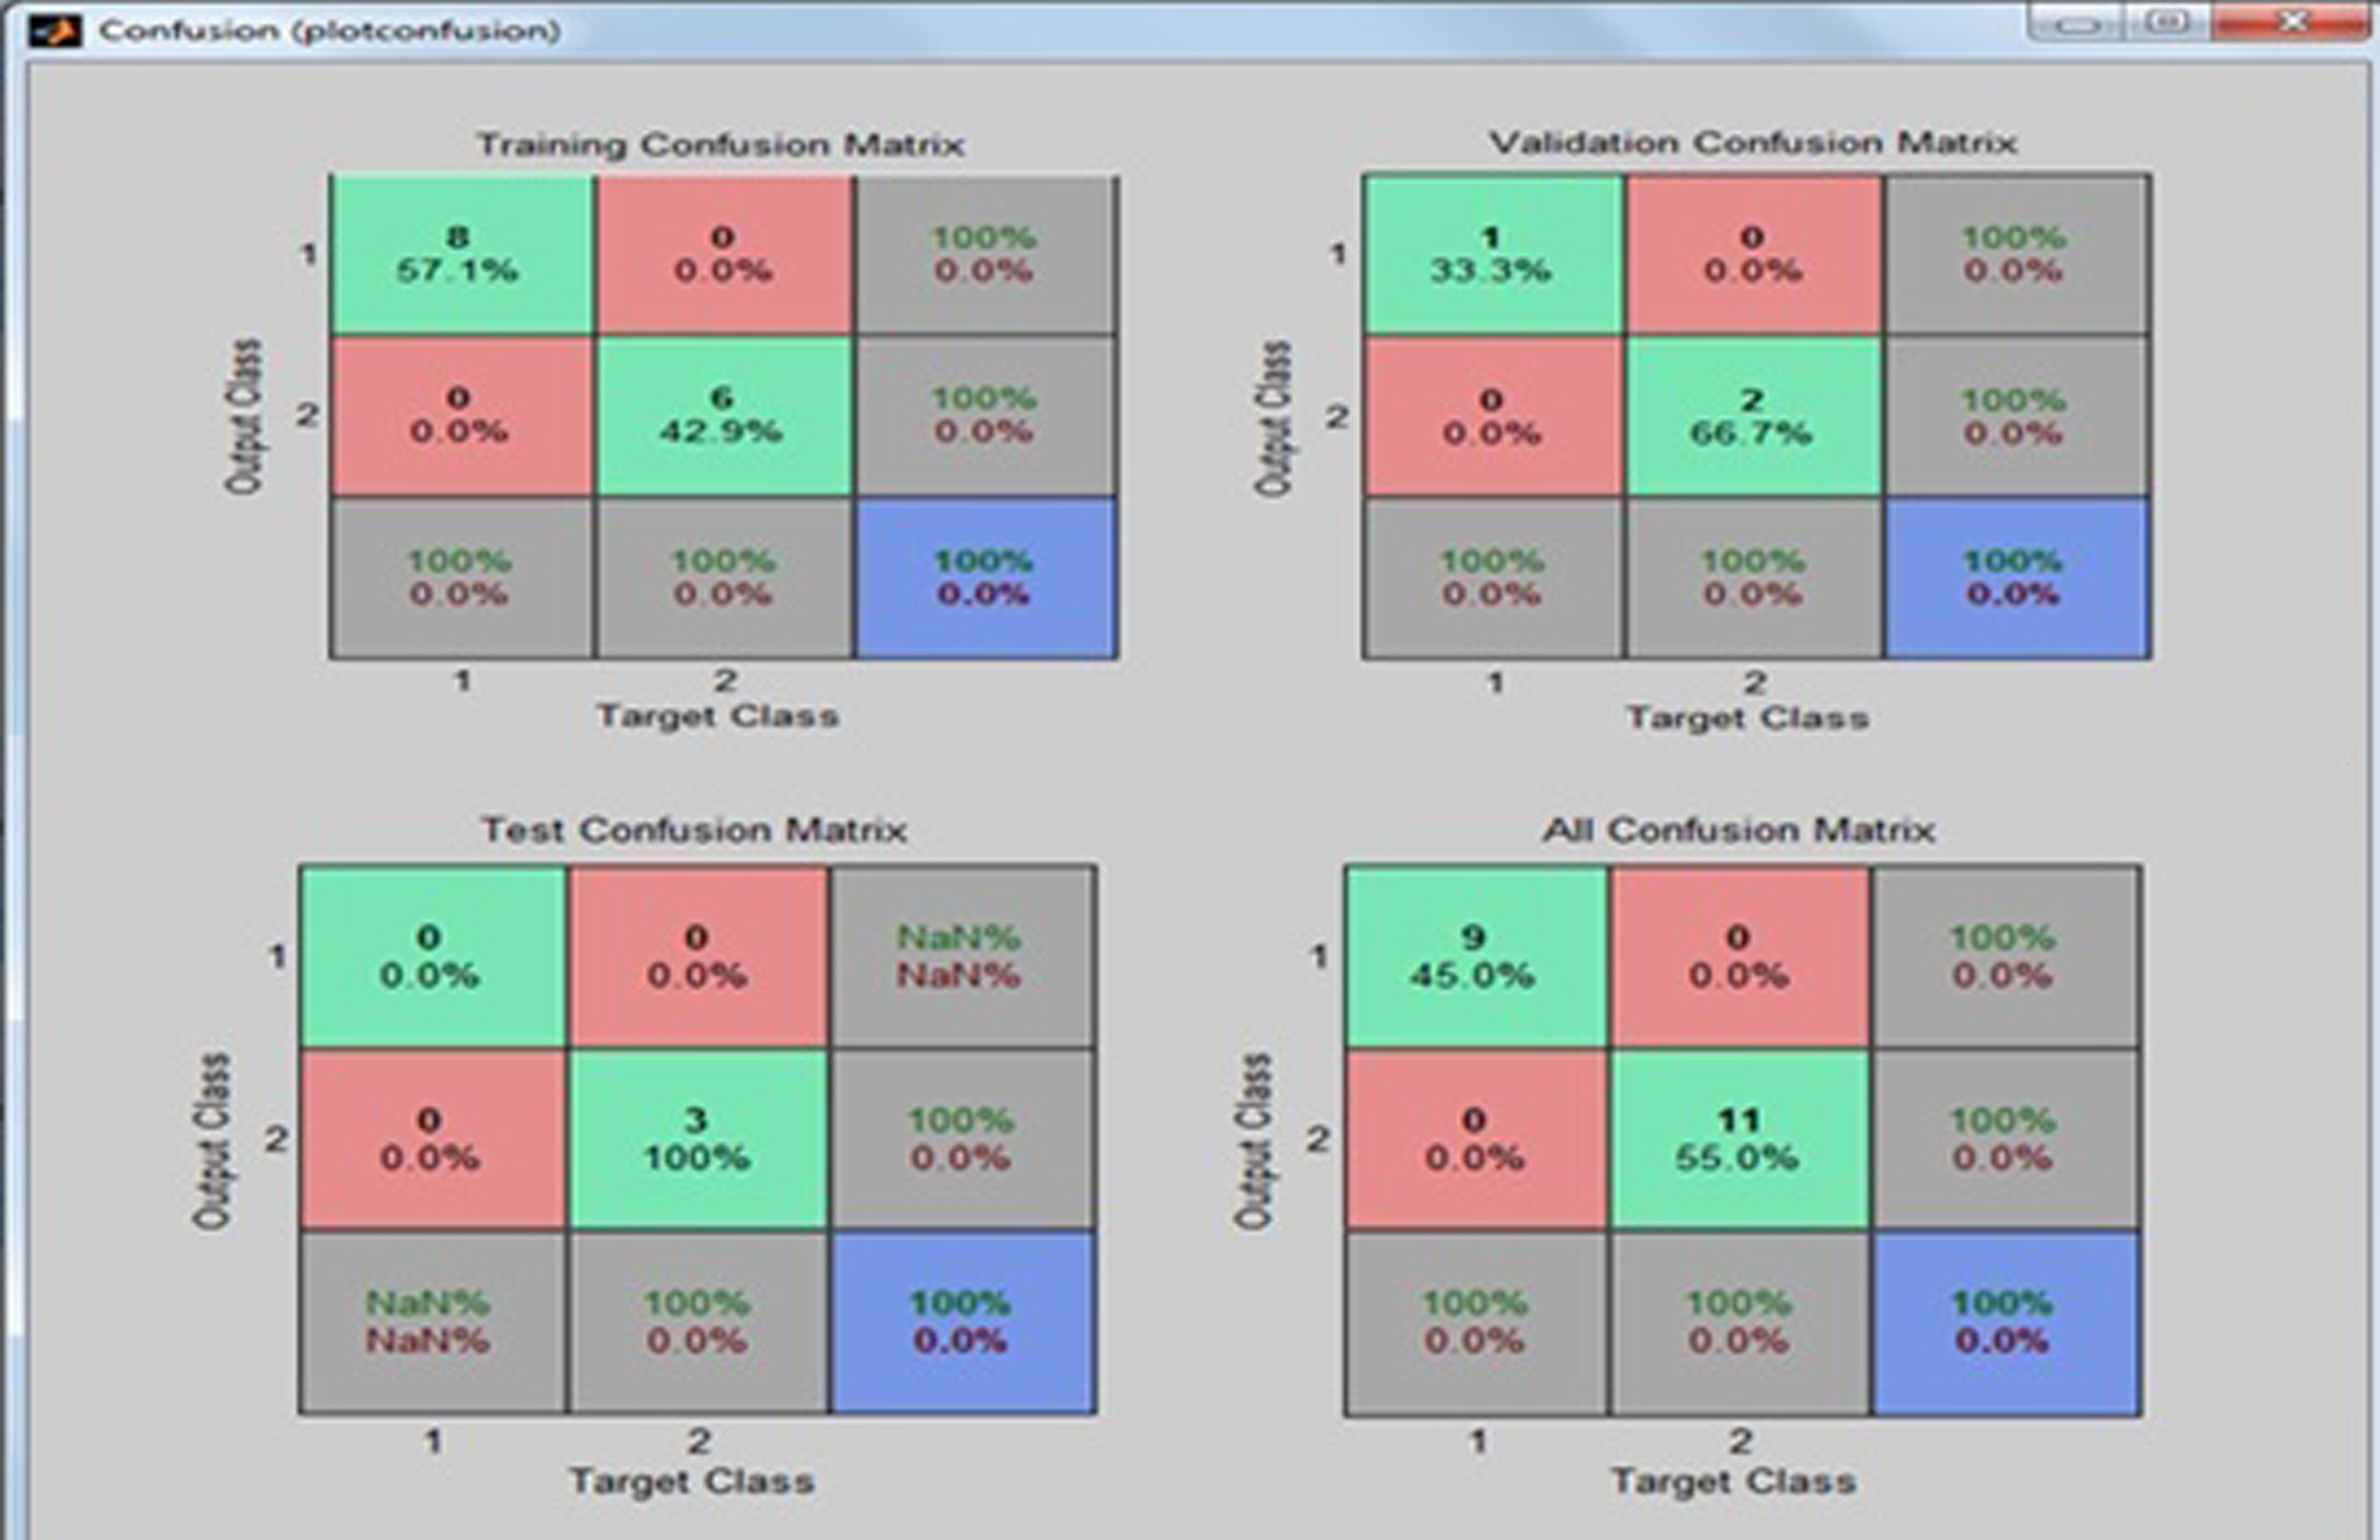
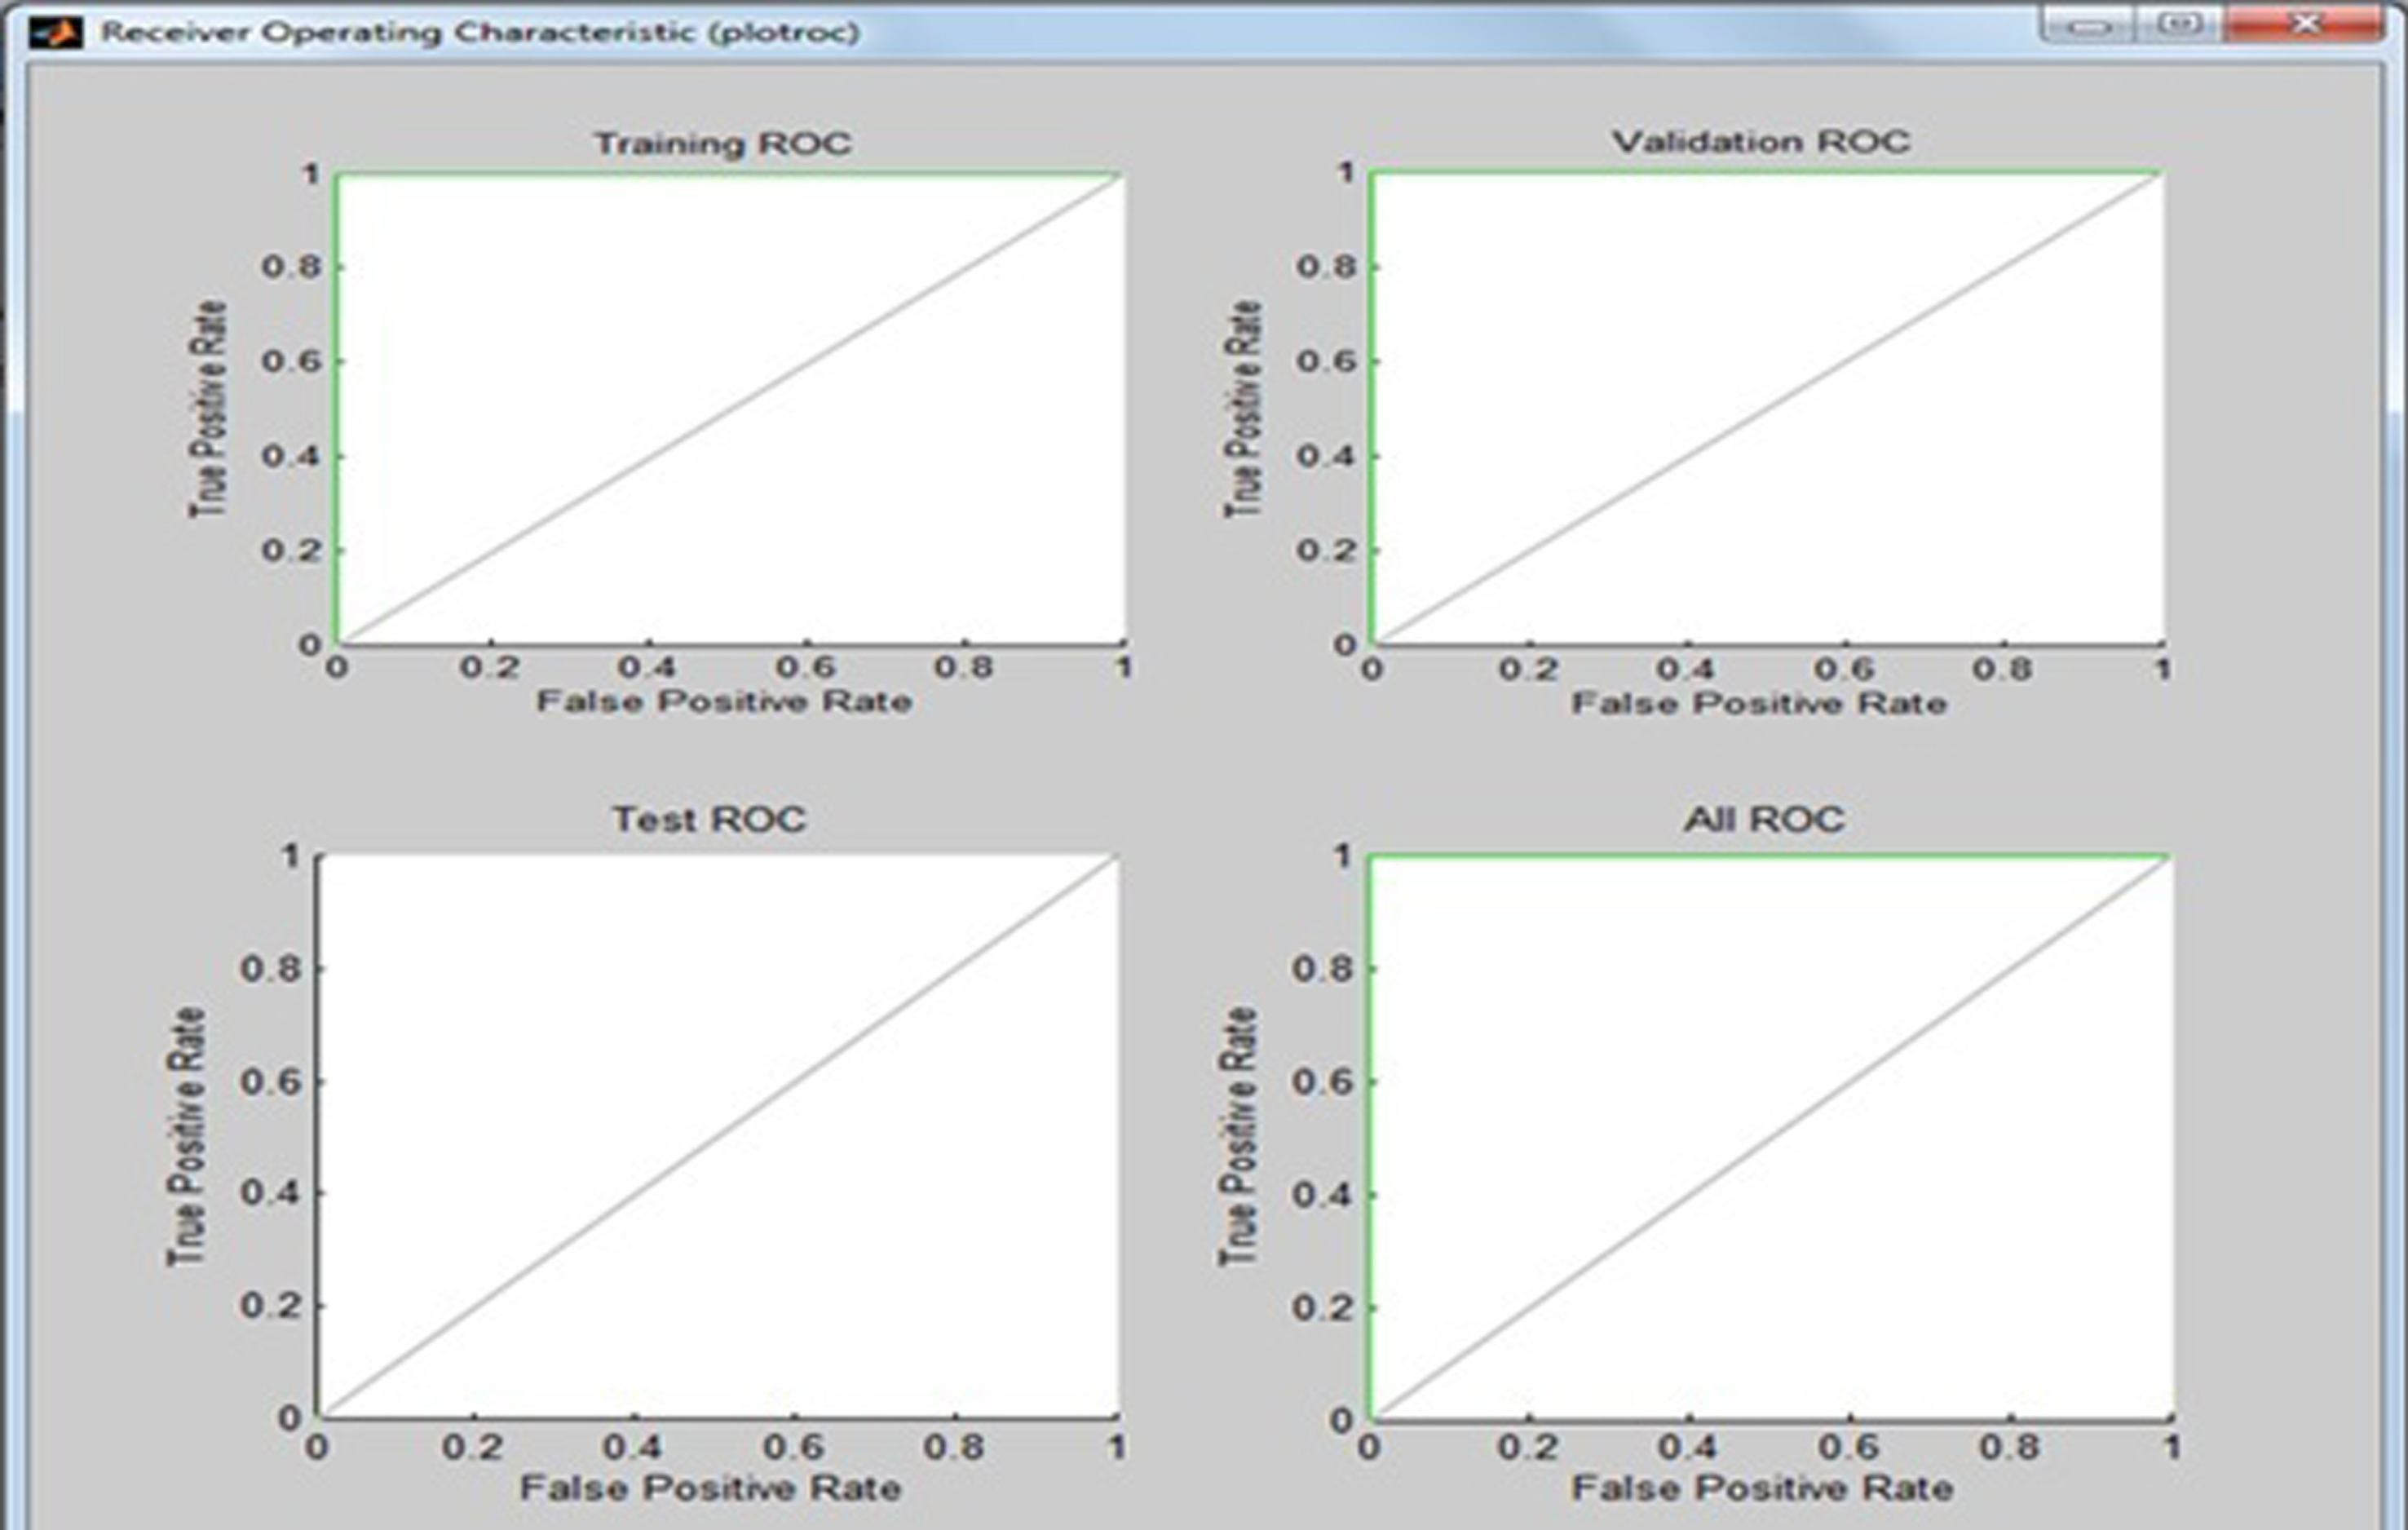
Fig.19
Receiver operating characteristic (ROC) curve.
DISCUSSION
In this paper, we proposed a method to discriminate between patients with AD and healthy control subjects based on diffusion tensor visualization-based neuro-fuzzy classification system. This study has demonstrated that the classification between AD and healthy control subjects could be improved by diffusion measures of three parameters, ADC, FA, and GM, in each voxel of the brain. We investigated these problems from a theoretical and computational point of view in the area of oncology. FES and NN are two important tools that have excellent applications in many areas, including medical engineering which has evolved as one of the key application areas of computational intelligence. A major application area for FES and NN includes the diagnosis of cancer, AD, Parkinson’s disease, diabetes, hypertension, cardiovascular disease, etc. In this study, we used the fuzzy (if–then) rules by taking three extracted features of ADC, FA, and GM values from the DMRI images of brain as input variables and evaluated the AD score as an output variable, which provides a useful platform to physicians in determining the status of the disease. The patterns were classified as either AD or healthy control patient. The proposed network is trained and fed into the ANN with three input neurons, one hidden layer of thirty neurons, and two output neurons. The NN is trained with a training algorithm and the performance of the training algorithm is obtained by executing FES. The results show that the LM training algorithm gave a satisfactory performance and achieved 100% accuracy.
CONCLUSIONS
In conclusion, the method of AD diagnosis is a successful model in assisting the physicians in the screening treatment of AD. In this paper, the presented FES successfully identified the presence of AD in the patients by measuring three parameters, ADC, FA, and GM, of the brain. These are considered as input variables, and the use of the neuro-fuzzy soft computing method can assist physicians in the detection of AD at early stages. From the analysis and diagnosis of the disease, the physician can decide which stage of AD the patient has and take the necessary steps for earliest possible treatment. This paper presents an investigational study for the classification of AD based of a neuro-fuzzy system for detection of healthy or AD patients. The experimental results have proven that the neuro-fuzzy based pattern recognition system gives a satisfactory performance. We intend to extend this methodology for early detection of Parkinson’s disease or other dementia.
CONFLICT OF INTEREST
We the authors declare that we have no conflict of interest.
ACKNOWLEDGMENTS
This research work was not supported financially by any research grant from our college or any other Institution of India, which is a low-income country, but also funded by us. We acknowledge with thanks for help and cooperation from the Dumkal Institute of Engineering & Technology, Murshidabad, West Bengal, India and Indian Statistical Institute, Kolkata, India.
REFERENCES
[1] | Arai H , Kobayashi K , Ikeda K , Nagao Y , Ogihara R , Kosaka K ((1983) ) A computed tomography study of Alzheimer’s disease. J Neurol 229: , 69–77. |
[2] | Mueller SG , Schuff N , Weiner MW ((2006) ) Evaluation of treatment effects in Alzheimer’s and other neurodegenerative diseases by MRI and MRS. NMR Biomed 19: , 655–668. |
[3] | Bhattacharya M , Majumder DD ((2000) ) Registration of CT and MR images of Alzheimer’s patient: A shape theoretic approach. Pattern Recognit Lett 21: , 531–548. |
[4] | Lee W , Park B , Han K ((2013) ) Classification of diffusion tensor images for the early detection of Alzheimer’s disease. Comput Biol Med 43: , 1313–1320. |
[5] | Mori S , Barker PB ((1999) ) Diffusion magnetic resonance imaging: Its principle and applications. Anat Rec 257: , 102–109. |
[6] | Mukherjee P , Berman JI , Chung SW , Hess CP , Henry RG ((2008) ) Diffusion tensor MR imaging and fibertractography: Theoretic underpinnings. AJNR Am J Neuroradiol 29: , 632–641. |
[7] | Mori S , Zhang J ((2006) ) Principles of diffusion tensor imaging and its applications to basic neuroscience research. Neuron 51: , 527–539. |
[8] | Belmokhtar N , Benamrane N ((2012) ) Classification of Alzheimer’s disease from 3D structural MRI data. Int J Computer Application 47: , 40–44. |
[9] | Tripoliti EE , Fotiadis DI , Argyropoulou M , Manis G ((2010) ) A six stage approach for the diagnosis of the Alzheimer’s disease based on FMRI data. J Biomed Inform 43: , 307–320. |
[10] | Al-Naami B , Gharaibeh N , Kheshman AA ((2013) ) Automated detection of Alzheimer disease using region growing technique and artificial neural network. In Proceedings of the World Academy of Science, Engineering and Technology World Academy of Science, Engineering and Technology (WASET), pp. 12. |
[11] | Chaudhary N , Aggarwal Y , Sinha RK ((2013) ) Artificial neural network based classification of neurodegenerative diseases. Adv Biomed Eng Res 1: , 1–8. |
[12] | Sampath R , Saradha A ((2015) ) Alzheimer’s disease classification using Hybrid Neuro Fuzzy Runge-Kutta (HNFRK) classifier. Res J Appl Sci Eng Technol 10: , 29–34. |
[13] | Liu X , Goncalves AR , Cao P , Zhao D , Banerjee A ((2018) ) Modeling Alzheimer’s disease cognitive scores using multi-task sparse group lasso. Comput Med Imaging Graph 66: , 100–114. |
[14] | Ahmed OB , Mizotin M , Benois-Pineau J , Allard M , Catheline G , Amar CB ((2015) ) Alzheimer’s disease diagnosis on structural MR images using circular harmonic descriptors on hippocampus and posterior cingulated cortex. Comput Med Imaging Graph 44: , 13–25. |
[15] | Cao P , Liu X , Yang J , Zhao D , Huang M , Zhang J , Zaiane O ((2017) ) Nonlinearity-aware based dimensionality reduction and over-sampling for AD/MCI classification from MRI measures. Comp Biol Med 91: , 21–37. |
[16] | Yang ST , Lee JD , Huang CH , Wang JJ , Hsu WC , Wai YY Computer-aided diagnosis of Alzheimer’s disease using multiple features with artificial neural network. In PRICAI 2010: Trends in Artificial Intelligence, ZhangBT OrgunMA, eds. Lecture Notes in Computer Science, vol 6230. Springer, Berlin, Heidelberg, pp. 699–705. |
[17] | Ardekani BA , Bachman AH , Figarsky K , Sidtis JJ ((2013) ) Corpus callosum shape changes in early Alzheimer’s disease: An MRI study using the OASIS brain database. Brain Struct Funct 219: , 343–352. |
[18] | Joshi S , Shenoy D , Simha GG V , Rrashmi PL , Venugopal KR , Patnaik LM ((2010) ) Classification of Alzheimer’s disease and Parkinson’s disease by using machine learning and neural network methods. Proceedings of the 2010 Second International Conference on Machine Learning and Computing, pp. 218–222. |
[19] | Zhang Y , Wang S , Dong Z ((2014) ) Classification of Alzheimer disease based on structural magnetic resonance imaging by kernel support vector machine decision tree. Prog Electromagn Res 144: , 171–184. |
[20] | Lopez MM , Ramirez J , Gorriz JM , Alvarez I , Salas-Gonzalez D , Segovia F , Chaves R ((2009) ) SVM-based CAD system for early detection of the Alzheimer’s disease using kernel PCA and LDA. Neurosci Lett 464: , 233–238. |
[21] | Wang G , Du J , Wang B , Zhang J ((2013) ) A new approach for ranking non-normal trapezoidal fuzzy number. Int J Innov Comput Inf Control 9: , 3173–3183. |


