
Pharmacokinetics in Rat of P8, a Peptide Drug Candidate for the Treatment of Alzheimer’s Disease: Stability and Delivery to the Brain1
Abstract
Strategies to achieve a therapy for Alzheimer’s disease (AD) aimed at reducing the effects of amyloid-β (Aβ) have largely involved inhibiting or modifying the activities of the β- or γ-secretases or by the use of monoclonal antibodies (MAb). We previously offered the potential for a new, early and effective approach for the treatment of AD by a strategy that does not target the secretases. We showed that a family of peptides containing the DEEEDEEL sequence and another independent peptide, all derived from the amino terminus of PS-1, are each capable of markedly reducing the production of Aβ in vitro and in mThy1-hAPP transgenic mice. These peptides gave a strong and specific binding with the ectodomain of amyloid-β protein precursor (AβPP) and did not affect the catalytic activities of β- or γ-secretase, or the level of AβPP. Critical to the development of any therapeutic for AD is the requirement that it is stable and can be delivered to the brain. We report here data on the metabolic stability and delivery to the rat brain of our lead candidate P8 by intravenous (IV), intranasal (IN), and subcutaneous (SC) administration. Pharmacokinetics (PK) of P8 in rat plasma and CSF following a single dose of P8 demonstrate that SC administration gives better absorption compared to IN and is the delivery method of choice for the further development of P8 as a clinical candidate.
INTRODUCTION
The number of individuals diagnosed with Alzheimer’s disease (AD) is expected to triple by the year 2050. There is therefore an urgent need for disease-modifying therapies that can prevent the onset or arrest the progression of the disease. Amyloid-β (Aβ), a 39–43 amino acid fragment of the amyloid-β protein precursor, AβPP [1, 2] is widely recognized to be the primary neurotoxic agent in AD [3, 4]. Critically involved in the formation and release of Aβ from its precursor is the action of the Presenilin proteins, PS-1 or PS-2, as part of a complex of other proteins [5, 6]. Strategies to date to achieve a therapy for AD aimed at reducing the effects of Aβ have largely involved inhibiting or modifying the activities of the β- or γ-secretases or by the use of monoclonal antibodies (MAb) against Aβ. Attempts at inhibiting total Aβ production by directly targeting the catalytic activities of these enzymes have failed due to off-target effects as both enzymes are known to hydrolyze numerous other substrates besides AβPP. γ-secretase, in particular, acts upon many Type I membrane proteins [7], including Notch to yield the Notch intracellular domain (NICD) that has critically important cellular functions [8]. Although some recent γ-secretase modulation studies have successfully spared Notch function [9, 10], γ-secretase has over 50 known substrates [7], any of whose functions could potentially be undesirably affected by enzyme modulation. β-secretase inhibitors have entered clinical trials because they have so far proved to be less toxic than the γ-secretase inhibitors, but it is not known what the effects of inhibiting over 50 reactions in the cell for greater than 20 years of chronic use, will have. Data are already emerging on toxicity issues with some BACE-1 inhibitors. Johnson and Johnson have just announced that they have stopped their program on the BACE-1 inhibitor atabecestat due to liver safety issues [11]. Similarly, Merck ended Phase III studies of their BACE-1 inhibitor verubecestat after concluding that the inhibitor was unlikely to exhibit a positive benefit/risk ratio [12]. New therapeutic approaches that can inhibit total Aβ production without targeting the activities of the β- or the γ-secretase are therefore of great interest.
Our previous work [13] offers the potential for a new, early, and effective approach for the treatment of AD, by a strategy that does not target the secretases. We showed first that a family of peptides containing the DEEEDEEL sequence (P6, P7, and P8) and another independent peptide (P4), all derived from the amino terminus of PS-1 are each capable of markedly reducing the production of total Aβ and of Aβ 40 and Aβ 42 in vitro and in mThy1-hAPP Tg mice. Second, we showed using biolayer interferometry for those peptides that were effective in reducing Aβ, of a strong, specific, and biologically relevant binding with the ectodomain of human AβPP. This binding was further confirmed by confocal microscopy for cell-surface-expressed AβPP in fibroblasts. Finally, we demonstrated that the reduction of Aβ by the peptides did not affect the catalytic activities of β- or γ-secretase, or the level of AβPP.
Critical to the development of any therapeutic for AD is the requirement that it is stable and can be delivered to the brain. We report here results of metabolic stability studies of our lead candidate P8 in human and mouse plasma and brain extracts and two independent studies to demonstrate that it can be delivered to the rat brain. The first shows the delivery to and distribution of radiolabeled P8 in the rat brain. The second shows the pharmacokinetics (PK) of P8 in rat plasma and cerebrospinal fluid (CSF) following a single dose of P8 by intravenous (IV), intranasal (IN), and subcutaneous (SC) administration.
MATERIALS AND METHODS
P8 peptide
P8 peptide (sequence: DEEEDEEL) was synthesized by Polypeptide Laboratories (Torrance CA). Identity and purity were verified by analytical HPLC. The peptide purity was greater than 99%, water content was 3.89% and sodium content was less than 0.003%.
Animals
Male Sprague-Dawley (SD) rats (249–274 g, purchased from Charles River) were used in all the studies. Rats were ordered un-cannulated (for the radiolabel study) or cannulated in the jugular vein and with intra-cisternal cannulation for CSF sampling for PK studies. Animals were handled in accordance with the current NIH guidelines regarding the use and care of laboratory animals, and all applicable local, state, and federal regulations and guidelines.
Plasma stability studies
An aliquot of mouse or human plasma (990μL) or mouse or human brain homogenate (1:3 brain:PBS, w/v; 495μL) was added to separate glass test tubes. To each tube was added 100μM P8 in methanol to a final concentration of 1μM in matrix. After 15 and 30 min, 1, 2, and 4-h incubation periods at room temperature, matrix proteins were precipitated with 3 mL of methanol (1.5 mL for mouse brain homogenate). The supernatant was transferred to a fresh tube, evaporated and samples were reconstituted in 0.1% formic acid in water. The reactions were analyzed using LC/MS/MS. Each time point was prepared in duplicate. Time zero samples were pre-quenched with methanol prior to the addition of P8.
Radiolabel distribution study
Adult male SD rats (n = 12, mean weight 315 g) were housed in pairs with free access to food and water with 12-h light cycles. Animals were split into two groups; those receiving compound by IN delivery and those receiving compound by intravenous IV delivery. After being anesthetized with a cocktail (0.7 mL/kg) consisting of 150 mg ketamine (100 mg/ml), 30 mg xylazine (20 mg/ml), and 5 mg acepromazine (10 mg/ml). IV animals underwent jugular and femoral vein cannulation and IN animals underwent jugular vein cannulation. All animals received 0.5 mg P8 and the same concentration of 3H (60μCi). All dose-solutions were made up to 60μL. 3H-P8 was administered by IV infusion for 18 min. Administration of 3H-P8 via IN was also completed over 18 min by delivering drops to alternating naris every 2 min while in the supine position. From this point forward, both groups were treated the same. Blood was drawn from the jugular vein at 10 and 20 min following end-of-dose administration. At 30 min, a terminal blood sample was collected via cardiac puncture prior to perfusion with saline. Brain and body tissues were also collected and processed for scintillation counting.
Data analysis
P8 concentrations (nM or pmol/g tissue weight) were calculated using the weight (g) and DPM measured for each tissue sample, and the measured specific activity (pmol/DPM) of the dose administered. Mean and standard error of the mean concentration (nM or μM) of each tissue sample were calculated. Any value outside two standard deviations of the mean for each tissue was considered an outlier and removed from the data set. There were no calculated outliers for this study.
PK study
A single dose of P8 in PBS was administered via three routes: IV, SC, and IN. For the IV and SC routes of administration, P8 (200μL of a 16.5 mg/ml solution, which was equivalent to a final dose of approximately 11 mg/kg) was administered to each rat over a 1-min period. For IN administration, P8 (60μL of a 27.5 mg/mL solution, which was equivalent to a final dose of approximately 5.5 mg/kg) was administered to each rat by placing 10μl of dosing solution in each nostril (20μL total per administration) at 6-min intervals so that the 60μl was administered over an 18-min period. IN administration was carried out using a rICD Device Kit (item#1000007) manufactured by Impel NeuroPharma (kit ID:019). Following dose administration, blood samples were taken at pre-dose, 5, 15, 25, 35, 50, 70, 90, 110, 130, and 165-min from the onset of drug administration via a jugular cannula. Approximately 300μl of whole blood was removed and placed in K2EDTA treated tubes and immediately placed on wet ice. The cannula was then flushed with 300μl of a 0.9% saline solution containing 10 units of sodium heparin. CSF (20μl) was sampled at pre-dose, 10, 20, 30, 40, 60, 80, 100, 120, and 150 min via the intercisternal cannula, and wherever possible, at 180-min from the onset of drug administration. Blood was centrifuged at 6000×g for 6.5 min and a 150μl aliquot of plasma was transferred to a fresh microcentrifuge tube and immediately placed on dry ice. CSF samples were placed in a microcentrifuge tube and immediately placed on dry ice. All samples were stored at –20°C until analysis. PK analysis was performed using standard noncompartmental analysis models in Phoenix WinNonlin (v6.3).
Bioanalytical method for the detection of P8 in rat plasma and CSF
P8 was precipitated from samples after the addition of formic acid in acetonitrile:methanol and separated by HPLC using a 50×2.1 mm, 5μm Onyx monolithic C18 column. P8 was detected using a tandem quadrupole mass spectrometer (Xevo TQS, Waters, Milford, MA) using ESI in the positive mode. The parent > daughter mass transition from 1007.55 > 876.35 was used for the detection of P8. The calibration curves were obtained by fitting the log transformed peak areas against the log transformed standard concentrations using linear regression. The plasma calibration curve had a range of 1.00 to 100 ng/mL and the CSF calibration curve had a range of 0.500 to 50.0 ng/mL
SC administration of P8 to APPSWE Tg mice and Aβ analysis
APPSWE mice, which carry the Swedish mutation on the APP gene [14], were purchased from Taconic and used at 16 weeks of age. Mice (n = 5 per group) were administered PBS or P8 (200μL of a 33 mg/ml solution) subcutaneously 1X or 2X per day for 14 days after which the animals were sacrificed. The hippocampus was removed and Aβ 40 analysis was carried out by ELISA (Invitrogen).
RESULTS
Metabolic stability of P8 in mouse and human plasma and brain homogenates
Our results showed that P8 was stable in its unmodified form in mouse and human plasma and brain homogenates. The half-life of P8 in mouse plasma was found to be > 240 min; and in mouse brain homogenate was > 120 min. In human plasma and brain homogenate, the half-life of P8 was > 120 min. In human but not mouse plasma, there appeared to be about 50% drop in stability at around 15 min, which then stabilized and even increased slightly. This was most likely due to the non-specific binding of P8 to precipitated plasma proteins. Please see Fig. 1A, B and Table 1.
Fig. 1.
Metabolic stability of P8 in mouse and human plasma (A) and brain (B). P8 (1μM) was added to mouse (closed circles) and human (open circles) plasma or brain extract and the reactions were incubated at room temperature for up to 4 h. The amount of P8 remaining was determined by LC/MS/MS and is presented as a percentage of the sample at time 0.
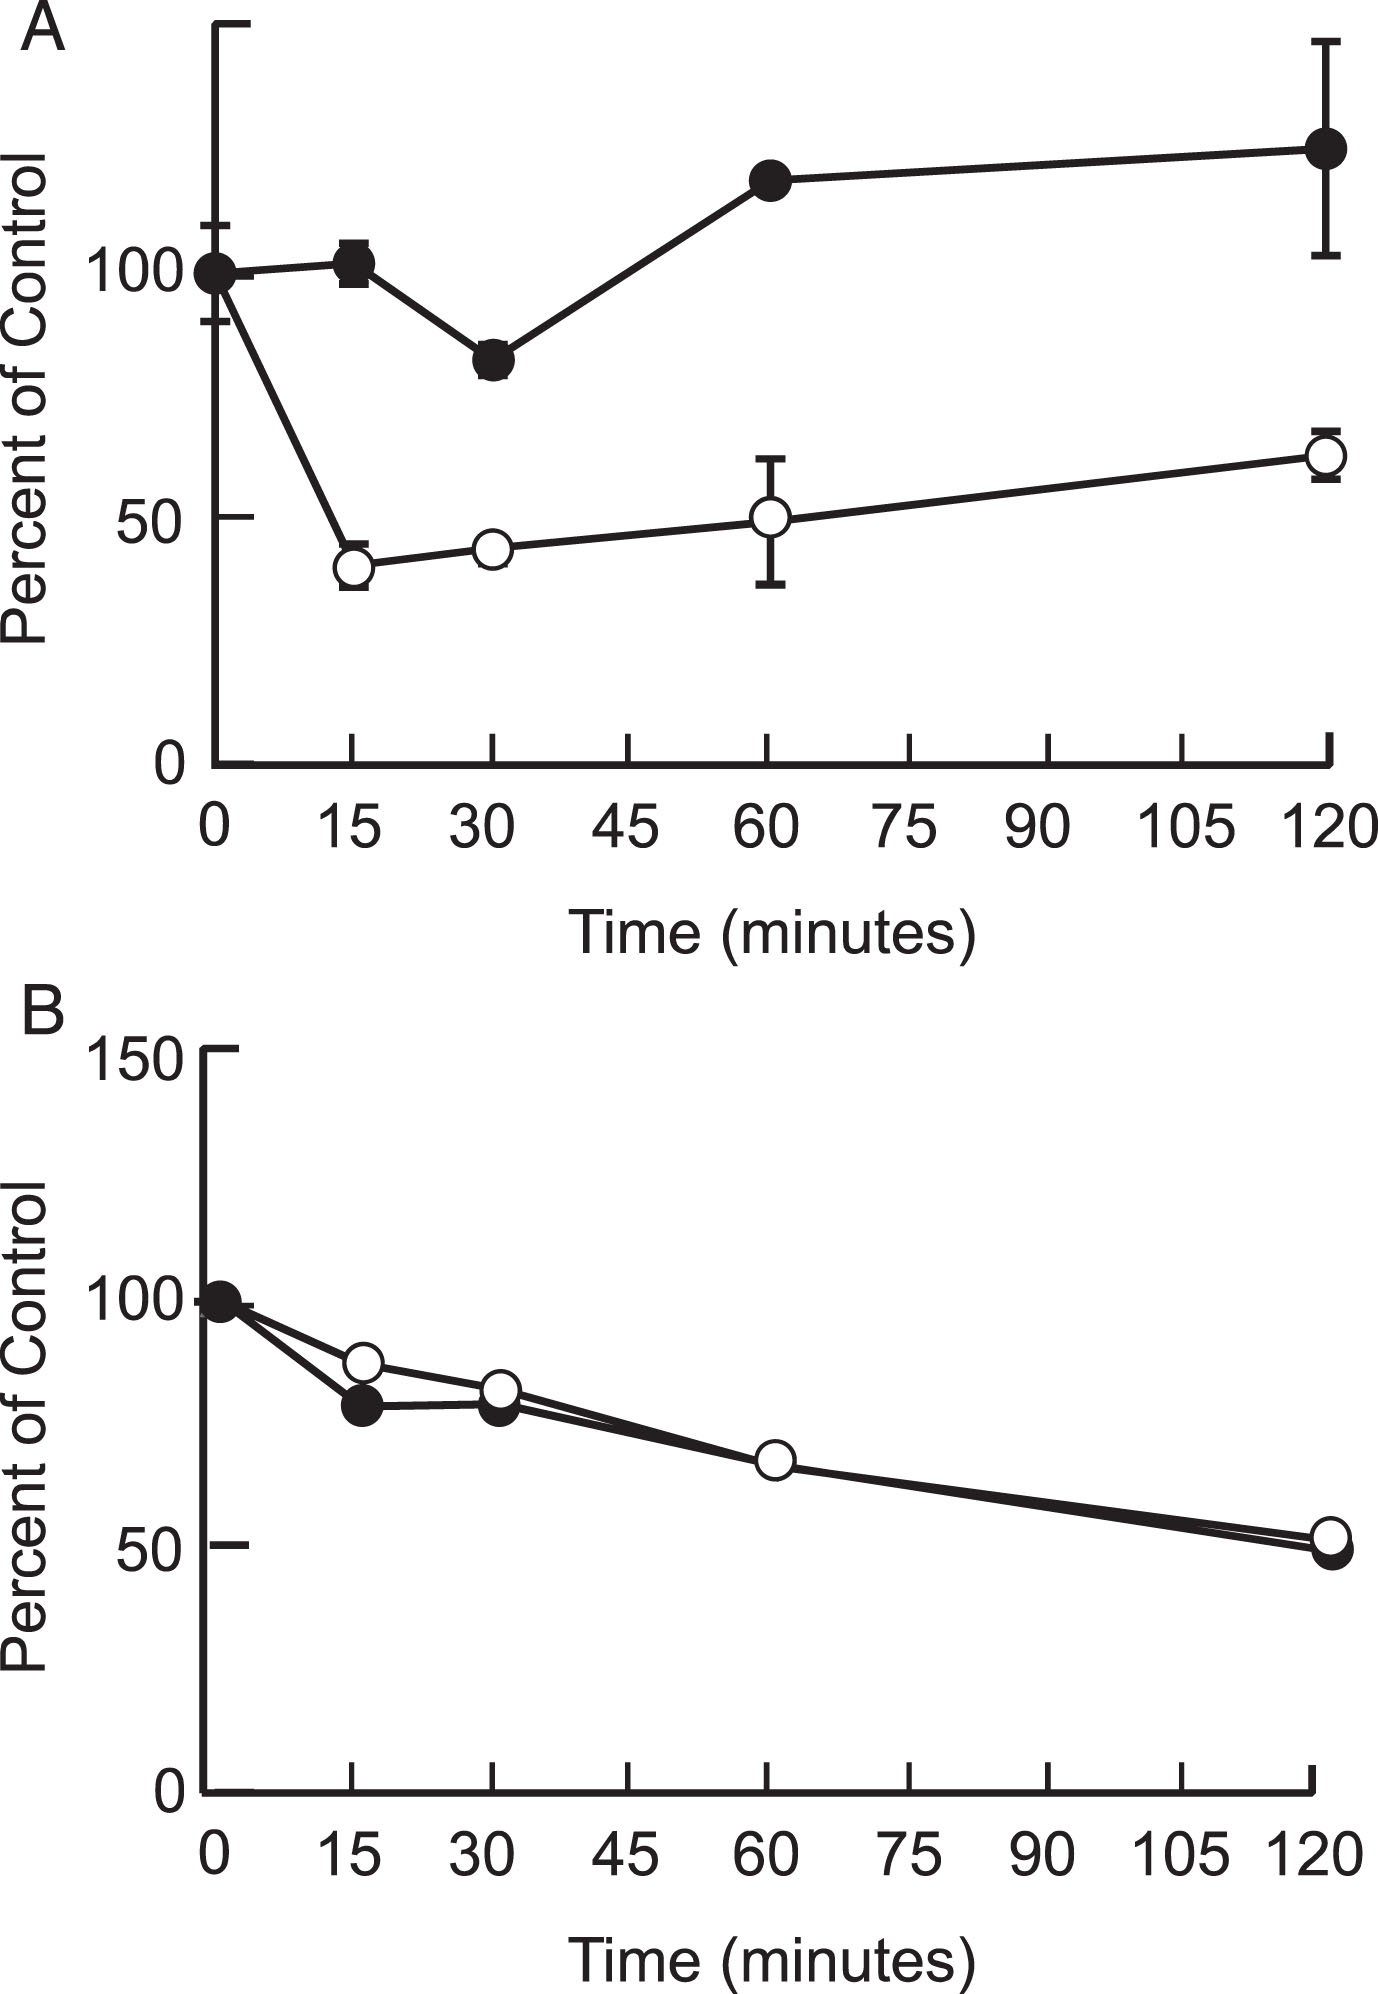
Table 1
Metabolic stability of P8 in mouse plasma and mouse brain homogenate. Table shows amount of P8 remaining in plasma and brain extract after incubation for 120 mins, expressed as a percentage of P8 at time 0, and half-life of P8.
| Plasma | Brain | |||
| % of Control at 120 min | Half-Life (min) | % of Control at 120 min | Half-Life (min) | |
| Mouse | 100 | >240 | 49.2 | 120 |
| Human | 63.1 | >120 | 51.4 | 120 |
Delivery to the brain of 3H-P8 and radiolabel distribution
Following 3H-P8 administration (497 nmol) to anesthetized rats (N = 6), radiolabel reached the CNS quickly by both IN and IV administration (Table 2 and Fig. 2). Following IV administration, radiolabel reached the brain at slightly higher concentrations (56–104 nM) than IN (36–103 nM) and was present in all parts of the brain, suggesting that P8 could reach the target once systemic exposure was achieved. As expected, animals treated intranasally with 3H-P8 had higher epithelial concentrations (olfactory: 14μM and respiratory: 1,303μM) than those treated intravenously (olfactory: 0.26μM and respiratory: 0.28μM). The lower concentration of P8 in the olfactory epithelium may be the result of 3H-P8 precipitating in the respiratory epithelium prior to reaching the olfactory epithelium. IV administration resulted in greater systemic (liver and kidney) exposure (0.38μM and 12.5μM) compared to IN administration (0.19μM and 0.30μM). Peak blood concentrations were more than 10 times higher with IV administration (889 nM) compared to IN administration (78 nM). IN delivery of P8 improved brain targeting approximately 4-fold compared to IV delivery, reducing systemic exposure and the risk of potentially unwanted side effects. IN delivery reached the lung in a higher concentration (793 nM) than IV delivery (324 nM); however, the error is very high in the IN group. There were two animals in the IN group (Rats 4 and 10) that had very high concentrations of the peptide in the lungs, possibly the result of 3H-P8 draining into the lungs from the nasal cavity or the inspiration-inhalation of the IN-dosing solution.
Fig. 2.
3H-P8 delivery to brain tissues by intravenous and intranasal administration. Rats (n = 6 per dose group) were administered 3H-P8 (60μCi) and 0.5 mg P8 by IN (blue bars) or IV (orange bars) delivery. Brain tissue was collected 30 mins following administration and processed for scintillation counting. Concentration of P8 (nM) was calculated for each brain region and is presented.
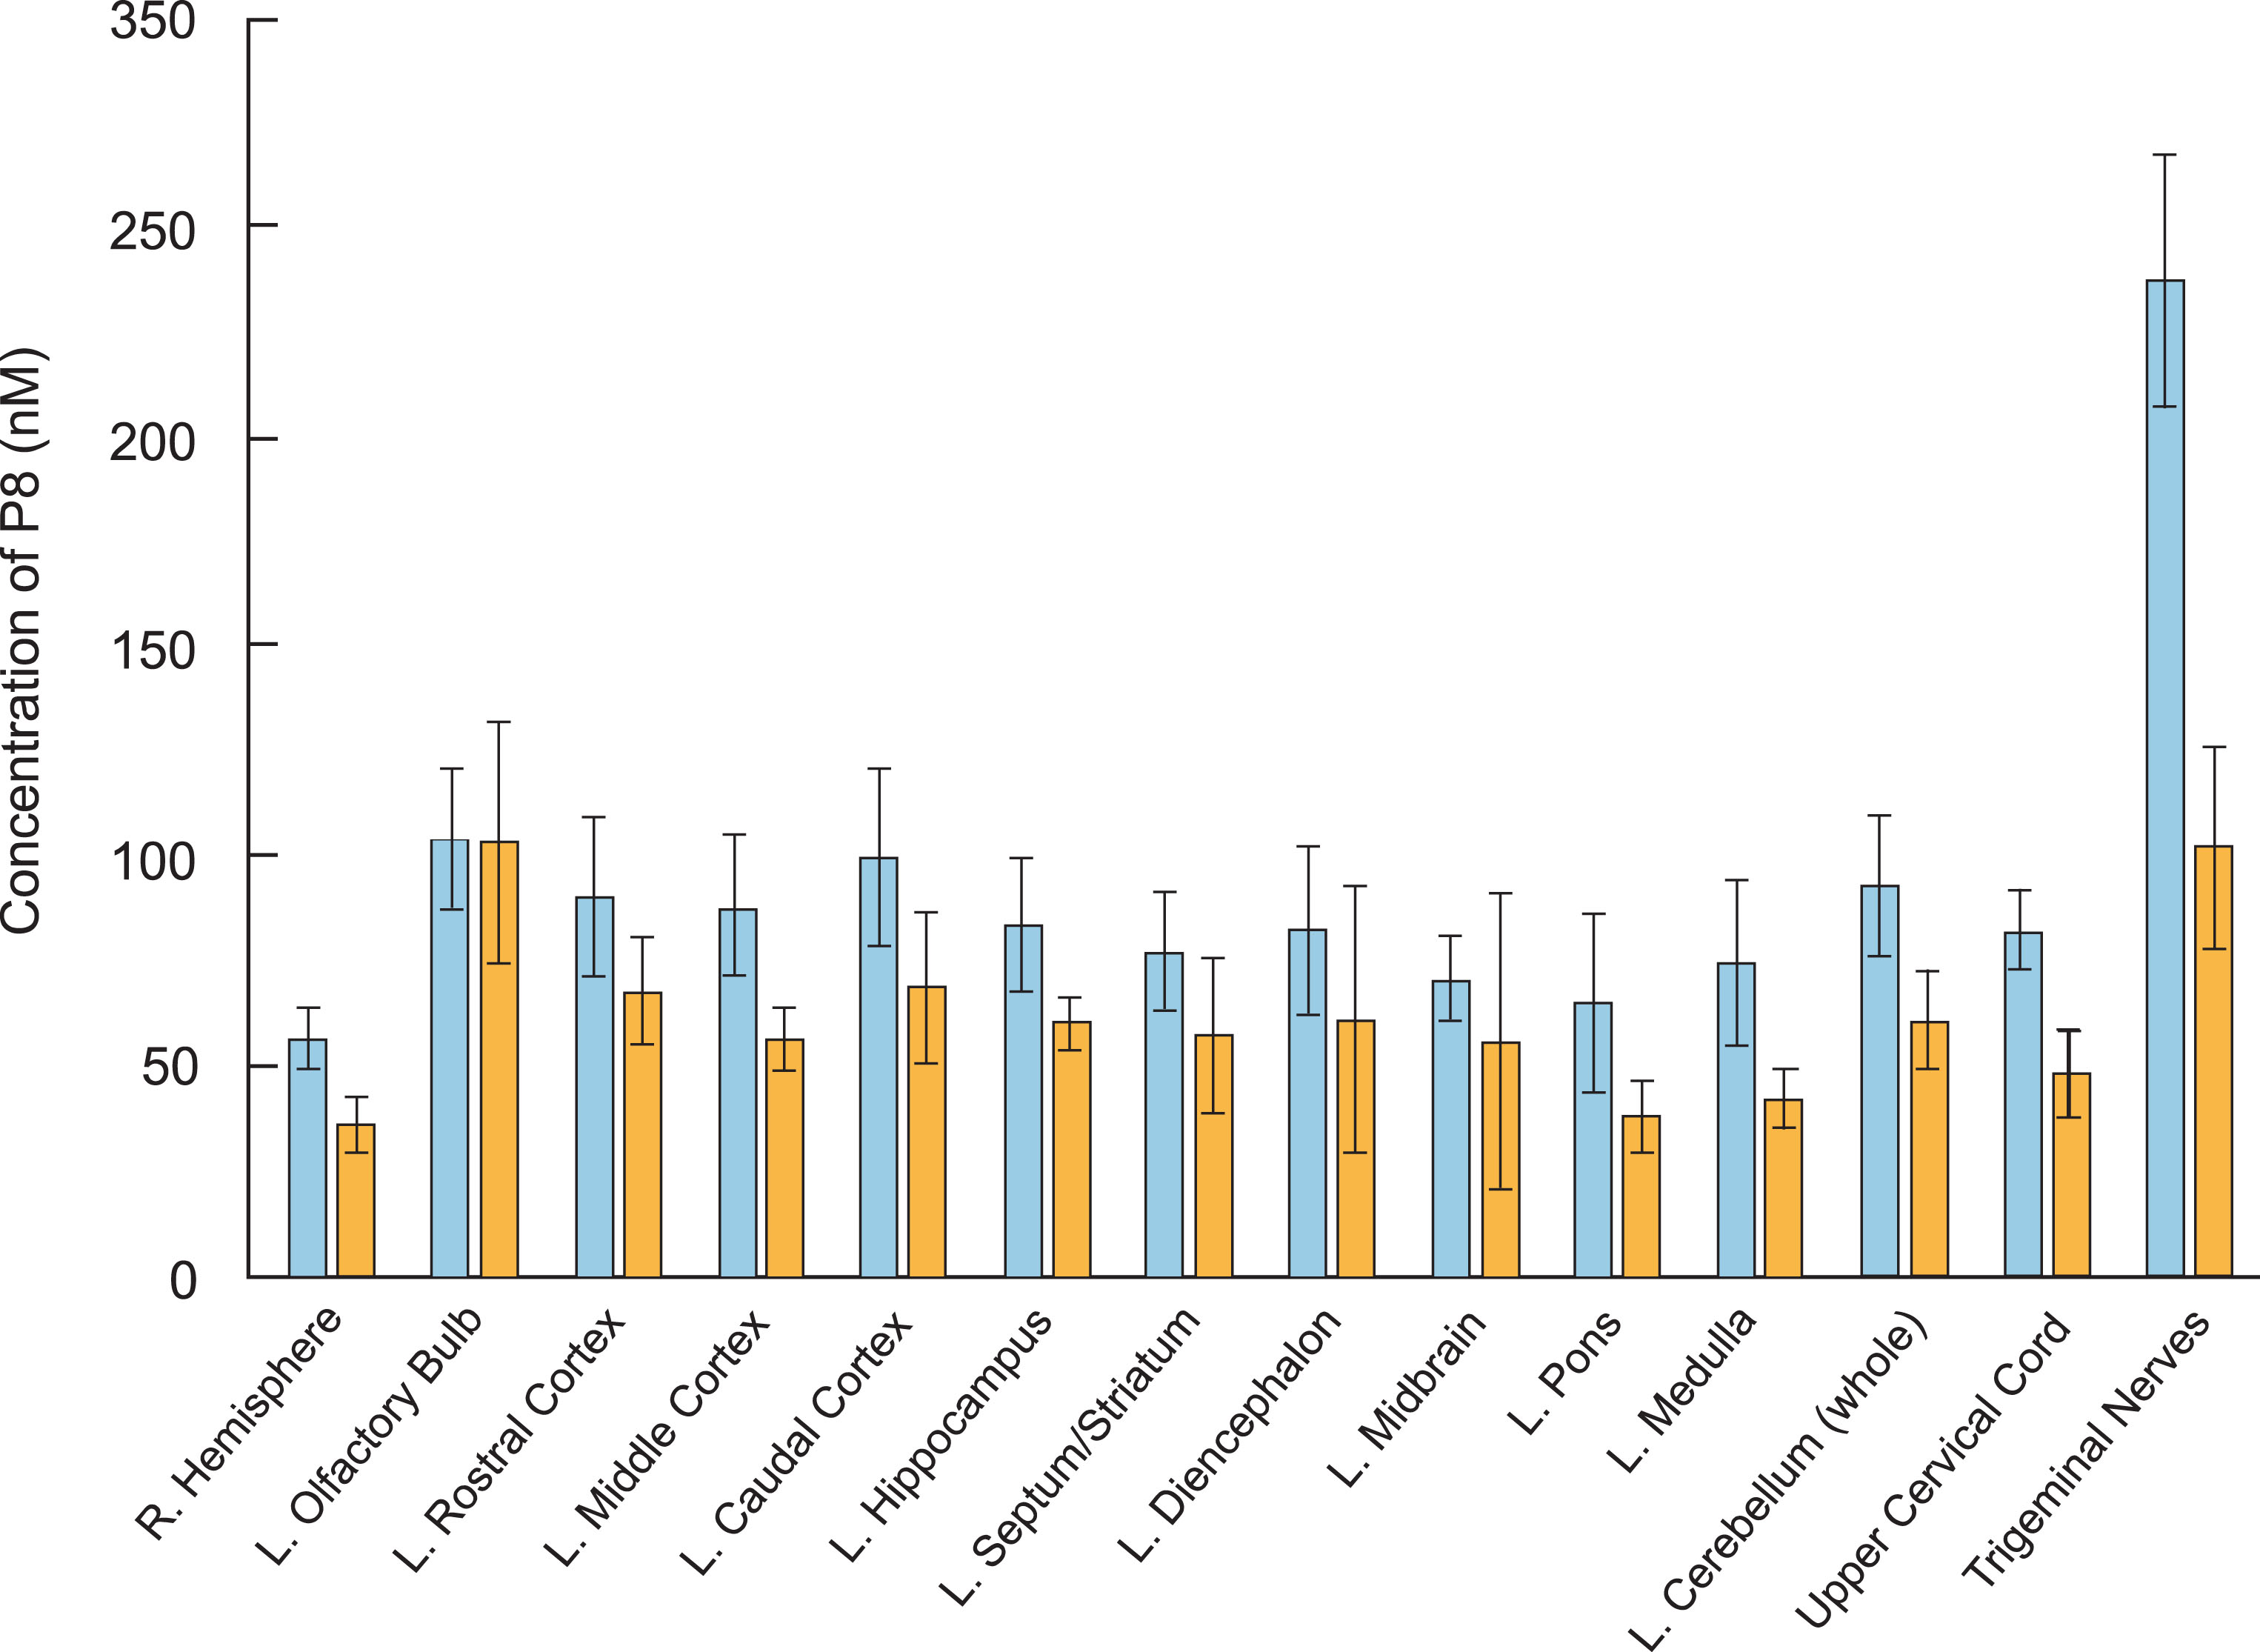
Table 2
Distribution of 3H-P8 in rat plasma and tissues following IV and IN delivery
| IV | IN | |||
| nM | ±Std Dev | nM | ±Std Dev | |
| R. Hemisphere | 56 | 7 | 36 | 7 |
| L. Olfactory Bulb | 104 | 17 | 103 | 29 |
| L. Rostral Cortex | 90 | 19 | 67 | 13 |
| L. Middle Cortex | 89 | 17 | 56 | 78 |
| L. Caudal Cortex | 100 | 21 | 68 | 18 |
| L. Hippocampus | 83 | 16 | 60 | 6 |
| L. Septum/Striatum | 77 | 14 | 57 | 19 |
| L. Diencephalon | 82 | 20 | 61 | 32 |
| L. Midbrain | 71 | 10 | 56 | 36 |
| L. Pors | 65 | 22 | 38 | 9 |
| L. Medulla | 75 | 20 | 42 | 7 |
| L. Cerebellum (whole) | 93 | 17 | 61 | 12 |
| Upper Cervical Cord | 82 | 10 | 48 | 10 |
| Trigeminal Nerves | 238 | 30 | 102 | 24 |
| Olfactory Epithelium | 261 | 51 | 14,069 | 11,478 |
| Respiratory Epithelium | 279 | 54 | 1,303,116 | 333,108 |
| Lung | 324 | 207 | 793 | 1,024 |
| Liver | 376 | 78 | 188 | 172 |
| Kidney | 12,536 | 9,826 | 297 | 93 |
| 10 min Blood Draw | 293 | 299 | 44 | 22 |
| 20 min Blood Draw | 889 | 427 | 67 | 29 |
| 30 min Blood Draw | 590 | 346 | 78 | 19 |
| Cortex Blood Ratio | 0.21 | 0.1 | 0.84 | 0.27 |
Before averages were calculated, Rat 3 was removed from the study. This was an IV treated animal and the DPMs were much lower than expected in all tissues. The efficiency of IN delivery to the brain was shown to be similar to that reported by Thorne et al. [15], where administration of 5 nmol resulted in 0.5 to 1 nM brain concentrations.
Plasma and CSF pharmacokinetics of P8
In order to ascertain that the radiolabel in the brain indeed represented intact P8 and was not due to leaching or fragmented peptide, an HPLC/MS/MS method for the determination of P8 concentrations in rat plasma and CSF samples was used.
Following IV dose administration, P8 exposure was observed with a mean plasma area-under-the-curve (AUC) value of 679,000±250,000 ng·min/mL (Tables 3 and 6 and Fig. 3A). This equated to a mean clearance (CL) value of 17.6±5.65 mL/min/kg, which is about 25% of hepatic liver blood flow (based on a 70 mL/min/kg estimate). The volume of distribution was 0.546±0.306 L/kg, suggesting minimal distribution out of the systemic circulation. The mean terminal half-life (t1/2) was 22±8.2 min, which is shorter than the observed plasma stability half-life in mouse or human. The mean P8 CSF AUC was 3,270±226 ng·min/mL, with a peak CSF Cmax value of 65.6 ng/mL observed at the 10-min time point (first time point) (Fig. 3B and Tables 3 and 6). The CSF exposure represents about 0.5% of the observed plasma exposure, however this is likely to be an underestimate as it is unknown what the true peak concentration was in the CSF following IV administration. For both matrices, P8 was still quantifiable at the last time point, suggesting that concentrations were measurable beyond 3 h (Fig. 4A-C).
Table 3
Individual and mean P8 concentrations (ng/mL) in rat plasma and CSF following a single intravenous dose (11.0 mg/kg)
| Matrix | Time (min) | Rat I.D. | Mean | SD | ||
| Rat 1 | Rat 2 | Rat 3 | ||||
| Plasma | 0 | BQL | BQL | BQL | 0.00 | 0.00 |
| 5 | 102,000 | 45,300 | 43,600 | 63,600 | 33,200 | |
| 15 | 9,880 | 12,600 | 8,460 | 10,300 | 2,100 | |
| 25 | 4,250 | 5,650 | 3,230 | 4,380 | 1,210 | |
| 35 | 2,160 | 2,710 | 1,770 | 2,210 | 472 | |
| 50 | 878 | 1,190 | 713 | 927 | 242 | |
| 70 | 392 | 313 | 199 | 301 | 97.0 | |
| 90 | 97.3 | 105 | 166 | 123 | 37.6 | |
| 110 | 93.1 | 36.4 | 39.8 | 56.4 | 31.8 | |
| 130 | 42.0 | 18.3 | 20.7 | 27.0 | 13.0 | |
| 165 | 18.9 | NSR | 9.72 | 14.3 | 6.49 | |
| CSF | 0 | BQL | BQL | BQL | 0.00 | 0.00 |
| 10 | 61.1c | 50.1c | 85.7c | 65.6 | 18.2 | |
| 30 | 42.5 | 48.2c | 39.3 | 43.3 | 4.51 | |
| 60 | 22.8 | 17.8 | 16.9 | 19.2 | 3.18 | |
| 100 | 10.7 | 8.69 | 4.08 | 7.82 | 3.39 | |
| 150 | 4.88 | 4.30 | 3.57 | 4.25 | 0.656 | |
| 180 | 4.11 | NSR | 1.06 | 2.59 | 2.16 | |
NSR-No Sample Received.
Fig. 3.
Mean (±SD) concentrations (ng/ml) of P8 in plasma (A) and CSF (B) of rats following a single IV, IN, or SC dose administration. P8 in PBS (11 mg/kg for IV and SC and 5.5 mg/kg for IN) was delivered to rats (n = 6 per dose group). Blood and CSF samples were removed for up to 180 mins from the onset of administration and analyzed by HPLC as described. PK analysis was performed using standard non-compartmental analysis models in Phoenix WinNonlin (v. 6.3). Black circles: IV administration; Open circles: IN administration; Triangles: SC administration.
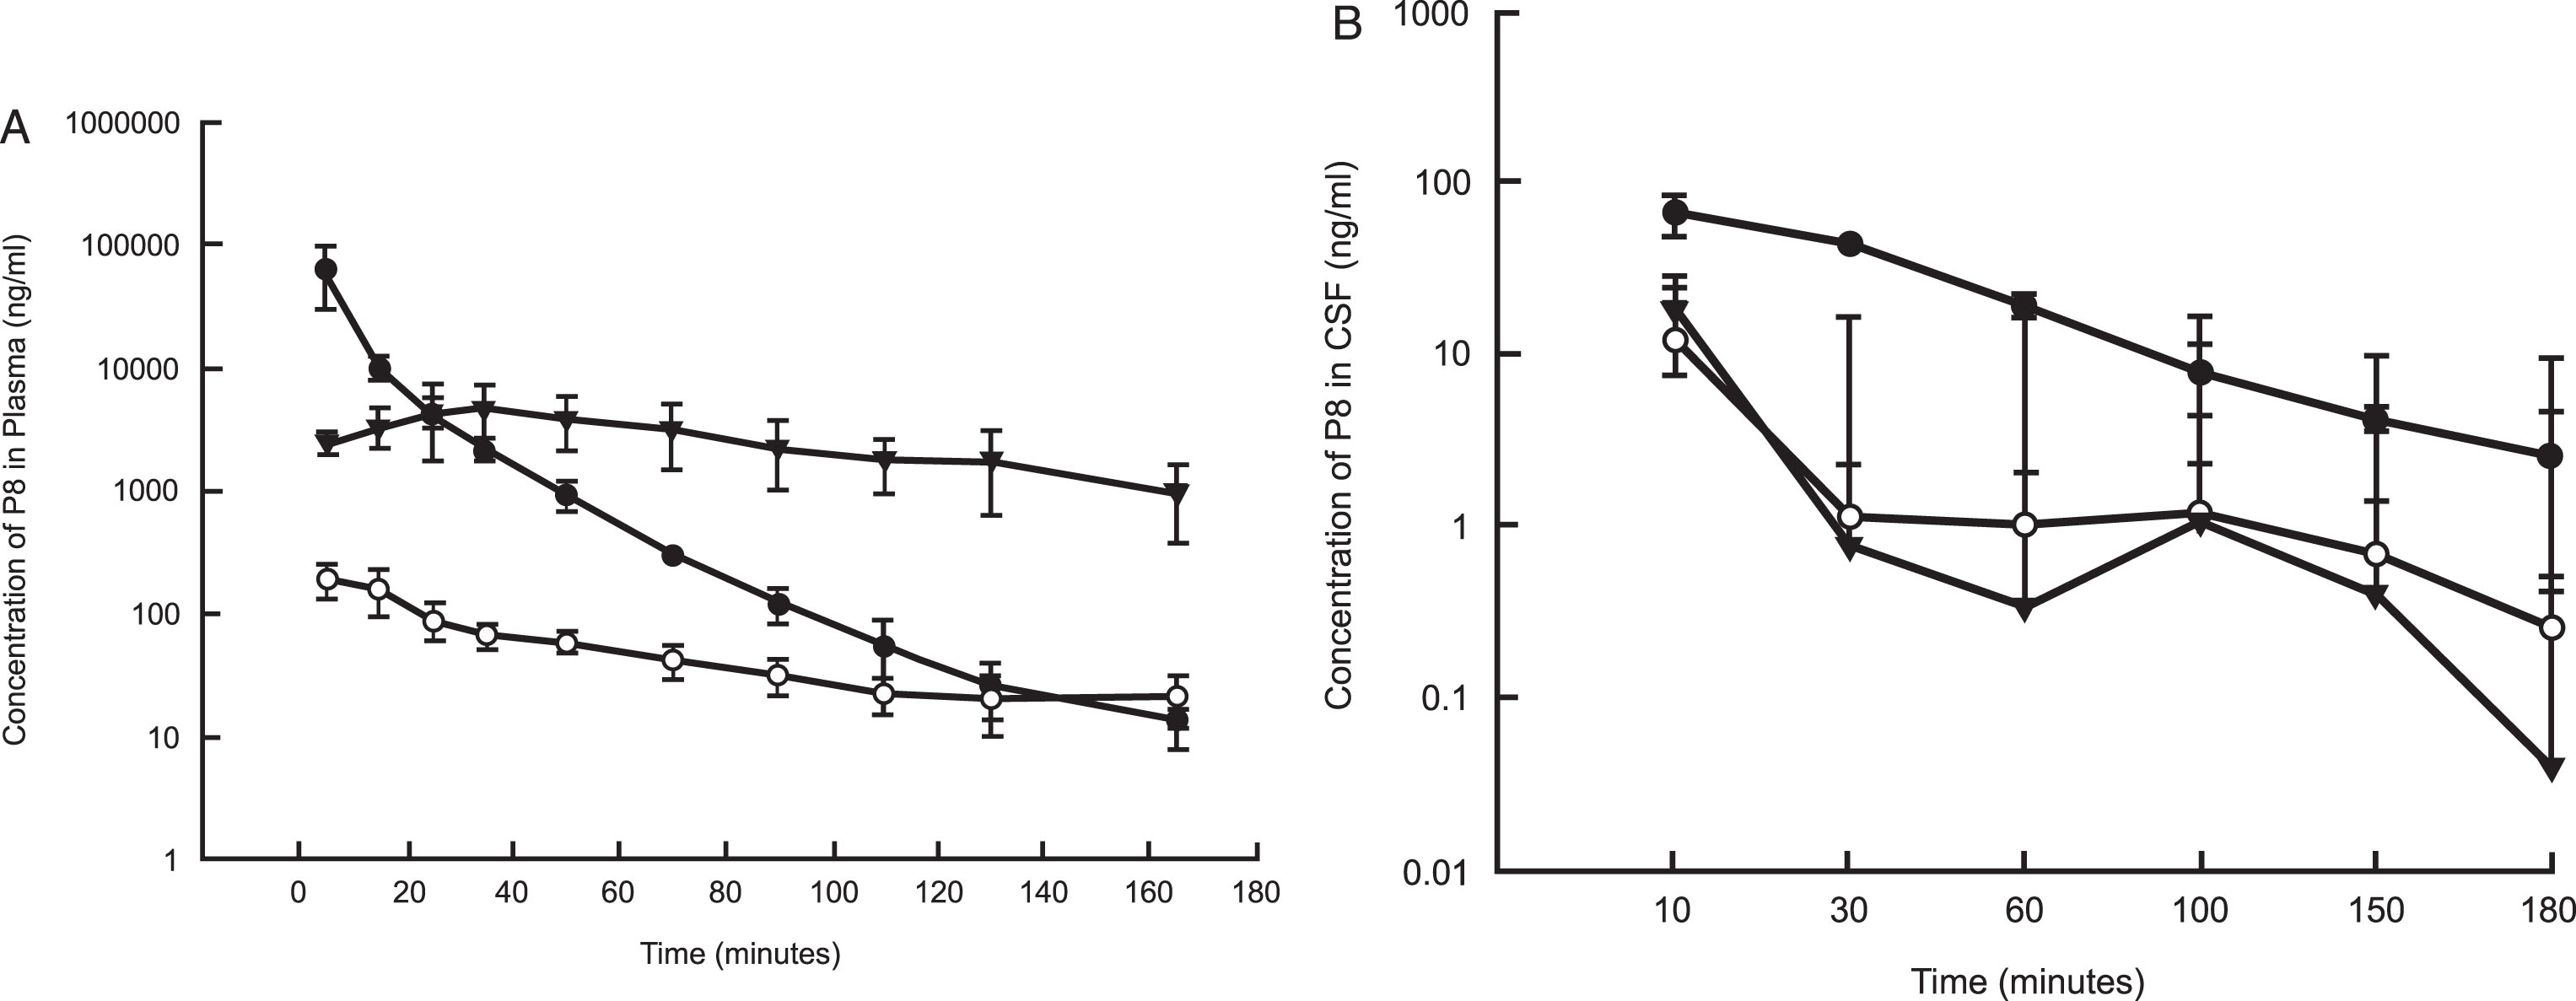
Fig. 4.
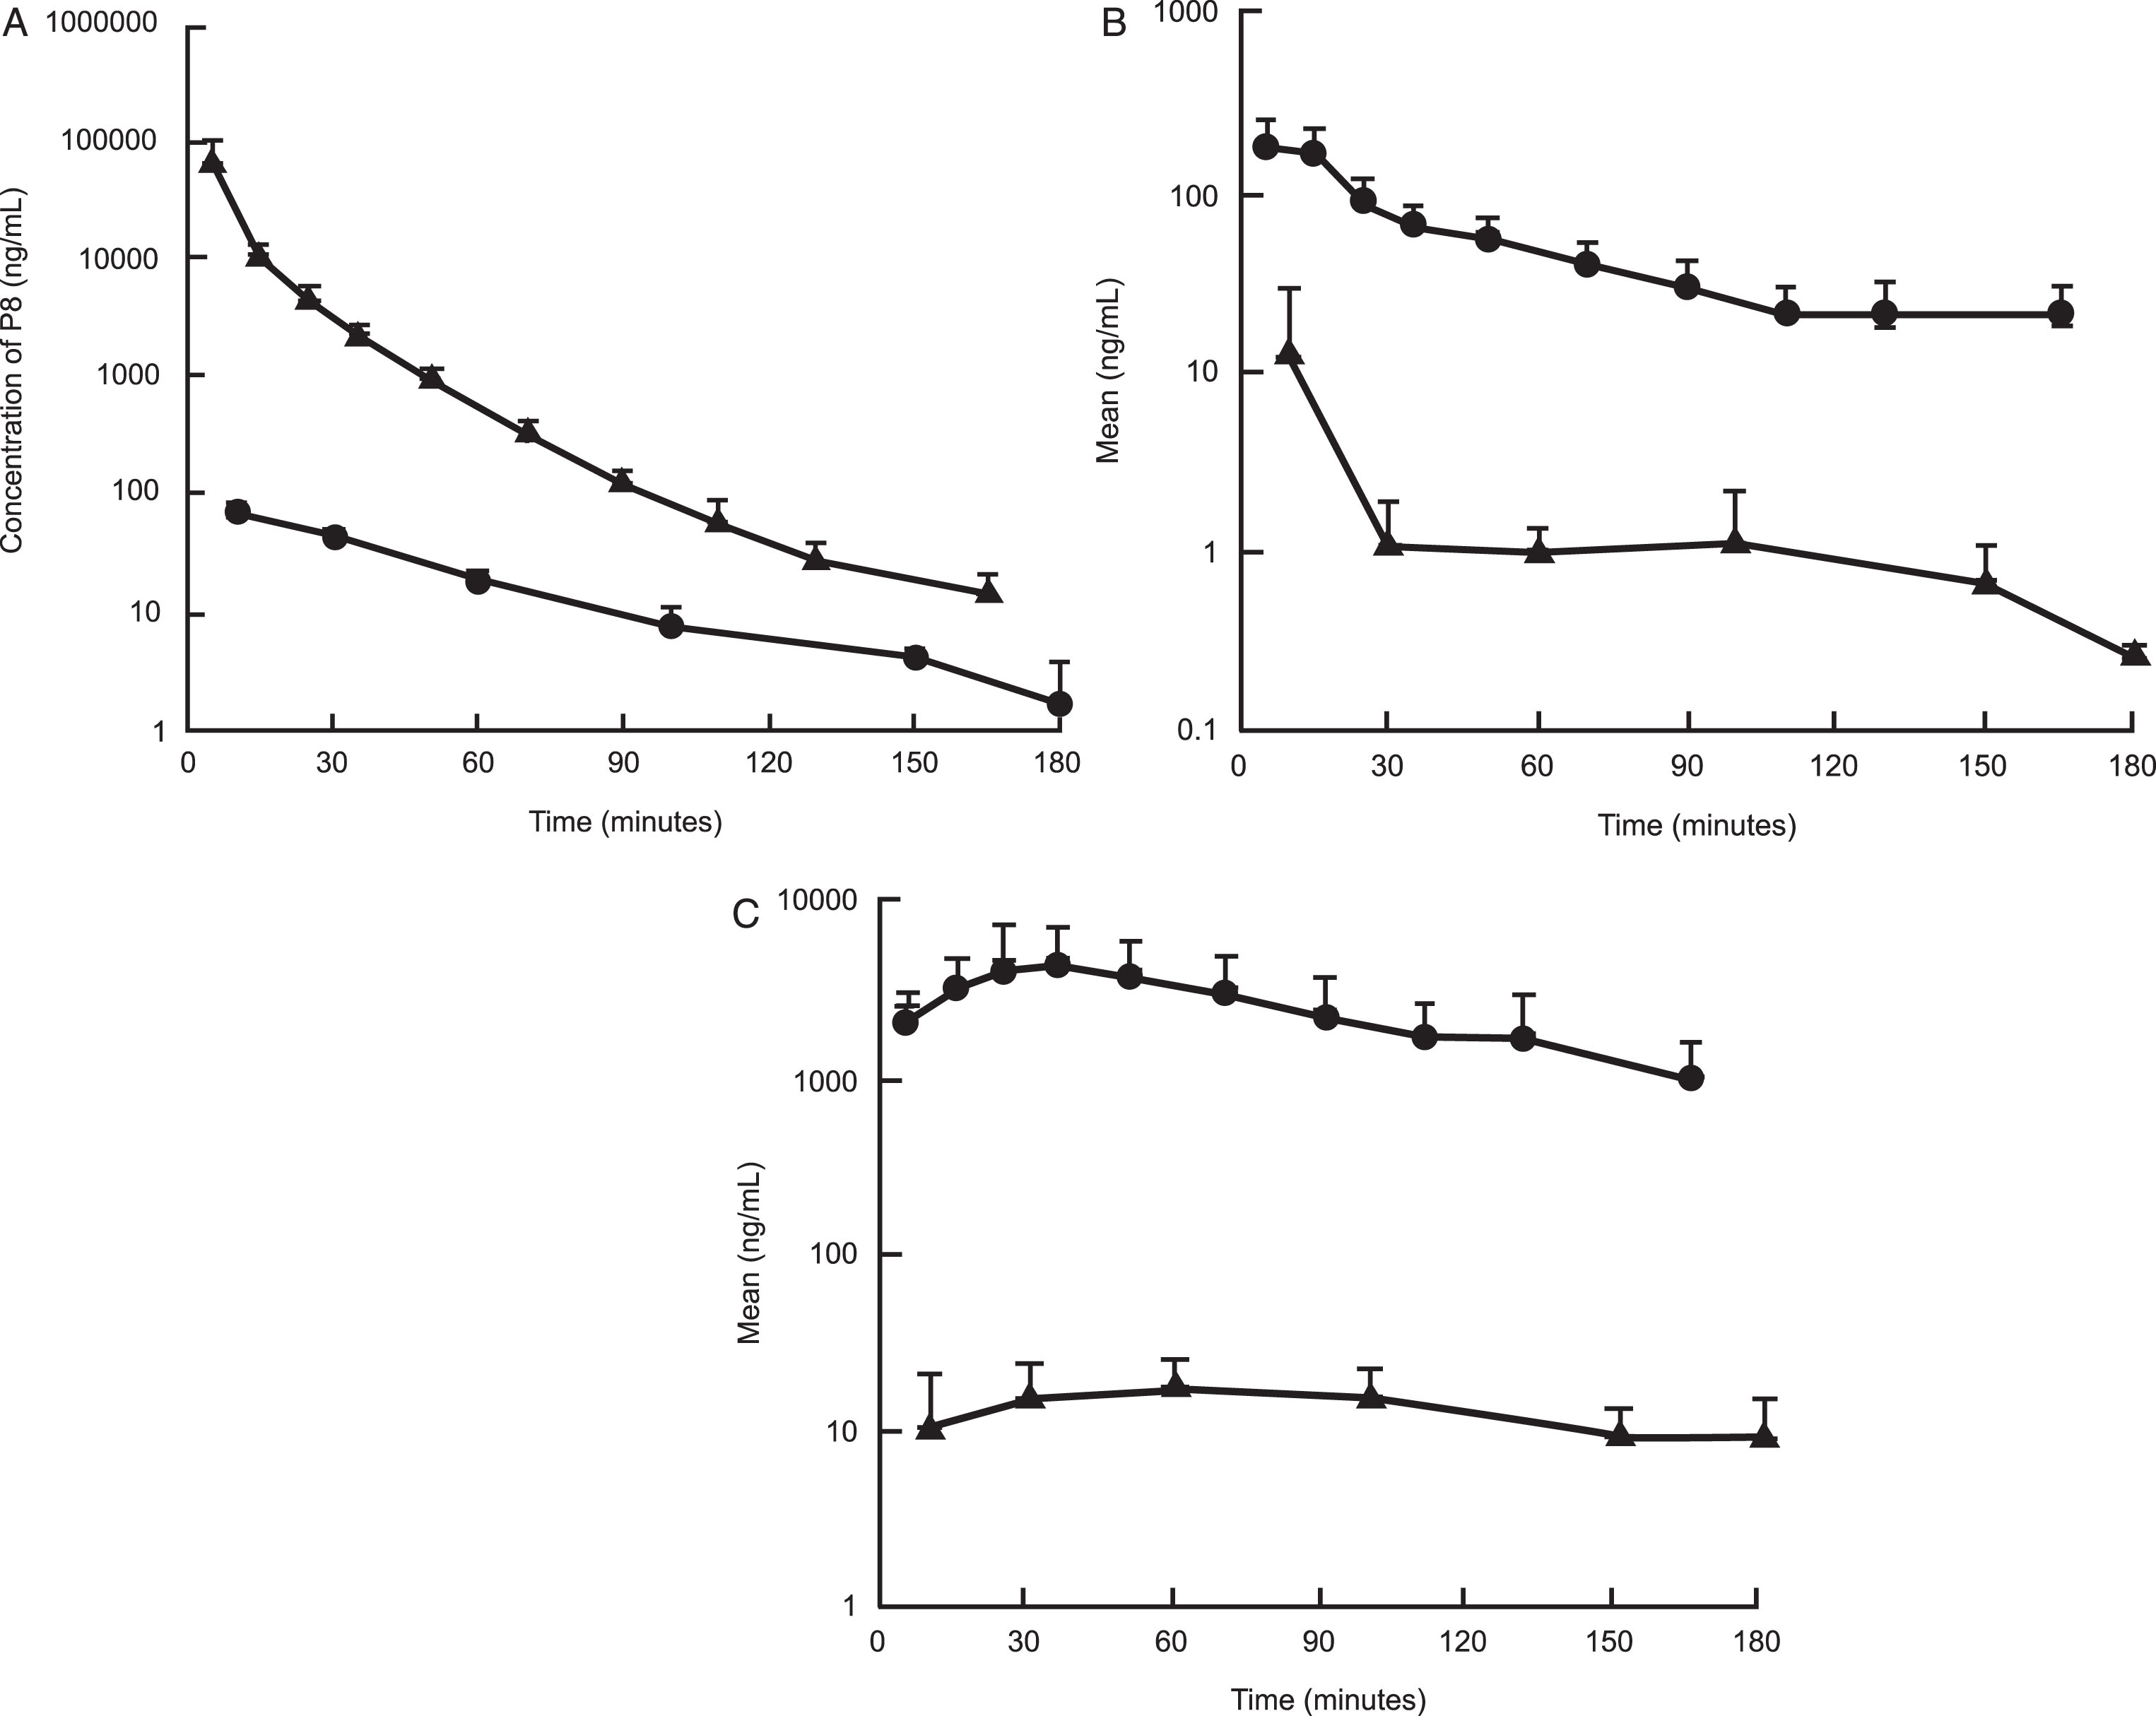
A comparison of the exposure of P8 in rat plasma and CSF following a single dose IV (A), IN (B), and SC (C) administration. Triangles: Concentration of P8 in plasma; Closed circles: Concentration of P8 in CSF.
Following IN dose administration, P8 exposure was observed with a mean plasma AUC value of 8,780±1910 ng·min/mL with a mean Cmax value of 197±62.7 ng/mL. The time to peak concentration (Tmax) was 5 min post dose administration, suggesting rapid absorption of P8 (Tables 4 and 6 and Fig. 3A, B). Normalizing the AUC values for the IV and IN routes of administration, the percent of dose absorbed following IN administration was estimated to be about 2.8%. The mean P8 CSF AUC value was 330±291 ng·min/mL with a mean Cmax value of 12.4±17.7 ng/mL. The mean CSF Tmax value was 26.7 min, suggesting a slower movement into the CSF from the plasma. Following IN administration, the CSF exposure represented about 3.8% of the plasma exposure and was higher than the percent of exposure measured following IV administration. P8 was still quantifiable in the plasma at the last time point suggesting that concentrations were measurable beyond 3 h, whereas for the CSF, the last time point was BLQ (Fig. 4B and Table 4).
Table 4
Individual and mean P8 concentrations (ng/mL) in rat plasma and CSF following a single intranasal dose (5.5 mg/kg). cBelow the Quantifiable Limit <0.500 ng/mL; sufficient signal to noise to report as estimates
| Matrix | Time (min) | Rat I.D. | Meana | SDa | ||
| Rat 1 | Rat 2 | Rat 3 | ||||
| Plasma | 0 | BQL | BQL | BQL | 0.00 | 0.00 |
| 5 | 137 | 262 | 191 | 197 | 62.7 | |
| 15 | 102 | 234 | 150 | 162 | 66.8 | |
| 25 | 60.8 | 123b | 90.6 | 91.5 | 31.1 | |
| 35 | 53.7 | 85.9 | 66.0 | 68.5 | 16.2 | |
| 50 | 66.1 | 67.7 | 45.1 | 59.6 | 12.6 | |
| 70 | 37.6 | 55.3 | 32.1 | 41.7 | 12.1 | |
| 90 | 32.2 | 42.8 | 20.7 | 31.9 | 11.1 | |
| 110 | 26.0 | 27.0 | 13.9 | 22.3 | 7.29 | |
| 130 | 33.2 | 15.0 | 14.3 | 20.8 | 10.7 | |
| 165 | 32.7 | 14.9 | 17.1 | 21.6 | 9.70 | |
| CSF | 0 | BQL | BQL | BQL | 0.00 | 0.00 |
| 10 | 0.397 c | 3.09 | 32.8 | 12.1 | 18.0 | |
| 30 | 0.409 c | 1.03 | 1.95 | 1.13 | 0.775 | |
| 60 | 1.18 | 0.632 | 1.28 | 1.03 | 0.349 | |
| 100 | 0.537 | 2.39 | 0.532 | 1.15 | 1.07 | |
| 150 | 0.581 | 0.372 c | 1.16 | 0.704 | 0.408 | |
| 180 | 0.259 c | 0.307 c | 0.225 c | 0.264 | 0.0412 | |
[i] c Below the Quantifiable Limit <0.500 ng/mL; sufficient signal to noise to report as estimates.
Following SC dose administration, P8 exposure was observed with a mean plasma AUC value of 443,000±200,000 ng·min/mL with a mean Cmax value of 5390±2330 ng/mL. The time to peak concentration (Tmax) was 25±10 min post dose administration, suggesting slower absorption by the subcutaneous route relative to administration in the nasal cavity. After correcting for the dose administered, the mean plasma exposure was 25-fold higher following SC administration relative to IN administration. A comparison of the SC AUC to the IV AUC showed that the percent of dose absorbed following SC administration was 65%, which as expected, was 25-fold higher than the values observed following IN administration. The mean P8 CSF AUC value was 2,380±1,030 ng·min/mL with a mean Cmax value of 19.8±8.46 ng/mL. The mean CSF Tmax value was 43±29 min. Following SC administration, the CSF exposure represented about 0.5% of the plasma exposure, which is more consistent with that observed following IV administration (Tables 5 and 6, Fig. 3). Additionally, the plasma concentrations appeared to be more stable and were clearly above the LLOQ at the last measurable time point for both matrices.
Table 5
Individual and mean P8 concentrations (ng/mL) in rat plasma and CSF following a single subcutaneous dose (11.0 mg/kg). BQL, Below the Quantifiable Limit <1.00 ng/mL in plasma and <0.500 ng/mL in CSF
| Matrix | Time (min) | Rat I.D. | Meana | SDa | ||
| Rat 1 | Rat 2 | Rat 3 | ||||
| Plasma | 0 | BQL | BQL | BQL | 0.00 | 0.00 |
| 5 | 3,090 | 2,420 | 2,050 | 2,520 | 527 | |
| 15 | 4,790 | 2,320 | 3,090 | 3,400 | 1,260 | |
| 25 | 7,740 | 3,370 | 2,520 | 4,540 | 2,800 | |
| 35 | 6,790 | 5,330 | 2,190 | 4,770 | 2,350 | |
| 50 | 4,860 | 5,270 | 1,790 | 3,970 | 1,900 | |
| 70 | 4,360 | 4,150 | 1,220 | 3,240 | 1,760 | |
| 90 | 2,600 | 3,570 | 908 | 2,360 | 1,350 | |
| 110 | 2,120 | 2,410 | 804 | 1,780 | 856 | |
| 130 | 1,870 | 3,030 | 619 | 1,840 | 1,210 | |
| 165 | 1,010 | 1,600 | 356 | 989 | 622 | |
| CSF | 0 | BQL | BQL | BQL | 0.00 | 0.00 |
| 10 | 7.06 | 22.6 | 1.75 | 10.5 | 10.8 | |
| 30 | 25.2 | 12.8 | 8.03 | 15.3 | 8.86 | |
| 60 | 26.5 | 17.1 | 10.3 | 18.0 | 8.13 | |
| 100 | 21.6 | 16.3 | 8.31 | 15.4 | 6.69 | |
| 150 | 11.8 | 10.7 | 5.71 | 9.40 | 3.25 | |
| 180 | 8.60 | 15.7 | 3.18 | 9.16 | 6.28 | |
BQL, Below the Quantifiable Limit <1.00 ng/mL in plasma and <0.500 ng/mL in CSF.
Table 6
Summary of mean P8 pharmacokinetic parameters in plasma and CSF from rats following a single IV, IN, or SC dose administration. Cmax is the observed maximum plasma concentration after dosing, units are ng/mL. Tmax is the time Cmax is reached, units are minutes. T1/2 is apparent plasma terminal half-life, units are minutes. AUC is the area under the concentration-time curve from time 0 to the last measurable plasma concentration, units are ng·min/mL. CL is the systemic plasma clearance calculated by the Dose/AUC, units are mL/min/kg. % F is the absolute bioavailability calculated by dividing the dose normalized plasma AUC of route of administration by the dose normalized plasma AUC of the IV dose, multiplied by 100. CSF Ratio is calculated by dividing the dose normalized CSF AUC of the route of administration by the dose normalized CSF AUC of the IV dose
| Route | Dose (mg/kg) | Parameter | Matrix | Plasma: CSF | ||
| Plasma | CSF | Ratio | ||||
| IV | 11 | CL | 17.6±5.65 | – | ||
| t1/2 | 21.9±8.18 | – | ||||
| AUC | 679,000±250,000 | 3,270±226 | 0.0052±0.0015 | |||
| Vd, L/kg | 0.546±0.306 | – | ||||
| SC | 11 | Cmax | 5,390±2,330 | 19.8±8.46 | 0.0037±0.0005 | |
| Tmax | 25±10 | 43±29 | ||||
| AUC | 443,000±200,000 | 2,380±1,030 | 0.0055±0.00054 | |||
| % F | 65±21 | |||||
| CSF Ratio | 0.72±0.29 | |||||
| IN | 5.5 | Cmax | 197±62.7 | 12.4±17.7 | 0.064±0.093 | |
| Tmax | 5.0±0.0 | 27±29 | ||||
| AUC | 8,780±1,910 | 330±291 | 0.041±0.041 | |||
| % F | 2.8±0.88 | |||||
| CSF Ratio | 0.10±0.092 | |||||
Reduction of Aβ in hippocampus of APP transgenic mice following SC administration of P8
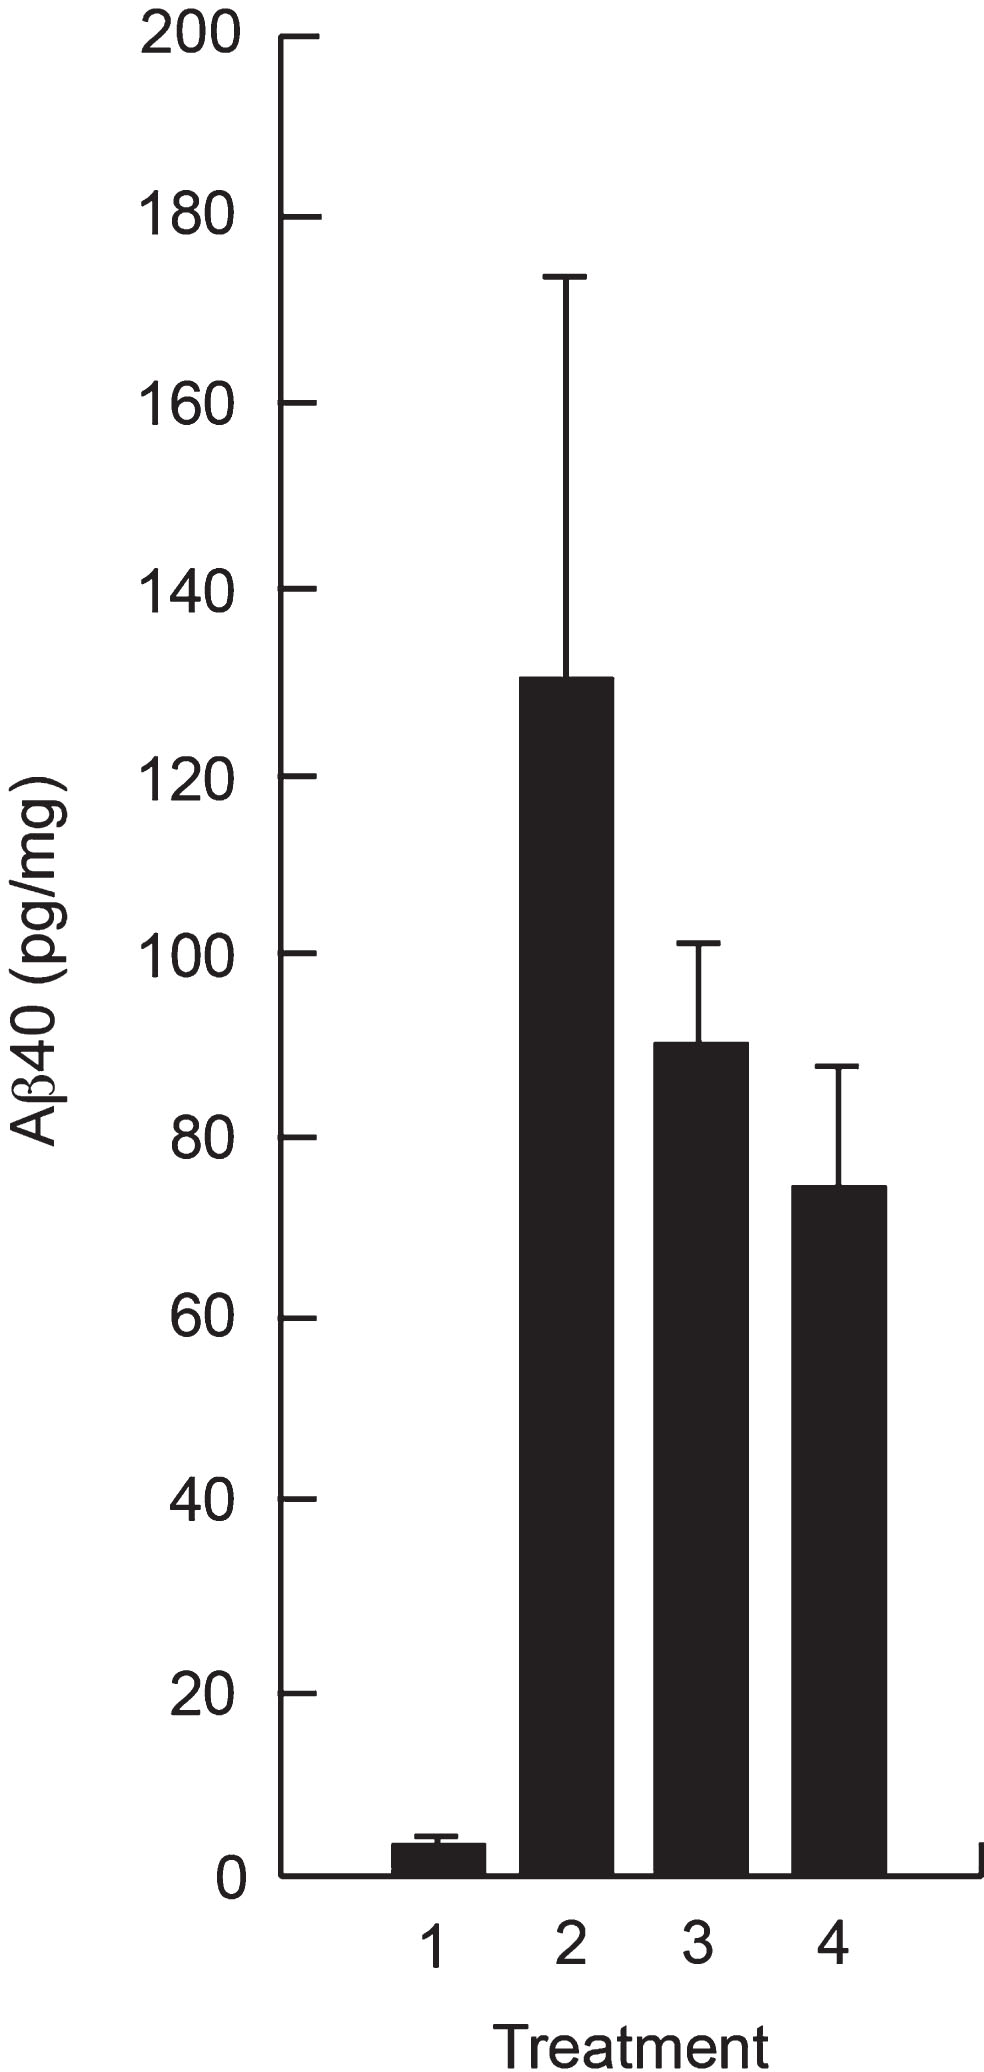
Since the CSF exposure following SC administration represented only ∼ 0.5% of the plasma exposure, we investigated whether SC administration would provide sufficient amounts of P8 in the brain to reduce Aβ 40 in vivo. Figure 5 shows a reduction in Aβ 40 in the hippocampus of Tg mice after treatment with P8 for 14 days, showing that the amount of P8 delivered to the brain following SC administration is sufficient to reduce Aβ in this mouse model.
Fig. 5.
Reduction of Aβ in hippocampal extracts of APPSWE Tg mice following SC administration of P8. APPSWE Tg mice (2–4) at 16 weeks of age (n = 5 per group) or wild type control mice (1) were administered P8 (3 and 4) or PBS (1 and 2) subcutaneously for 14 days once a day (1–3) or twice a day (4). After sacrifice, Aβ 40 analysis was performed on hippocampal extracts by ELISA.
DISCUSSION
The main findings of the current study presented are that: 1) P8 in its unmodified form is stable, with a half-life in mouse and human plasma of greater than 240 and 120 min, respectively, and a half life in mouse and human brain extracts of 120 min. 2) P8 can be delivered to the brain, CSF, and plasma of rats by IV, IN, and SC administration, as detected by two separate methods. While P8 does cross the blood-brain barrier (BBB), its ratio or relative % F is low, being <1% of the plasma concentrations, but this amount is sufficient to reduce Aβ in the brains of APP Tg mice. 3) SC administration gave greater absorption of P8 compared to IN and is the delivery method of choice for the further development of P8 as a clinical candidate.
A significant challenge to the development of drug candidates to treat disorders of the CNS is that the systemic delivery of therapeutics to the CNS is not effective for both small and large molecules, due to the presence of the BBB, which prevents their entry to the brain from the circulating blood. The most important factors determining the extent to which a molecule will be delivered from the blood into the CNS are lipid solubility, molecular mass and charge. Therefore, based simply on lipid solubility and molecular mass, any peptide-based neuro-pharmaceutical would almost certainly be impeded by the BBB. Many therapeutic peptides and proteins, in addition, are ineffective when given orally because they are rapidly degraded in the gastrointestinal tract, resulting in a poor PK profile. Nasal delivery of peptides is a non-invasive alternative to invasive delivery methods to by-pass the BBB [16, 17], utilizing pathways along olfactory and trigeminal nerves innervating the nasal passages [18]. IN delivery was therefore initially investigated in the work outlined here as we had not expected P8 to cross the BBB.
Our results showed the unexpected finding that P8 can be delivered to the brain via the blood by both IV and SC delivery more effectively than by IN delivery. These findings were unexpected because even though the size of P8 at 1007 Da is just at the cut-off limit for molecules that can diffuse across the BBB, its net negative charge was considered unfavorable for it to cross the BBB. So how does P8 get to the brain? We can offer a plausible explanation. We know that P8 selectively binds to AβPP and does so with high affinity (KD of 3.4 nM) as determined by kinetic studies using biolayer interferometry [13]. One possibility therefore is that P8 from the blood gets translocated across the BBB while still bound to AβPP. There are several reports that show the presence of AβPP at the endothelial cell membrane [19–21]. It is possible that AβPP expressed on the interior face of the endothelial cell of the vessels at the BBB can transport P8 by internalization into endosomes upon peptide binding. As is normal for the brain capillary endothelial cells, the internalized endosomes within these cells may then be transported to the neuronal side of the cells and once across, get released. There are distinct advantages of SC administration over either IV or IN. SC administration requires a simple injection opposed to IV. It is less cumbersome and less expensive than IV. SC administration also requires no special devices as for IN delivery. SC administration delivers a more accurate dose of the drug compared to IN administration; IN administration can also produce irritation of the mucosal membrane. While the % F is <1%, our studies with transgenic mice described herein show that the SC administration of P8 can reduce Aβ levels in the hippocampus and CSF by amounts that were similar to those previously reported [13]. Those latter studies [13] utilized osmotic minipumps to directly administer the peptide to the brain. Studies are ongoing to model the PK/PD relationship in these Tg mice following the SC administration of P8, which will inform future human dosing.
Our current and previously published studies [13] offer the potential for a new, early and effective approach for the treatment of AD, based on a strategy that does not target the secretases. These peptide-induced reductions of total Aβ (and of Aβ 40 and Aβ 42) do not modify or inhibit either β- or γ-secretase activities. Our approach is therefore very specific and eliminates the numerous off-target effects of the secretase inhibitors while reducing Aβ to very high levels. Our technology is also the earliest in terms of intervention, as it stops the Aβ from being produced, as opposed to dealing with the effects of Aβ once it has accumulated. It is anticipated that these therapeutics will have a significant impact in both treatment and prevention modes and be useful throughout the course of disease.
CONFLICT OF INTEREST
NND has ownership of stocks in Cenna Biosciences Inc and is an author on patent applications filed by UCSD. Drs. Bruce Morimoto, Marc Azar and David Johnson are employed by separate commercial companies and are consultants for Cenna. Drs. Leah Hanson and William Frey are employed by Health Partners Institute, St. Paul, MN. Neither the companies nor the consultants stand to gain financially or otherwise from this work. They are not a part of the patents or products that may be developed from this work, or part of any grants or gifts. They have no non-financial competing interests, including professional or personal.
ACKNOWLEDGMENTS
This work was supported by NIH grants R43AG043278, R44AG043278 and R43AG055182 to NND.
Individuals or Companies that have assisted in the work: Daniel Dolan, MicroConstants LLC.
Dr. Archie Thurston for discussions and for reviewing the manuscript.
REFERENCES
[1] | Hardy J , Selkoe DJ ((2002) ) The amyloid hypothesis of Alzheimer’s disease: Progress and problems on the road to therapeutics. Science 297: , 353–356. |
[2] | Dawkins E , Small DH ((2014) ) Insights into the physiological function of the P-amyloid precursor protein: Beyond Alzheimer’s disease. J Neurochem 129: , 756–769. |
[3] | Oddo S , Caccamo A , Kitazawa M , Tseng BP , LaFerla FM ((2003) ) Amyloid deposition precedes tangle formation in a triple transgenic model of Alzheimer’s disease. Neurobiol Aging 24: , 1063–1070. |
[4] | Choi YJ , Chae S , Kim JH , Barald KF , Park JY , Lee S-H ((2013) ) Neurotoxic amyloid beta oligomeric assemblies recreated in microfluidic platform with interstitial level of slow flow. Sci Rep 3: , 1921–1927. |
[5] | Takasugi N , Tomita T , Hayashi I , Tsuruoka M , Niimura M , Takahashi Y , Thinakaran G , Iwatsubo, T ((2003) ) The role of presenilin cofactors in the gamma-secretase complex. Nature 422: , 438–441. |
[6] | Ahn K , Shelton CC , Tian Y , Zhang X , Gilchrist ML , Sisodia SS , Li Y-M ((2010) ) Activation and intrinsic gamma-secretase activity of Presenilin 1. Proc Natl Acad Sci USA 107: , 21435–21440. |
[7] | Lleó A , Saura CA ((2011) ) α-secretase substrates and their implications for drug development in Alzheimer’s disease. Curr Top Med Chem 11: , 1513–1527. |
[8] | De Strooper B , Annaert W , Cupers P , Saftig P , Craessaerts K , Mumm JS , Schroeter EH , Schrijvers V , Wolfe MS , Ray WJ , Goate A and Kopan R ((1999) ) Apresenilin-1-dependent gamma-secretase-like protease mediates release of Notch intracellular domain. Nature 398: , 518–522. |
[9] | He G , Luo W , Li P , Remmers C , Netzer WJ , Hendrick J , Bet-tayeb K , Flajolet M , Gorelick F , Wennogle LP , Greengard P ((2010) ) Gamma-secretase activating protein is a therapeutic target for Alzheimer’s disease. Nature 467: , 95–98. |
[10] | Kounnas MZ , Danks AM , Cheng S , Tyree C , Ackerman E , Zhang X , Ahn K , Nguyen P , Comer, D , Mao L , Yu C , Pleynet D , Digregorio, PJ , Velicelebi G , Stauderman, KA , Comer WT , Mobley WC , Li YM , Sisodia SS , Tanzi RE , Wagner SL ((2010) ) Modulation of gamma-secretase reduces beta-amyloid deposition in a transgenic mouse model of Alzheimer’s disease. Neuron 67: , 769–780. |
[11] | Fagan T. Liver Tox Ends Janssen BACE program ((2018) ) Alzheimer Research Forum, https://www.alzforum.org/news/research-news/liver-tox-ends-janssen-bace-program, Posted 18 May 2018, Accessed 21 May 2018. |
[12] | Egan MF , Kost J , Tariot PN , Aisen PS , Cummings JL , Vellas B , Sur C , Mukai Y , Voss T , Furtek C , Mahoney E , Mozley L , Vandenberghe R , Mo Y , Michelson D ((2018) ) Randomized trial of Verubecestat for mild-to-moderate Alzheimer’s disease. N Engl J Med 378: , 1691–1703. |
[13] | Dewji NN , Singer SJ , Masliah E , Rockenstein E , Kim M , Harber M , Horwood T ((2015) ) Peptides of presenilin-1 bind the amyloid precursor protein ectodomain and offer a novel and specific therapeutic approach to reduce ß-amyloid in Alzheimer’s disease. PLoS One 10: , e0122451. |
[14] | Hsiao K , Chapman P , Nilsen S , Eckman C , Harigaya Y , Younkin S , Yang F , Cole G ((1996) ) Correlative memory deficits, Aß elevation, and amyloid plaques in transgenic mice. Science 274: , 99–102. |
[15] | Thorne RG , Pronk GJ , Padmanabhan V , Frey WH ((2004) ) Delivery of insulin-like growth factor-1 to the rat brain and spinal cord along olfactory and trigeminal pathways following intranasal administration. Neuroscience 127: , 481–496. |
[16] | Ross TM , Martinez PM , Renner JC , Thorne RG , Hanson LR , Frey WH 2nd ((2004) ) Intranasal administration of interferon beta bypasses the blood-brain barrier to target the central nervous system and cervical lymph nodes: A non-invasive treatment strategy for multiple sclerosis. J Neuroimmunol 151: , 66–77. |
[17] | Alcalá-Barraza SR , Lee MS , Hanson LR , McDonald AA , Frey WH 2nd , McLoon LK ((2010) ) Intranasal delivery of neurotrophic factors BDNF, CNTF, EPO, and NT-4 to the CNS. J Drug Target 18: , 179–190. |
[18] | Crowe TP , Greenlee MHW , Kanthasamy AG , Hsu WH ((2018) ) Mechanism of intranasal drug delivery directly to the brain. Life Sci 195: , 44–52. |
[19] | Forloni G , Demicheli F , Giorgi S , Bendotti C , Angeretti N ((1992) ) Expression of amyloid precursor protein mRNAs in endothelial, neuronal and glial cells: Modulation by interleukin-1. Mol Brain Res 16: , 128–134. |
[20] | Kitazume S , Tachida Y , Kato M ((2010) ) Brain endothelial cells produce amyloid ß from amyloid precursor protein 770 and preferentially secrete the O-glycosylated form. J Biol Chem 285: ,40097–40103. |
[21] | d’Uscio LV , He T , Katusic ZS ((2017) ) Expression and processing of amyloid precursor protein in vascular endothelium. Physiology 32: , 20–32. |


