
Atomic Force Microscopy Analysis of EPPS-Driven Degradation and Reformation of Amyloid-β Aggregates
Abstract
Amyloid-β (Aβ) peptides can be aggregated into β-sheet rich fibrils or plaques and deposited on the extracellular matrix of brain tissues, which is a hallmark of Alzheimer’s disease. Several drug candidates have been designed to retard the progression of the neurodegenerative disorder or to eliminate toxic Aβ aggregates. Recently, 4-(2-Hydroxyethyl)-1-piperazinepropanesulfonic acid (EPPS) has emerged as a promising drug candidates for elimination of toxic Aβ aggregates. However, the effect of EPPS on the degradation of Aβ aggregates such as fibrils has not yet been fully elucidated. In this article, we investigate the EPPS-driven degradative behavior of Aβ aggregates at the molecular level by using high-resolution atomic force microscopy. We synthesized Aβ fibrils and observed degradation of fibrils following treatment with various concentrations (1–50 mM) of EPPS for various time periods. We found that degradation of Aβ fibrils by EPPS increased as a function of concentration and treatment duration. Intriguingly, we also found regeneration of Aβ aggregates with larger sizes than original aggregates at high concentrations (10 and 50 mM) of EPPS. This might be attributed to a shorter lag phase that facilitates reformation of Aβ aggregates in the absence of clearance system.
INTRODUCTION
The production and deposition of amyloid-β peptide (Aβ) are the hallmarks of Alzheimer’s disease (AD) [1–3]. Aβ peptides derived from the amyloid-β protein precursor can aggregate into insoluble amyloid aggregates such as Aβ oligomers, fibrils, and plaques [1, 2, 4]. There have been many attempts to eliminate Aβ aggregates in order to alleviate or cure AD. For example, plasma jets [5], laser radiation [6], ultrasonication [7], thermal energy [8], and drugs [9, 10] have been tried to remove Aβ aggregates. Of these approaches, the development of drugs that can degrade the Aβ aggregates has been the focus of research because these agents offer the most realistic way to reach Aβ aggregates inside the body.
Most drugs targeting Aβ can be categorized by three different mechanisms: 1) reducing the production of the Aβ peptides by using inhibitors such as γ-secretase or β-secretase; 2) eliminating Aβ monomers and oligomers before forming Aβ fibrils or plaques in the initial formation stages; 3) disrupting Aβ aggregates in the brain [4, 11, 12]. Despite these methods, there have been a few reports on drug candidates that could possibly cure AD. So far, drug candidate (4-(2-Hydroxyethyl)-1-piperazinepropanesulfonic acid (EPPS)) have been identified, and tested for effectiveness in degradation of Aβ aggregates in vitro or in vivo [13]. In particular, EPPS is believed to be the most promising drug candidate offering the hope of a cure for AD. Specifically, Kim et al. recently reported highly effective EPPS-driven degradation of toxic Aβ aggregates in vitro and in vivo [14]. However, despite its importance, the detailed mechanism of EPPS-driven Aβ degradation at the molecular level has not yet been fully elucidated.
In this study, we demonstrated the EPPS-driven degradation of Aβ1 - 42 amyloid aggregates in vitro using atomic force microscopy (AFM). As a powerful nanomechanical imaging technique, AFM has been used in investigating amyloid formation and polymorphism in vitro [15, 16]. AFM analysis offered abundant and visual data regarding the degradation of Aβ1 - 42 amyloid aggregates at different EPPS concentrations (1–50 mM) and treatment times (0–3 days). Our results shed light on drug discovery and in vitro examination at the molecular level of EPPS for the prevention and treatment of AD.
MATERIALS AND METHODS
Preparation of Aβ and EPPS treatment
Lyophilized amyloid-β 42 (Aβ1 - 42) peptide (TOCRIS, UK) was dissolved in 1,1,1,3,3,3-Hexafluoro-2-Propanol (HFIP, Sigma-Aldrich, St. Louis, MO, USA). The peptide (1 mM) was distributed in micro-centrifuge tubes and then the peptide solution was dried overnight. The peptide transformed into a thin film at the bottom of the tubes. The film was dissolved in dimethyl sulfoxide (Sigma-Aldrich, St. Louis, MO, USA) and the concentration became 5 mM. To synthesis of Aβ fibrils, the prepared solution was resuspended in a 10 mM hydrochloric acid (HCl) solution. The final concentration of the Aβ solution was 50 μM. The solution was incubated in an oil bath at 37°C for 3 days. We then dialyzed the solution against distilled water for 60 h by using 50 kDa dialysis membranes (Biovision Inc, USA). The incubated Aβ solution and 1–50 mM of EPPS (Sigma-Aldrich, USA) solution mixed at a volume ratio of (1:1) and then the mixed solution was incubated for 1–3 days at 37°C.
AFM imaging of Aβ aggregates with EPPS treatment
The Aβ solution (50 μL) was deposited on clean mica for 5 min and then washed 3 times with 100 μL distilled water (H2O) and gently dried under pure nitrogen gas [17–19]. AFM images of Aβ fibrils with or without EPPS were acquired using a Multimode V instrument (Veeco, USA) and an Innova (Bruker, USA) operated in tapping mode AFM in the air and at room temperature. To minimize the noise from the air, an AFM housing system was used. A silicon cantilever (TESP-V2, Bruker, USA) was used and scan rate was 0.5 Hz. The resonance frequency of the cantilever for imaging was ∼300 kHz. All AFM imaging areas were 100 μm2. The acquired images were evaluated using NanoScope analysis software 1.8 version. Cross-sectional analysis and calculation of surface roughness were conducted using the same software [7, 17–19].
RESULTS AND DISCUSSIONS
EPPS-driven degradation of Aβ fibrils at low concentration of Aβ solution
We synthesized 50 μM Aβ1 - 42 amyloid fibrils to observe the degradation of amyloid fibrils by treatment with drug candidates (Fig. 1a). We note that Aβ fibril formation was conducted in a strongly acidic solution (pH 2) for fast and stable fibrillation [7, 17–20]. Meanwhile, based on a previous report that said that EPPS works well at pH 7.3–8.7 [13, 14], we dialyzed the prepared Aβ solution to replace the acidic solution with distilled water (H2O) (Fig. 1b). There was no significant change in both morphology and density of Aβ fibrils before and after dialysis. The Aβ fibrils are well dispersed in the solution. In the first place, we thought that the 50 μM Aβ is too dense to study the effects of EPPS on the degradation of the Aβ fibrils. Thus, we diluted the Aβ solution from 50 to 5 μM, resulting in distinct individual Aβ fibrils, as seen on AFM images (under current experimental conditions) distinctively in our AFM imaging condition (Fig. 1c).
Fig.1
AFM images of Aβ fibrils. (a) 50 μM of Aβ fibrils in 10 mM of hydrochloric acid (HCl) solution (approximately adjusted to pH 2). (b) 50 μM of Aβ fibrils after dialysis in distilled water (H2O) for 60 h. (c) 5 μM of Aβ fibrils diluted from (b). (d, e) AFM images of 5 mM (d) and 10 mM (e) of EPPS treated Aβ fibrils with different incubation times (6–24 h).
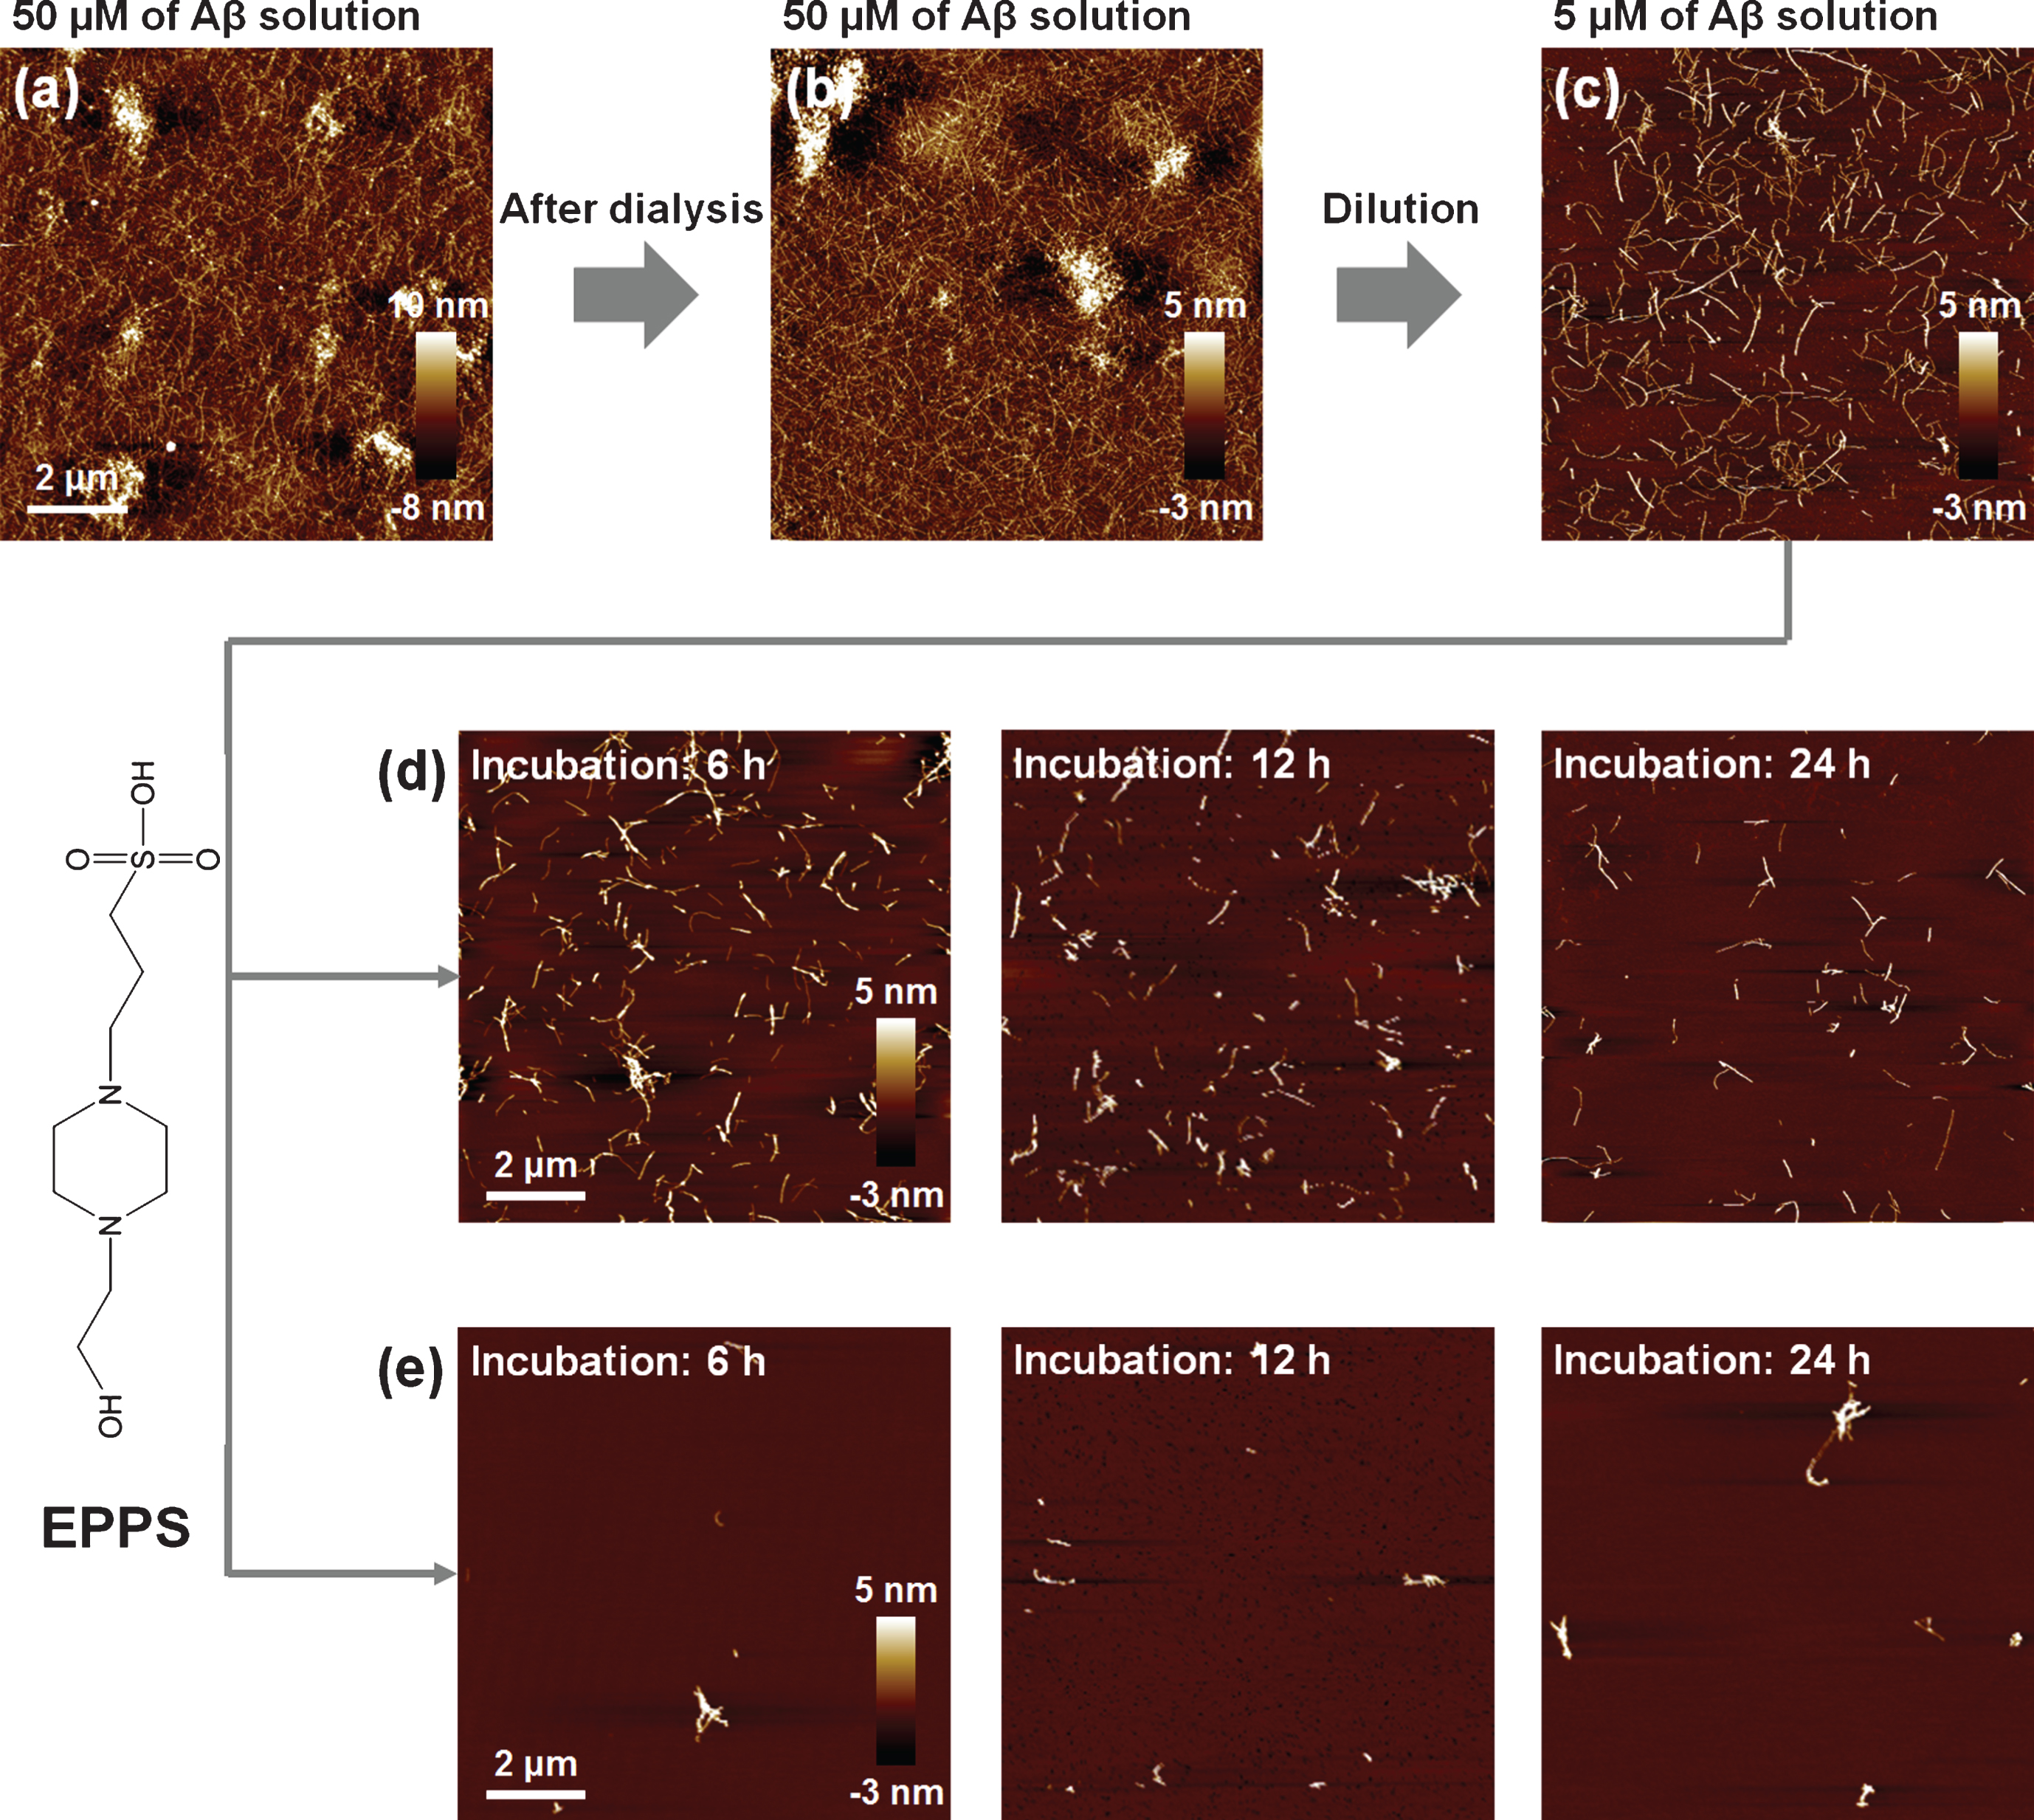
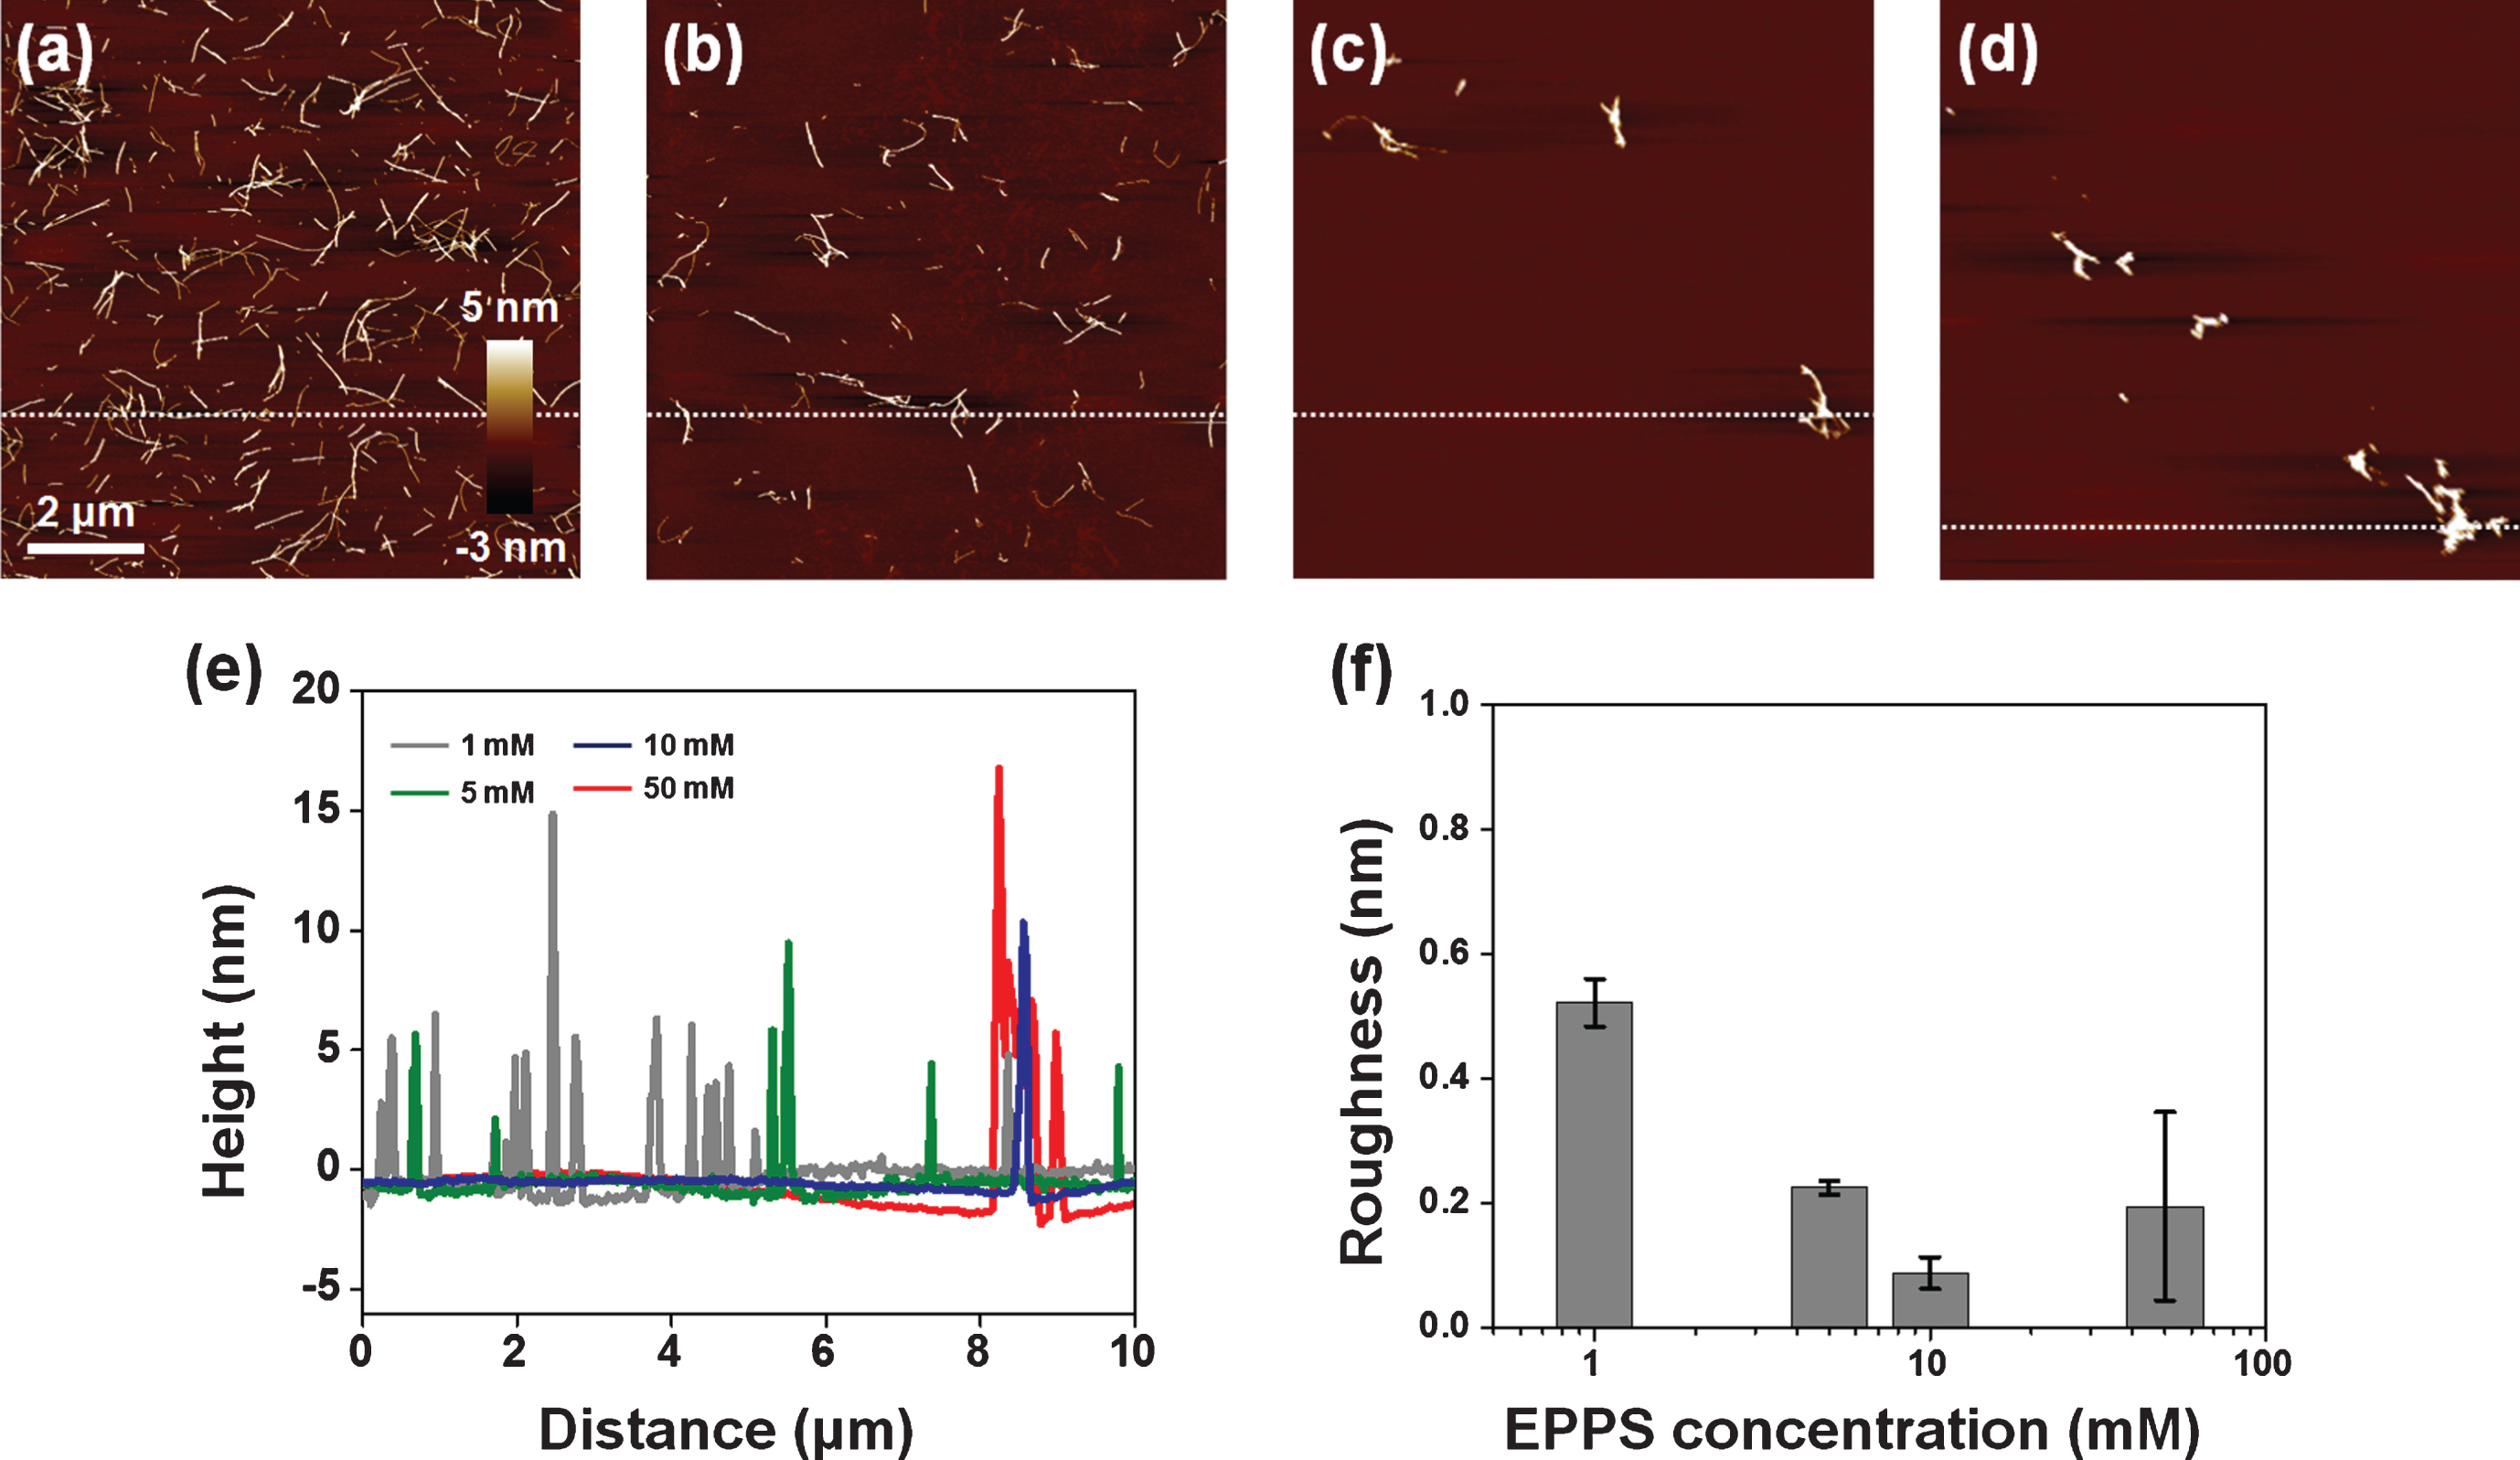
We treated a Aβ solution (5 μM) with 5 and 10 mM of EPPS, respectively, for different incubation times (6, 12, and 24 h, respectively) at 37°C and we investigated the changes by AFM (Fig. 1d, e). As expected, EPPS directly binds on the preformed Aβ aggregates and works well, i.e., increased degradation of Aβ fibrils with rising EPPS concentrations and incubation times. Consistent with previous reports, increased incubation time in the presence of EPPS led to a reduction in the densities and lengths of fibrils [14]. Moreover, a drastic degradation of Aβ fibrils was observed at 10 mM of EPPS; incubation with 10 mM EPPS for 6 h seemed more effective than the results obtained following a 24 h-incubation time in the presence of 5 mM of EPPS. This implied that the higher concentration of EPPS was more critical than the longer incubation time for Aβ degradation. In this context, we conducted the concentration test with 1–50 mM of EPPS against Aβ fibrils (5 μM) for 1 day (Fig. 2a-d). We found that treatment in the presence of a higher concentration of EPPS led to the decomposition of more fibrils. In specific, we observed that the 5 mM of EPPS is more effective in degradation of Aβ fibrils than 1 mM of EPPS treatment. For quantitative analysis of Aβ fibrils, we measured the height of Aβ fibrils with AFM images (Fig. 2e). The heights of Aβ fibrils treated with 1 mM of EPPS were changed from 3.13±1.80 (non-treated Aβ fibrils) to 3.71±2.48 nm (gray line). Higher concentrations of EPPS (5 and 10 mM) treatment slightly diminished the heights of Aβ fibrils. Following treatment with 50 mM of EPPS, the height of Aβ fibrils abruptly increased from 3.13±1.80 to 6.90±3.54 nm. Aggregates of Aβ fibrils appeared on the AFM images (Fig. 2c, d). This increase of the height of degraded Aβ fibrils may be attributed to the increase in the number of free ends through breakage of the fibril [21]. Concretely, as the number of free ends of degraded Aβ fragment increases, they can be aggregated via chemical functional groups in free ends. This trend was consistent with the results of the surface roughness analysis (Fig. 2f). As the EPPS concentration (1–50 mM) used to treat Aβ fibrils increased, we found that the surface roughness decreased from 0.52±0.04 to 0.20±0.15 nm. The trend towards a lower surface roughness showed that Aβ fibrils were diminished by EPPS treatment.
Fig.2
AFM images of EPPS treated Aβ fibrils (5 μM) with different concentrations of EPPS (1–50 mM). (a) 1 mM of EPPS. (b) 5 mM of EPPS. (c) 10 mM of EPPS. (d) 50 mM of EPPS. Incubation time: 1 day. (e) Cross section profiles of Aβ fibrils on images (a-d). We sectioned across the white dot line on images. (f) Differences of surface roughness by various EPPS treatment to Aβ fibrils.
Interestingly, small aggregates that could be Aβ fragments were still found after incubation at 50 mM of EPPS—a concentration that was 10,000-fold higher than the prepared Aβ solution (5 μM). Seemingly, this result indicated that EPPS could not perfectly remove Aβ fibrils, albeit at a very high concentration. It is well known that very small amounts of amyloid fragments act as seed nuclei that can facilitate amyloid reformation much more rapidly than initial amyloid formation [7]. Even though such reformed amyloid aggregates could not elicit directly cytotoxicity for neurons in the brain, the facilitated amyloid aggregation is likely to make the prognosis worse in the treatment of Alzheimer’s disease [22].
EPPS-driven degradation of Aβ fibrils at high concentration of Aβ solution
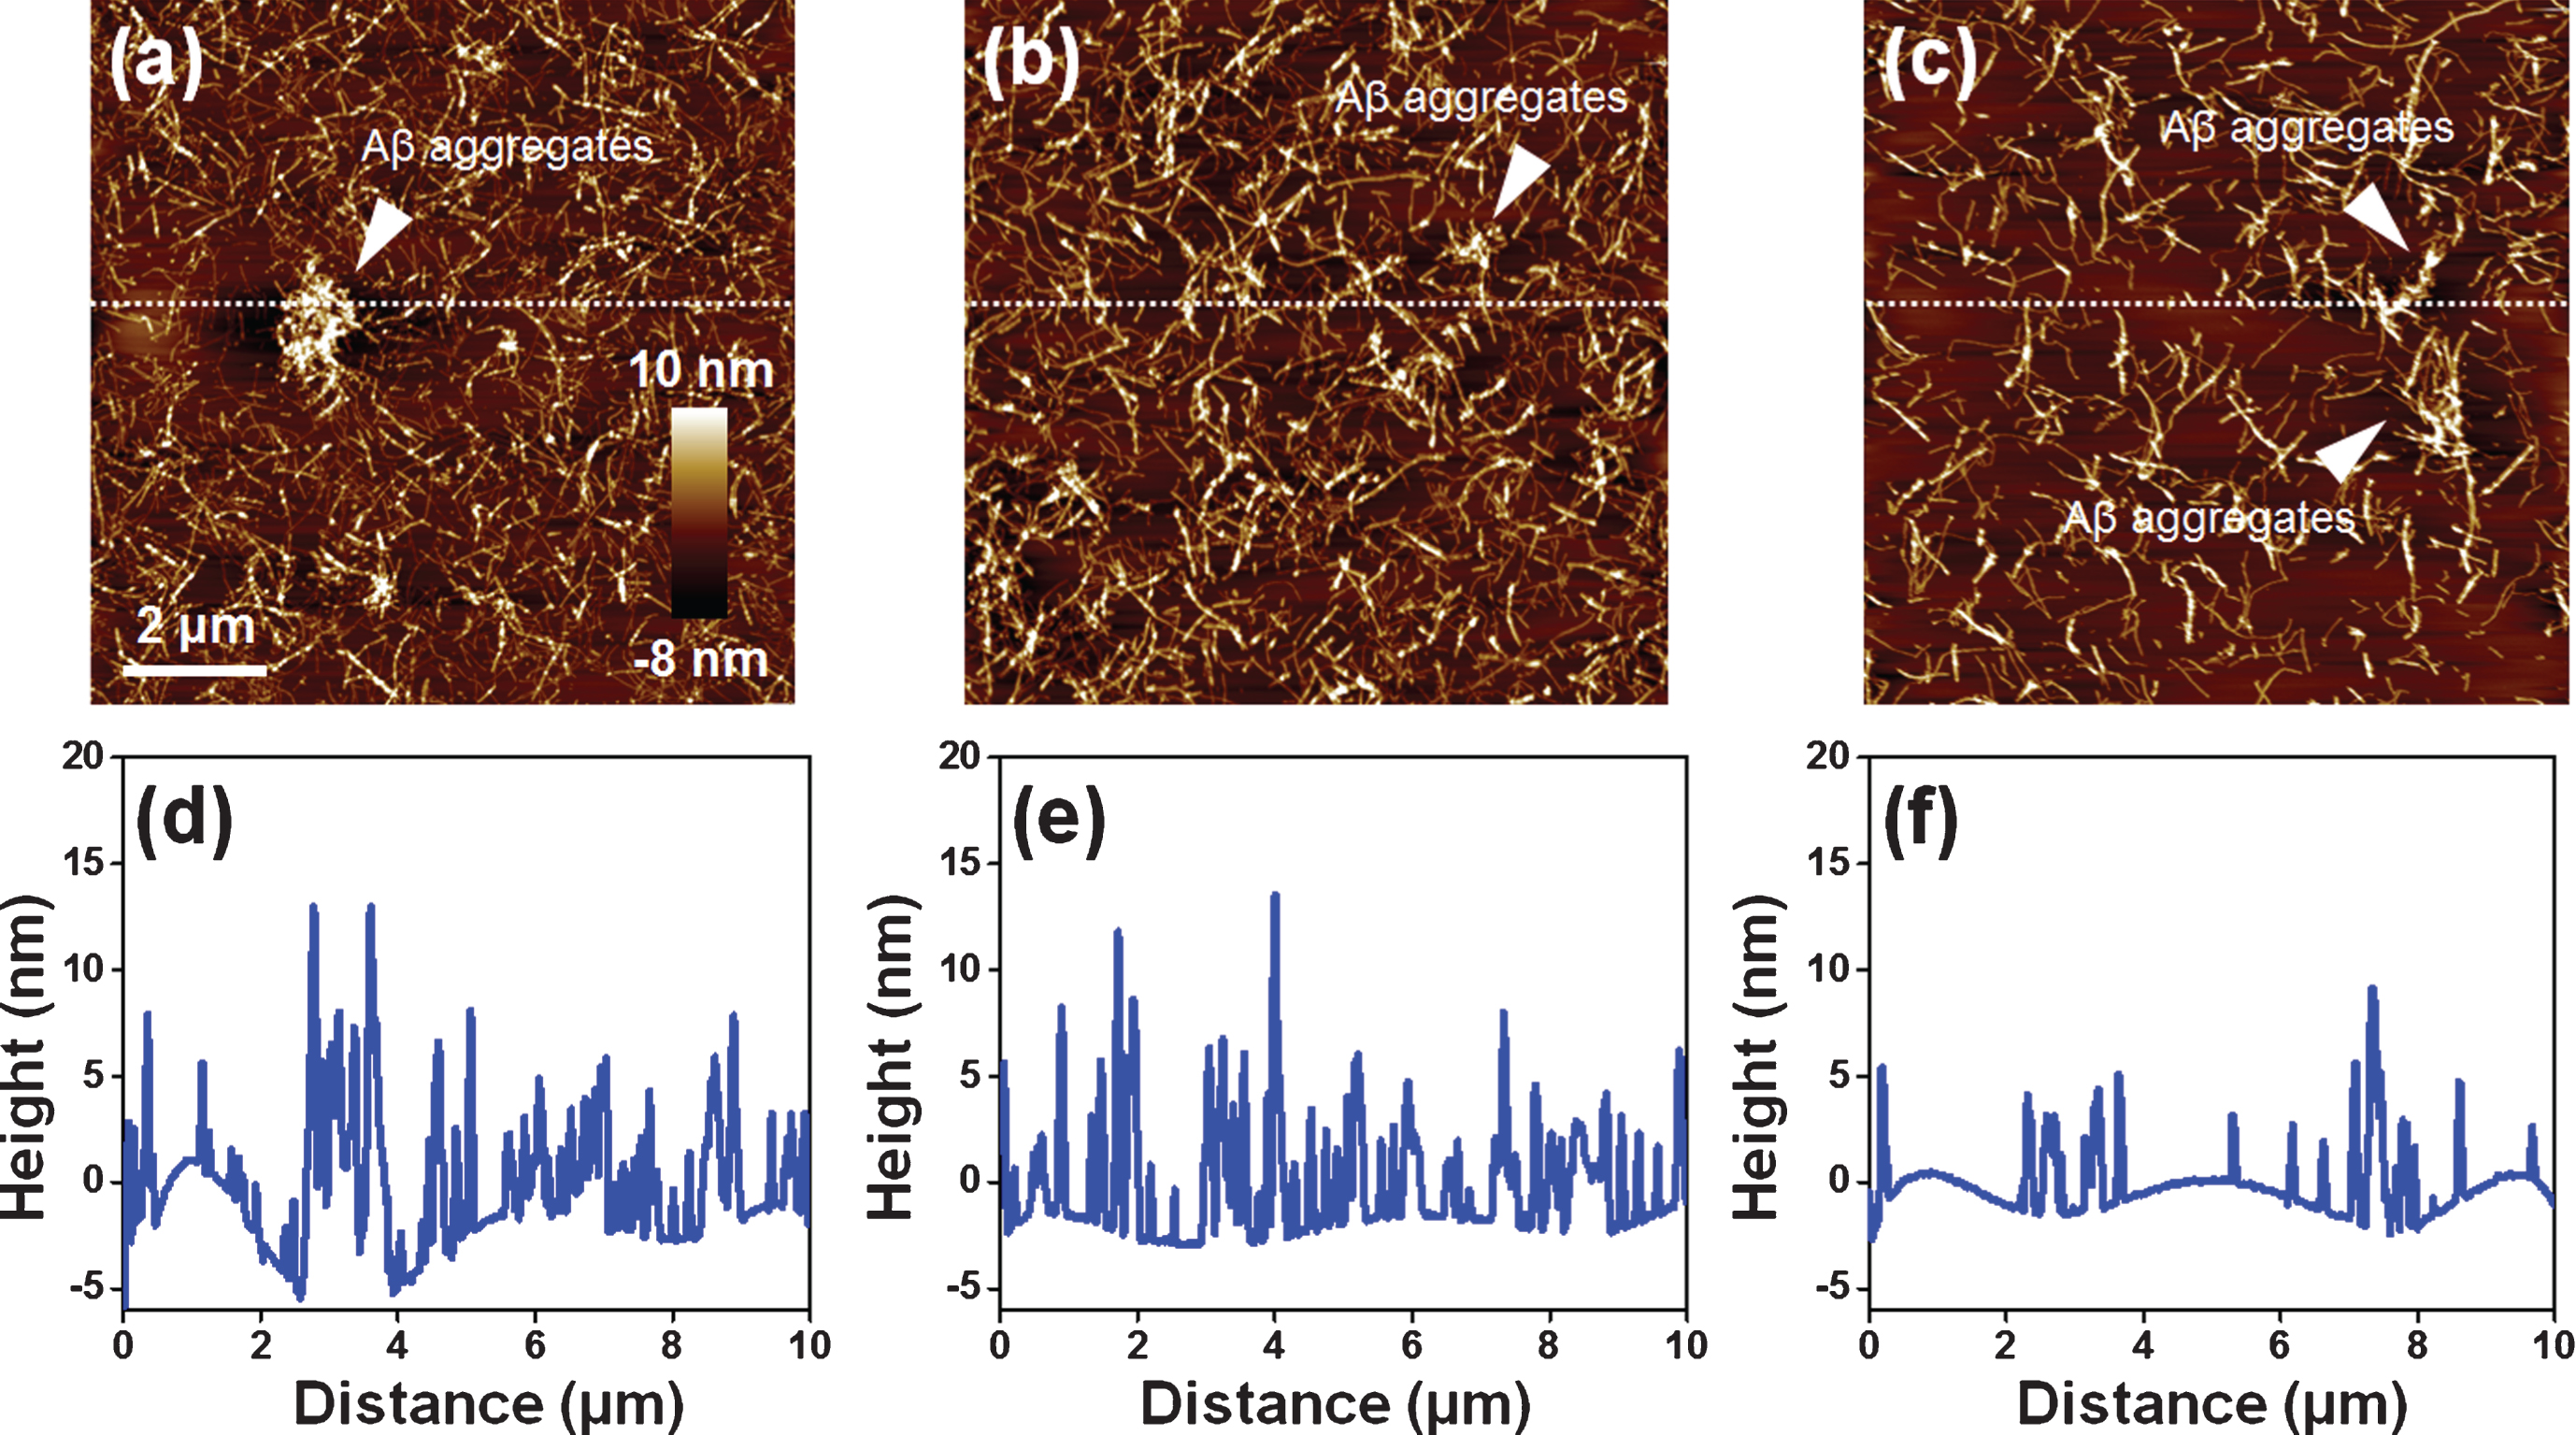
To investigate the EPPS-driven degradation of Aβ fibrils at high concentration of Aβ solution, we used 50 μM Aβ solutions (Fig. 1b) that are treated with 1 mM EPPS for 3 days. There were several Aβ aggregates in the Aβ fibril sample (50 μM) in the absence of EPPS. As the incubation time of EPPS increased, the aggregates seemed to be degraded (Fig. 3a-c). Moreover, the density of Aβ fibrils declined (see AFM images), suggesting that EPPS worked. Based on the cross-section profile (Fig. 3d-f), we confirmed that not only the heights of the Aβ aggregates, but also the overall densities of Aβ fibrils, decreased with increasing incubation times (from 1 to 3 days). Consistent with observations by AFM, we concluded that the Aβ fibrils declined and that the Aβ aggregates were destroyed.
Fig.3
AFM images of EPPS (1 mM) treated Aβ fibrils (50 μM) for different incubation times (1–3 days). (a) 1 day. (b) 2 days. (c) 3 days. White arrows indicate the Aβ aggregates. (d-f) Cross section profiles of Aβ fibrils on images (a-c). We sectioned across the white dot line on images.
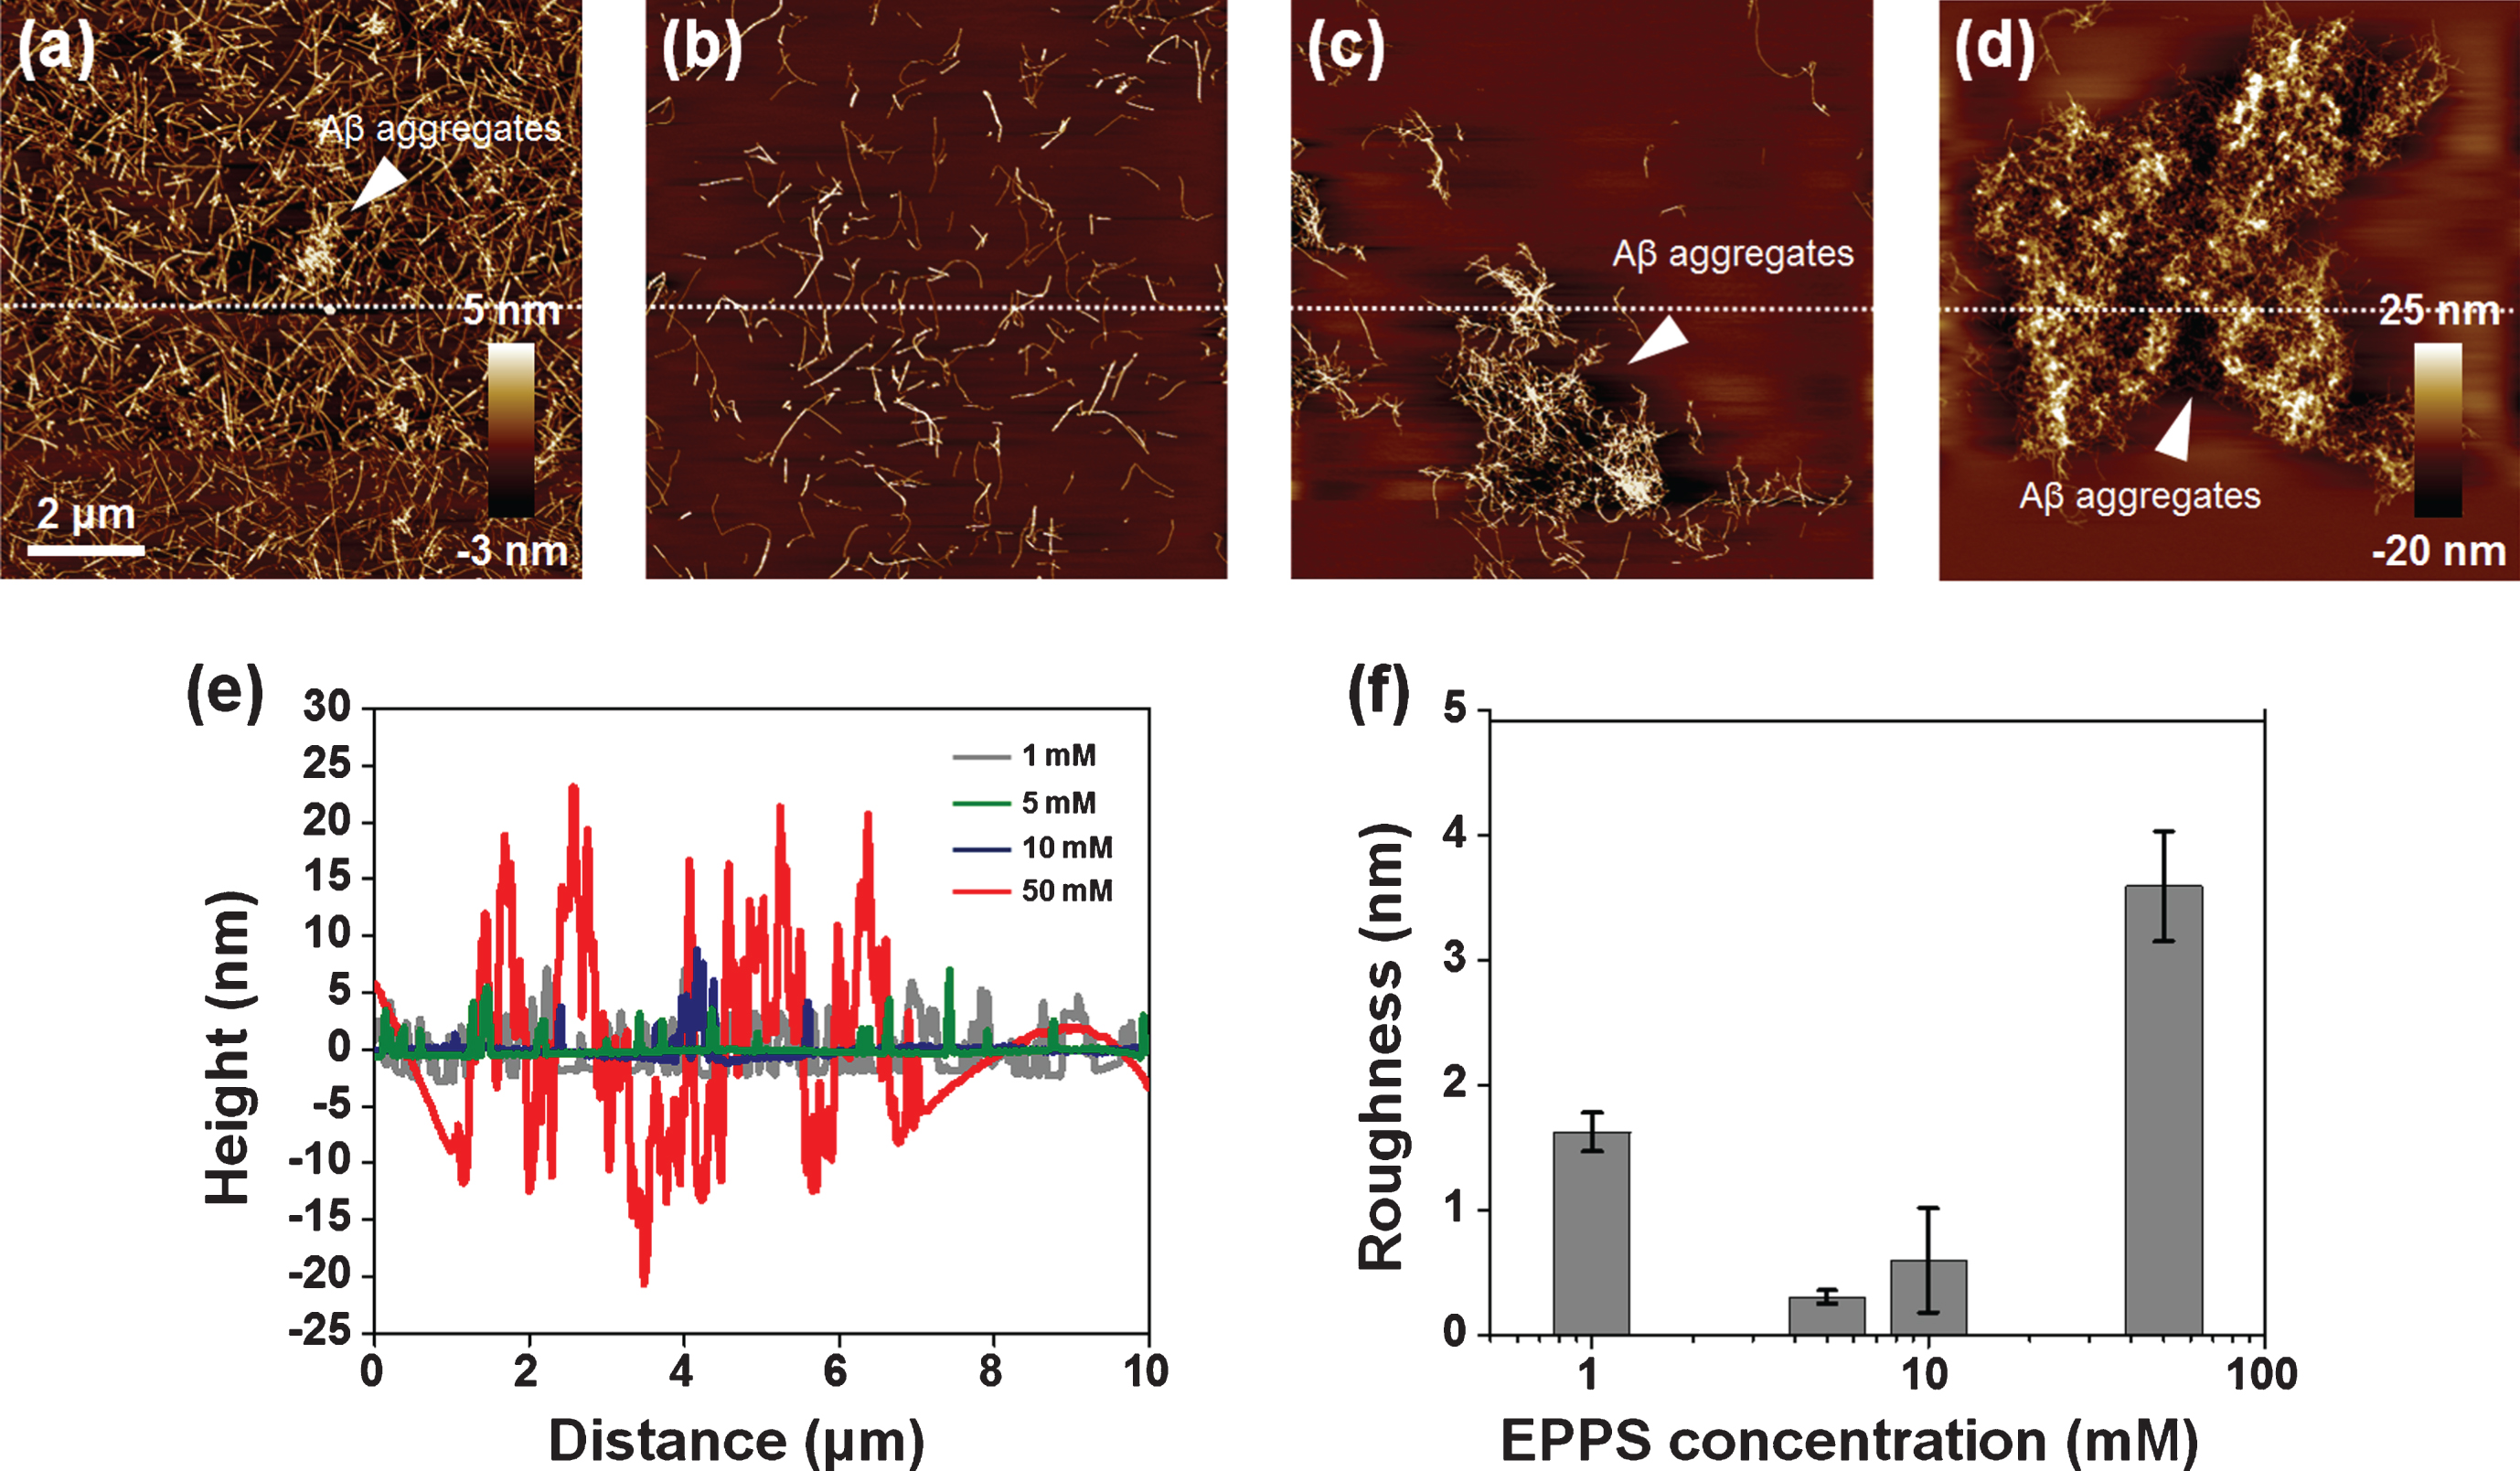
For investigating the high concentration effect, we considered the higher concentration of EPPS (1–50 mM) on Aβ fibrils (50 μM) for 1 day (Fig. 4). As seen in Fig. 3a, the Aβ aggregates and densities of Aβ fibrils were slightly decreased by 1 mM of EPPS treatment of more than 50 μM of Aβ fibrils (Fig. 4a). Interestingly, we found that Aβ fibrils were more destroyed in the presence of 5 mM of EPPS (Fig. 4b), but at higher EPPS (>5 mM), the large-sized (4–10 μm) Aβ aggregates were observed at 10 and 50 mM of EPPS (Fig. 4c and d). The heights of fibrils and the aggregates tended to increase from 2.57±1.39 to 14.24±3.30 nm, depending on the EPPS concentration (5–50 mM) (Fig. 4e). Similarly, the surface roughness increased in accordance with the high concentration of EPPS (5–50 mM); 0.31±0.05, 0.60±0.49, and 3.60±0.44 nm, respectively (Fig. 4f). We found a peculiar structure which we assumed to be Aβ aggregates by incubating in the presence of 10 or 50 mM of EPPS, respectively, for 1 day. These Aβ aggregates seemed to be a coagulated form consisting of a lot of short fibrils. It was not observed before EPPS treatment or at a low concentration of EPPS. Interestingly, there were few fibrils in the surrounding areas of the large Aβ aggregates. This looked like a surprisingly strong attraction force that is there to put short amyloid fibrils together in the same spot. Perhaps the strange attraction force could be enhanced as EPPS concentration increased, resulting in the reformation of larger Aβ aggregates.
Fig.4
AFM images of Aβ fibrils (50 μM) which are treated to different concentrations of EPPS (1–50 mM) for 1 day. (a) 1 mM of EPPS. (b) 5 mM of EPPS. (c) 10 mM of EPPS. (d) 50 mM of EPPS. White arrows indicate the Aβ aggregates. We sectioned across the white dot line on images. (e) Cross section profiles of Aβ aggregate on images (a–d). (f) Differences of surface roughness by various EPPS treatment to Aβ fibrils.
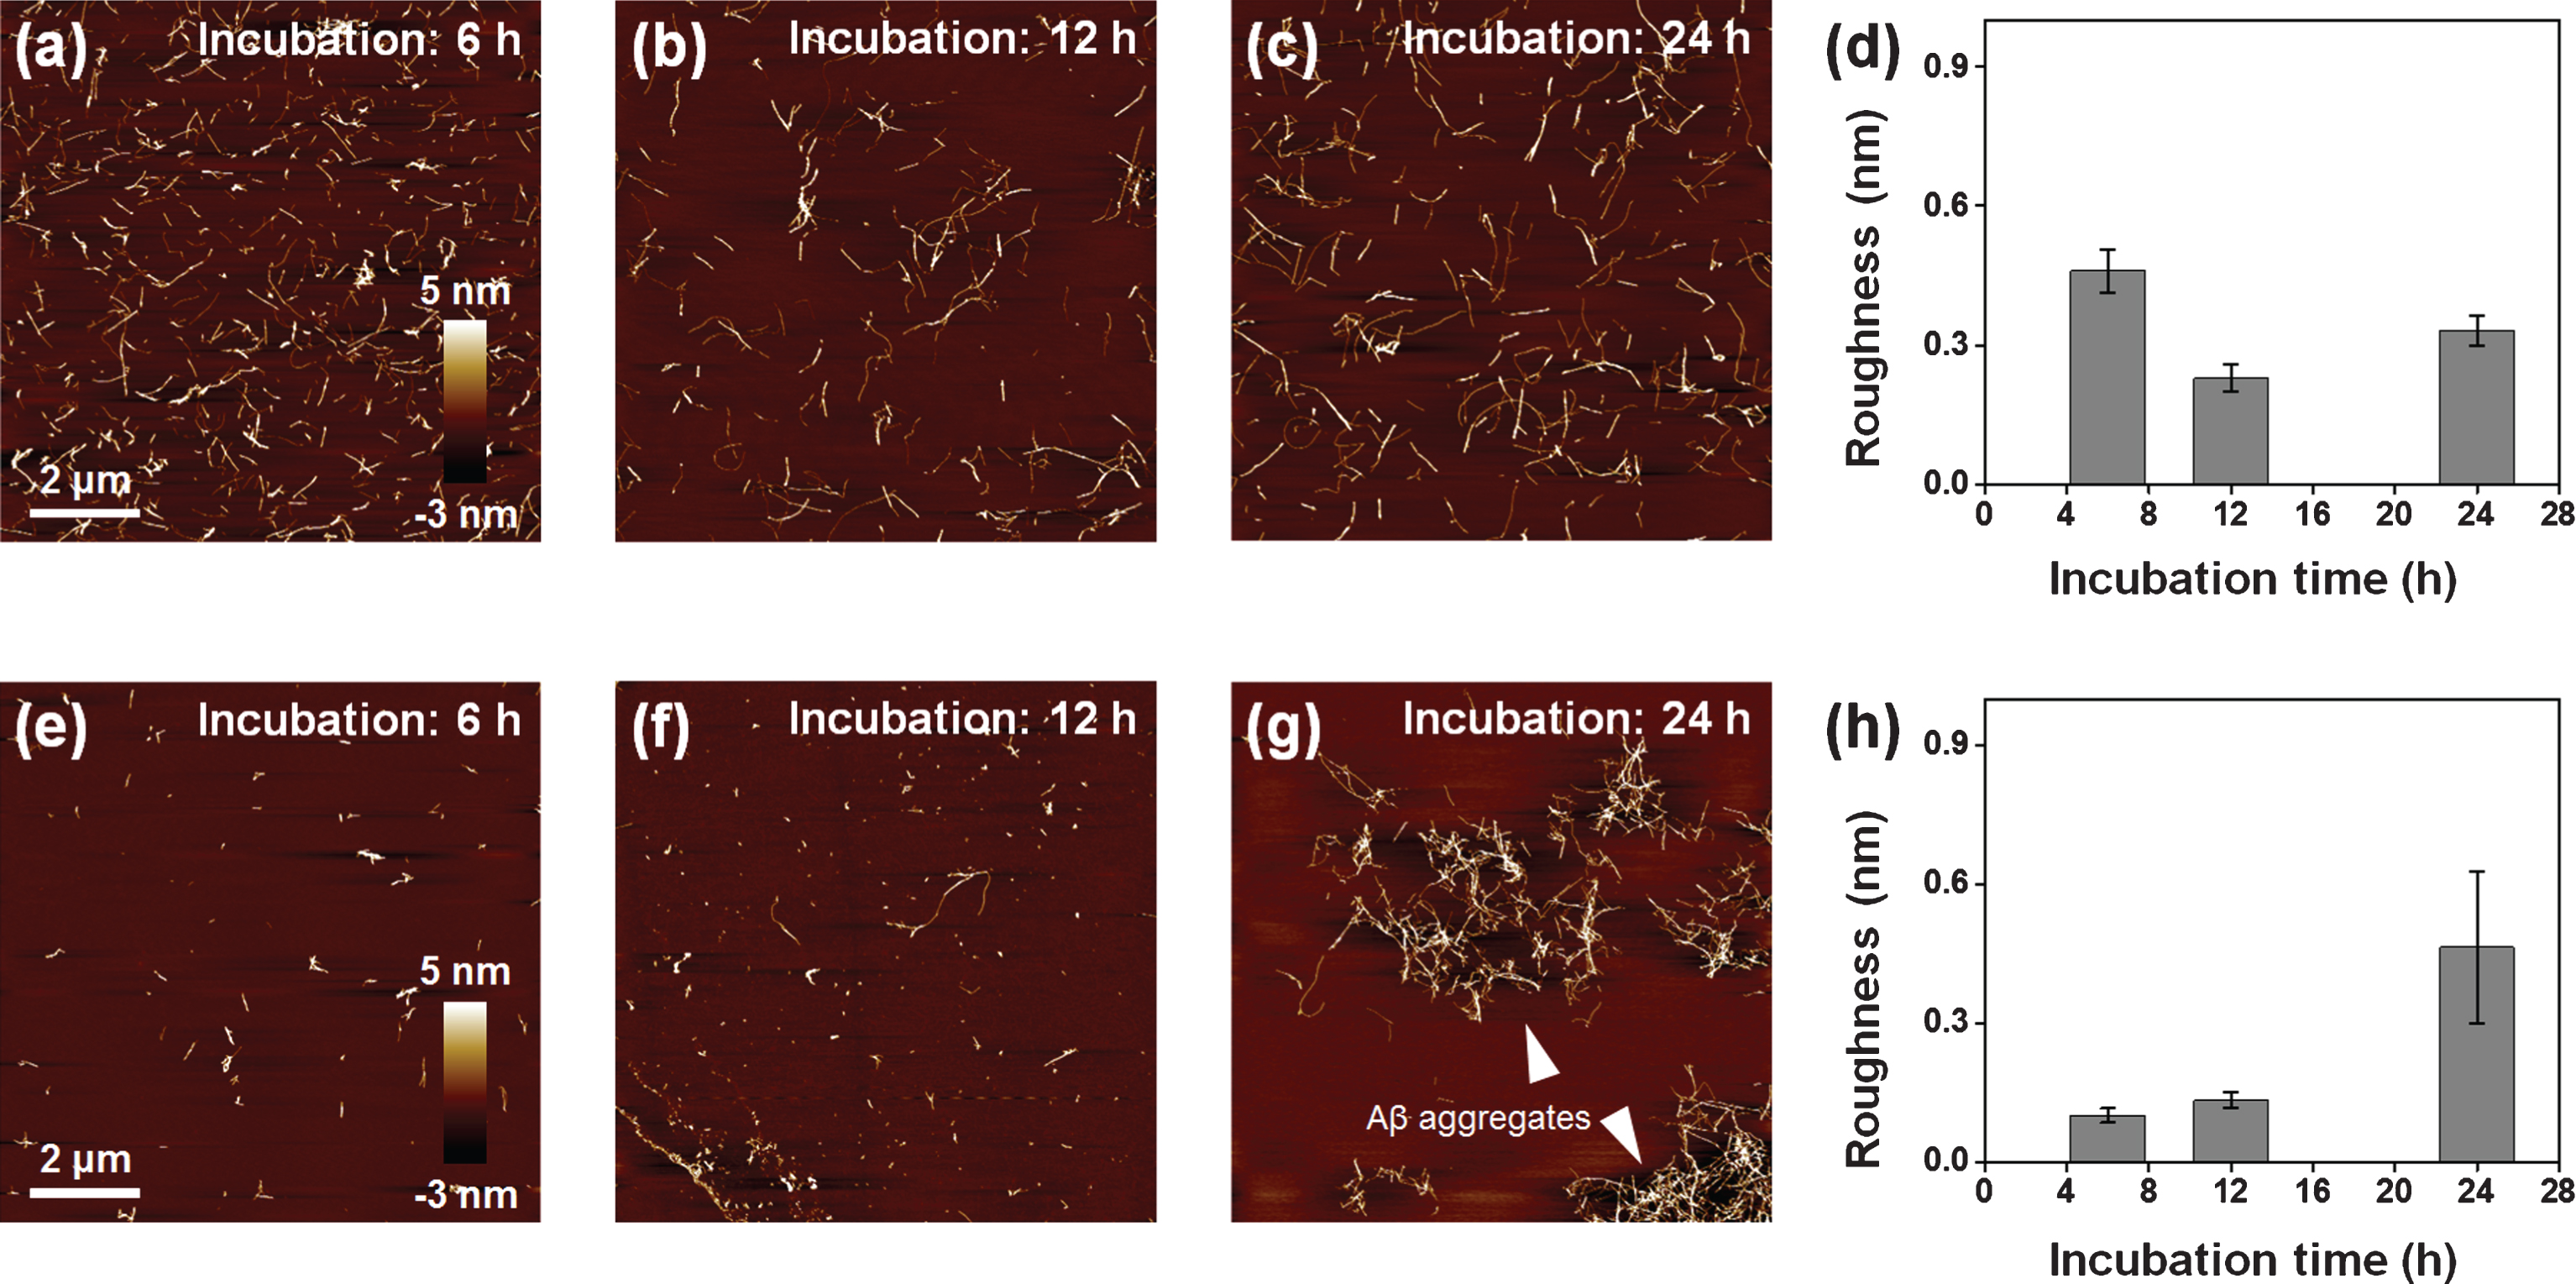
To scrutinize this phenomenon, we investigated the time-variant remodeling of the large Aβ aggregates (Fig. 5). We imaged the Aβ fibrils with EPPS with different incubation times such as 6, 12, and 24 h with 5 and 10 mM of EPPS (Fig. 5a-c, e-g). When treated with 5 mM of EPPS, the Aβ fibrils were degraded for 12 h. Remarkably, the quantities of Aβ fibrils were slightly increased for 24 h, albeit in the presence of EPPS. As the incubation time increased, the results of the surface roughness analysis also matched the AFM imaging results (Fig. 5d). More remarkably, the time for regeneration of Aβ fibrils became 12 h earlier, and the reformation of the large Aβ aggregates accelerated when 10 mM EPPS treated. Indeed, we once again observed large sized (4–6 μm) of the large Aβ aggregates that were similar to structures seen in Fig. 4c. As such, we verified our above-mentioned hypothesis, which meant that reformation of Aβ aggregates was possible, despite the EPPS reaction. In addition, when the incubation time was 24 hours, the roughness of 10 mM EPPS treated sample increased 140 % than that of 5 mM EPPS treated sample (Fig. 5h). These results indicate that treatment of high concentrations of EPPS can lead to reform more densely aggregates than the original fibril or Aβ aggregates.
Fig.5
AFM images of Aβ fibrils (50 μM) which are treated to EPPS for different incubation times (6–24 h) and concentrations of EPPS (5 and 10 mM). (a-c) 5 mM. (d) Differences of surface roughness by 5 mM EPPS treatment at different incubation time. (e-g) 10 mM. White arrow shows the Aβ aggregates. (h) Differences of surface roughness by 10 mM EPPS treatment at different incubation time.
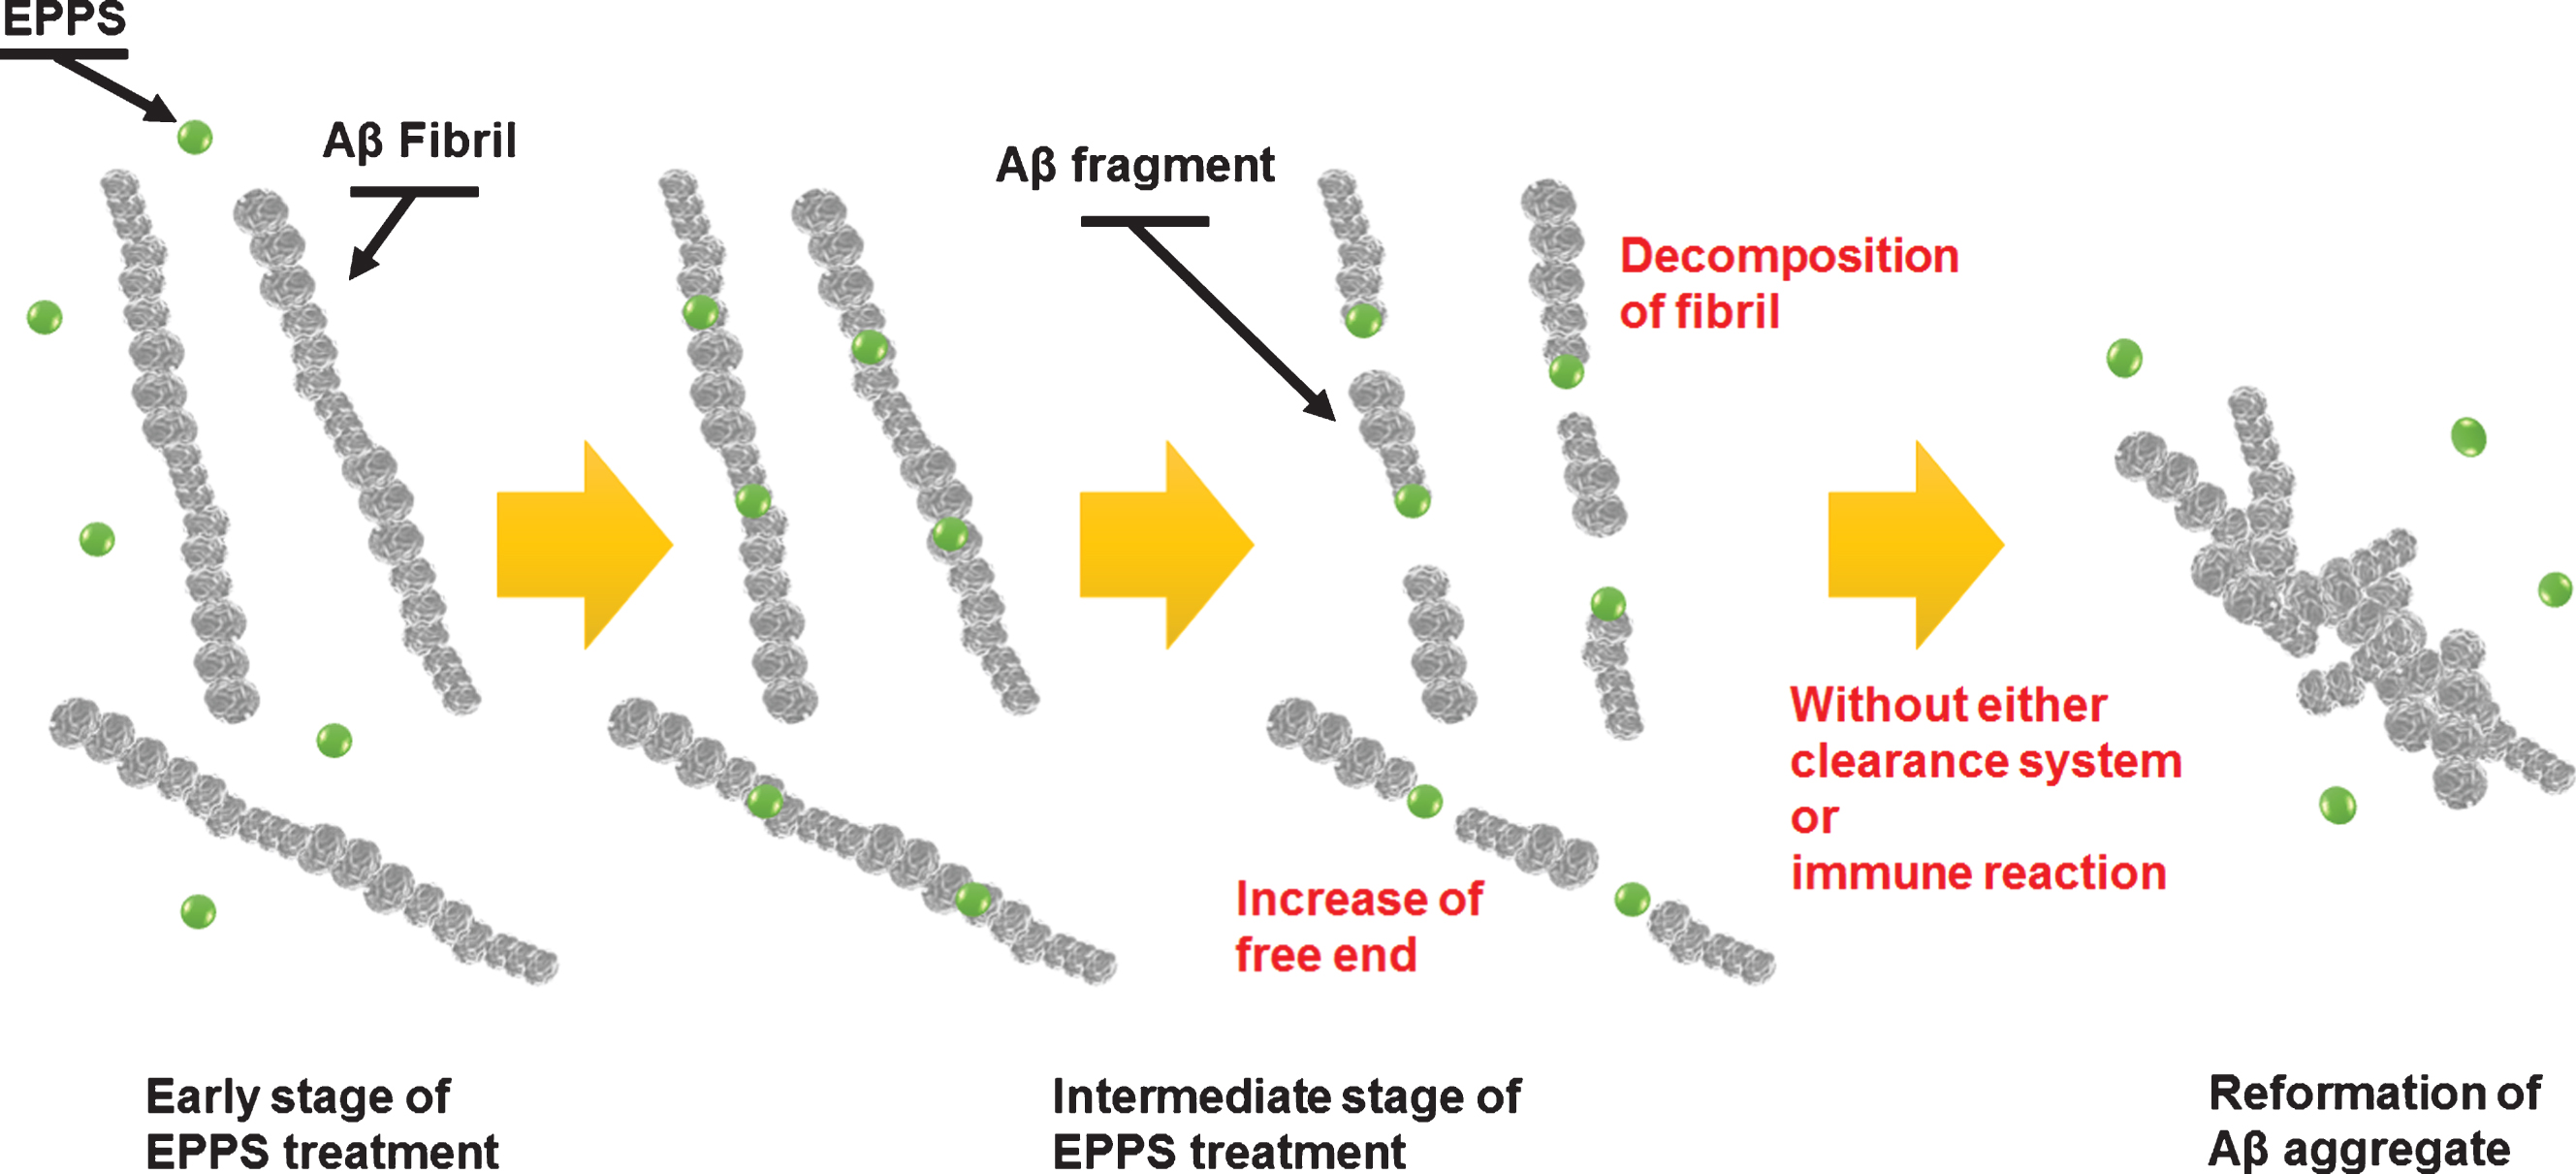
To investigate how much the density of the large Aβ aggregates depended on treated EPPS concentration, we analyzed the depths of height and amplitude error through AFM images for understanding the large Aβ aggregates (Fig. 6). As shown the AFM images in Fig. 6a (10 mM of EPPS) and Fig. 6b (50 mM of EPPS), huge Aβ aggregates can be formed at higher densities when a high concentration of EPPS is used to treat Aβ fibrils. The depth of the height of the 50 mM-treated Aβ aggregates was 2.3 times greater than that of the 10 mM-treated structure (Fig. 6c). In the same manner, amplitude error images (Fig. 6d, e) can give the best contrast between the large Aβ aggregates and the substrate. The depth of the amplitude error of the 50 mM-treated Aβ aggregates was 1.2 times greater than that of the 10 mM-treated structure (Fig. 6f). It was consistent with the above-mentioned decomposition behavior of Aβ fibrils and large Aβ aggregates. Based on our data, we can propose a model describing the reformation mechanism of Aβ aggregates in Fig. 7. At early stages of EPPS treatment, Aβ fibrils degraded into shorter fibrils by direct binding of EPPS molecules to Aβ fibrils. Because of no clearance event for the degraded Aβ fragments, these fragments can coalesce through the free ends of broken fibrils. Concretely, as the number of free ends of degraded Aβ fragment increases, it seems that each fibril fragment can be aggregated after further incubation.
Fig.6
Characterization of structural information of re-formed Aβ aggregates depending on EPPS treatment by using AFM images. Topological images of Aβ aggregates by (a) 10 and (b) 50 mM EPPS treatment for 1 day. (c) Average height depth of Aβ aggregates. Amplitude error images of Aβ aggregates by (d) 10 and (e) 50 mM EPPS treatment for 1 day. (f) Average amplitude error depth of Aβ aggregates.
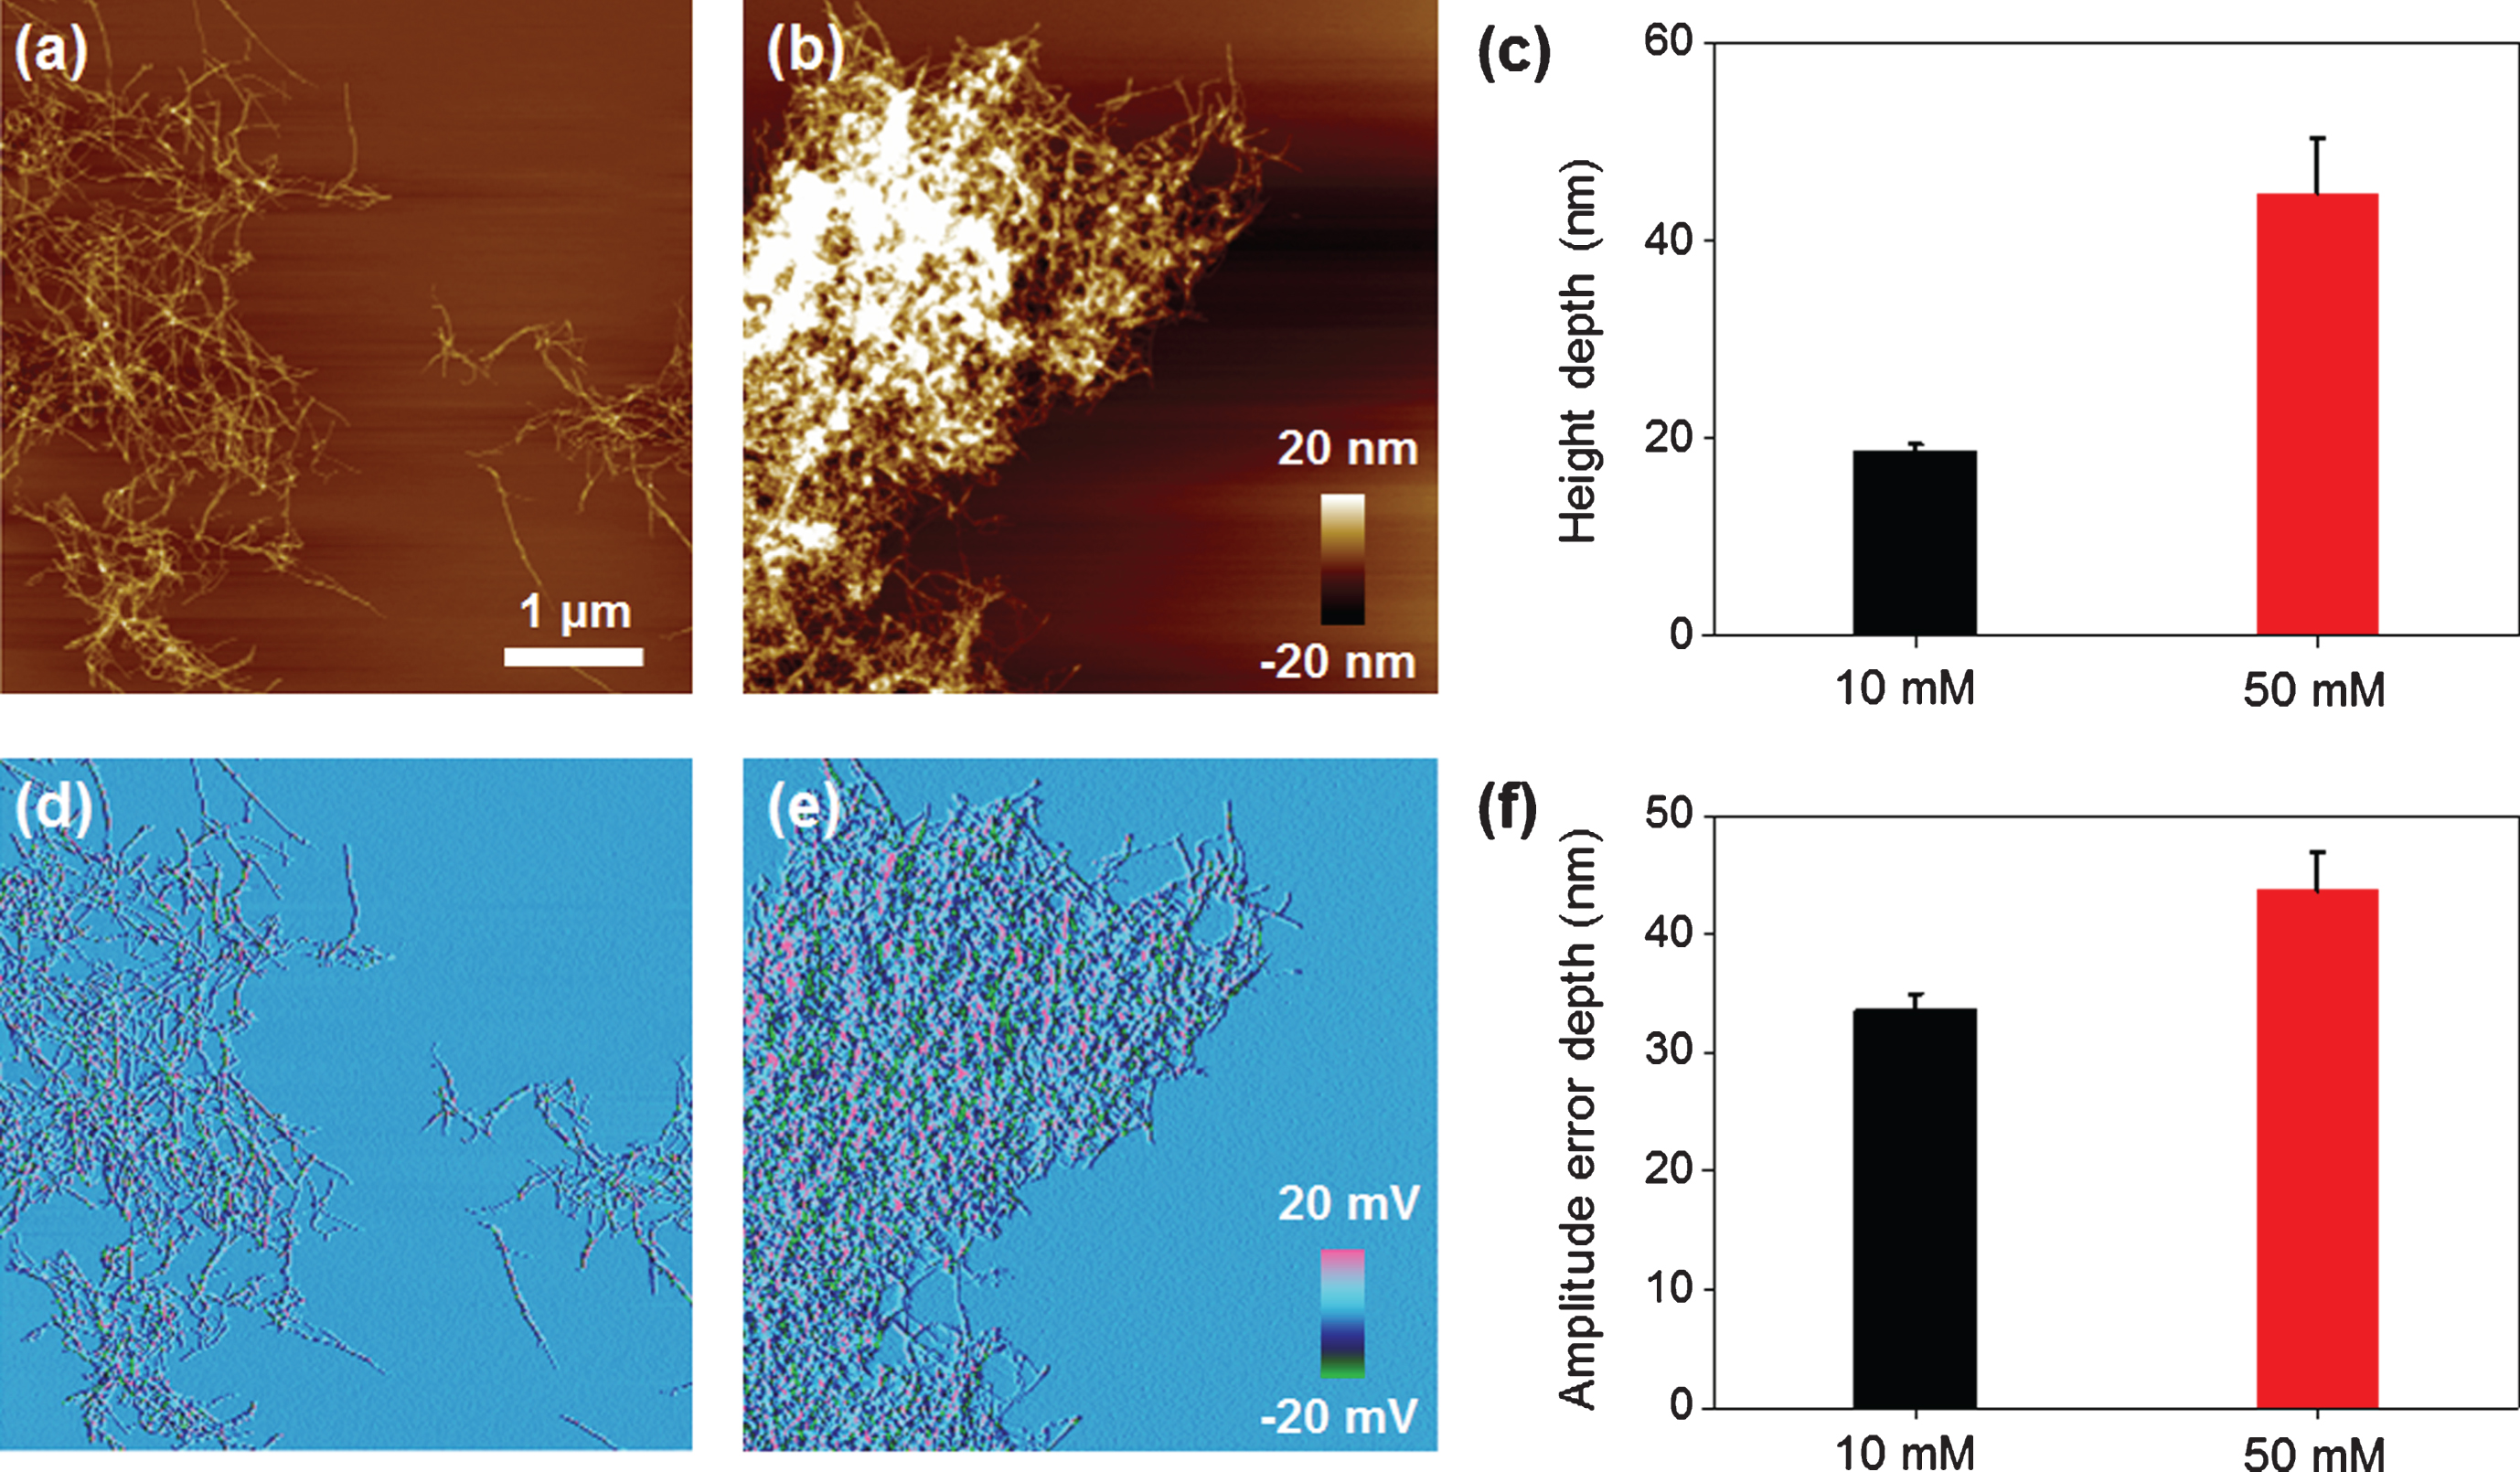
Fig.7
Schematic diagram of our proposed model describing the mechanism of degradation and reformation of Aβ aggregates.
Our results indicated that 1) EPPS was effective for degradation of Aβ aggregates (consistent with prior studies), but the degradation was not perfect in vitro condition; 2) moreover, this imperfect degradation of Aβ aggregates could cause the reformation of more Aβ aggregates corresponding to larger sizes during the short incubation times; 3) therefore, EPPS treatment with the goal to cure AD should be done under well-controlled conditions. For example, we hypothesize that AD patients who are dosed with EPPS should take a deep sleep, offering higher chances to activate the clearance system in the brain [23, 24]. We also anticipate an intermittent, but consecutive dosing EPPS to AD patients for long time (several years) potentially enabling complete degradation of all Aβ aggregates degraded and excretion from the brain through a clearance system.
Conclusions
In summary, we demonstrated AFM analysis of EPPS-driven degradation of Aβ aggregates including fibrils and their aggregated form. We synthesized Aβ1 - 42 fibrils and treated to them with different concentrations of EPPS over various time periods. We found that EPPS worked very well in degrading preformed Aβ aggregates, but the degradation did not mean perfect Aβ elimination under the given conditions (e.g., in vitro system without clearance reactions). During the degradation process, tiny Aβ aggregates were often found, which allowed for the reformation of Aβ aggregates, regardless of the EPPS reactions. The problem was that the size of reformed Aβ aggregates is much larger than their original forms. Moreover, the time for the reformation process was shortened, suggesting that the remained Aβ fragments after EPPS treatment could act as seeds or nuclei for forthcoming Aβ aggregation. Our findings will be useful for establishment of a proper EPPS prescription and for the discovery of more advanced, robust drugs for curing AD.
FINANCIAL DISCLOSURE
The authors have no conflict of interest to report.
ACKNOWLEDGMENTS
This work was supported by the National Research Foundation of Korea (NRF) grant funded by the Korean Government (MSIP) (No. NRF-2016R1A2B4010269). This research was also supported by Basic Science Research Program through the National Research Foundation of Korea (NRF) funded by the Ministry of Education (NRF-2017R1A6A3A11034311) and Korea University Grant.
REFERENCES
[1] | Dobson CM ((1999) ) Protein misfolding, evolution and disease. Trends Biochem Sci 24: , 329–332. |
[2] | Merlini G , Bellotti V ((2003) ) Molecular mechanisms of amyloidosis. New Engl J Med 349: , 583–596. |
[3] | Blennow K , Hampel H , Weiner M , Zetterberg H ((2010) ) Cerebrospinal fluid and plasma biomarkers in Alzheimer disease. Nat Rev Neurol 6: , 131–144. |
[4] | Hardy J , Selkoe DJ ((2002) ) The amyloid hypothesis of Alzheimer’s disease: Progress and problems on the road to therapeutics. Science 297: , 353–356. |
[5] | Bayliss D , Walsh JL , Shama G , Iza F , Kong MG ((2009) ) Reduction and degradation of amyloid aggregates by a pulsed radio-frequency cold atmospheric plasma jet. New J Phys 11: , 115024. |
[6] | Yagi H , Ozawa D , Sakurai K , Kawakami T , Kuyama H , Nishimura O , Shimanouchi T , Kuboi R , Naiki H , Goto Y ((2010) ) Laser-induced propagation and destruction of amyloid β fibrils. J Biol Chem 285: , 19660–19667. |
[7] | Lee W , Jung H , Son M , Lee H , Kwak TJ , Lee G , Kim CH , Lee SW , Yoon DS ((2014) ) Characterization of the regrowth behavior of amyloid-like fragmented fibrils decomposed by ultrasonic treatment. RSC Adv 4: , 56561–56566. |
[8] | Takeda T , Klimov DK ((2008) ) Temperature-induced dissociation of Aβ monomers from amyloid fibril. Biophys J 95: , 1758–1772. |
[9] | Karran E , Mercken M , Strooper BD ((2011) ) The amyloid cascade hypothesis for Alzheimer’s disease: An appraisal for the development of therapeutics. Nat Rev Drug Discov 10: , 698–712. |
[10] | Sacchettini JC , Kelly JW ((2002) ) Therapeutic strategies for human amyloid diseases. Nat Rev Drug Discov 1: , 267–275. |
[11] | Van Dam D , De Deyn PP ((2006) ) Drug discovery in dementia: The role of rodent models. Nat Rev Drug Discov 5: , 956–970. |
[12] | Wada M , Miyazawa Y , Miura Y ((2011) ) A specific inhibitory effect of multivalent trehalose toward Aβ(1-40) aggregation. Polym Chem 2: , 1822–1829. |
[13] | Kim HY , Kim Y , Han G , Kim DJ ((2010) ) Regulation of in vitro Aβ1-40 Aggregation mediated by small molecules. J Alzheimers Dis 22: , 73–85. |
[14] | Kim HY , Kim HV , Jo S , Lee CJ , Choi SY , Kim DJ , Kim Y ((2015) ) EPPS rescues hippocampus-dependent cognitive deficits in APP/PS1 mice by disaggregation of amyloid-β oligomers and plaques. Nat Commun 6: , 8997. |
[15] | Adamcik J , Jung J-M , Flakowski J , De Los Rios P , Dietler G , Mezzenga R ((2010) ) Understanding amyloid aggregation by statistical analysis of atomic force microscopy images. Nat Nanotech 5: , 423–428. |
[16] | Lee W , Lee H , Lee G , Yoon DS ((2016) ) Advances in AFM imaging applications for characterizing the biophysical properties of amyloid fibrils. In Exploring New Findings on Amyloidosis, Fernandez-Escamilla A-M, ed. In Tech, Rijeka, p. Ch. 03. |
[17] | Lee G , Lee W , Lee H , Lee CY , Eom K , Kwon T ((2015) ) Self-assembled amyloid fibrils with controllable conformational heterogeneity. Sci Rep 5: , 16220. |
[18] | Lee G , Lee W , Lee H , Lee SW , Yoon DS , Eom K , Kwon T ((2012) ) Mapping the surface charge distribution of amyloid fibril. Appl Phys Lett 101: , 043703–043704. |
[19] | Lee W , Kim I , Lee SW , Lee H , Lee G , Kim S , Lee SW , Yoon DS ((2016) ) Quantifying L-ascorbic acid-driven inhibitory effect on amyloid fibrillation. Macromol Res 24: , 868–873. |
[20] | Lee W , Lee H , Choi Y , Hwang KS , Lee SW , Lee G , Yoon DS ((2017) ) Nanoelectrical characterization of amyloid-β 42 aggregates via Kelvin probe force microscopy. Macromol Res 25: , 1187–1191. |
[21] | Smith JF , Knowles TPJ , Dobson CM , MacPhee CE , Welland ME ((2006) ) Characterization of the nanoscale properties of individual amyloid fibrils. Proc Natl Acad Sci U S A 103: , 15806–15811. |
[22] | Osorio RS , Pirraglia E , Agüera-Ortiz LF , During EH , Sacks H , Ayappa I , Walsleben J , Mooney A , Hussain A , Glodzik L , Frangione B , Martínez-Martín P , de Leon MJ ((2011) ) Greater risk of Alzheimer’s disease in older adults with insomnia. J Am Geriatr Soc 59: , 559–562. |
[23] | Mawuenyega KG , Sigurdson W , Ovod V , Munsell L , Kasten T , Morris JC , Yarasheski KE , Bateman RJ ((2010) ) Decreased clearance of CNS beta-amyloid in Alzheimer’s disease. Science 330: , 1774. |
[24] | Zuroff L , Daley D , Black KL , Koronyo-Hamaoui M ((2017) ) Clearance of cerebral Aβ in Alzheimer’s disease: Reassessing the role of microglia and monocytes. Cell Mol Life Sci 74: , 2167–2201. |

