
Measuring voluntary activation of the Quadriceps femoris during isokinetic concentric contractions
Abstract
BACKGROUND:
It is known that Voluntary Activation (VA) of muscles may be lower during isokinetic concentric (CON) contractions than during isometric (ISOM) contractions, and that it may be further decreased in various motor impairments.
OBJECTIVE:
The aim of this study was to validate the Interpolated Twitch Technique (ITT) for quantifying VA of the Quadriceps femoris during CON contractions (knee extension at 60 and 120
METHODS:
Pairs of electrical stimuli were delivered to the Quadriceps femoris of twenty-two healthy subjects at 50
RESULTS:
Through a linear regression model, a significant relationship between measures of VA and moment was observed for all the three contraction conditions: slopes (95% confidence intervals)
CONCLUSIONS:
It is concluded that ITT can be a valid method for measuring VA during CON contractions, potentially useful both in sports and rehabilitation studies.
1.Introduction
Voluntary activation (VA) can be defined as the amount of recruitment of muscles during a voluntary contraction effort. The number of spinal motoneurones recruited and their firing frequency increase with increasing VA [1]. The assessment of VA may be relevant in patients affected by orthopedic and/or neurological disorders, as long as it may disentangle central from peripheral causes of weakness. VA failure has been reported to be caused by lesions of the central nervous system or inhibitory stimuli arising from peripheral damaged tissues (“arthrogenous muscle weakness”) [2, 3]; it may also represent an unconscious form of prevention of postural imbalance [4].
The “interpolated twitch technique” (ITT) is the most widely used method to quantify the extent of VA [5]. It consists in stimulating a representative (i.e., greater than 20%) sample of the muscle belly through an electric shock both during a voluntary contraction and at rest. The shock is painless, although it may cause some discomfort, associated with the unexpected strong muscle contraction. If the shock does not generate an extra force during contraction, all muscle fibers belonging to the sample reached by the electric shock can be claimed to be recruited at their tetanic frequency. Otherwise, following the stimulus a twitch can be observed [6, 7, 8] revealing that the voluntary command was only partially effective in recruiting the available pool of spinal motoneurones.
Previous studies focused on the study of VA in various upper [5, 9] and lower [7, 10] limb muscles. Regarding the Quadriceps femoris, isometric (ISOM) contractions were mostly investigated. Contrary to common “isotonic” contractions, where load is constant but joint rotation speed changes, ISOM contractions can be supposed to be quite infrequent in daily life. Also, VA and joint angular velocity are linked by complex relationships. The discharge rate of spindle endings, facilitating motoneurones’ recruitment, decreases during shortening contractions, compared to ISOM contractions. Spindle-based facilitation should be lower, the higher the shortening speed, whereas the opposite should be true for force-sensitive joint receptors. The overall balance seems that of a lower motoneuron excitation during the end part of knee extension contractions [11, 12]. As a further complication, speed-dependence of moment arises from the individual stiffness of the series elastic components. At a given joint angle, the overall length reached by the muscle-tendon complex relies more on shortening of the elastic components, compared to muscle fibers, the higher the shortening speed [13]. Slack of the elastic element (following reduced mobility or aging itself, and little predictable) may involve greater fiber shortening, thus adding to the loss of spindle-mediated facilitation at higher rotation speed. A decreased VA may thus ensue due to both mechanical and neural causes (e.g. central nervous lesions or pain-dependent inhibition [2, 14]).
Imposing stable and predetermined joint angular velocity still is the ideal method to study empirically the relationship between force and VA during muscle shortening. Isokinetic machines provide a good solution, in that they impose a fixed rotation speed to the subject’s joint, whichever the moment applied [15]. This notwithstanding, investigations on the relationship between VA and joint rotation speed during isokinetic concentric (CON) contractions are very sparse and provide conflicting results. Some authors have concluded that maximal CON voluntary activation did not differ significantly from the maximal ISOM level either at slow (20
To the best of the Author’s knowledge, the relationship between twitch amplitude and VA, expected to be linear, has been widely explored during ISOM contractions [18, 19, 20], but only at slow angular velocities (20
The aim of the present study was to validate the ITT on the Quadriceps femoris during CON contractions using pairs (“doublets”) of electrical stimuli at intermediate angular velocities (60
2.Method
2.1Participants
The goal of the study was to test the validity of the method, rather than providing normative values. Therefore, a sequential design was chosen [21, 22]. The objective was to find a satisfactory linear regression model linking VA to voluntary moment, for each angular velocity. A Pearson correlation
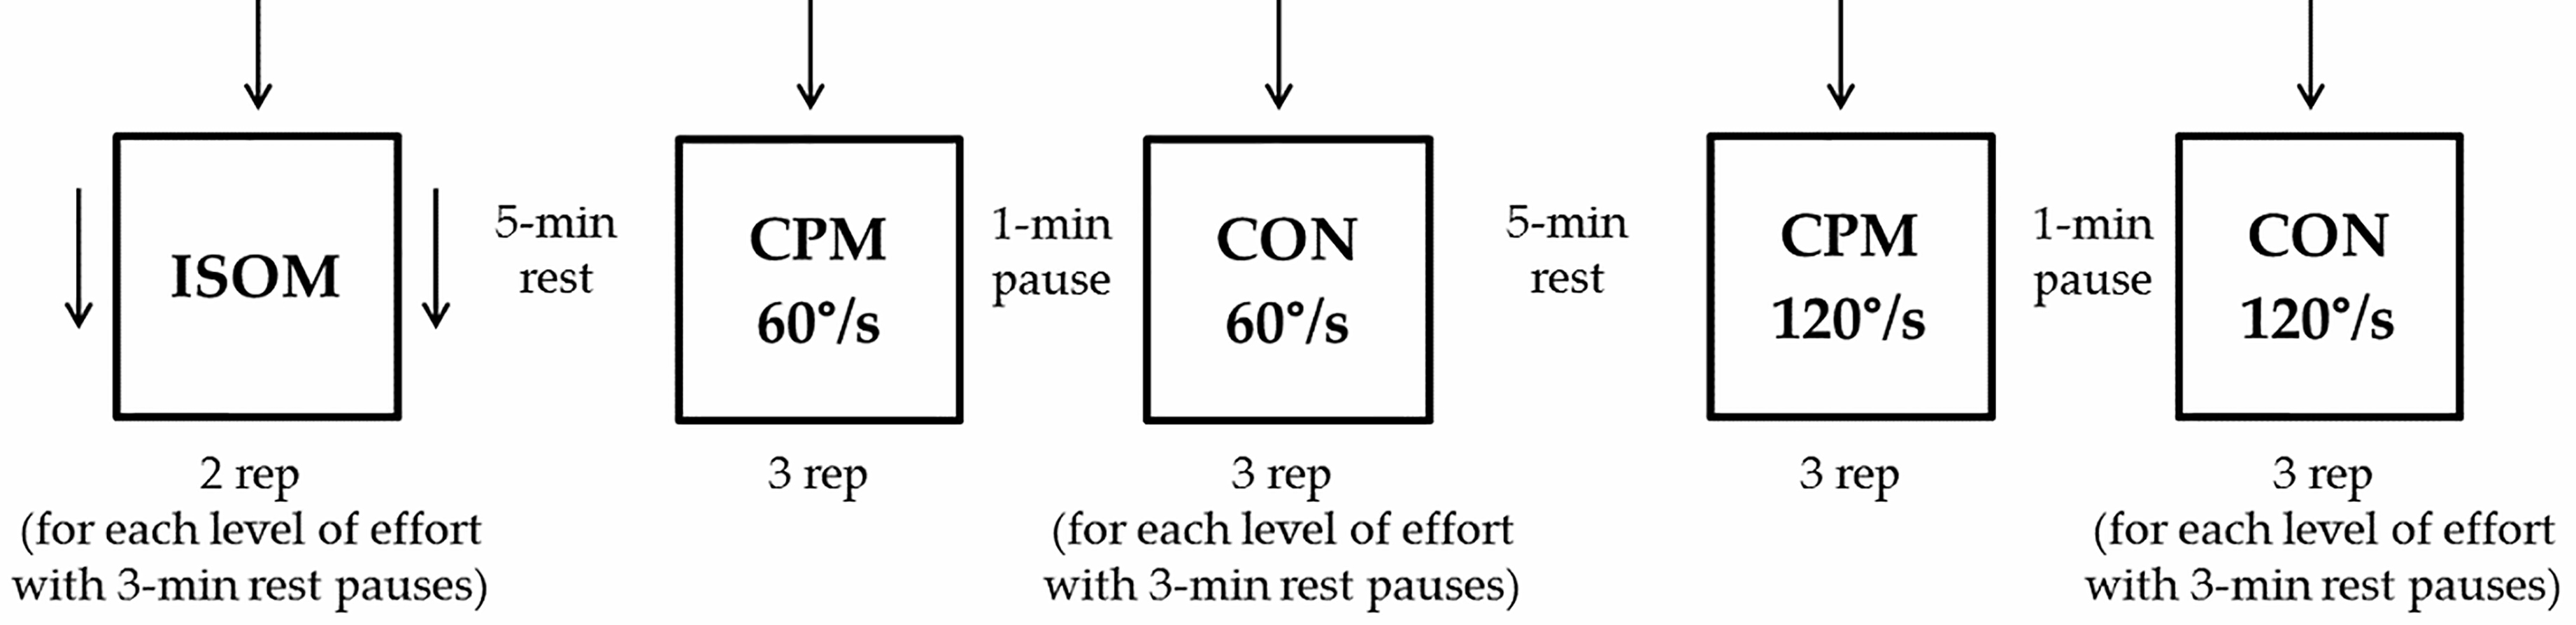
Figure 1.
Schematic representation of the experimental protocol. Arrows represent doublet stimulation. ISOM: isometric contraction; CPM: continuous passive isokinetic motion; CON: isokinetic concentric contraction; rep: repetitions.
The inclusion criteria were: i) age between 18 and 45 years; ii) ability to wittingly sign the informed consent form; iii) ability to understand the instructions and to complete the motor task. All subjects had to be recreationally active. Subjects were excluded if they had a history of epilepsy (to avoid the risk for seizures triggered by the stimuli), implanted electro-sensitive devices, or had any neurologic condition or orthopedic condition limiting the articular mobility or muscular strength of the lower limbs. No subject under treatment with oral anticoagulant or antiplatelet therapy was selected (in order to avoid the risk for muscle hemorrhage). Their leg dominance was tested by means of the Waterloo footedness questionnaire-revised [23]. All subjects gave written, informed consent before participating. The study was approved by the local Ethic committee of the Institution. The study conformed with the Code of Ethics of the World Medical Association (Declaration of Helsinki, British Medical Journal, 1964) for medical research involving human participants.
2.2Procedures
2.2.1General
The relationship between VA estimated through ITT and moments produced in ISOM and CON contractions at various levels of effort during knee extension were investigated. All tests were performed on the dominant lower limb. Subjects were instructed to exert five different levels of effort between 100% and 20% maximal voluntary contraction (MVC), differing by 20%, in ISOM contractions at 50
2.2.2Familiarization
In order to ease the test, subjects were accustomed to the unfamiliar motor task by performing 3 to 5 submaximal voluntary contractions for each condition and level of effort.
2.2.3Test sequencing
For each level of effort, subjects performed two ISOM contraction tests, three CON60 contraction tests and three CON120 contraction tests. Timed 3-min rest periods separated each level of effort and 5-min rest periods separated each test. A subjectively maximal (100%) effort was requested first. Submaximal efforts (80% to 20%) were then required in decreasing order. This sequence was found to facilitate the elicitation of progressively decreasing efforts, closed to the requested ratio of the maximal effort, and their stability along the whole range of motion. For each subject, all tests were conducted in the same day. The rest pauses, in agreement with the literature, were deemed sufficient to prevent the onset of relevant fatigue [24], also considering the fact that most of the requested efforts were submaximal (Fig. 1).
2.2.4Moment recording
During ISOM contractions, the extension moment was measured at 50
2.2.5Surface electromyography (EMG) recording
In this study, surface EMG was recorded only to ascertain the relaxed state of the Vastus lateralis and of the homolateral Biceps femoris. Two pairs of silver chloride surface electrodes were applied on each muscle as per the SENIAM guidelines [28]. Low impedance (
2.2.6Electrical stimulation
VA level was determined by percutaneous electrical stimulation through two reusable wetted rubber electrodes. The anode was positioned medially on the anterior aspect of the upper thigh and the cathode was positioned medially on the anterior aspect of the lower thigh. The two electrodes (16
2.2.7ISOM contractions testing
Subjects were asked to perform ISOM contractions at various levels of subjective effort (see below). A first stimulus was delivered with the muscle fully relaxed (resting twitch, RT). Relaxation of Vastus lateralis and Biceps femoris was confirmed by the absence of surface EMG signals. Then, subjects were requested to produce maximal voluntary knee extensions until instructed to relax, about 5 s after a force plateau was reached. The stimulation was manually triggered within 2–3 s after the start of each contraction during a force plateau (interpolated twitch, IT). Within 3–6 s following each contraction, a third stimulus was delivered to the muscle at complete rest.
2.2.8CON contractions testing
Subjects were asked to perform voluntary knee extensions at two constant angular velocities (60
In order to measure the RT the leg was passively moved by the machine lever through the same range of motion at the same angular velocity (continuous passive motion, CPM).
Through a customized software routine, the instant of stimulation was computed in order to make the moment of the interpolated twitch to peak at exactly 50
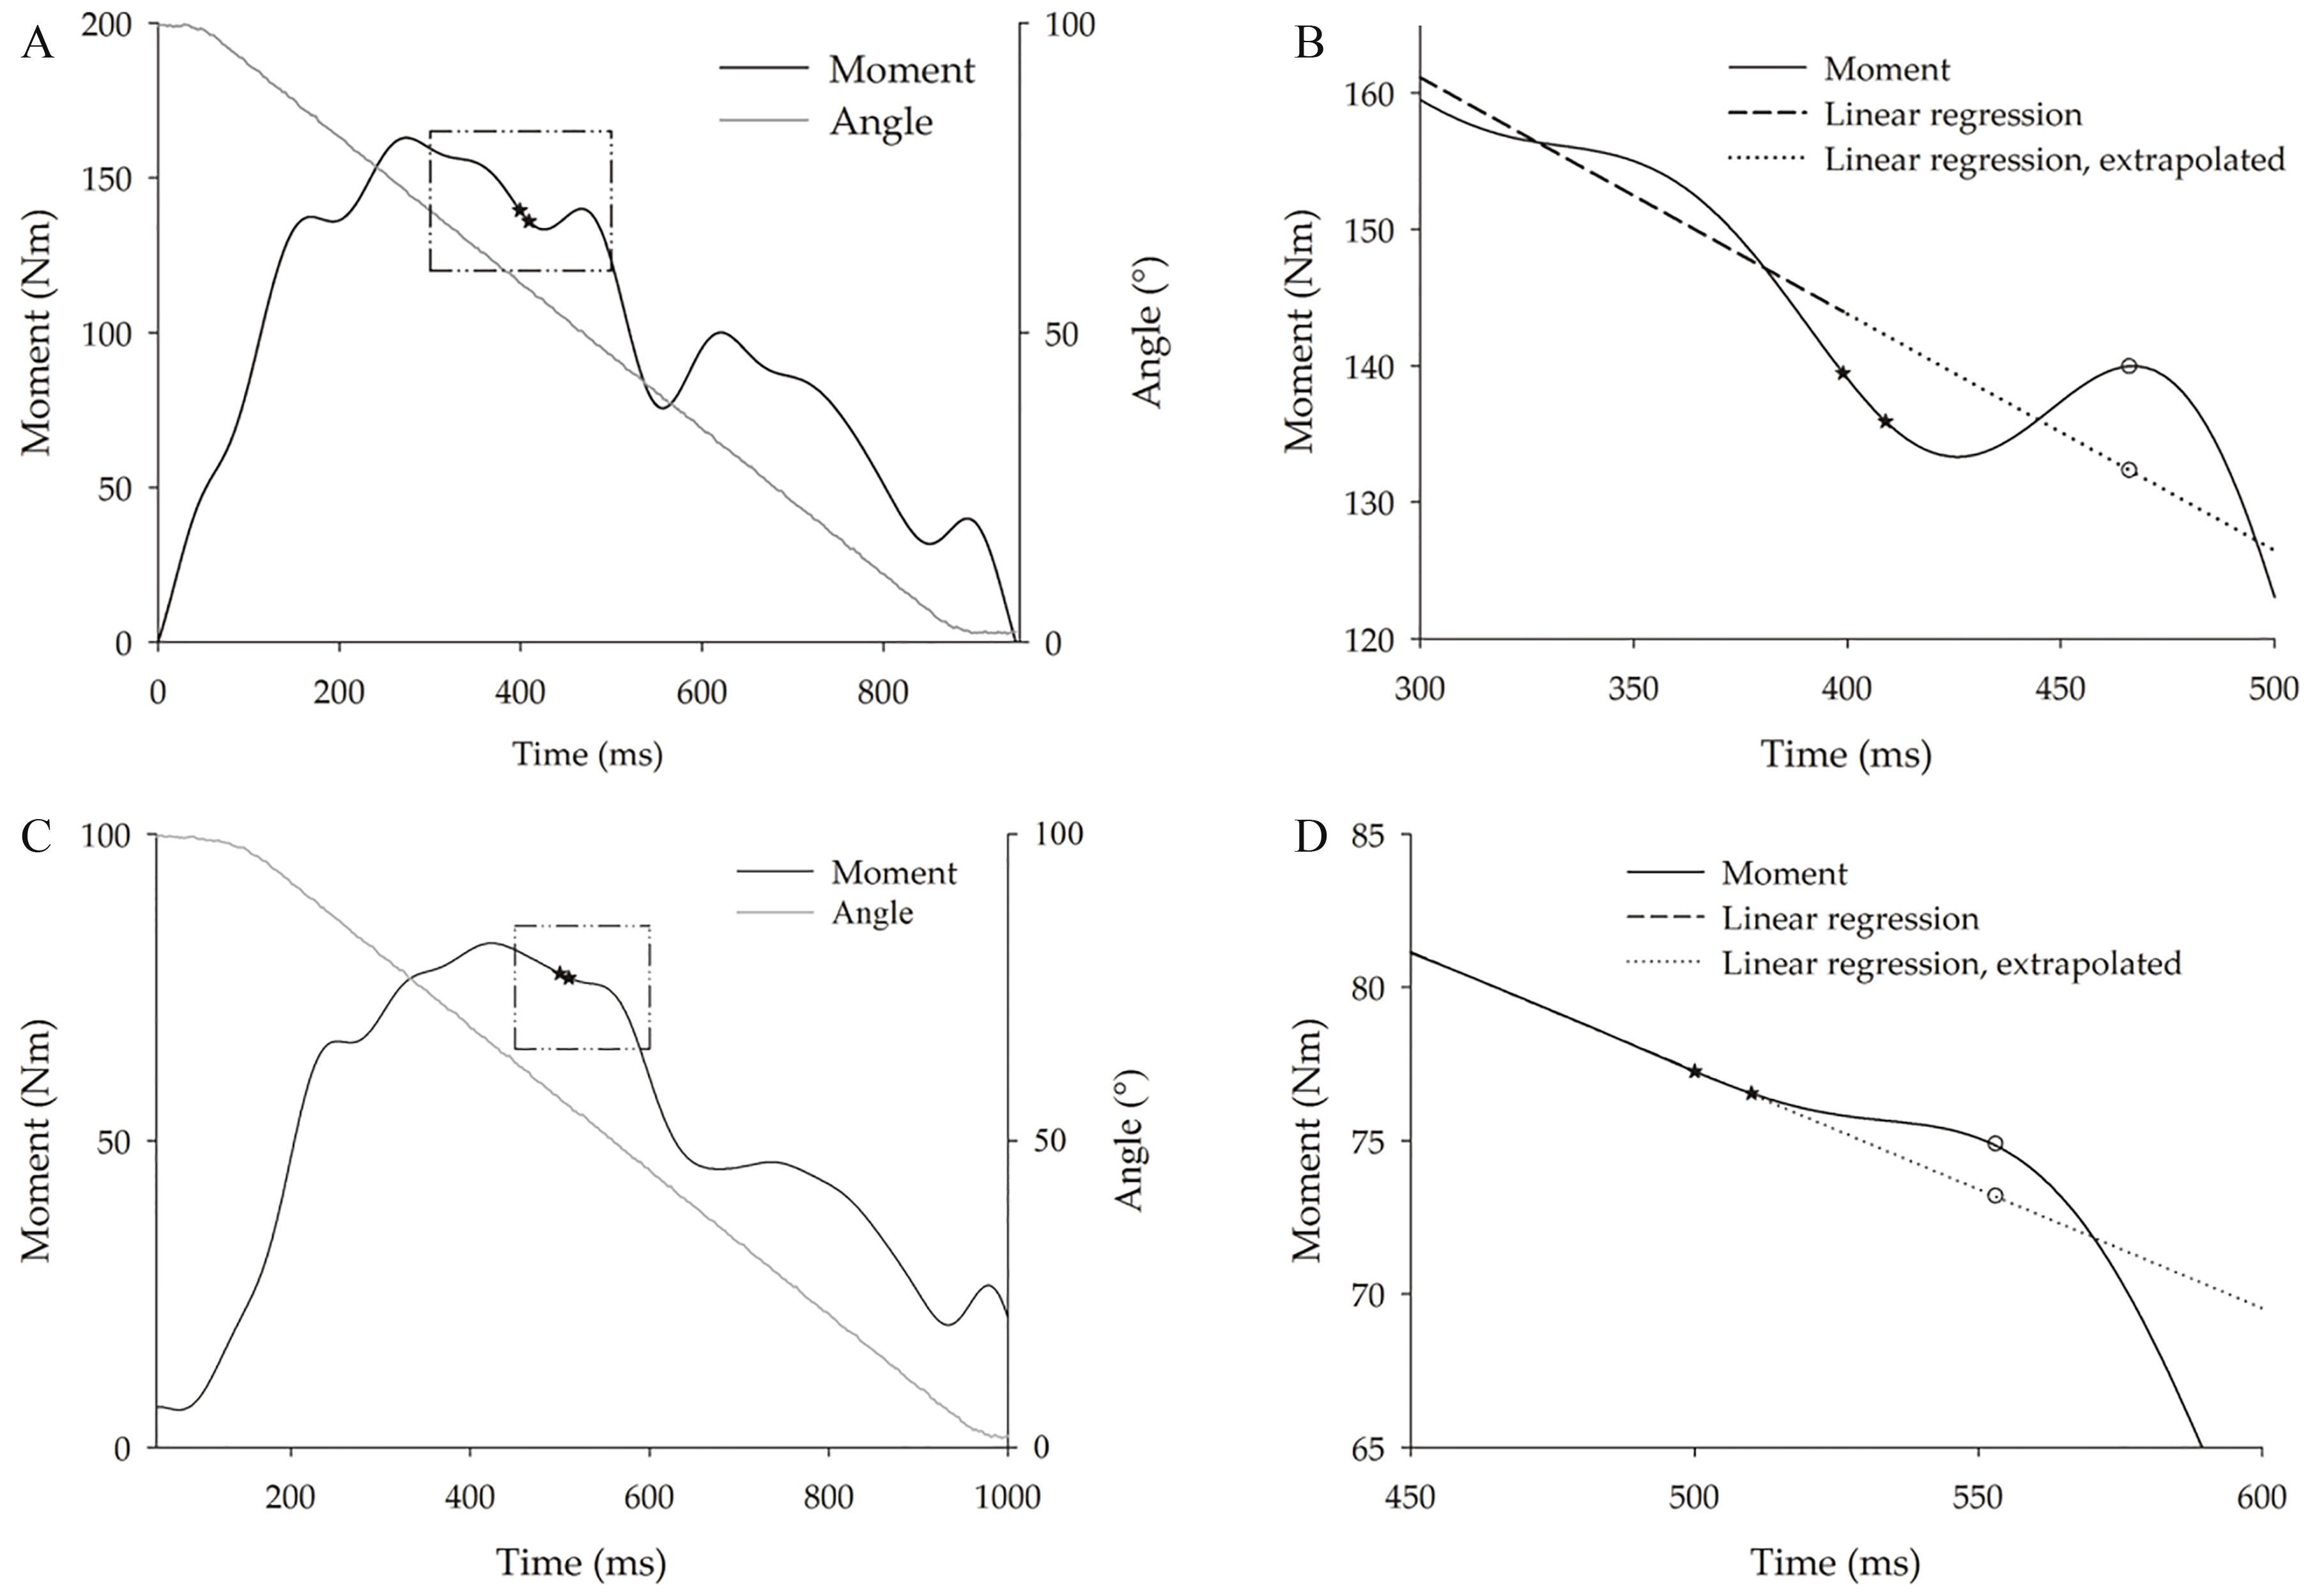
Figure 2.
Representative tracings of knee extension moment over time during (A and B) 60% and (C and D) 100% maximal voluntary CON120 contractions. Continuous black line: moment-time curve; stars: doublet of electrical stimuli. A) The continuous gray line represents the knee angle. B) The area encased by the square delimited by dash-dot line in panel A is expanded. The dashed black line gives the regression line of the voluntary moment computed from data recorded during the 100 ms preceding the stimulus; the dotted line represents its extrapolation, i.e. the estimated moment that would have occurred without stimulation. C) Example of a trial in which the stimulus did not determine a peak moment, but a transient flattening of the moment decay instead. D) The area encased by the square delimited by dash-dot segments in panel C is expanded. IT peak was computed as the highest distance between the observed (empty circle on the continuous black line) and the simultaneous extrapolated moment (empty circle on the dotted line).
2.2.9Data processing and analysis
A signal acquisition system (CED 1401, Cambridge Electronic Designed Limited-Ced, Cambridge, UK) was used to simultaneously record moment, knee angle, and angular velocity from the isokinetic dynamometer. Moment, knee angle, and angular velocity were sampled at 500 Hz. A customized software (Spike 2, version 8, Cambridge Electronic Design Limited-CED, Cambridge, UK), connected to the acquisition system, controlled the electric stimulator in order to elicit the stimulus at the desired knee angle. All data were off-line stored and processed. The average moment applied to the transducer with the lower limb fully extended was used to offset moment data at all angles, by proper computation. Moment signals were off-line filtered (low pass FIR filter, 1.3 Hz).
VA was calculated using the following formula
(1)
where IT (Interpolated Twitch) represents the increment in moment evoked during the contraction and RT represents the increment in moment evoked by the same stimulus during relaxation.
Table 1
Demographic characteristics of the study participants. Values are means (SD)
| Age (years) | Height (cm) | Weight (kg) | BMI (kg/m | Isometric peak moment/weight (Nm/kg)* | |
|---|---|---|---|---|---|
| Total ( | 25.7 (5.6) | 172.9 (9.3) | 64.8 (11.2) | 21.5 (2.3) | 2.45 (0.41) |
| Women ( | 26.4 (6.9) | 165.8 (9.3) | 56.7 (8.0) | 20.6 (2.1) | 2.20 (0.20) |
| Men ( | 25.1 (4.1) | 180.0 (6.6) | 72.9 (7.4) | 22.5 (2.1) | 2.70 (0.43) |
BMI: body mass index. *Weight-normalized isometric peak moments refer to 10 subjects (5 women and 5 men) who performed the isometric test.
IT was computed as the difference between the visible moment increment following the delivery of the stimulus and the moment value at the instant of the delivery of the stimulus, during both rest and contraction.
During CON contractions, a bell-shaped moment-angle relationship is observed, peaking around 75–80
Computations, statistics, and graphic representations were performed using MATLAB™ (MathWorks Inc., version 8, Natick, MA, USA), STATA™ (STATA Corp., version 14.0, College Station, TX, USA), and SigmaPlot™ (Systat software Inc., version 14.0, San Jose, CA, USA) software.
2.2.10Normalization
Moment values for each subject and contraction condition were expressed as a percentage of the maximal moment level estimated by the linear regression of the relationship between VA and moment.
2.3Statistical analyses
A standard linear regression was performed to model the relationship between VA and moment for the three conditions (ISOM, CON60 and CON120 contractions, dummy-coded). In order to test the statistical equivalence of the regression lines, a multiple linear regression was conducted among VA, moment, contraction conditions (dummy-coded), and their interactions. In case of significant models, a Tukey’s post-hoc test was run on contrasts between pairs of conditions. The level of significance for all statistical tests was set at
3.Results
Twenty-two healthy volunteers (11 women and 11 men), with a mean (standard deviation, SD) age of 25.7 (5.6) yr., a mean (SD) body mass of 64.8 (11.2) kg, and a mean (SD) height of 172.9 (9.3) cm, (Table 1) were enrolled in the study (see Methods).
The relationship between VA and moment during ISOM and CON contractions at 60 and 120
4.Discussion
The sample size of the present study is in agreement with previous studies on isometric [7, 12, 31], and isokinetic testing [17], based on 6–10 subjects. The validity of the ITT itself as an index of voluntary activation has been challenged on different grounds: criticisms arose from biomechanical considerations (e.g. the bias introduced by muscular fatigue, the risk for coactivation of antagonists, the risk for antidromic collision of the superimposed shock with the descending volitional drive) and from strictly methodological problems (the pros and cons of multiple shocks, and the inconsistencies across twitches evoked by electrical stimulation of the nerve trunk or by magnetic stimulation of the motor cortex). All considered, consensus exists that ITT still retains its overall validity as an index of VA, although the need for skill in execution and experience in interpretation cannot be overemphasized [8, 32].
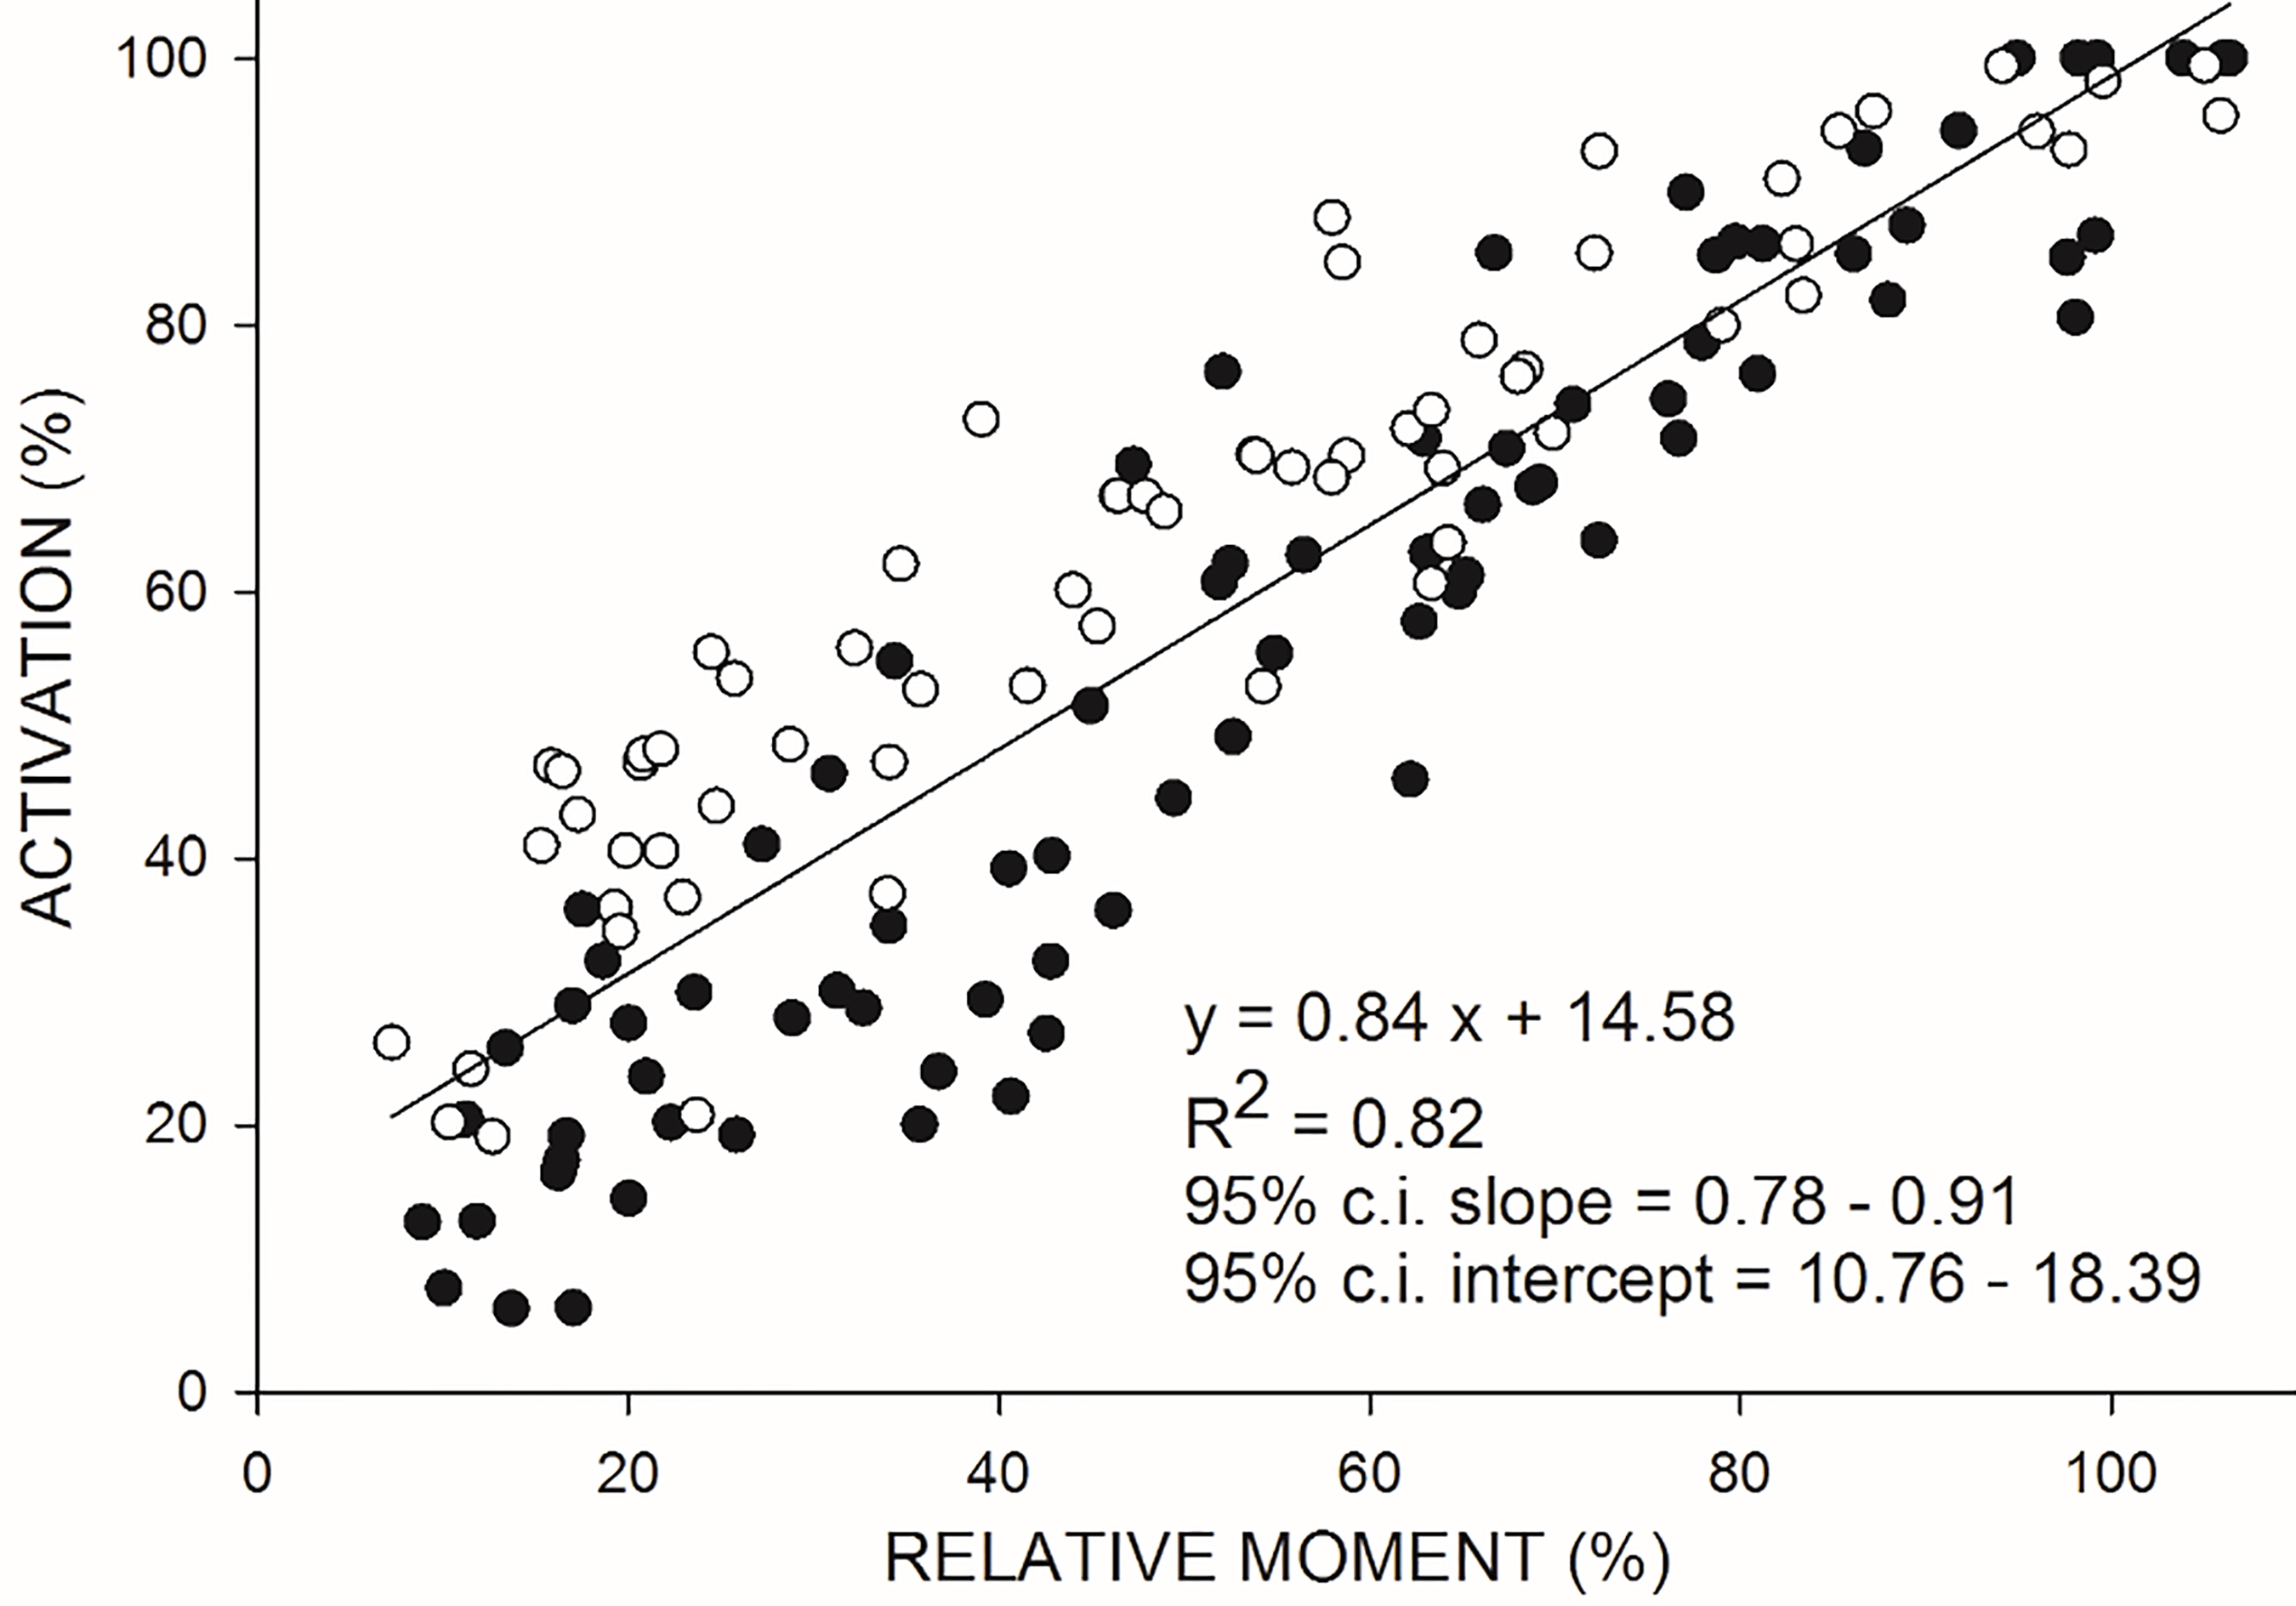
Figure 3.
Relationship between VA (on the ordinate) and moment (on the abscissa) during isometric (ISOM) contractions. Moment values were standardized with respect to the individual estimated maximal moment. White and black dots refer to each of the two trials performed by 5 women and 5 men, respectively. Data were best fitted by linear regression equation (see parameters given on the top right of the figure).
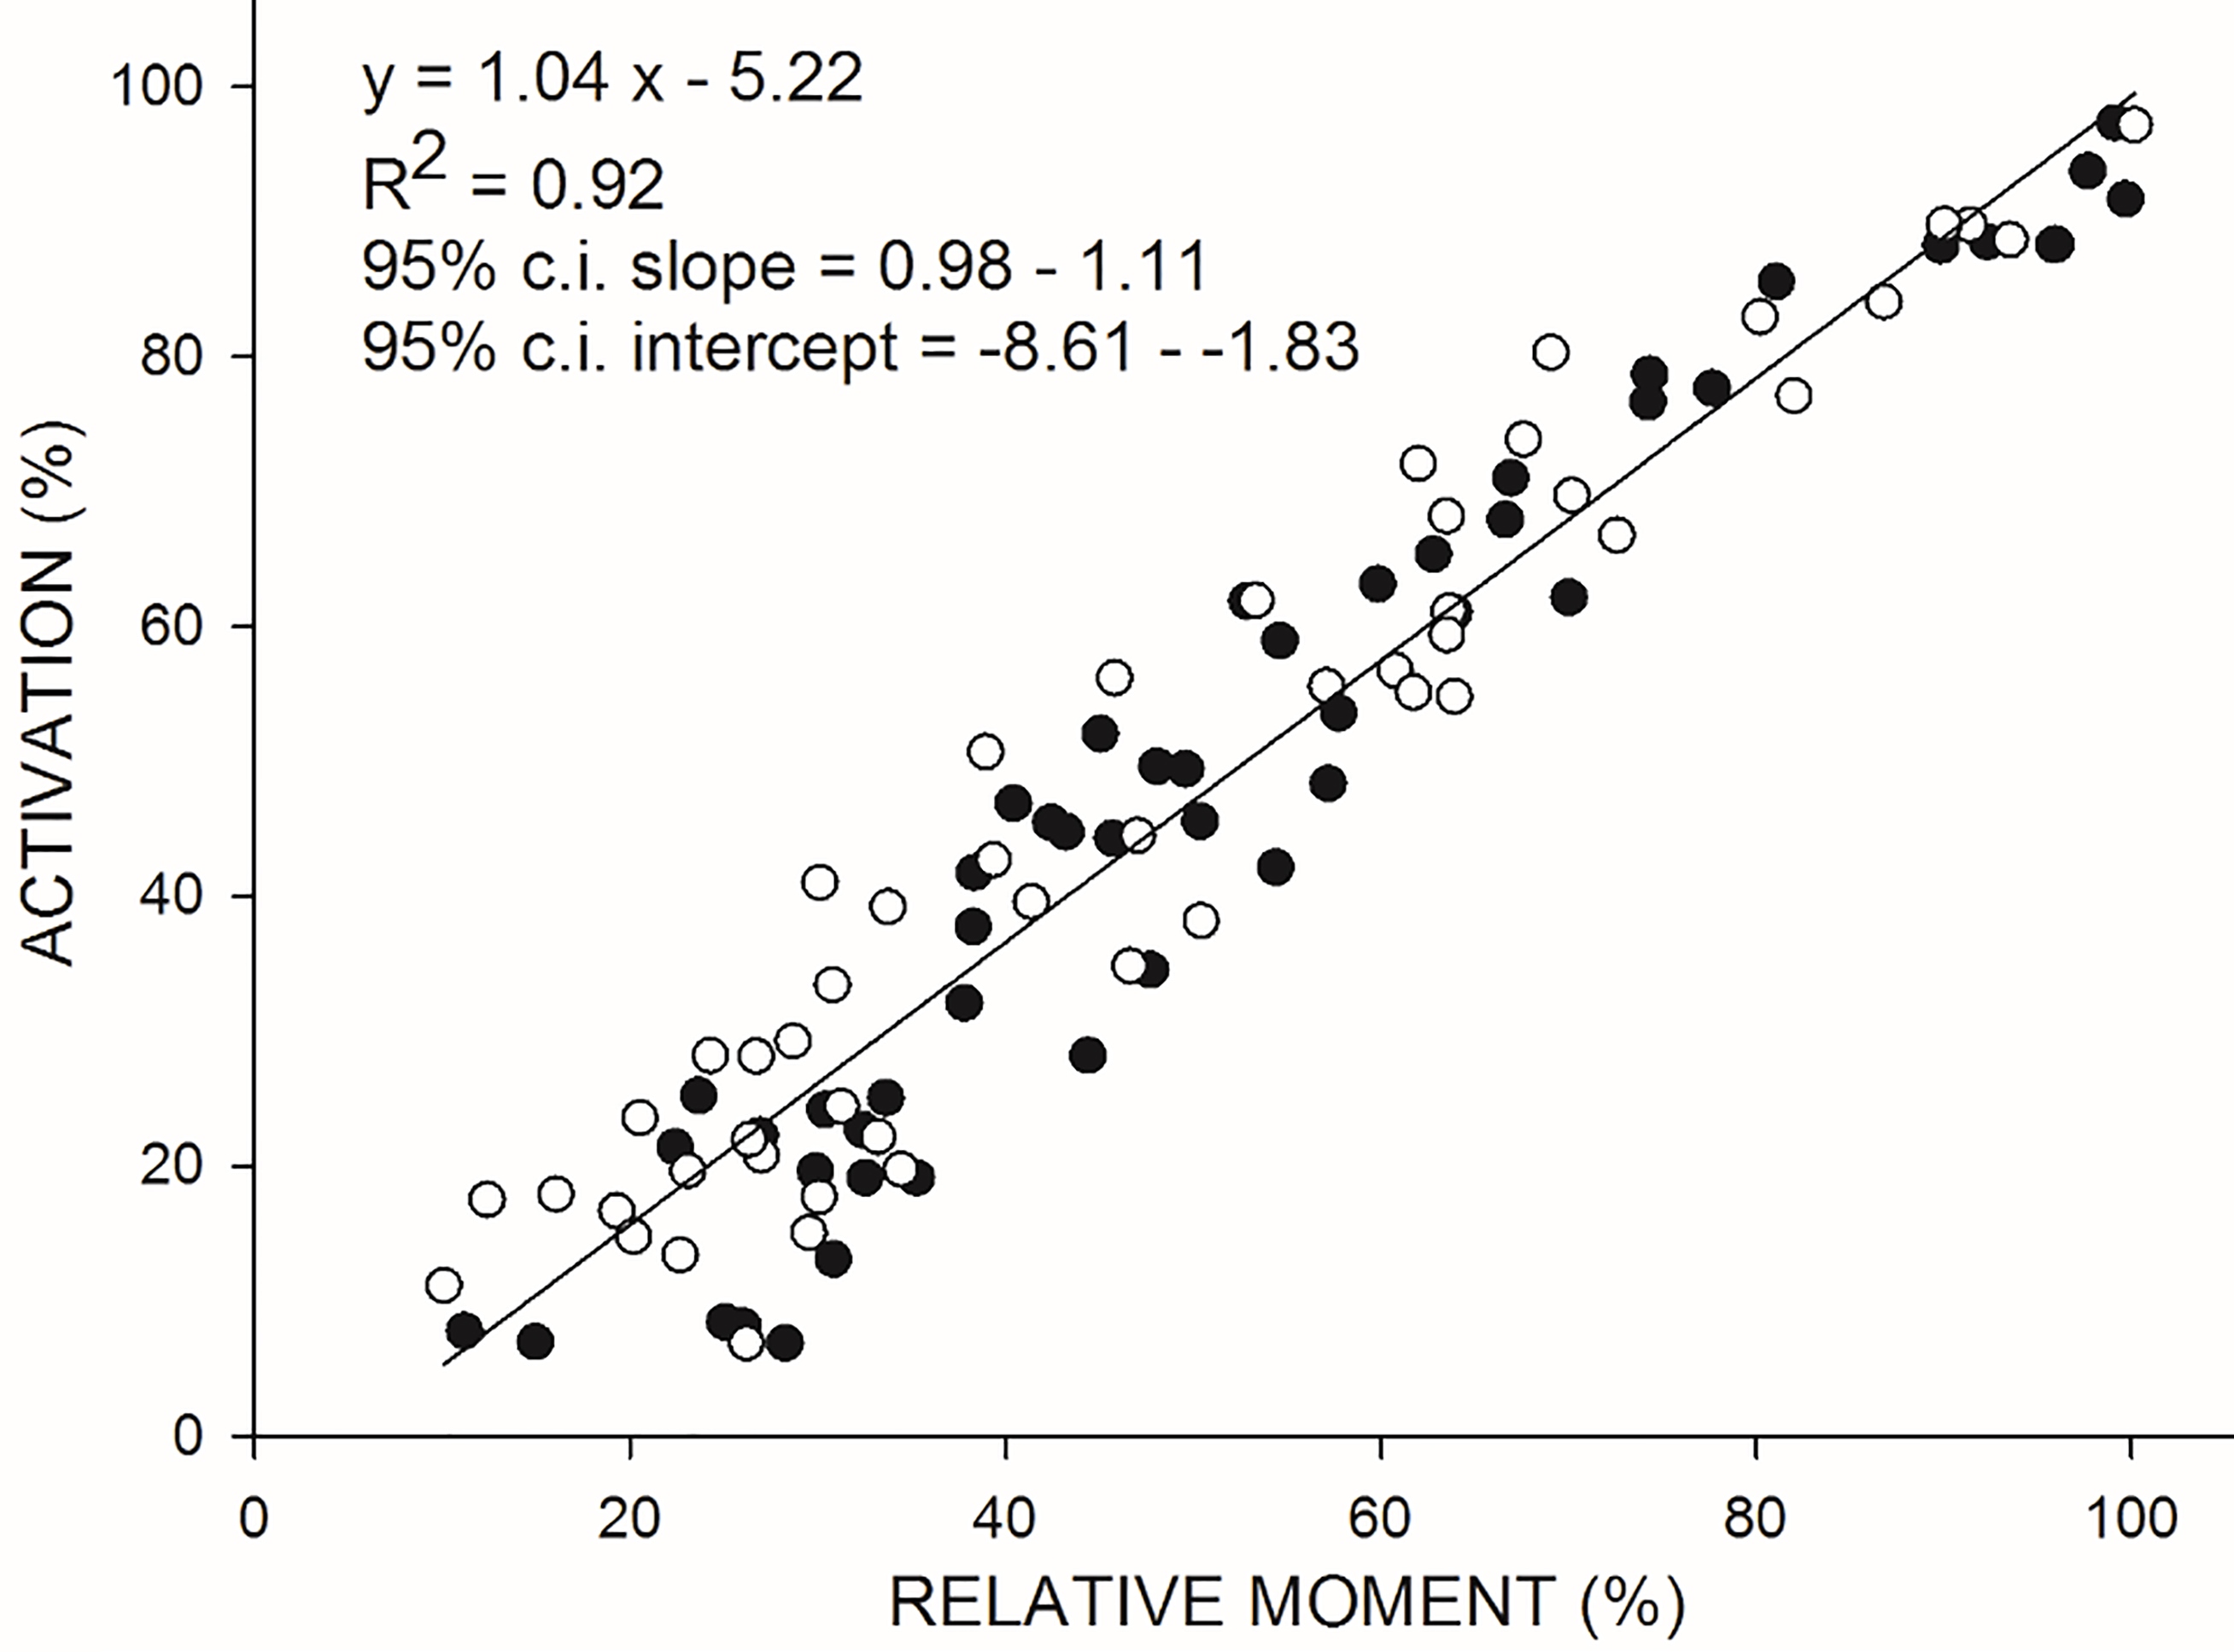
Figure 4.
Relationship between VA (on the ordinate) and relative moment (on the abscissa) during isokinetic concentric (CON60) contractions at 60
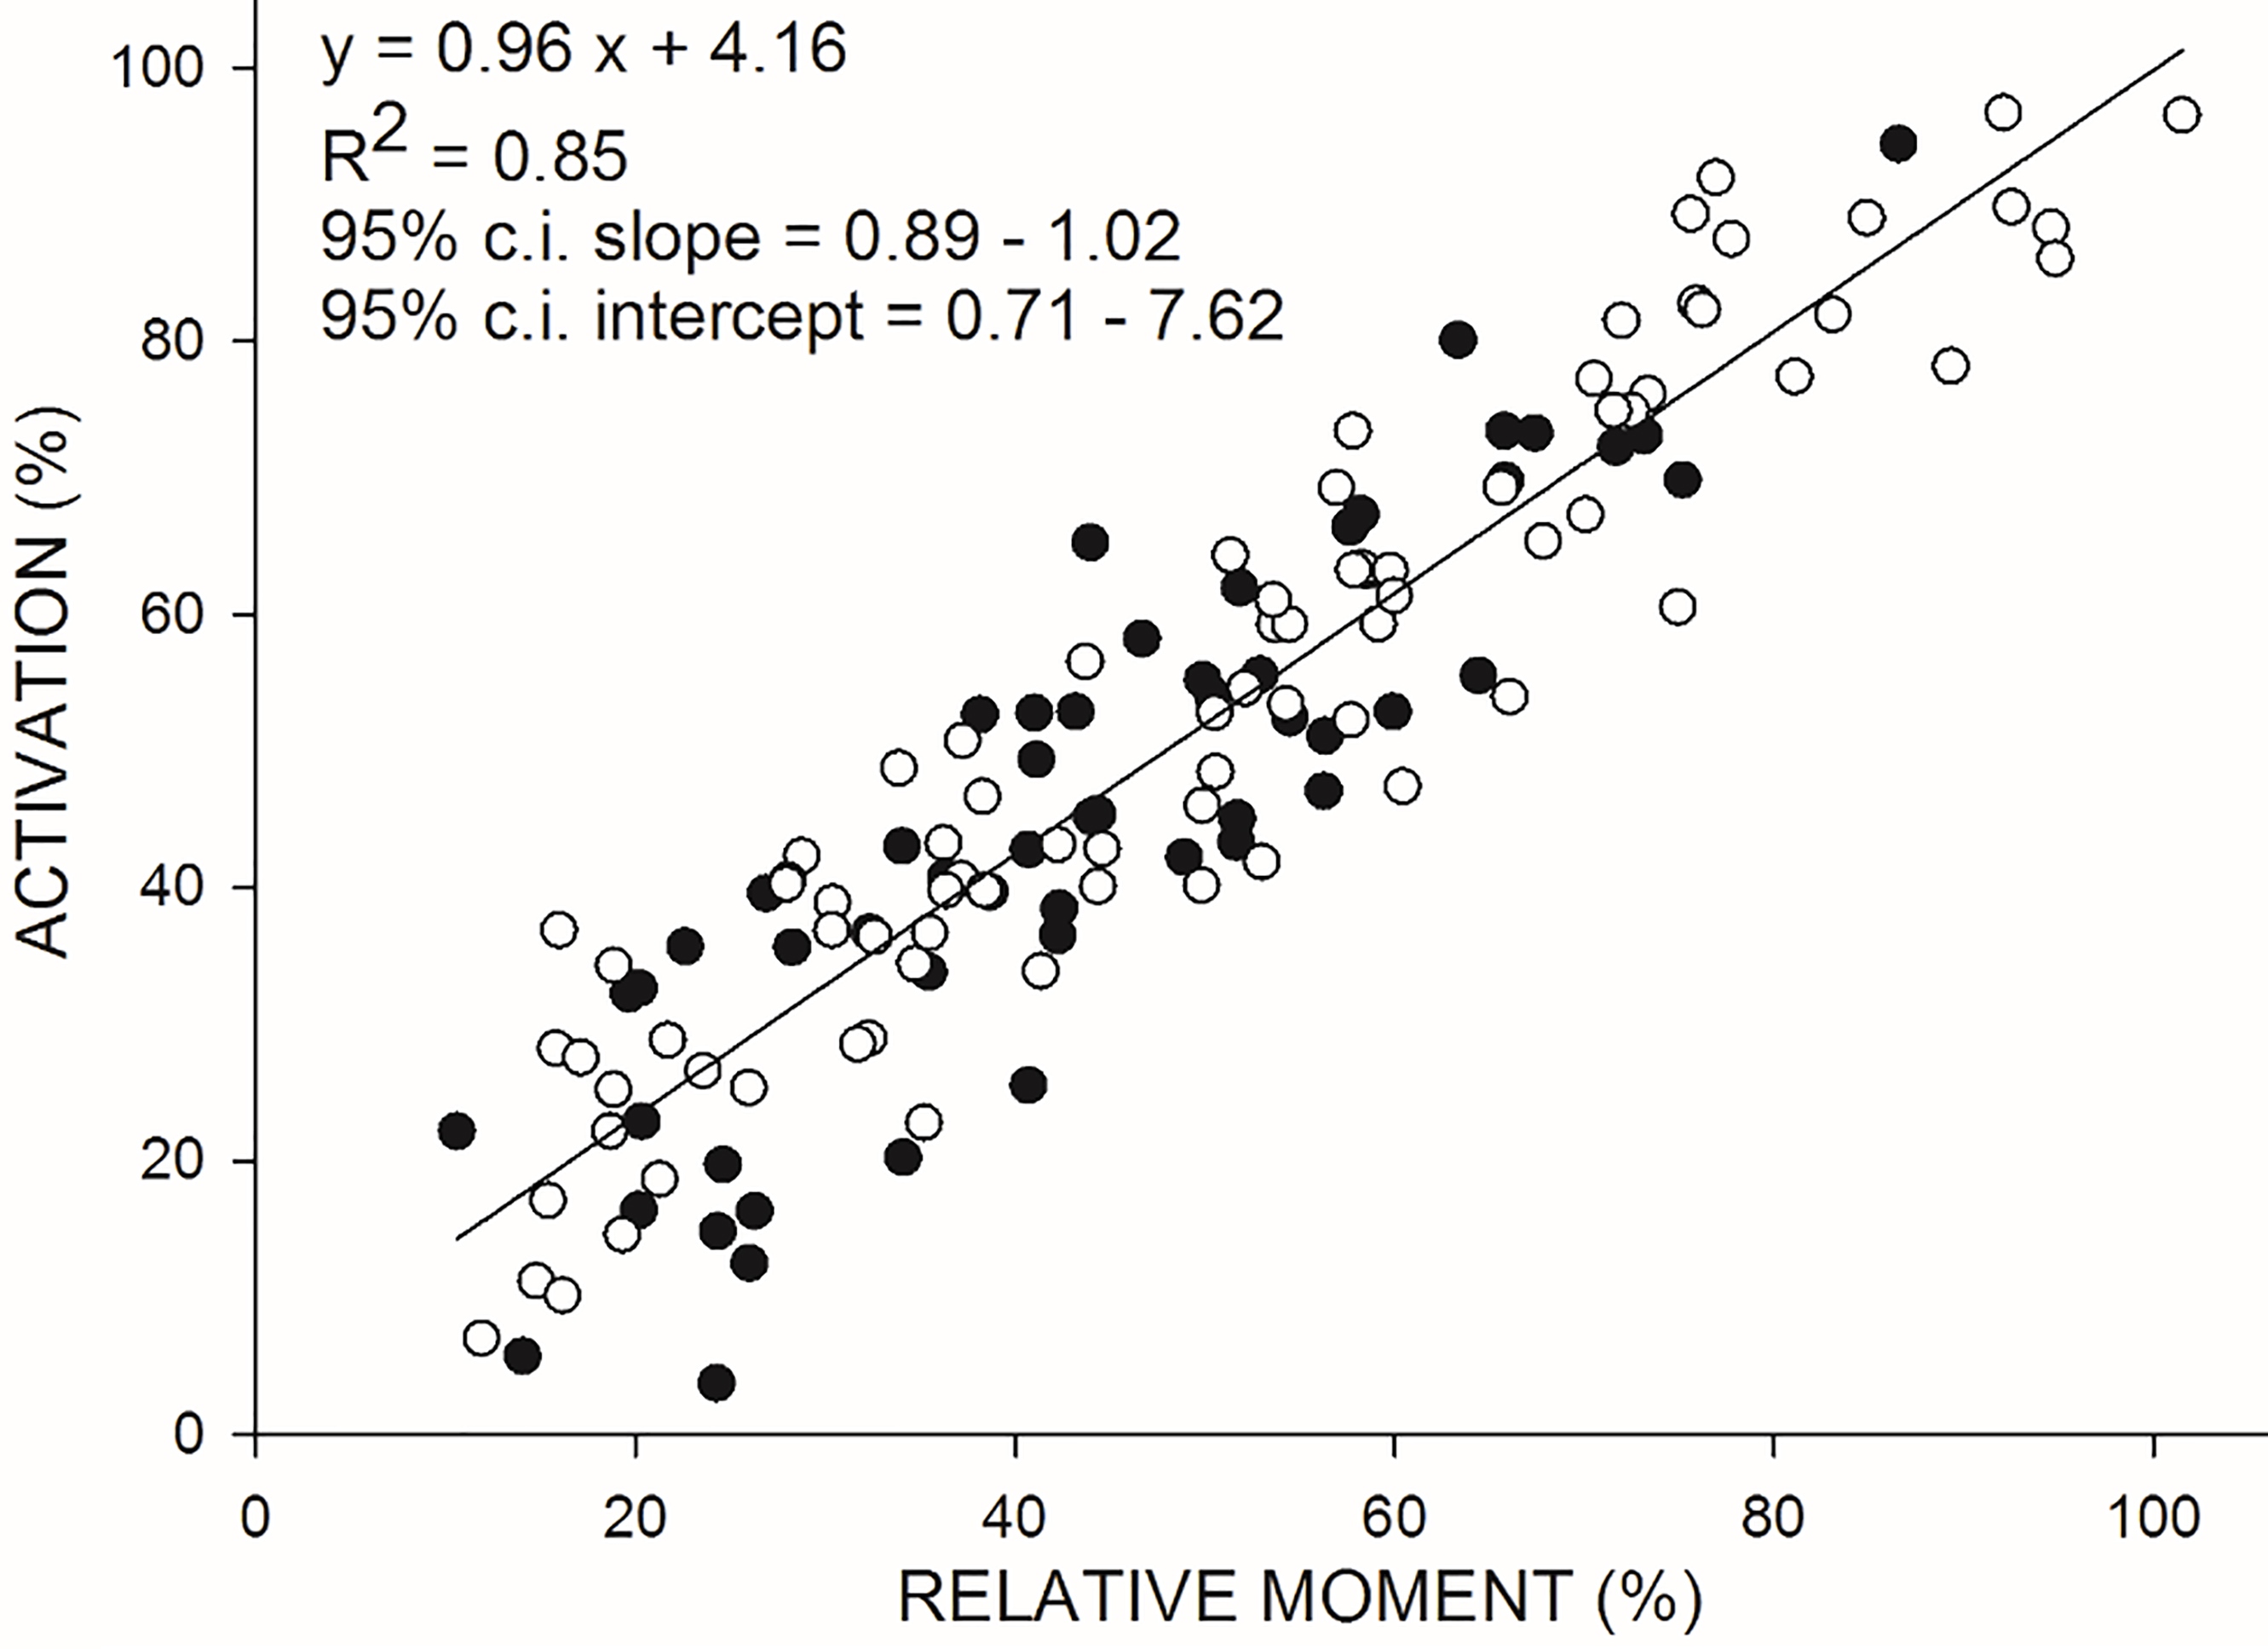
Figure 5.
Relationship between VA (on the ordinate) and relative moment (on the abscissa) during isokinetic concentric (CON120) contractions at 120
Most of the current physiological debate, however, turns on isometric contractions. The scarce previous studies on VA during CON contractions provided conflicting results. Some authors observed that during maximal CON contractions at both slow (20
In the present study, the ITT generated by a doublet of electrical stimuli was adapted for application during CON contractions at 60 and 120
Research on VA during CON contractions is scarce. One study applied the ITT technique to the investigation of the relationship between VA and peak moment during CON contractions at 20
The divergence across these few studies may be ascribed to methodological issues. At least two major technical difficulties may undermine the measurement of VA during CON contractions. First, the exact amplitude of twitches can be difficult to appreciate against a background force that, unlike in ISOM efforts, undergoes complex systematic changes. For instance, the estimation procedure (see Fig. 2) of the “basal” expected moment against which the twitch peak increment was computed in the present study was similar, but not equivalent, to that proposed in a previous article [17]. Secondly, the joint angle at which the twitch is peaking, and hence the instant of the stimulus delivery, must be carefully predetermined. Only few previous studies reported the use of a programmed delay in order to make the peak force to occur as synchronously as possible with respect to the desired knee angle [16, 40]. On the contrary, the majority of researches reported the delivery of impulses to occur at a constant knee flexion angle whatever the angular velocity, which implies that the peak of the twitch force does not occur at the same angle [11, 39].
The rate of force development (RFD) could be also an interesting index of validity of the method. The capacity to modulate not only force but, also, its rate of development, is a fundamental property of neural control. This modulation is already possible at the level of a single motor unit [41]. Unfortunately, little is known on the RFD-activation relationship in our context. In the majority of past studies only maximal efforts were requested [42]. In addition, these were focused on RFD during isometric contractions with a few exceptions focusing on RFD during dynamic movements, in any case with maximal effort, only [43, 44]. An isolated report suggested that RFD is rather constant once 30% or more of the maximal force is required [45].
The main limitation of the present study lies in the small range of velocities tested. These are presumably suitable for rehabilitation studies but lower than those achieved in some daily activities such as sit-up, and in many sports. Also, the assumption of data homoscedasticity in the linear regression model may not be fully met, given that the normalization of the moment values needed to achieve the subjects’ comparability led to a ceiling effect. Moreover, the limited sample adopted, although hopefully sufficient to validate the method itself, is not sufficient to provide robust normative references for future clinical applications.
5.Conclusions
One of the main goals of the present study was to validate the method in view of future applications in sports and rehabilitation sciences. These are still very scarce, although some examples exist of measurement of VA during CON contractions in peripheral/muscular impairments [14], (i.e., evaluation of VA after anterior cruciate ligament reconstruction) and neuromuscular fatigue [40, 46]. There is evidence that VA is suboptimal in many sport performances, and that it may decrease in various orthopedic and neurologic conditions, due to inhibition of peripheral origin and/or primitive limitations in the central neural drive. This deficit may be dependent on the velocity of muscle shortening [39]. Therefore future research might specifically aim at the development of training techniques targeting VA, both in sports and rehabilitation sciences. Proposals already exist. Some are of behavioral nature. These include plyometric exercises [47], motor imagery [48], and various forms of enhanced feedback capturing the EMG signal [49]. The most promising form of exercise is perhaps the EMG-triggered electrical stimulation of paretic muscles [50]. Other pioneering approaches are neurophysiological: this is the case for various forms of non-invasive electrical or magnetic brain stimulation, aimed at increasing the volitional drive after brain damage [51]. Such developments, in any case, require a reliable previous measurement of VA in both ISOM and CON contractions, and valid outcome measures. The method presented here may thus complement the functional assessment of force production and the validation of novel training and rehabilitation programs.
Acknowledgments
This research was funded by Istituto Auxologico Italiano, IRCCS, AMULET project, Ministry of Health, “Ricerca Corrente 2017”.
Conflict of interest
There are no conflicts of interests.
References
[1] | Gandevia SC. Spinal and supraspinal factors in human muscle fatigue. Physiol Rev (2001) ; 81: : 1725-89. |
[2] | Molloy CB, Al-Omar AO, Edge KT, Cooper RG. Voluntary activation failure is detectable in some myositis patients with persisting quadriceps femoris weakness: An observational study. Arthritis Res Ther BioMed Central (2006) ; 8: : R67. |
[3] | Osternig LR. Isokinetic dynamometry: Implications for muscle testing and rehabilitation. Exerc Sport Sci Rev (1986) ; 14: : 45-80. |
[4] | Massion J. Postural changes accompanying voluntary movements. Normal and pathological aspects. Hum Neurobiol (1984) ; 2: : 261-7. |
[5] | Merton PA. Voluntary strength and fatigue. J Physiol (1954) ; 123: : 553-64. |
[6] | Allen GM, Gandevia SC, McKenzie DK. Reliability of measurements of muscle strength and voluntary activation using twitch interpolation. Muscle Nerve (1995) ; 18: : 593-600. |
[7] | Behm DG, St-Pierre DM, Perez D. Muscle inactivation: Assessment of interpolated twitch technique. J Appl Physiol (1996) ; 81: : 2267-73. |
[8] | Taylor JL. Point: Counterpoint: The interpolated twitch does/does not provide a valid measure of the voluntary activation of muscle. J Appl Physiol (2009) ; 107: : 354-5. |
[9] | Gandevia SC, Herbert RD, Leeper JB. Voluntary activation of human elbow flexor muscles during maximal concentric contractions. J Physiol (1998) ; 512: : 595-602. |
[10] | Belanger AY, McComas AJ. Extent of motor unit activation during effort. J Appl Physiol (1981) ; 51: : 1131-5. |
[11] | Babault N, Pousson M, Michaut A, Van Hoecke J. Effect of quadriceps femoris muscle length on neural activation during isometric and concentric contractions. J Appl Physiol (2003) ; 94: : 983-90. |
[12] | Burke D, Hagbarth KE, Löfstedt L. Muscle spindle activity in man during shortening and lengthening contractions. J Physiol (1978) ; 277: : 131-42. |
[13] | Kawakami Y, Kubo K, Kanehisa H, Fukunaga T. Effect of series elasticity on isokinetic moment-angle relationship in humans. Eur J Appl Physiol (2002) ; 87: : 381-7. |
[14] | Otzel DM, Chow JW, Tillman MD. Long-term deficits in quadriceps strength and activation following anterior cruciate ligament reconstruction. Phys Ther Sport (2015) ; 16: : 22-8. |
[15] | Shield A, Zhou S. Activation with the twitch interpolation technique. Sport Med (2004) ; 34: : 253-67. |
[16] | Newham DJ, McCarthy T, Turner J. Voluntary activation of human quadriceps during and after isokinetic exercise. J Appl Physiol (1991) ; 71: : 2122-6. |
[17] | Babault N, Pousson M, Ballay Y, Van Hoecke J. Activation of human quadriceps femoris during isometric, concentric, and eccentric contractions. J Appl Physiol (2001) ; 91: : 2628-34. |
[18] | Bülow PM, Nørregaard J, Danneskiold-Samsøel B, Mehlsen J. Twitch interpolation technique in testing of maximal muscle strength: Influence of potentiation, force level, stimulus intensity and preload. Eur J Appl Physiol Occup Physiol (1993) ; 67: : 462-6. |
[19] | Nørregaard J, Lykkegaard JJ, Bülow PM, Danneskiold-Samsøe B. The twitch interpolation technique for the estimation of true quadriceps muscle strength. Clin Physiol (1997) ; 17: : 523-32. |
[20] | Roos MR, Rice CL, Connelly DM, Vandervoort AA. Quadriceps muscle strength, contractile properties, and motor unit firing rates in young and old men. Muscle Nerve (1999) ; 22: : 1094-103. |
[21] | Robbins H. Some aspects of the sequential design of experiments. Bull Amer Math Soc (1952) ; 58: : 527-35. |
[22] | Wald A. Sequential Analysis. New York: John Wiley Sons, Inc.; (1948) . |
[23] | Elias LJ, Bryden MP, Bulman-Fleming MB. Footedness is a better predictor than is handedness of emotional lateralization. Neuropsychologia (1998) ; 36: : 37-43. |
[24] | Willardson J. A brief review: Factors affecting the length of the rest interval between resistance exercise sets. J Strength Cond Res (2006) ; 20: : 978-84. |
[25] | Li CK, Chan KM, Hsu SY, Chien P, Wong MW, Yuan Y. The Johnson antishear device and standard shin pad in the isokinetic assessment of the knee. Br J Sports Med (1993) ; 27: : 49-52. |
[26] | Kufel TJ, Pineda LA, Mador MJ. Comparison of potentiated and unpotentiated twitches as an index of muscle fatigue. Muscle Nerve (2002) ; 25: : 438-44. |
[27] | Place N, Maffiuletti NA, Martin A, Lepers R. Assessment of the reliability of central and peripheral fatigue after sustained maximal voluntary contraction of the quadriceps muscle. Muscle Nerve (2007) ; 35: : 486-95. |
[28] | Hermens HJ, Freriks B, Merletti R, Stegeman D, Blok J, Rau G, et al. European Recommendations for Surface ElectroMyoGraphy. Roessing Res Dev (1999) . |
[29] | Folland JP, Williams AG. Methodological issues with the interpolated twitch technique. J Electromyogr Kinesiol (2007) ; 17: : 317-27. |
[30] | Taylor NA, Cotter JD, Stanley SN, Marshall RN. Functional moment-velocity and power-velocity characteristics of elite athletes. Eur J Appl Physiol Occup Physiol (1991) ; 62: : 116-21. |
[31] | Bampouras TM, Reeves ND, Baltzopoulos V, Maganaris CN. Muscle activation assessment: Effects of method, stimulus number, and joint angle. Muscle Nerve (2006) ; 34: : 740-6. |
[32] | Horstman AM, Enoka RM, Girard O, Babault N, Herzog W, Racinais S, et al. Comments on Point: Counterpoint: The interpolated twitch does/does not provide a valid measure of the voluntary activation of muscle. J Appl Physiol (2009) ; 107: : 359-66. |
[33] | Suter E, Herzog W. Effect of number of stimuli and timing of twitch application on variability in interpolated twitch moment. J Appl Physiol (2001) ; 90: : 1036-40. |
[34] | Fukunaga T, Ichinose Y, Ito M, Kawakami Y, Fukashiro S. Determination of fascicle length and pennation in a contracting human muscle in vivo. J Appl Physiol (1997) ; 82: : 354-8. |
[35] | Reeves ND, Narici MV. Behavior of human muscle fascicles during shortening and lengthening contractions in vivo. J Appl Physiol (2003) ; 95: : 1090-6. |
[36] | Bobbert MF, van Ingen Schenau GJ. Isokinetic plantar flexion: Experimental results and model calculations. J Biomech (1990) ; 23: : 105-19. |
[37] | Harris RT, Dudley GA. Factors limiting force during slow, shortening actions of the quadriceps femoris muscle group in vivo. Acta Physiol Scand (1994) ; 152: : 63-71. |
[38] | Ichinose Y, Kawakami Y, Ito M, Kanehisa H, Fukunaga T. In vivo estimation of contraction velocity of human vastus lateralis muscle during “isokinetic” action. J Appl Physiol (2000) ; 88: : 851-6. |
[39] | Babault N, Pousson M, Michaut A, Ballay Y, Hoecke V. EMG activity and voluntary activation during knee-extensor concentric moment generation. Eur J Appl Physiol (2002) ; 86: : 541-7. |
[40] | Babault N, Desbrosses K, Fabre M-S, Michaut A, Pousson M. Neuromuscular fatigue development during maximal concentric and isometric knee extensions. J Appl Physiol (2006) ; 100: : 780-5. |
[41] | Baldissera F, Campadelli P. How motoneurones control development of muscle tension. Nature (1977) ; 268: : 146-7. |
[42] | Maffiuletti NA, Aagaard P, Blazevich AJ, Folland J, Tillin N, Duchateau J. Rate of force development: Physiological and methodological considerations. Eur J Appl Physiol (2016) ; 116: : 1091-116. |
[43] | Tillin NA, Pain MTG, Folland JP. Contraction type influences the human ability to use the available moment capacity of skeletal muscle during explosive efforts. Proc R Soc B Biol Sci (2012) ; 279: : 2106-15. |
[44] | Adamson M, MacQuaide N, Helgerud J, Hoff J, Kemi OJ. Unilateral arm strength training improves contralateral peak force and rate of force development. Eur J Appl Physiol (2008) ; 103: : 553-9. |
[45] | Rodríguez-Rosell D, Pareja-Blanco F, Aagaard P, González-Badillo JJ. Physiological and methodological aspects of rate of force development assessment in human skeletal muscle. Clin Physiol Funct Imaging (2018) ; 38: : 743-62. |
[46] | Cometti C, Deley G, Babault N. Effects of between-set interventions on neuromuscular function during isokinetic maximal concentric contractions of the knee extensors. J Sport Sci Med (2011) ; 10: : 624-9. |
[47] | Behrens M, Mau-Moeller A, Mueller K, Heise S, Gube M, Beuster N, et al. Plyometric training improves voluntary activation and strength during isometric, concentric and eccentric contractions. J Sci Med Sport (2016) ; 19: : 170-6. |
[48] | Grosprêtre S, Jacquet T, Lebon F, Papaxanthis C, Martin A. Neural mechanisms of strength increase after one-week motor imagery training. Eur J Sport Sci (2018) ; 18: : 209-18. |
[49] | Schmidt RA, Lee TD. Augmented feedback. Human Kine. Mot. Control Learn. A Behav. Emphas. Champaign, IL; (2005) . |
[50] | Meilink A, Hemmen B, Seelen HAM, Kwakkel G. Impact of EMG-triggered neuromuscular stimulation of the wrist and finger extensors of the paretic hand after stroke: A systematic review of the literature. Clin Rehabil (2008) ; 22: : 291-305. |
[51] | Kang N, Summers JJ, Cauraugh JH. Non-Invasive Brain Stimulation improves paretic limb force production: A systematic review and meta-analysis. Brain Stimul (2016) ; 9: : 662-70. |


