
Machine learning approach for corona virus disease extrapolation: A case study
Abstract
Supervised/unsupervised machine learning processes are a prevalent method in the field of Data Mining and Big Data. Corona Virus disease assessment using COVID-19 health data has recently exposed the potential application area for these methods. This study classifies significant propensities in a variety of monitored unsupervised machine learning of K-Means Cluster procedures and their function and use for disease performance assessment. In this, we proposed structural risk minimization means that a number of issues affect the classification efficiency that including changing training data as the characteristics of the input space, the natural environment, and the structure of the classification and the learning process. The three problems mentioned above improve the broad perspective of the trajectory cluster data prediction experimental coronavirus to control linear classification capability and to issue clues to each individual. K-Means Clustering is an effective way to calculate the built-in of coronavirus data. It is to separate unknown variables in the database for the disease detection process using a hyperplane. This virus can reduce the proposed programming model for K-means, map data with the help of hyperplane using a distance-based nearest neighbor classification by classifying subgroups of patient records into inputs. The linear regression and logistic regression for coronavirus data can provide valuation, and tracing the disease credentials is trial.
1.Introduction
In the modern human way of life and existence, people suffer from a wide variety of diseases for which they are accustomed to consult medical procedures. Nowadays, medical professionals rely on an assortment of clinical trials to diagnose and treat diseases. Clinical pathology is an important part of the causal study of disease and major areas in modern medicine and diagnosis. There are different kinds of pathologies. They can be identified as general medical pathology, anatomical pathology, dermatopathology, cytopathology, forensic pathology and neuropathology. Since pathology is an important part of the medical field, it will continue to grow in the near future. Due to the emergence of new diseases of the day, some innovative improvements are needed to diagnose, treat and classify the COVID-19 disease. Coronavirus disease is an infectious disease caused by a recently discovered coronavirus. Most people infected with the virus will experience mild to moderate respiratory illness and recover without requiring special treatment. In this direction, the pathologist would like to see genetic-based laboratory testing and diagnosis. Humanity is suffering from an epidemic problem with the use of this method like statistic-based machine learning. This compendium can be used to store a database of people affected by each hospital infection and to estimate the number of people affected. Therefore, it is useful for preliminary investigation in hospitals. It can inform health care organizations about the affected area. Infectious diseases like coronavirus are the major diseases causing more problems in the society. These infections are affecting the economic and health condition of mortality today.
In this study an extensive research effort be located complete to identify studies that apply to more than one monitored machine-learning process on a disease approximation. Machine Learning Evolve Predicting epidemic data proposes statistical inference that is useful to society. The coronavirus is not an organism, but a protein aota (RNA) encased in a protective layer of phospholipid (fat) in which cells of the optic, nasal, or buccal mucosa terminates their hereditary sign. Turn them into antagonists and multiplication cells. Since the virus is not an organism, a protein molecule is not killed but degraded on its individual. Failure time depends on humidity, temperature and type of material. The coronavirus is very mild. Therefore, the only thing that protects here is the thin surface layer of the portal. A good solution is to use any cleanser or detergent because the foam will cut the portable, so we have to rub it in for no more than 20 seconds or make more foam. By dissolving the fat layer, the protein molecule dissolves itself. The heat melts the fat. That is why it is advisable to use water above 25
COVID-19 patient’s data can be analyzed, extracted, interpreted and tailored to prosecutions. Data mining is the enormous data of the data analysis and discovery process is the data stored in various databases such as the data granary is the extraordinary pattern that can be understood, the undetected, the valid, and the useful data. Data mining is a kind of classification and clustering methods are used to extract invisible samples from virtually large databases. The benefits of data mining include faster retrieval of data or information, retrieval of knowledge from several databases, detection of hidden patterns and undetected patterns, reduction of complexity level, saving time and so on. Data mining proficiency collects relevant information from Revenue Structured Patient Data. Then, it helps to achieve specific benefits. The purpose of a data mining effort is usually to create a detailed or live presence structure. Provides a detailed sample of the main features of the data set in abbreviated form. The uniqueness of the attendance model is that it allows estimating the unknown value of a specific variable for the data minor target variable. Our advantage of predictive and descriptive can be achieved using a variety of data mining methods. Data mining and machine learning come with a better public event tool than all fashions. We can apply this to numeric values for high dimensional inputs, characters, images, etc. Clustering-based non-supervised repetition in which includes code samples for some classic clustering techniques, such as K-Means. Unsupervised learning can extract important critical features from input data without additional data or guidance. These features can often be provided as input to more expansions; supervised practice is used and allows more effective learning for intricate tasks and compared to training on raw data. Usual instances are the extraction of attributes from X-ray images. These are important and critical capabilities for machine learning scaling, as these features are not far off, collected by experts in the human domain of craft and image processing, who have rare, slow and very expensive resources and often limited access to machine learning outcomes. One of the most upfront methods for feature extraction is to use auto encode. Autoencoder is a simple encoder-decoder building where encoder encodes input into compressed representation. The decoder then attempts to reconstruct the original input from the compressed encode representation. In this chapter, supervised /unsupervised machine learning procedures are a prevalent method in the field of data mining. Disease assessment using COVID-19 health data has recently shown the potential application area for these methods. This study classifies important tendencies in a variety of monitored machine learning procedures and their function and use for disease performance assessment.
2.Demographics of COVID-19 using Naive Bayes
In the COVID-19 trial, various teams of computational investigators applied Naïve Bayes classification method to a single cluster set of patient data gathered from hundreds of patients with severe Corona Virus. COVID-19 in which Assessment and Methods, is a platform for crowdsourced studies that focus on emerging computational tackles to solve biomedical problems. A rivalry serves as a large and long-standing. Severe Corona Virus presented a worthy challenge since there is no solitary genetic cause of the disease in which makes it hard to select treatments for patients suffering from the deadly breathing, continuous pain or pressure in your chest, bluish lips or face, and sudden confusion problem of the body. For COVID-19 in each is presented with training data from patients that included demographic information like age and gender and more complex data that describes signaling protein pathways believed to play a role in the disease. Assumed a demographic patients information record
Now, the record
3.Analysis of trajectory of COVID-19 data clustering network
Figure 1.
COVID-19 patients trajectory clustering network.
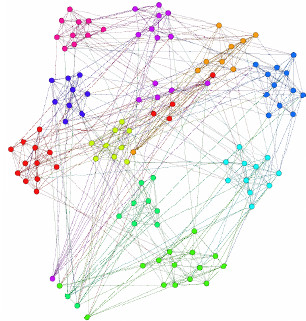
Clustering is an effective way to calculate the built-in COVID-19 cluster data and undetectable confusion. The development of GPS devices is characterized by maximum-maximum number of features that are recorded as sources on airwaves. To concentrate on affecting disease is related for this method.
With this expertise, we initially identified as primary of moving particles. The resemblances and similarities of these cells are determined by the trajectories. Finally, the result given by this trajectory is checked to see if it is correct. A patient with coronavirus infection is recognized by these means and a cluster is formed for easy identification. By observing the network diagram above, we can easily understand the concept of trajectory clustering network includes various districts of Andhra Pradesh such as West Godavari, East Godavari and Krishna grouped one by one at this time.
4.K-Means approach for COVID-19 unsupervised learning
K-Means clustering is a modest and simple clustering approach to performance. How many clusters (or
1. Make the cluster centroids.
2. Re-repetition until the impending together:
(a) For every
(b) For each
3.
5.Structural risk minimization of COVID-19
Let us select the cluster family of classifiers
6.Hyperplane
The unbiased of the hyperplane, Fredrick Jury, 2002, is to isolate unknown variables in the COVID-19 database for the disease detection process. For each cluster of the input patient data taken from the input devices. This input of COVID-19 patient apply for classification performance in which measure the feature of each patient in which is stored in the local database. Database
7.Association of COVID-19 cluster data using MapReduce based hyperplane
Table 1
COVID-19 dataset for India state wise
| S. No. | City names | Confirmed | Active | Recovered | Deceased |
|---|---|---|---|---|---|
| 1 | Andaman and Nicobar | 33 | 18 | 15 | 0 |
| 2 | Andhra Pradesh | 1332 | 1014 | 287 | 31 |
| 3 | Arunachal Pradesh | 1 | 0 | 1 | 0 |
| 4 | Assam | 38 | 8 | 29 | 1 |
| 5 | Bihar | 392 | 325 | 65 | 2 |
| 6 | Chandigarh | 56 | 39 | 17 | 0 |
| 7 | Chhattisgarh | 38 | 4 | 34 | 0 |
| 8 | Delhi | 3439 | 2291 | 1092 | 56 |
| 9 | Goa | 7 | 0 | 7 | 0 |
| 10 | Gujarat | 4082 | 3358 | 527 | 197 |
| 11 | Haryana | 310 | 98 | 209 | 3 |
| 12 | Himachal Pradesh | 40 | 14 | 25 | 1 |
| 13 | Jammu and Kashmir | 581 | 381 | 192 | 8 |
| 14 | Jharkhand | 107 | 85 | 19 | 3 |
| 15 | Karnataka | 535 | 298 | 216 | 21 |
| 16 | Kerala | 495 | 122 | 369 | 4 |
| 17 | Ladakh | 22 | 6 | 16 | 0 |
| 18 | Madhya Pradesh | 2561 | 1971 | 461 | 129 |
| 19 | Maharashtra | 9915 | 7890 | 1593 | 432 |
| 20 | Manipur | 2 | 0 | 2 | 0 |
| 21 | Meghalaya | 12 | 11 | 0 | 1 |
| 22 | Mizoram | 1 | 1 | 0 | 0 |
| 23 | Odisha | 125 | 85 | 39 | 1 |
| 24 | Puducherry | 8 | 5 | 3 | 0 |
| 25 | Punjab | 357 | 248 | 90 | 19 |
| 26 | Rajasthan | 2438 | 1619 | 768 | 51 |
| 27 | Tamil Nadu | 2162 | 925 | 1210 | 27 |
| 28 | Telangana | 1012 | 619 | 367 | 26 |
| 29 | Tripura | 2 | 0 | 2 | 0 |
| 30 | Uttar Pradesh | 2134 | 1585 | 510 | 39 |
| 31 | Uttarakhand | 55 | 19 | 36 | 0 |
| 32 | West Bengal | 758 | 612 | 124 | 22 |
Software usefulness that works in the network of trajectories in parallel to find solutions to large of COVID-19 data and process it using the MapReduce procedure. Hyperplane based MapReduce is an indoctrination outline that allows us to do distributed and parallel processing on large data sets in a distributed setting. The first step in COVID-19 Data Processing using MapReduce is the Mapper Class. At this time, Record Reader processes each Input of COVID-19 patient record and generates the respective key-value pair. Mapper store protects this intermediate patient data into the local repository. It is the rational representation of COVID-19 data. It signifies a chunk of effort that contains a single map task in the Hyperplane based MapReduce Program. The Record Reader interacts with the COVID-19 patient data input split and converts the obtained data in the form of Key-Value Pairs. The Intermediary output generated from the mapper is nourished to the reducer in which processes it and makes the last diseased output in which is then protected in the Hyperplane. The main constituent in a MapReduce job is a Hyperplane namely as Driver Class. It is in control for setting up a MapReduce to run-in Hadoop. We stipulate the designations of Mapper and Reducer Classes extended with data kinds and their own job names.
8.Understanding COVID-19 data analysis with machine learning
This section fully describes the famous business problems approach with the help of Libra and can be used to perform machine-learning operations on the Hadoop platform to overcome some memory problems. The two important rules of machine learning are as follows, namely as Linear regression and Logistic regression. This is one of the most important machine learning techniques used to know the relationship between target variables and exploratory variables. We use this method to estimate the target variables in numerical form. To know about the two types of regression, we first need to know about the target variables and the descriptive variables. Target variables: The values of the variables in the problem to be estimated are considered as “target variables.” Descriptive variables: Variables that help to estimate the value of target variables are called “explanatory variables.”
A. Linear Regression: Regression refers to the machine learning method where “LINEAR” refers to a straight line. This means that when we draw a graph between the variables in a given problem, if the points are cream around the straight line, then those variables have “linear regression.” The main purpose of linear regression is to evaluate and evaluate values based on historical information. Two types of variables, namely target variables and descriptive variables, affect regression, and are key factors in achieving linear regression. Using linear relationships, we can identify the effect of target variables on descriptive variables and their modification. Given by the mathematical expression for regression:
Figure 2.
Linear regression for confirmed cases.
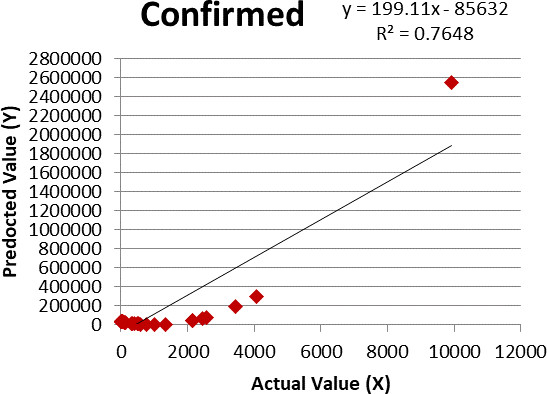
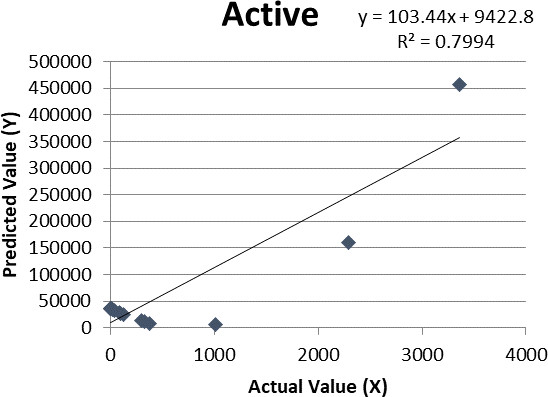
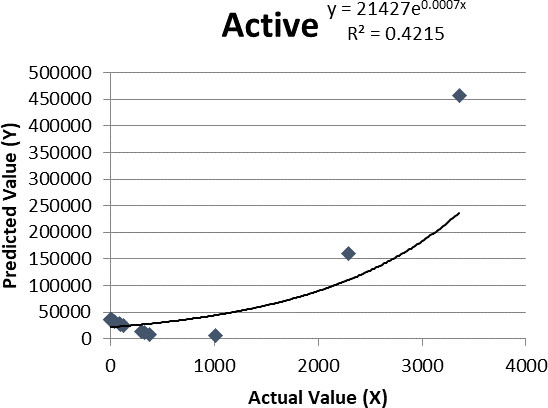
Figure 3.
Linear regression for active cases.
Other formulas are also needed to calculate the slope of the regression line and for the intercept point of regression. The slope of regression is given below:
The intercept point of regression is given by:
Figure 4.
Linear regression for recovered cases.
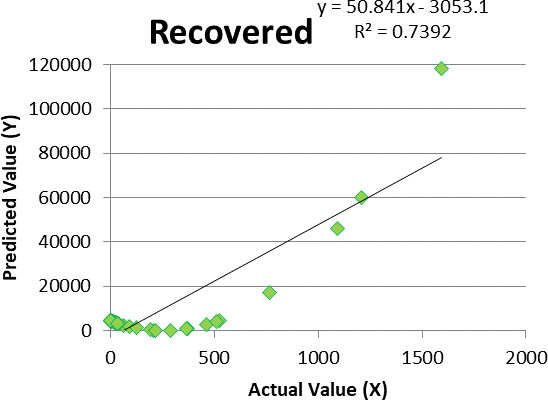
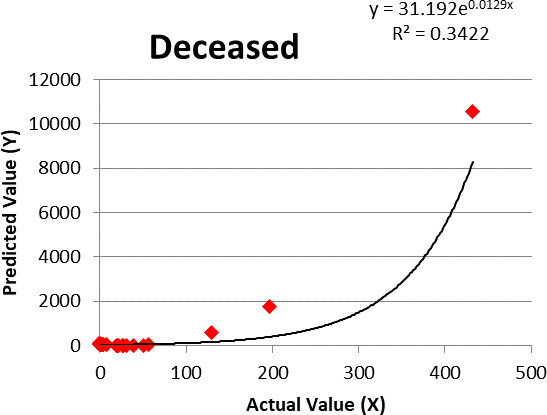
Figure 5.
Linear regression for deceased cases.
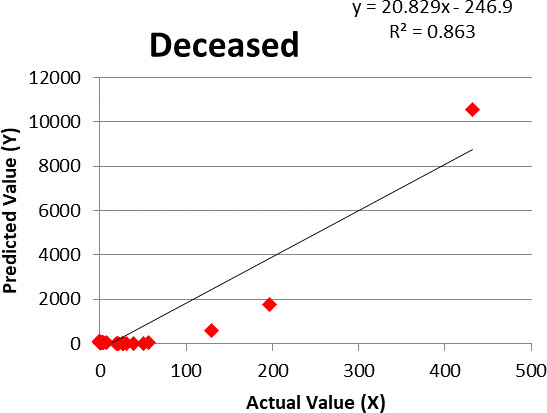
Here,
These are the values obtained by taking
Table 2
Static approaches result values
| Statistical approach | Confirmed | Active | Recovered | Deceased |
|---|---|---|---|---|
| Mean | 1032.8125 | 739.09375 | 260.15625 | 33.5625 |
| Variance | 120011.5936 | 152914.7682 | 10173.63379 | 452.1747396 |
| MSE (Mean square error) | 6422761154 | 23114468618 | 38532621.34 | 206820.1711 |
| RMSE (Root MSE) | 21043.70248 | 38043.9186 | 2483.986756 | 107.7077759 |
Procedure: This chapter deals with the implementation of linear regression. If we consider large data sets, it is impossible to manage the data. So, we use the same call() function summary for this model; however, in this case, the machine learning technique combines parallel linear regression with the help of Mapper and Reducer. It does not cause memory problems in the Hadoop computation nodes that divide and process the database.
# The MapReduce job can produce XT*Y Mapreduce ( Input
Figure 6.
Logistic regression for confirmed cases.
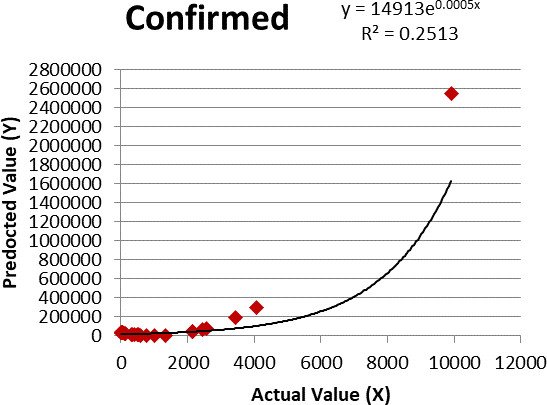
Figure 7.
Logistic regression for active cases.
B. Logistic Regression: In statistics, logistic regression or logit regression is the type of probability classification model. Logistic regression plays a key role in the development and computation of many theories, as numerical units are used to assess the incidence and incidence of disease, including the treatment of logistic regression, and the presence of coronavirus. The principles for implementing logistic regression using the logistic functions listed below are as follows. To forecast the log odds ratios that can use the following formula is:
Figure 8.
Logistic regression for recovered cases.
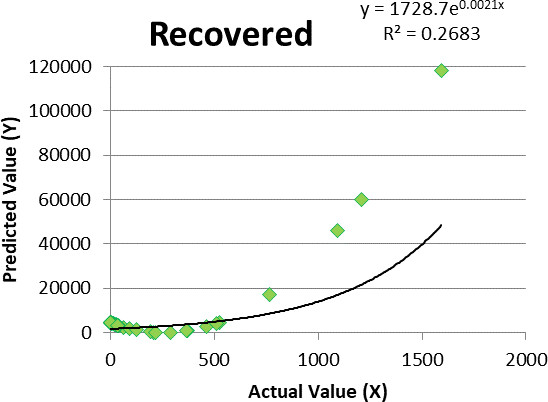
Figure 9.
Logistic regression for deceased cases.
The probability formula is as follows:
Logit(
Algorithm: Unending training dataset is based on the training dataset plot that we can say that there is a taxonomic boundary generated by the model. It defines logistics. Regression Map Minimize functions with the following input parameters. Calling this function starts executing the logistic regression of the Map-Reduce function.
In this algorithm, majorly follows four-step input, iteration, dims, and alpha as follows:
1. Input: This is an input dataset.
2. Iterations: This is the fixed number of iterations for calculating the gradient.
3. Dims: This is the dimension of input variables.
4. Alpha: This is the learning rate.
Let us see how to develop the logistic regression function.
# MapReduce job – Here MapReduce function executing for logistic regression Logistic.regression
9.Experimental result
The COVID-19 application uses of linear regression and logistic regression for corona virus data can assessment. To trace out the disease of Corona virus credentials from various sources and campaign. Consider a statistical technique to implement a regression model for the provided dataset. Assume that the given number of statistical units.
Its formula is as follows:
Here,
10.Conclusion
This paper applied the structural risk minimization on data for linear classification, and then form a trajectory cluster, and the data prediction trial applies to each individual with supported data search, outline detection, and sample rearrangement. We have included it here to assess data search, outdoor detection, and pattern detection. Finally, three issues have been developed to develop a broader view of coronavirus on the trajectory data prediction trial to control linear classification efficiency and to issue clues for each individual.
References
[1] | WHO Director of General opening notes at the media consultation on COVID-19 – 11 March 2020. Retrieved from: https://www.who.int/dg/speeches/detail/who-director-general-s-opening-remarks-at-the-media-briefing-on-covid-19—11-march-2020. |
[2] | Coronavirus (COVID-19). World Health Organization. Retrieved from: https://who.sprinklr.com/. |
[3] | Coronavirus Resource Center. John Hopkins University. Retrieved from: https://coronavirus.jhu.edu/. |
[4] | Yuan C, Yang H. Study on K-Value Selection Technique of K-Means Clustering Algorithm. (2019) . |
[5] | Kadali DK, Jagan Mohan RNV. Estimation of Data Parameters Using Cluster Optimization. In: NCPQROCM-2019 – National Conference on Productivity, Quality, Reliability, Optimization and Computational Modeling. 18th to 20th Dec (2019) . ISBN: 978-93-5396-180-0, published by SRKR Engineering College, Bhimavaram-534204. |
[6] | Kadali DK, Jagan Mohan RNV. Shortest Route Analysis for High level Slotting Using Peer-to-Peer. In: ICRTIB-2019 – International Conference on Recent Trends in IoT and Blockchain. 19th & 20th Oct (2019) . ISBN: 978-93-5391-198-0, published by GIET University, Gunupur-765022, Odisha. |
[7] | Kadali DK, Jagan Mohan RNV, Srinivasa Rao M. Cluster Optimization for Similarity Process Using De-Duplication. IJSRD – International Journal for Scientific Research & Development. (2016) Aug; 4: (6): ISSN: 2321-0613. |
[8] | Kadali DK, Jagan Mohan RNV. Optimizing the Duplication of Cluster Data for Similarity Process. ANU Journal of Physical Science. (2014) Jun–Dec; 2: : ISSN: 0976-0954. |
[9] | Kadali DK, Jagan Mohan RNV, Vamsidhar Y. Similarity based Query Optimization on Map Reduce using Euler Angle Oriented Approach. International Journal of Scientific & Engineering Research. (2012) Aug; 3: (8): ISSN: 2229-5518. |
[10] | Jagan Mohan RNV, Subbarao R, Raja Sekhara Rao K. Efficient K-Means Cluster Reliability on Ternary Face Recognition using Angle Oriented Approach. In: Proceedings of International Conference on Advances in Communication, Navigation & Signal Processing Technically Co-Sponsored by IEEE, Hyderabad Section, March 17th–18th, (2012) . Dept of ECE, Andhra University College of Engineering (A). |
[11] | Sun Y, Yen G, Zhang Y. IGD indicator-based evolutionary algorithm for many objective optimization problems. IEEE Transactions on Evolutionary Computation. (2018) ; 23: (2): 173-187. |
[12] | Wang R, Zhou Z, Ishibuchi H, Liao T, Zhang T. Localized weighted sum method for many-objective optimization. IEEE Transactions on Evolutionary Computation. (2018) ; 22: (1): 3-18. |
[13] | Li WK, Wang WL, Li L. Optimization of water resources utilization by multi objective moth-flame algorithm. Water Resources Management. (2018) ; 47: (10): 3303-3316. |
[14] | Bi X, Wang C. A niche-elimination operation based NSGA-III algorithm for many-objective optimization. Applied Intelligence. (2018) ; 48: (1): 118-141. |
[15] | Kadali DK, Jagan Mohan RNV. Shortest Route Analysis for High level Slotting Using Peer-to-Peer. In: International conference ICRTIB-2019 – Springer. 19th–20th Oct (2019) , GIET University, Gunupur, Odisha. |
[16] | Madhavi S, Rahnamayan S, Deb K. Opposition based learning: a literature review. Swarm and Evolutionary Computation. (2018) ; 39: : 1-23. |
[17] | Mirjalili S, Jangir P, Saremi S. Multi-objective ant lion optimizer: a multi-objective optimization algorithm for solving engineering problems. Applied Intelligence. (2017) ; 46: (1): 79-95. |
[18] | Zhou C, Dai G, Wang M. Enhanced dominance and density selection based evolutionary algorithm for many-objective optimization problems. Applied Intelligence. (2017) ; 1: : 1-21. |
[19] | Xiang Y, Zhou Y, Li M, Chen Z. A vector angle-based evolutionary algorithm for unconstrained many-objective optimization. IEEE Transactions on Evolutionary Computation. (2017) ; 21: (1): 131-152. |
[20] | Jiang S, Yang S. A strength pareto evolutionary algorithm based on reference direction for multiobjective and many-objective optimization. IEEE Transactions on Evolutionary Computation. (2017) ; 21: (3): 329-346. |
[21] | Liu Y, Gong D, Sun X, Zhang Y. Many-objective evolutionary optimization based on reference points. Applied Soft Computing. (2017) ; 50: : 344-355. |
[22] | Wang W, Ying S, Li L, Wang Z, Li W. An improved decomposition-based multiobjective evolutionary algorithm with a better balance of convergence and diversity. Applied Soft Computing. (2017) ; 57: : 627-641. |


