
Exploring the role of country social and medical characteristics in patient level mortality in COVID-19 pandemic using Unsupervised Learning
Abstract
This work aims to contribute to the field of COVID-19 pandemic analysis. In this research we applied a twofold analysis that focused initially on the country general social-economic and medical characteristics and on top of that in a second level exploring the correlations to the characteristics that affect COVID-19 patients’ mortality level. The approach has been applied to large datasets that include country level medical and the socio-economic data according to World Health Organization, the role of the cigarette consumption per capita using open datasets, and the cumulative data of the “COVID-19 Data Repository by the Center for Systems Science and Engineering (CSSE) at Johns Hopkins University” for the total number of Cases, Deaths and Recovered. 101 countries including twenty-two (22) features are studied. We have also drilled in the country of Mexico datasets to show case the effectiveness of our approach. We show that our approach can achieve 96% overall accuracy based on the proposed combination approach of macro and micro features. Our approach outdoes previous study results that utilize machine learning to assist medical decision-making in COVID-19 prognosis. We conclude that country social economic and medical characteristics play important role to COVID-19 patients’ prognosis and their outcome.

1.Introduction
The struggling of countries and policy makers is continuous. There is a lot of effort in understanding the Coronavirus disease (COVID-19) [1] itself and discovering the main factors that affect mortality. In this study the key focus is on exploring the pandemic from two sides, a macro and a micro one. On the macro level, we are focusing on the general characteristics of a country that seem to have some impact on the mortality. For the micro level, we concentrate on the individual patients to find the most lethal combination of comorbidities.
WHO is gathering the latest international multilingual scientific findings and knowledge on COVID-19. The global literature cited in the WHO COVID-19 database is updated daily [2]. The key aim in this study was to research the impact of socio-economic together with medical country level characteristics. Results reveal that they can be an important factor in the COVID-19 patients’ prognosis. Previous, socio-economic studies have already stated that global response matters [3, 4]. However, the research on the impact of socio-economic factors on the patients is open and ongoing.
Employing machine learning for mortality prediction has been used previously in several previous studies of medical conditions [5]. Unsupervised learning techniques are particularly popular in studying medical data. However, COVID-19 disease is particularly new therefore there is ongoing research to check what is the most appropriate method and more particularly which are the most important features and characteristics that need to be considered. Most approaches are using micro level features that are based on the medical condition and the hospital environmental parameters. In this work we expand this approach introducing additional macro parameters in our study [6].
We show that our approach can achieve 96% overall accuracy based on extreme gradient boost models when employing a multi-level approach of macro and micro features. Our approach outdoes previous study results that utilize machine learning to assist medical decision-making in COVID-19 prognosis.
The main contributions of this research study are to show that (a) it is in fact possible to combine data coming from different sources and (b) combine multiple levels of both medical and socio-economic dimensions instead of focusing on either of them individually. In particular, the study takes into consideration data for 101 countries including twenty-two (22) features/dimensions of each country. As a key result, our study shows the strong socio-economic correlations that affect COVID-19 mortality levels using unsupervised learning and increases the overall accuracy.
We structure our work in two main parts. Initially, part 1 explores our research in the role that play countries’ characteristics in the COVID-19 pandemic. Following, we drill into micro level and in part 2 our research analysis is focusing on patient characteristics.
Key objective of our analysis (part 1) includes the identification of major social and medical environment factors that play a role in the mortality of COVID-19 virus. Our purpose was to find a model that fits the data with high accuracy so that, we show the effectiveness of the proposed model. Next, we will be able to further explore feature importance. In our study, we saw that “Asthma” is the most important feature and regardless of the number of experimental repetitions the feature keeps its top position. The feature “Life Expectancy from birth for both sexes” is coming second. In features “Population rate under 15 Years Old”, “Rate of deaths due to Tuberculosis”, “Rate of deaths due to HIV”, “Rate of deaths due to lower respiratory infections” and “Rate of deaths due to congenital heart defects”, we can see that the variation in importance position is high. It is probably because there is significant difference between African countries and other countries in the number of death toll due to these causes.
In part 2, Identification of significant social and medical factors for the mortality of COVID-19 disease is discussed. Our analysis was based on a publicly available dataset from the “Open Data General Directorate of Epidemiology of Mexico” for November 2020. The dataset contains the patient’s medical features, along with their social characteristics. The focus is on the identification of main factors that contribute the most in the mortality of COVID-19 disease in the country of Mexico with unsupervised learning. We applied Association Rules in our analysis. Although it is primarily used in Product Promotion, we attempted using it in finding the most usual comorbidities and infer how they are contributing to mortality. Pneumonia is the more frequent disease, followed by Hypertension Diabetes and Obesity. Our work concludes with a short summary of findings, key issues and future steps.
2.Related work
Previous work on feature and symptoms-based analysis has employed several machine learning algorithms including Support Vector Machine (SVM), Artificial Neural Networks, Random Forest, Decision Tree, Logistic Regression, and K-Nearest Neighbor (KNN) to predict the mortality rate in patients with COVID-19. Results demonstrate up to 89.98% overall accuracy in predicting the mortality rate [7]. A COVID-19 nationwide Korean cohort study using machine learning prediction for mortality of patients diagnosed [8] utilized the least absolute shrinkage and selection operator (LASSO), linear support vector machine (SVM), SVM with radial basis function kernel, random forest (RF), and k-nearest neighbors were tested achieving overall up to 92.0% sensitivity using mainly medical factors.
Age and male sex have been pinpointed as risk factors for adverse outcomes [9, 10, 11]. Another report on 85 fatal cases of COVID-19 in Wuhan [12] revealed that the mean age of patients was 65.8 years, and 62 of the 85 patients (72.9%) were male [13]. Respiratory infections were also a major factor in our study that manifested their self with dyspnea symptoms. The work of [14] mentions that dyspnea frequency is relatively low in COVID-19 as compared to other respiratory symptoms.
A pooled analysis of COVID-19 reports that hypertension was associated with an approximately 2.5-fold increased risk of higher severity and mortality [15]. On the other hand, in a study of 174 patients the authors found that patients with diabetes were at higher risk of pneumonia, release of tissue injury-related enzymes, and higher rates of inflammatory responses [16].
[17] use machine learning and found that COPD to be the comorbidity feature most significantly associated with high disease severity among all other comorbidities and conditions that were considered. The next most significant comorbidity (or condition) relating to disease severity was CEVD followed by CVD, CKD, type II diabetes, malignancy, hypertension, and smoking. They we also conducted an analysis of publication bias for all symptoms and comorbidities. The results are in Table 1.
Table 1
Severity of comorbidities and symptoms in COVID-19 patients in literature. The rank is according to severity or death
| Comorbidities | Number of studies |
|---|---|
| Hypertension | 10 |
| Diabetes | 11 |
| Cardiovascular disease | 6 |
| Malignancy | 6 |
| Chronic obstructive pulmonary disease | 8 |
| Cerebrovascular disease | 6 |
| Chronic Kidney Disease | 8 |
| Smoking | 6 |
The researchers seem to have found more interesting to study how hypertension and diabetes affects COVID-19 severity and outcome. This is an indication also that the particular deceases might have been perceived to affect most. In our combined dimensions study we show how the combination of Pneumonia, Diabetes and Heart deceases affect heavily COVID-19 patients.
Moreover, recent developments, in a parallel though limited approach compared to our study in terms of data and dimensions, have employed automated machine learning (autoML) to train various machine learning algorithms. The approach identified which variables (i.e., vital signs, biomarkers, comorbidities, etc.) were the most influential in generating an accurate model reporting that the two best independent models were the gradient boost machine and extreme gradient boost models achieve up to AUPRC 0.807 using only limited medical data (4313 patients) and without any socio-economic parameter [18].
3.Part 1: Major social and medical environment factors for the mortality of COVID-19 disease
The key objective of our initial step is to identify major social and medical environment factors for the mortality of COVID-19 disease.
3.1Data preparation
We used data from “COVID-19 Data Repository by the Center for Systems Science and Engineering (CSSE) at Johns Hopkins University” for the total number of Cases, Deaths and Recovered.
For “Smoking” we got the data from “Wikipedia: List of countries by cigarette consumption per capita” [19].
The medical and the socio-economic Data came from WHO [20]. These data were age-standardized per 100.000 population by cause.
For the proposed analysis we processed data for 101 countries including the following twenty-two (22) features of each country:
1. Population rate under 15 Years Old
2. Population rate over 60 Years Old
3. Health expenditure in GDP,
4. Life Expectancy from birth for both sexes,
5. Rate of deaths due to Asthma,
6. Rate of deaths due to lower respiratory infections,
7. Rate of deaths due to upper respiratory infections,
8. Rate of deaths due to Alcoholism,
9. Rate of deaths due to abnormalities in eating disorders (anorexia and bulimia nervosa),
10. Rate of deaths due to Diabetes Mellitus
11. Rate of deaths due to all Cancers (except Melan-oma)
12. Rate of deaths due to Ischemic events (heart and stroke)
13. Rate of deaths due to Tuberculosis,
14. Rate of deaths due to other respiratory infections,
15. Rate of deaths due to congenital heart defects,
16. Rate of deaths due to Dawn Syndrome,
17. Rate of deaths due to HIV
18. Rate of deaths due to endocrine, blood and immune disorders
19. Number of cigarettes consumed per 100,000 inhabitants
20. Total number of COVID-19 cases
21. Total death toll due to COVID-19
22. Total number of recovered from COVID-19
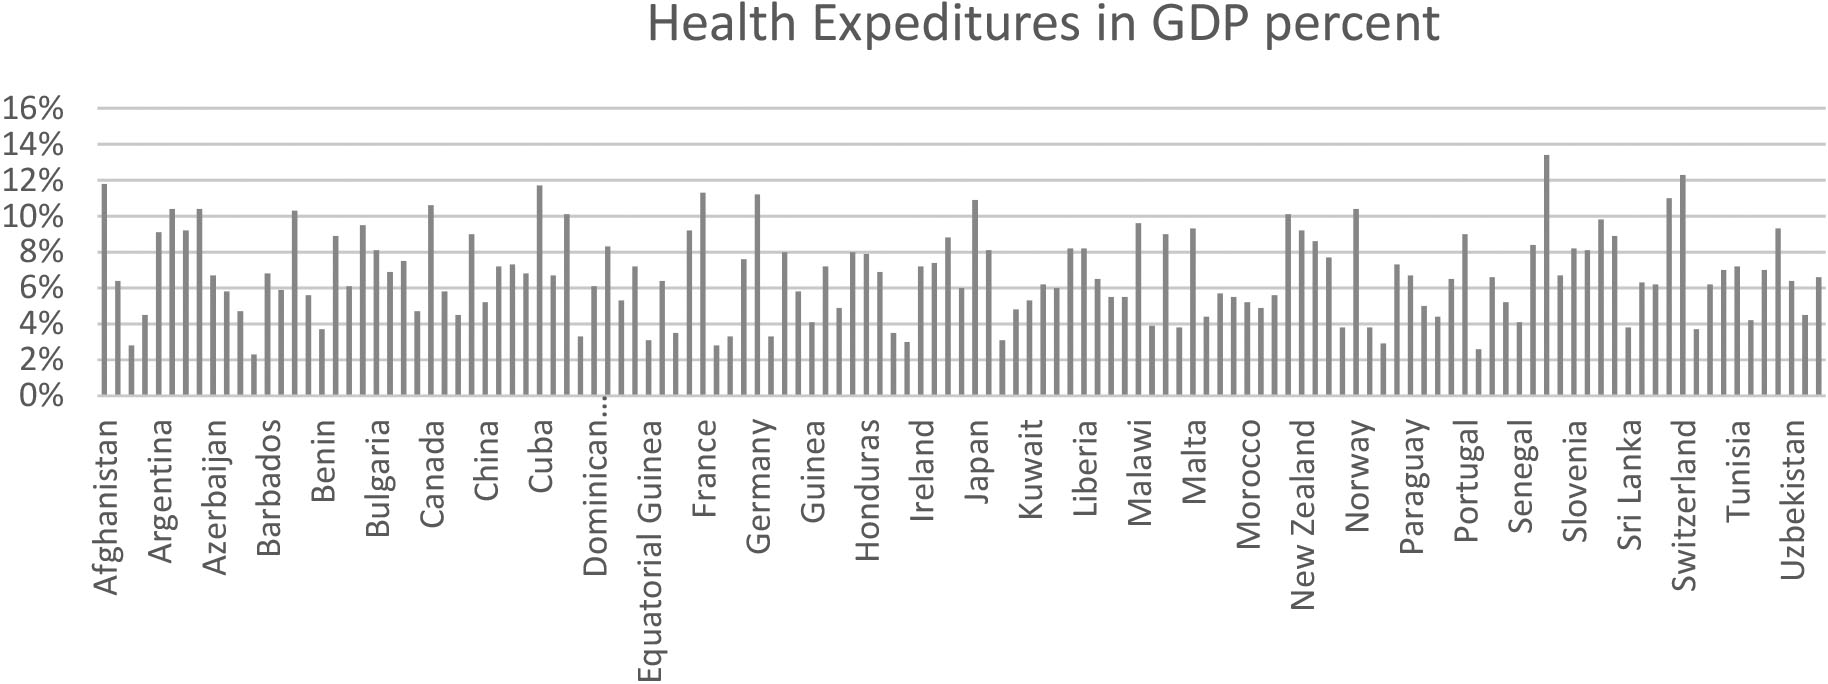
Indicative features of the Countries can be found in the graphs below.
Figure 1.
Descriptive Statistics based on WHO data.
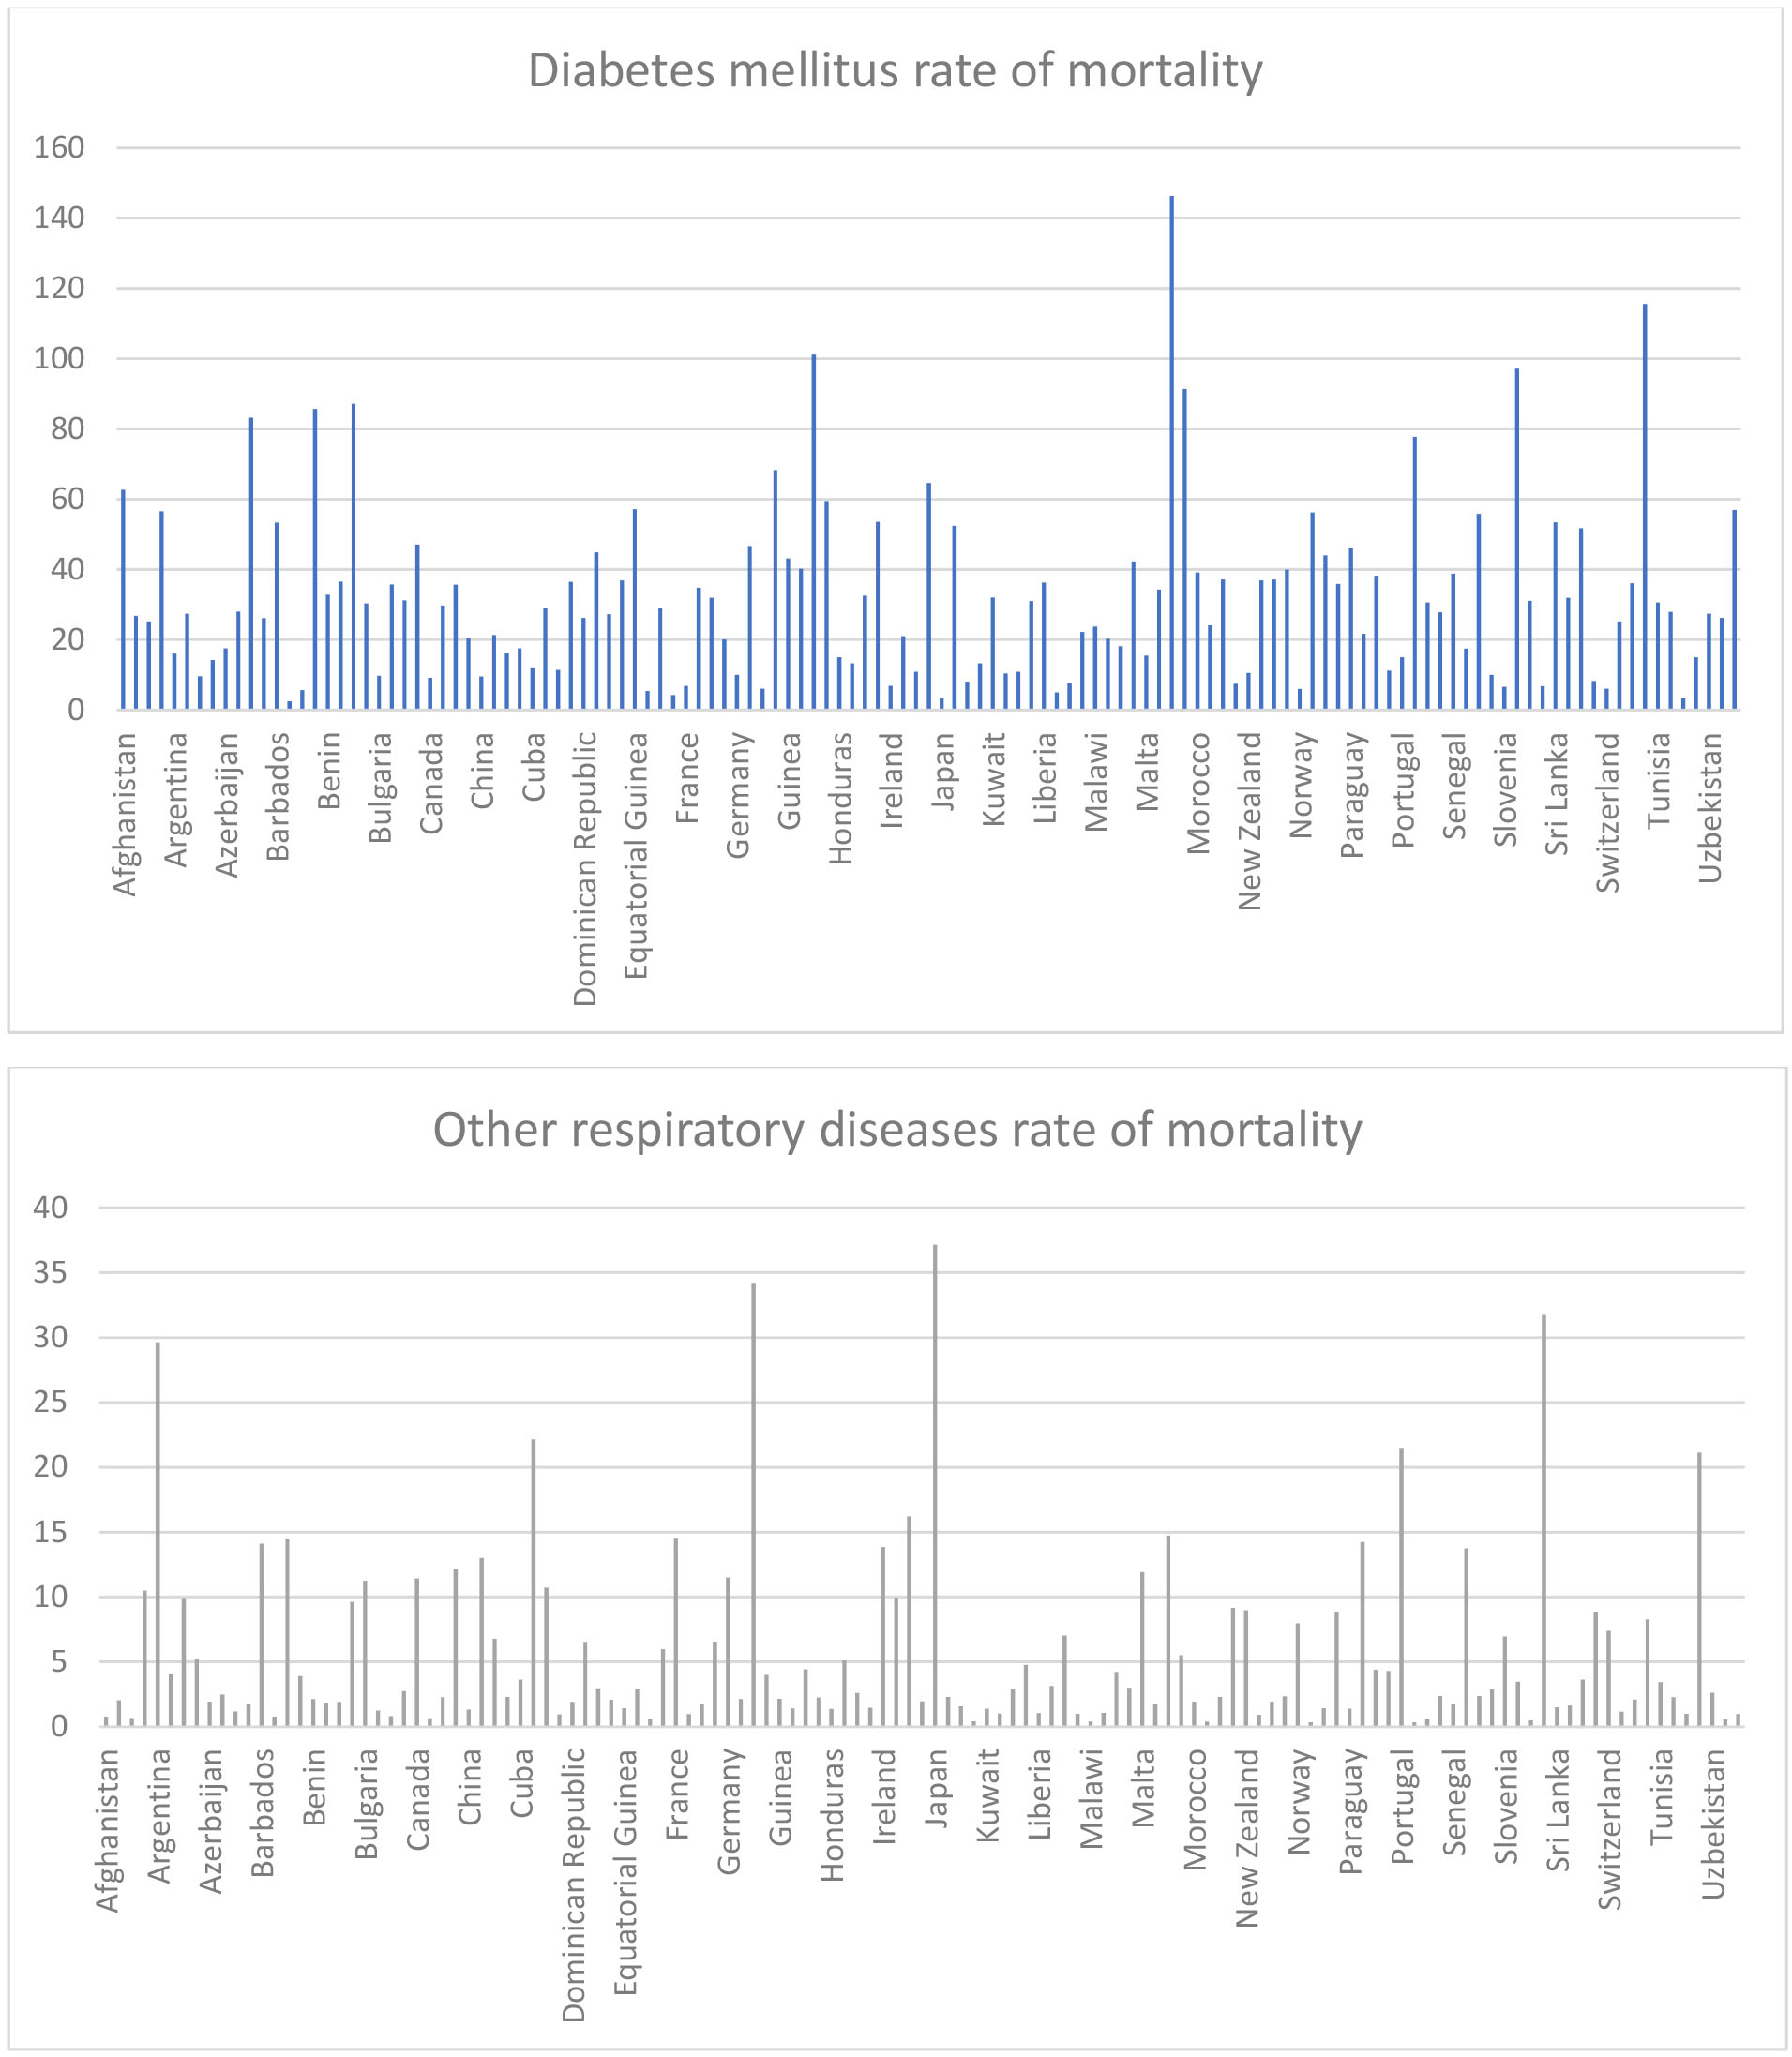
Figure 1.
continued
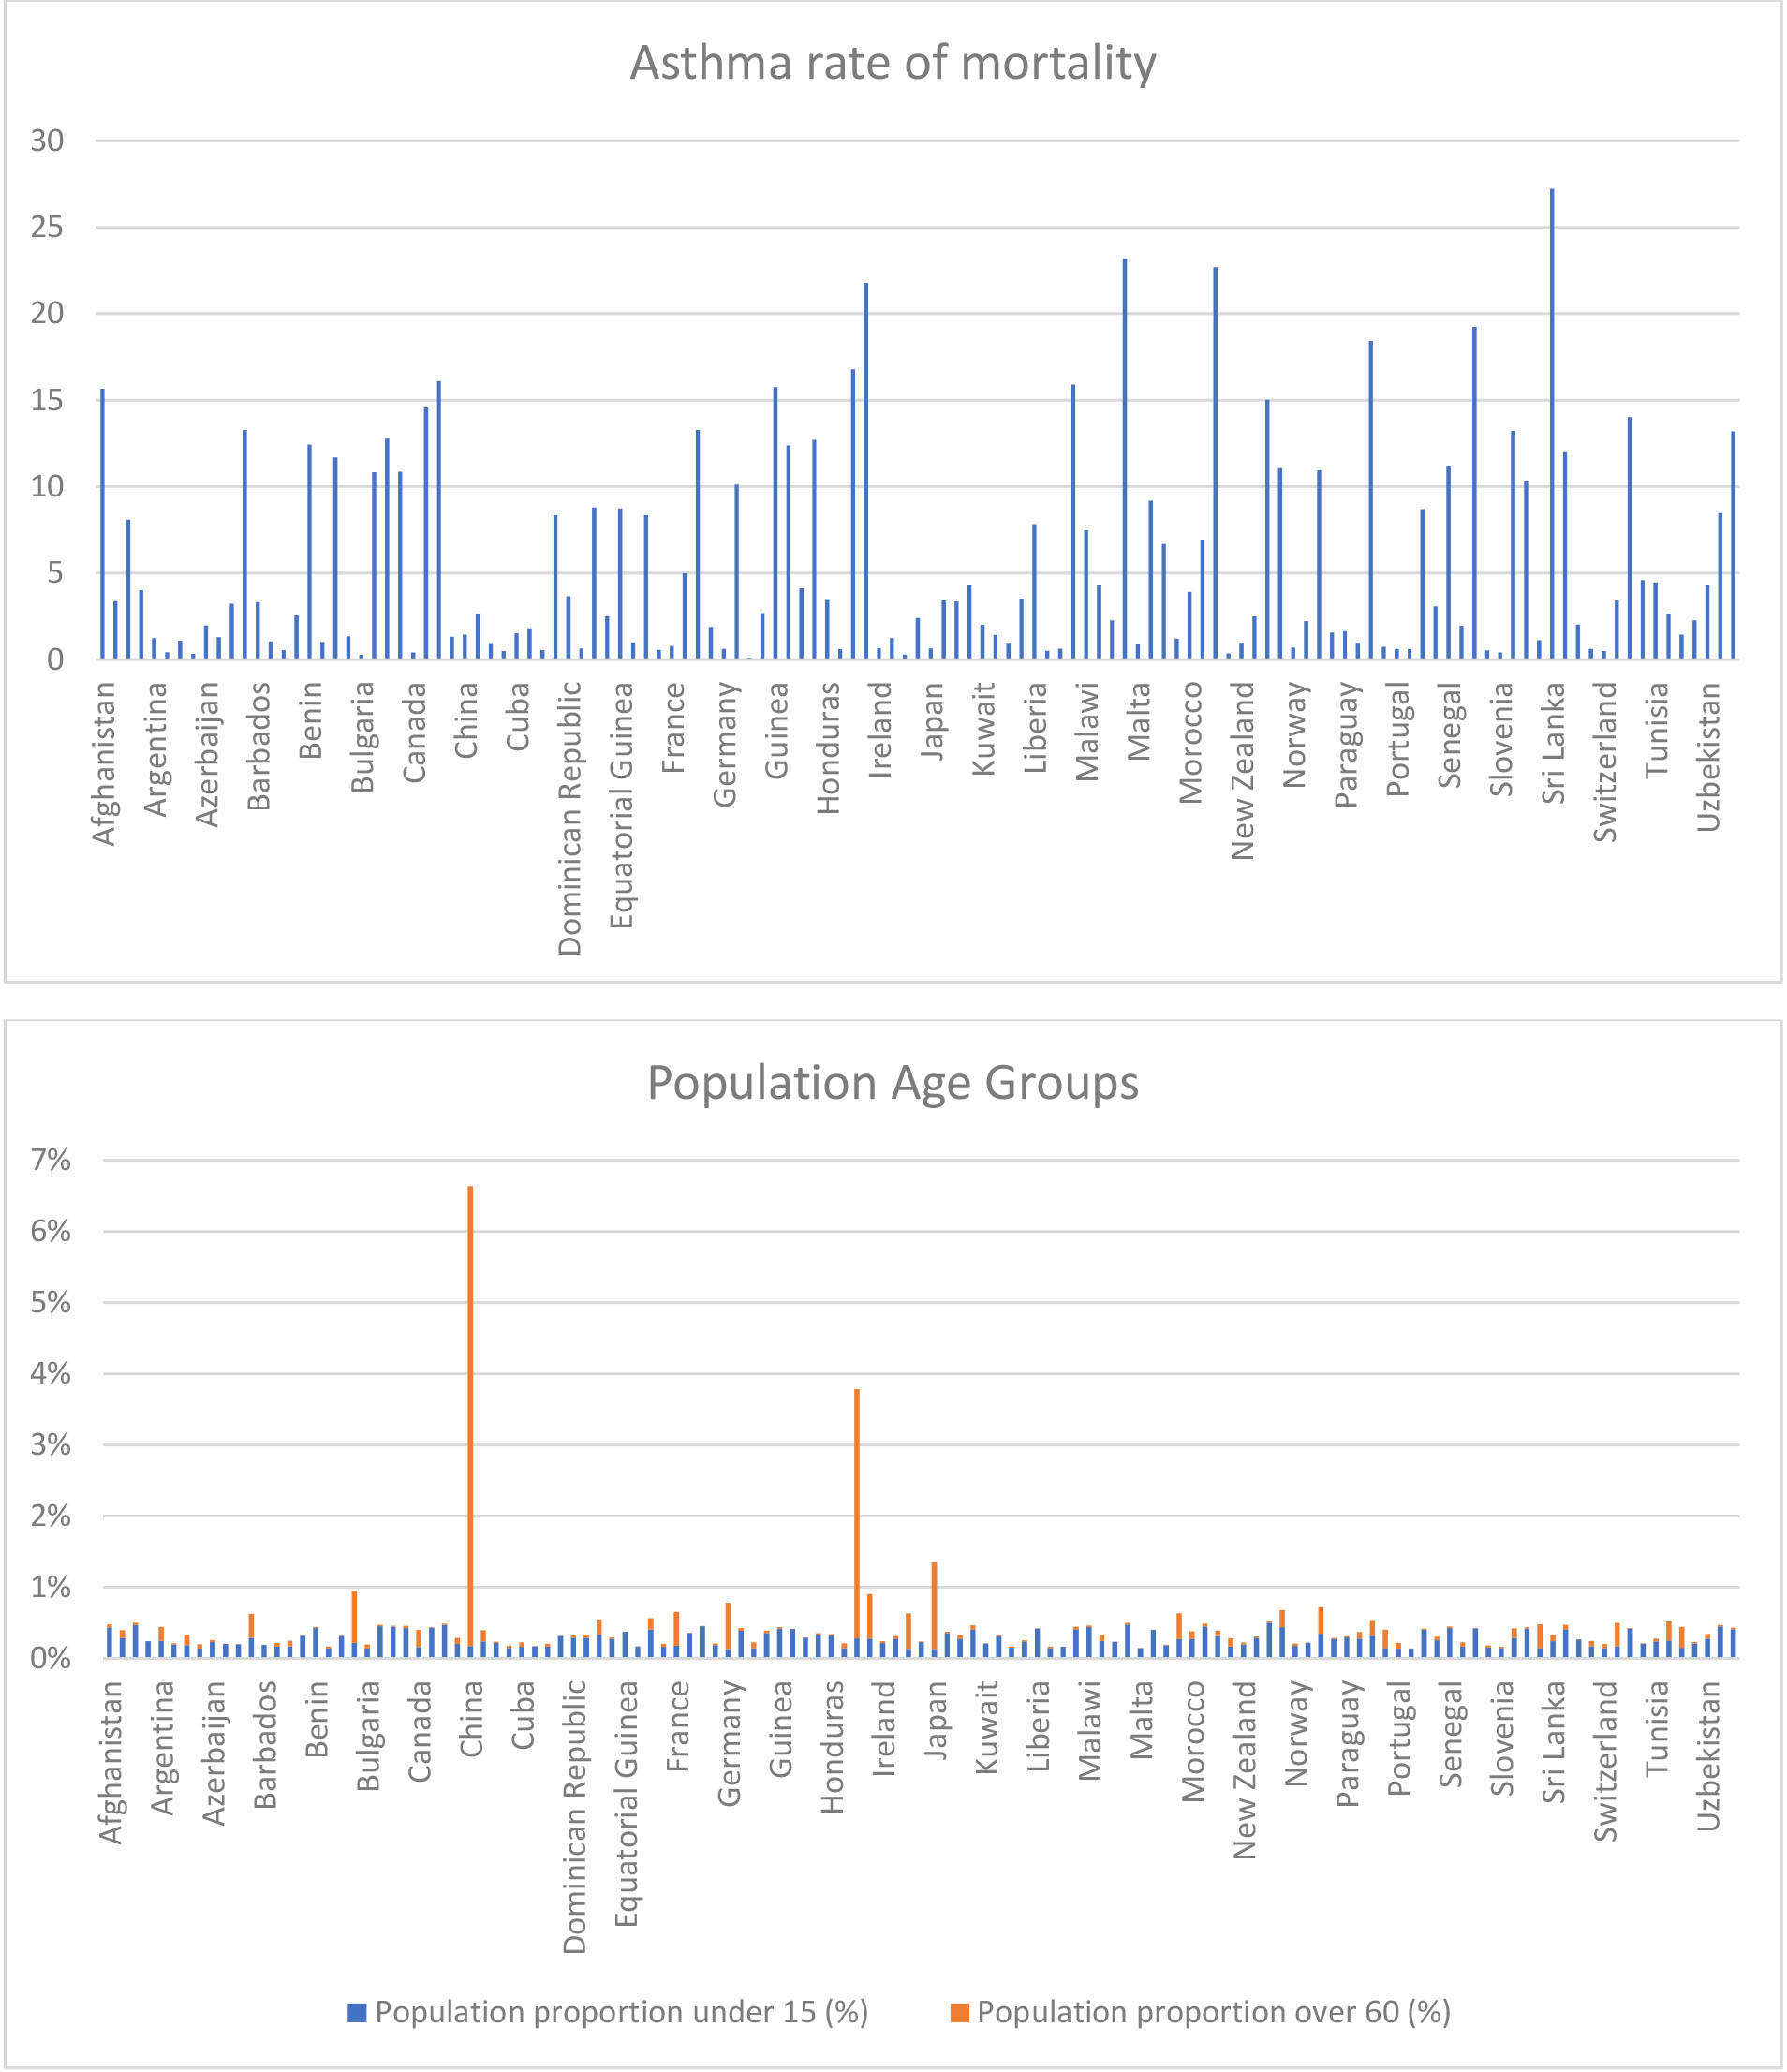
China, India, Indonesia and Japan have a big proportion of older people.
Figure 2.
Based on data from WHO.
The study is using the “Total death toll” as the depended variable. We normalized the “Total Death toll” number by dividing it with the population of the country. We used the logarithm of this value, because after the former division the resulting value was extremely small.
After this, we transformed the “Total Death toll” values into 3 separate classes “Low”, “Middle” and “High”. Each row was associated with one class according to Log Normalized value of “Total Death toll”. Thus, the initial regression problem turned into a new classification problem.
Our purpose was to find a model that fits the data with high accuracy so that, we know it is a good model although accuracy was not our primary goal. After this we will be able to take the feature importance.
The dataset was highly imbalanced as can be seen in the following chart.
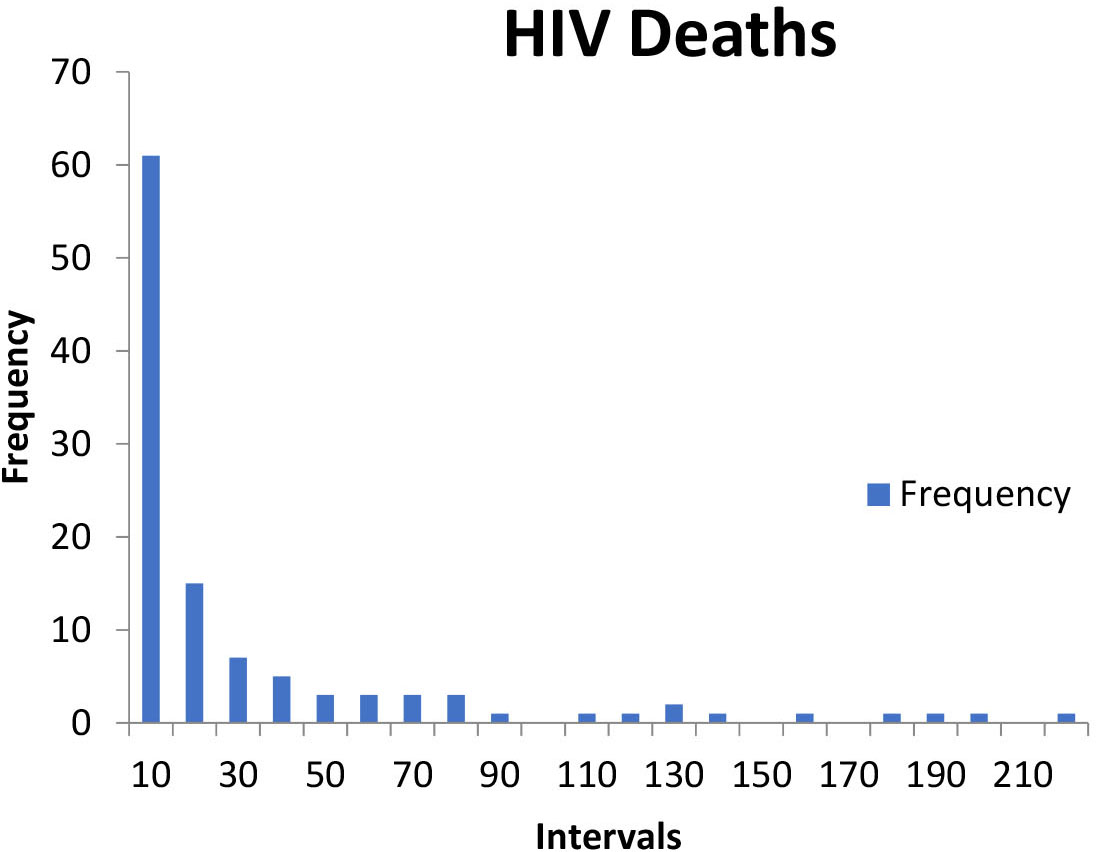
Figure 3.
Histogram of Countries according to the death toll paid.
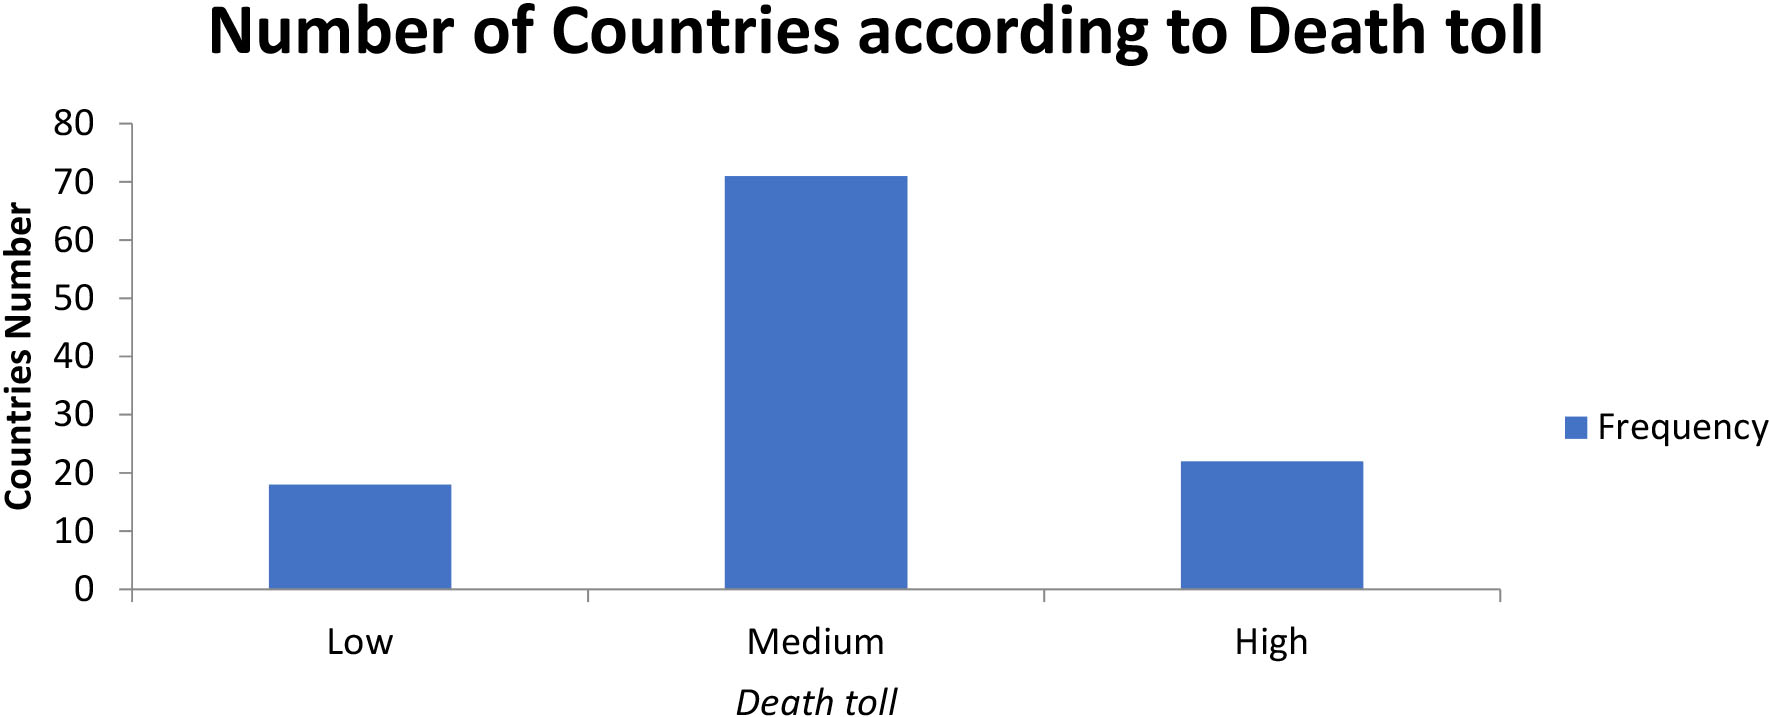
The challenge of working with imbalanced datasets is that most machine learning techniques will ignore, and in turn have poor performance on, the minority class. Here we have 2 minority classes which are the “Low” (the number of countries low number of deaths) and the “High” (the number of countries high number of deaths).
Our approach to addressing imbalanced datasets was to oversample the minority class. The simplest approach involves duplicating examples in the minority class, although these examples do not add any new information to the model. Instead, new examples can be synthesized from the existing examples. This is a type of data augmentation for the minority class and is referred to as the Synthetic Minority Oversampling Technique or SMOTE for short [21].
3.2 Extreme gradient boosting approach
XGBoost stands for “Extreme Gradient Boosting”, where the term “Gradient Boosting” originates from the paper Greedy Function Approximation: A Gradient Boosting Machine, by Friedman. [22]
Figure 4.
ROC curves of the XGBoost model application. The 3 curves represent the 3 iterations of the cross-validation technique.
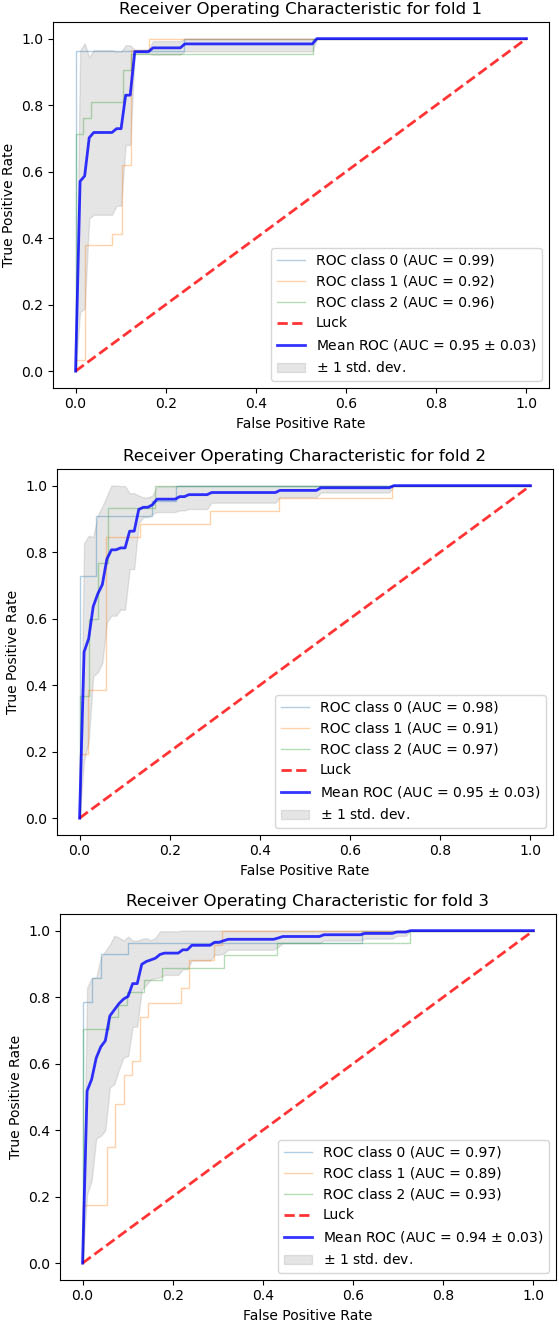
The XGBoost [23] library implements the gradient boosting decision tree algorithm.
This algorithm goes by lots of different names such as gradient boosting, multiple additive regression trees, stochastic gradient boosting or gradient boosting machines.
Boosting is an ensemble technique where new models are added to correct the errors made by existing models. Models are added sequentially until no further improvements can be made. A popular example is the AdaBoost algorithm that weights data points that are hard to predict.
Gradient boosting is an approach where new models are created that predict the residuals or errors of prior models and then added together to make the final prediction. It is called gradient boosting because it uses a gradient descent algorithm to minimize the loss when adding new models.
This approach supports both regression and classification predictive modeling problems.
3.3Model estimation
We divided the full dataset into train dataset and test dataset. We trained several algorithm on the train dataset and then tested their performance on the test dataset. The first effort was to use Logistic Regression. Due to low accuracy (9%), we rejected it. The Tree Classifier was the second model we tried. It was rejected also due to instability to results. Then we turned to Random Forest ensemble model with 100 estimators. We used max depth equal to 15 and max features equal to 5 to prevent overfitting. This model gave accurate results of 98% and above. The Cross-Validation accuracy gave 84%.
Lastly, we tried the XGBoost. An algorithm which gave the best estimation. The accuracy was approximately 96%.
From qualitative point of view, we tested the model on the test dataset (Fig. 4). We used cross validation in ROC study as well.
Due to limited number of data (only 101 countries after removal of all null values) the ranking of the importance of each feature was difficult to be stabilized. That resulted in position changing in the sorted importance table.
So, we decided to run the model many times (1000), take the mean position of each feature importance and sort the table according to this value.
The results are as follows.
Table 2
Feature importances from XGBoost algorithm implementation
| Country characteristics | Mean Pos. | Std in Pos. | |
|---|---|---|---|
| 1 | Rate of deaths due to Asthma | 1.09 | 0.29 |
| 2 | Life Expectancy from birth for both sexes | 3.88 | 2.64 |
| 3 | Rate of deaths due to Ischemic events (heart and stroke) | 4.13 | 2.63 |
| 4 | Population rate over 60 years old | 5.53 | 2.53 |
| 5 | Rate of deaths due to other respiratory infections | 5.83 | 3.54 |
| 6 | Rate of deaths due to Alcoholism | 7.53 | 2.89 |
| 7 | Rate of deaths due to Dawn Syndrome | 7.67 | 2.83 |
| 8 | Rate of deaths due to Diabetes Mellitus | 8.89 | 2.73 |
| 9 | Rate of deaths due to lower respiratory infections | 8.95 | 4.33 |
| 10 | Health expenditure in GDP | 10.22 | 3.69 |
| 11 | Rate of deaths due to abnormalities in eating disorders | 10.95 | 3.75 |
| 12 | Rate of deaths due to congenital heart defects | 10.98 | 4.10 |
| 13 | Population rate under 15 years old | 11.15 | 5.24 |
| 14 | Rate of deaths due to Tuberculosis | 12.35 | 5.64 |
| 15 | Rate of deaths due to all Cancers (except Melanoma) | 13.0 | 3.66 |
| 16 | Rate of deaths due to upper respiratory infections | 13.09 | 3.72 |
| 17 | Rate of deaths due to endocrine, blood and immune disorders | 13.81 | 2.96 |
| 18 | Rate of deaths due to HIV | 13.9 | 4.33 |
| 19 | Number of cigarettes consumed per 100,000 inhabitants | 14.86 | 2.61 |
The values below the “Mean Pos” column is the mean position a feature takes in a table sorted by importance. The “Std” column is the Standard Deviation in the position.
So, we can see that “Asthma” is in the 1
On the other hand, the feature “Life Expectancy from birth for both sexes” can be moved two positions up or down.
This way we can be more objective in determining each feature’s importance. Additionally, we can reach to other conclusions as well. In features “Population rate under 15 Years Old”, “Rate of deaths due to Tuberculosis”, “Rate of deaths due to HIV”, “Rate of deaths due to lower respiratory infections” and “Rate of deaths due to congenital heart defects”, we can see that the variation in importance position is high. It is probably because there is significant difference between African countries and other countries in the number of death toll due to these causes.
In the table below we can see the differences between our results and literature results as they have been mentioned in literature part.
Table 3
Results in our method vs literature results
| Comorbidities in literature | Our results |
|---|---|
| Hypertension | Rate of deaths due to Asthma |
| Diabetes | Life Expectancy from birth for both sexes |
| Cardiovascular disease | Rate of deaths due to Ischemic events (heart and stroke) |
| Malignancy | Population rate over 60 years old |
| Chronic obstructive pulmonary disease | Rate of deaths due to other respiratory infections |
| Cerebrovascular disease | Rate of deaths due to Alcoholism |
| Chronic Kidney Disease | Rate of deaths due to Dawn Syndrome |
| Smoking | Rate of deaths due to Diabetes Mellitus |
Many differences are due to different diseases and factors we study. Despite these differences we can see that Diabetes, Respiratory problems and heart diseases are common in our research and the general literature research. However, in our study we research on wide scale dataset for 101 countries strengthening the assurance and the accuracy of the results.
4.Part 2: Micro-level – Identification of significant social and medical factors for the mortality of COVID-19 disease-Mexico use case
The objective in Part2 is the identification of significant social and medical factors for the mortality of COVID-19 disease.
4.1Data preparation
Our analysis was based on a publicly available dataset [24] from the “Open Data General Directorate of Epidemiology of Mexico” for November 2020. The dataset contains the patient’s medical features, along with their social characteristics.
Medical features are:
• Pregnancy
• Diabetes
• Asthma
• Chronic Respiratory Diseases (CRD)
• Immunosuppression
• Hypertension
• Heart disease
• Obesity
• Smoking habit
• Chronic Kidney Diseases (CKD)
• Other
• Age
• Pneumonia
• Intubation
• Date of Symptoms
• Date of hospitalization
• Use of Viral Respiratory Disease Monitoring Units (VRDM) (Unidades Monitoras de Enfermedad Respiratoria viral; USMER by its Mexican-Spanish acronym) and by the medical units that attended the cases.
Social features are:
• Nationality
• Country of Origin
• Immigrant
• Sex
The starting point of the analysis was the data cleansing process. The “Not specified” in several fields had numerous appearances in the dataset. This fact led to the exclusion of several features, and a significant number of records was discarded from the initial dataset.
The “Nationality” and “Immigrant” features were discarded since they were irrelevant to our purpose. In addition, the “Intubation” feature was dropped because after a careful examination of the data, we saw that no death occurred when this feature had the value “No”.
The next stage in the process was feature engineering. We subtracted the date of hospitalization from the date of symptoms to create intervals for every five days, to create a factor that represents the days interval after the first symptom’s appearance. Intervals were created for the age feature as well to transform the number to factor. So, the problem we deal with, is the identification of main factors that contribute the most in the mortality of COVID-19 disease by exploiting the dataset that was descripted above.
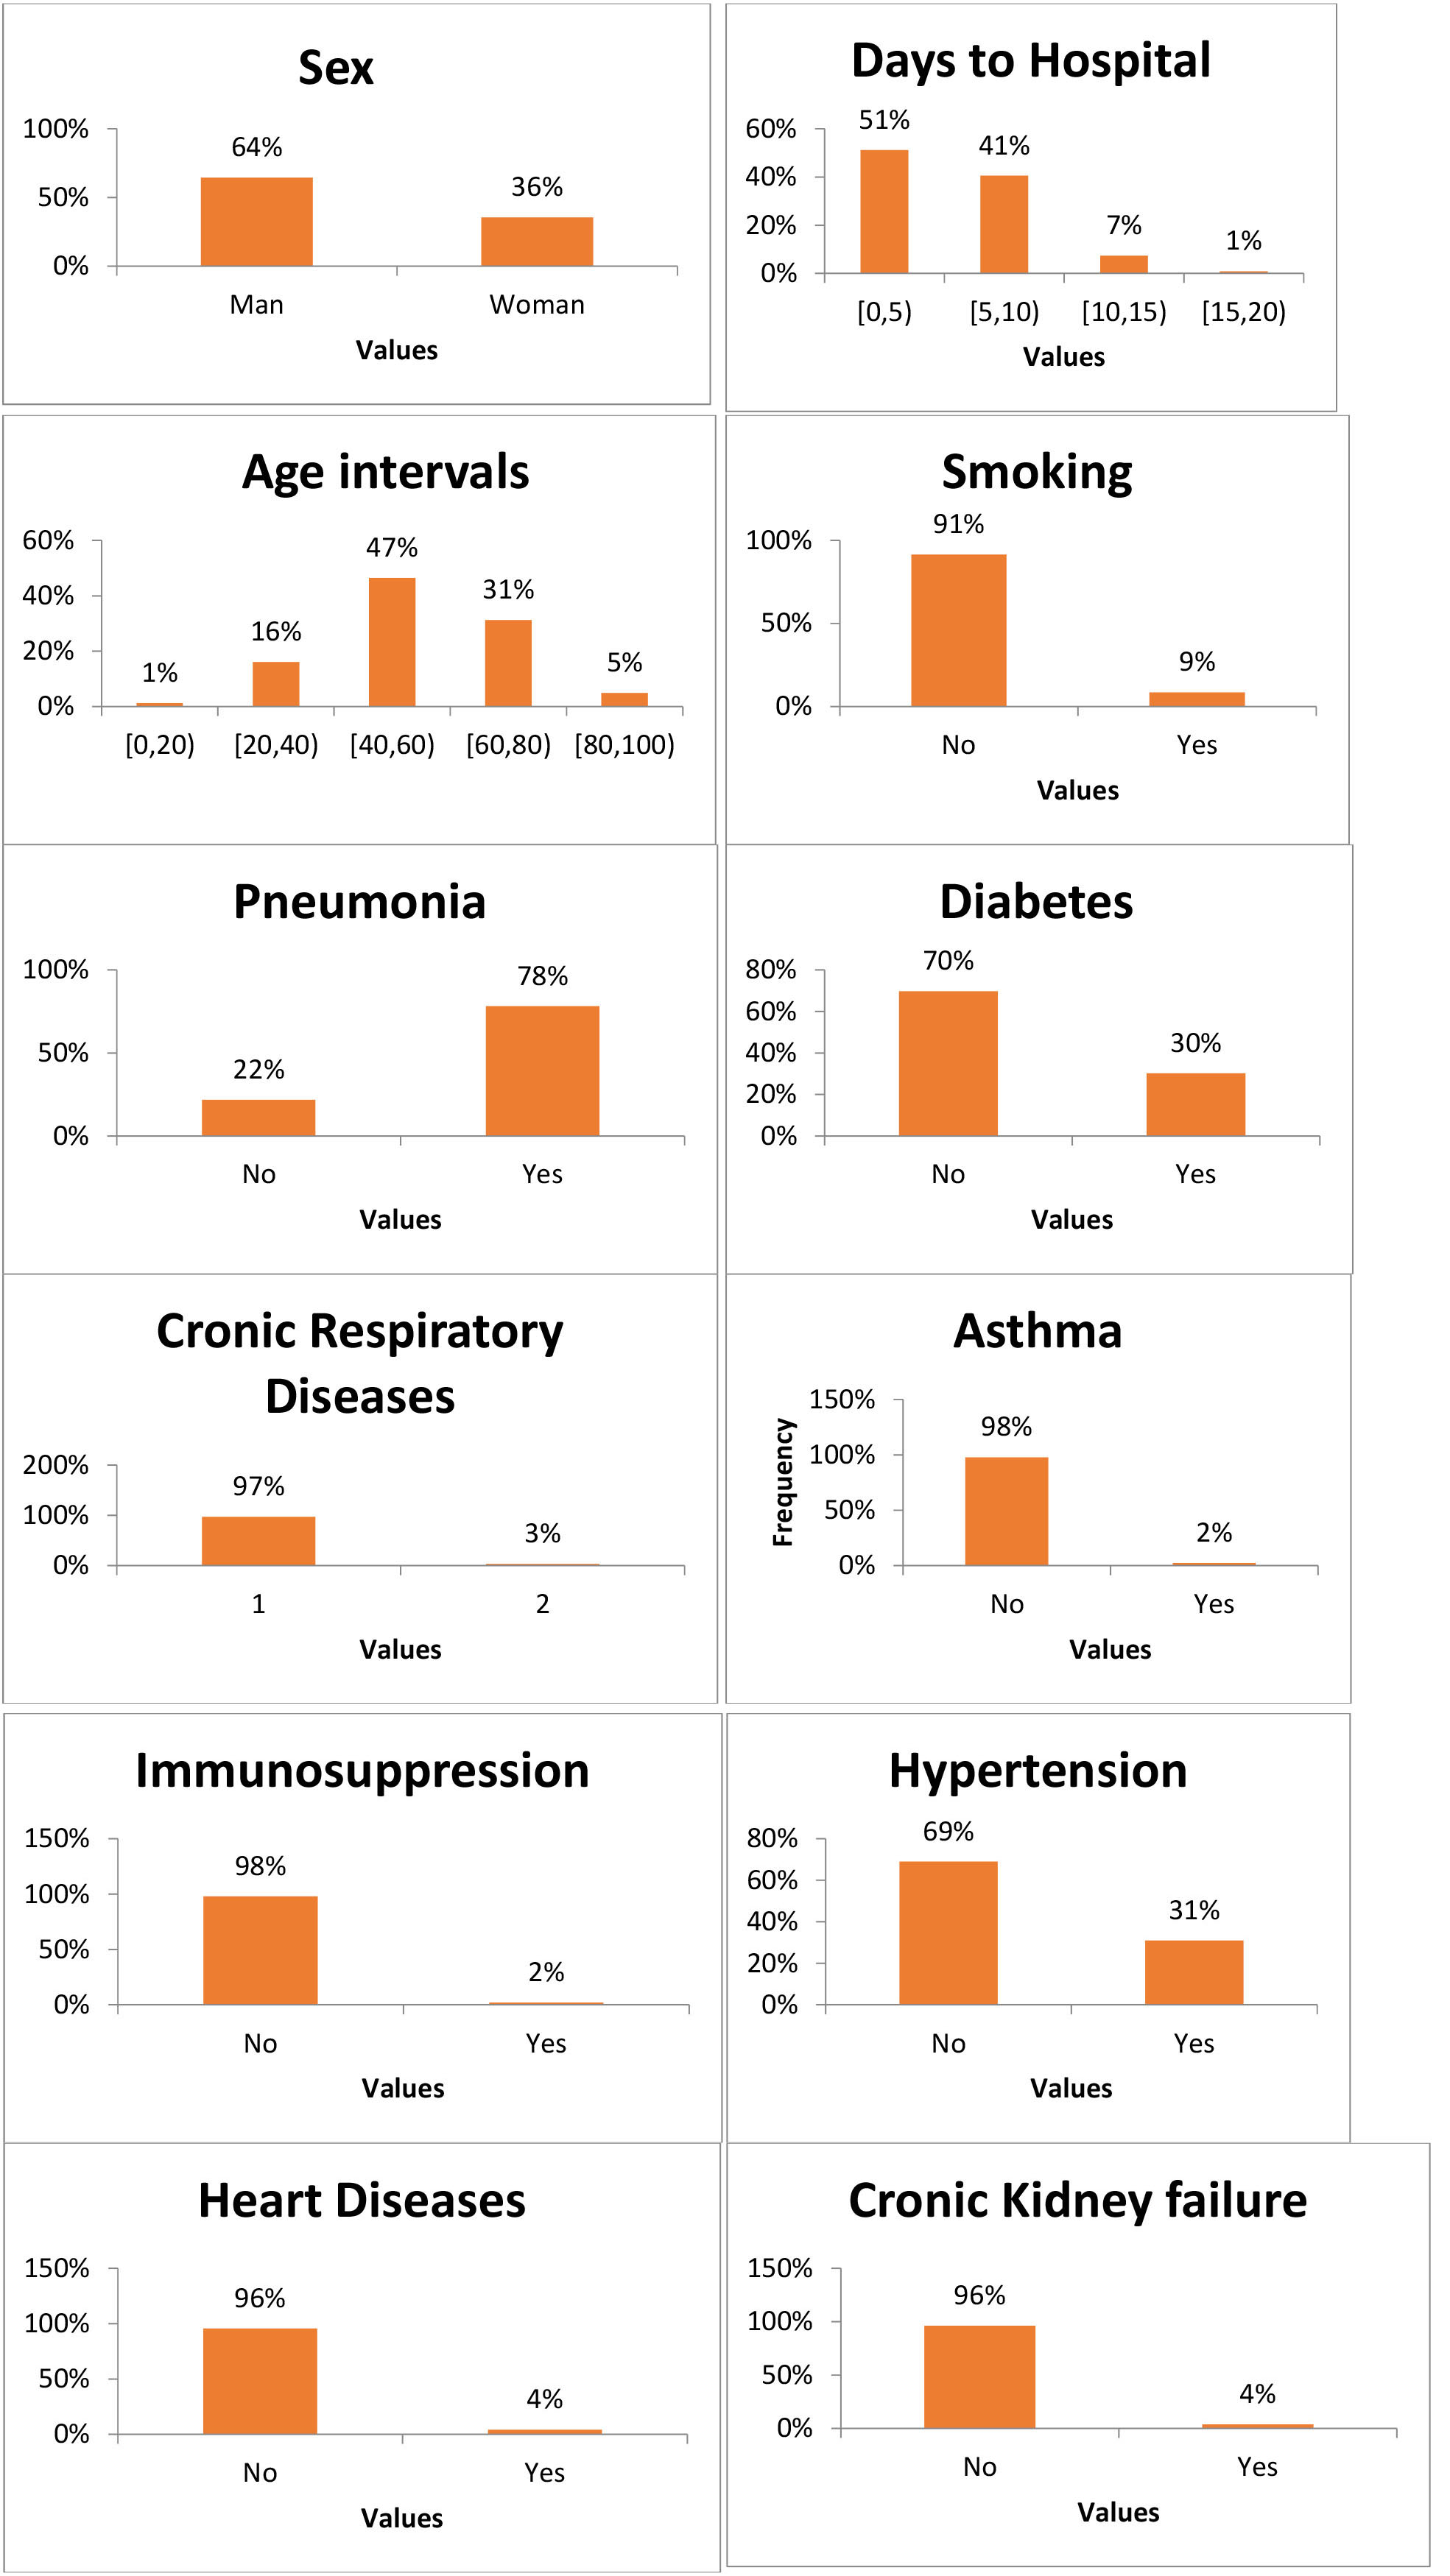
4.2Descriptive statistics
The above features can be seen in the following diagrams using descriptive statistics. This way is easier to get a full image of the dataset.
Table 4
Descriptive statistics from Mexico Patients dataset
|
4.3Algorithmic approach
Our effort is to address the identification of main factors that contribute the most in the mortality of COVID-19 disease in the country of Mexico with unsupervised learning as a use case for our multi-level analysis.
In this case, we have a set of N observations (
As [25] mention, it is always difficult to validate the inferences drawn from the output of most unsupervised learning algorithms opposite to supervised learning where one can always measure the error and subsequently the accuracy of the method.
Association rule analysis is a tool for mining commercial databases. One can use it to find values of the variables
Association rules show potential relationships between data items with a probability, within large data sets. Association rule mining can help in discovering sales correlations in transactional data and this is its primary use. It uses machine learning models to analyze data for patterns in a database. It can identify frequent if-then associations, which represent the association rules.
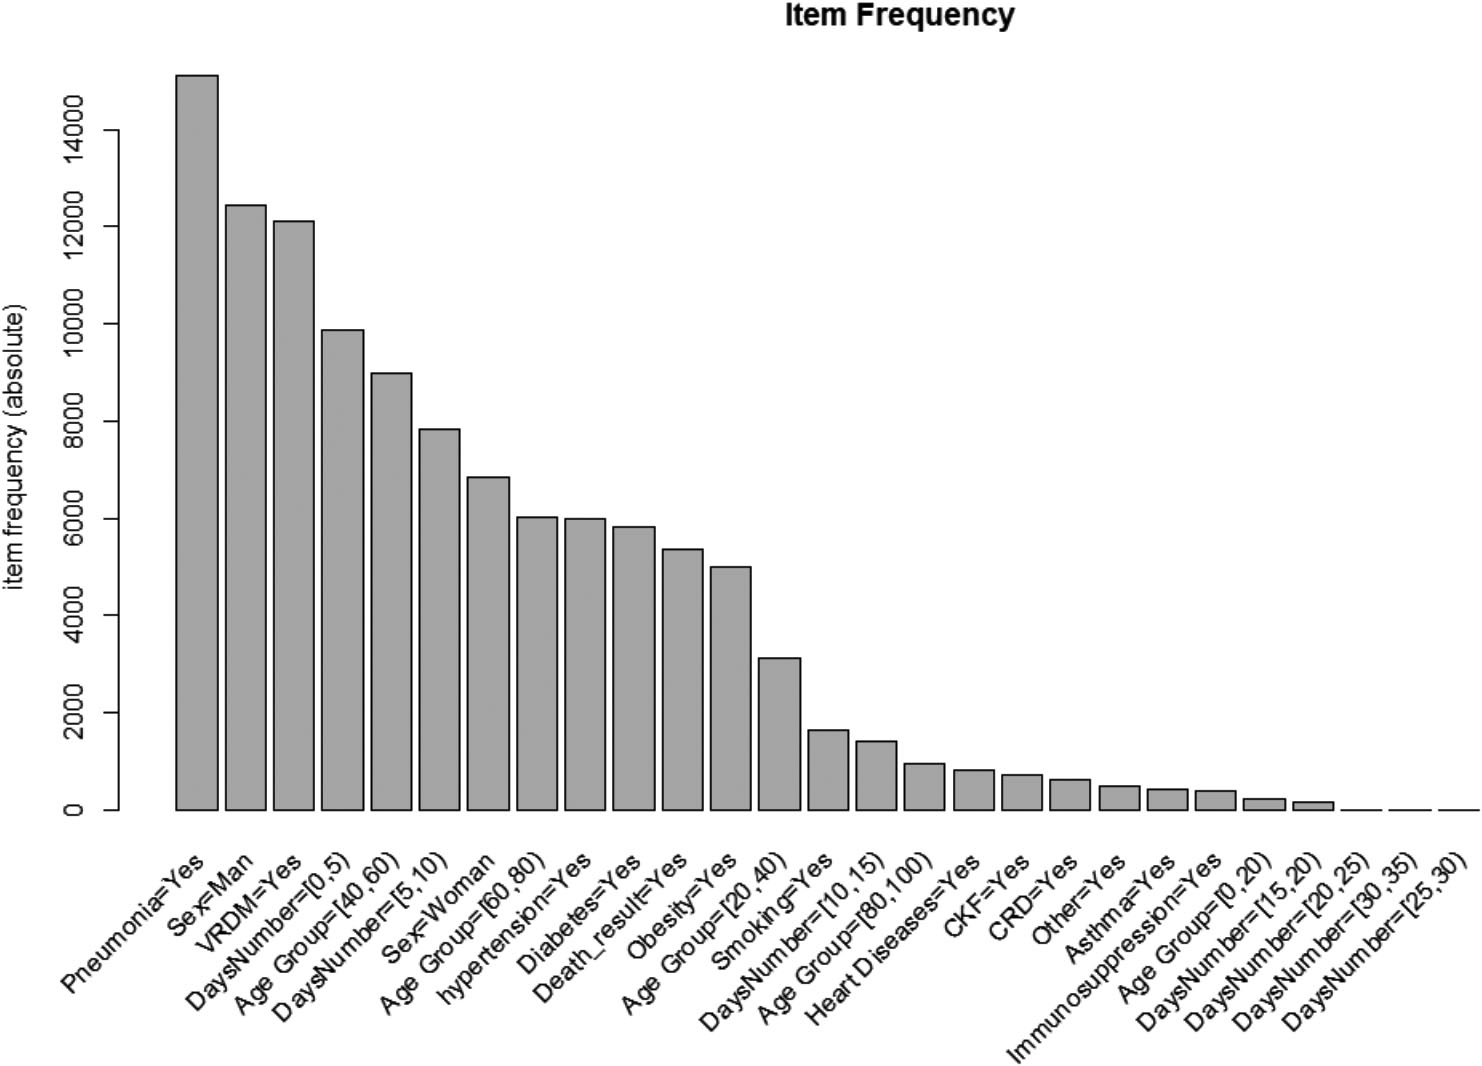
Figure 5.
Most frequent diseases and features like sex, days passed from symptom manifestation to hospitalization, age group.
An association rule consists of two parts: an antecedent (which is the “if”) and a consequent (which is the “then”). An item found within the data is an antecedent. This in combination with an item found is a consequent.
Association rules use itemsets for their calculation. Itemsets consist of two or more items. If one used all the possible itemsets to create rules, the rules would be so many that they would be useless. Association rules are created from rules well-represented in data.
There are two indicators about the strength of an association rule and they are the support and the confidence which are two parameters we will describe below in Analysis section.
There is also a third parameter which measures the correlation between data points and it is calculated as the ration of confidence to support.
4.3.1Association rule algorithms
There are several algorithms that are used in Association Rules. One of the most popular is the Apriori algorithm. With this algorithm, only the large itemsets of the previous pass generate candidate itemsets. In each pass the algorithm takes the large itemset of the previous pass and joins it with itself. This way, it generates all itemsets whose size is higher by 1. All itemsets that are generated and have a subset which is not large will be deleted. The itemsets remaining after all the deletions are the candidate ones. Any subset of a frequent itemset is also a frequent itemset. By defining a minimum support count, the algorithm reduces the candidate itemsets, by exploring itemsets whose support count is greater than the previous minimum.
4.4Analysis
We applied Association Rules in our analysis. Although it is primarily used in Commercial Product Promotion, we attempted using it in finding the most usual comorbidities and infer how they are contributing to mortality. Our original thought was that if we associate the human body with a market basket, we can map all diseases to items in the basket. We assume that the death of the human body is just another item in the basket. A transaction, in our case, is a set of comorbidities.
Table 5
Diseases combination (comorbidities) that led to death
| Id | lhs | Rhs | Support | Confidence | Lift |
|---|---|---|---|---|---|
| [1] | {VRDM | 0.00103 | 0.800 | 2.886 | |
| [2] | {VRDM | 0.00113 | 0.758 | 2.737 | |
| [3] | {VRDM | 0.00119 | 0.741 | 2.677 | |
| [4] | {VRDM | 0.00103 | 0.740 | 2.673 | |
| [5] | {VRDM | 0.00113 | 0.733 | 2.646 | |
| [6] | {Pneumonia | 0.00134 | 0.722 | 2.606 | |
| [7] | {VRDM | 0.00119 | 0.718 | 2.593 | |
| [8] | {Pneumonia | 0.00108 | 0.700 | 2.526 | |
| [9] | {VRDM | 0.00108 | 0.700 | 2.526 |
Suppose the Apriori algorithm results in association rules with death on the right-hand side of the equation. In that case, we can find the most frequent associations (comorbidities) that included death as a result.
The Apriori algorithm, as we saw above, returns three main results as components. These are:
• Support
• Confidence
• Lift
Support refers to the default popularity of an item and can be calculated by finding the number of transactions containing a particular item divided by the total number of transactions.
Confidence refers to the likelihood that an item B co-exists if item A exists.
Lift (A
The Confidence saws which of the comorbidities set is more frequent with patients of type Death.
Through Lift we can infer how much the mortality increases regarding the comorbidities of a patient.
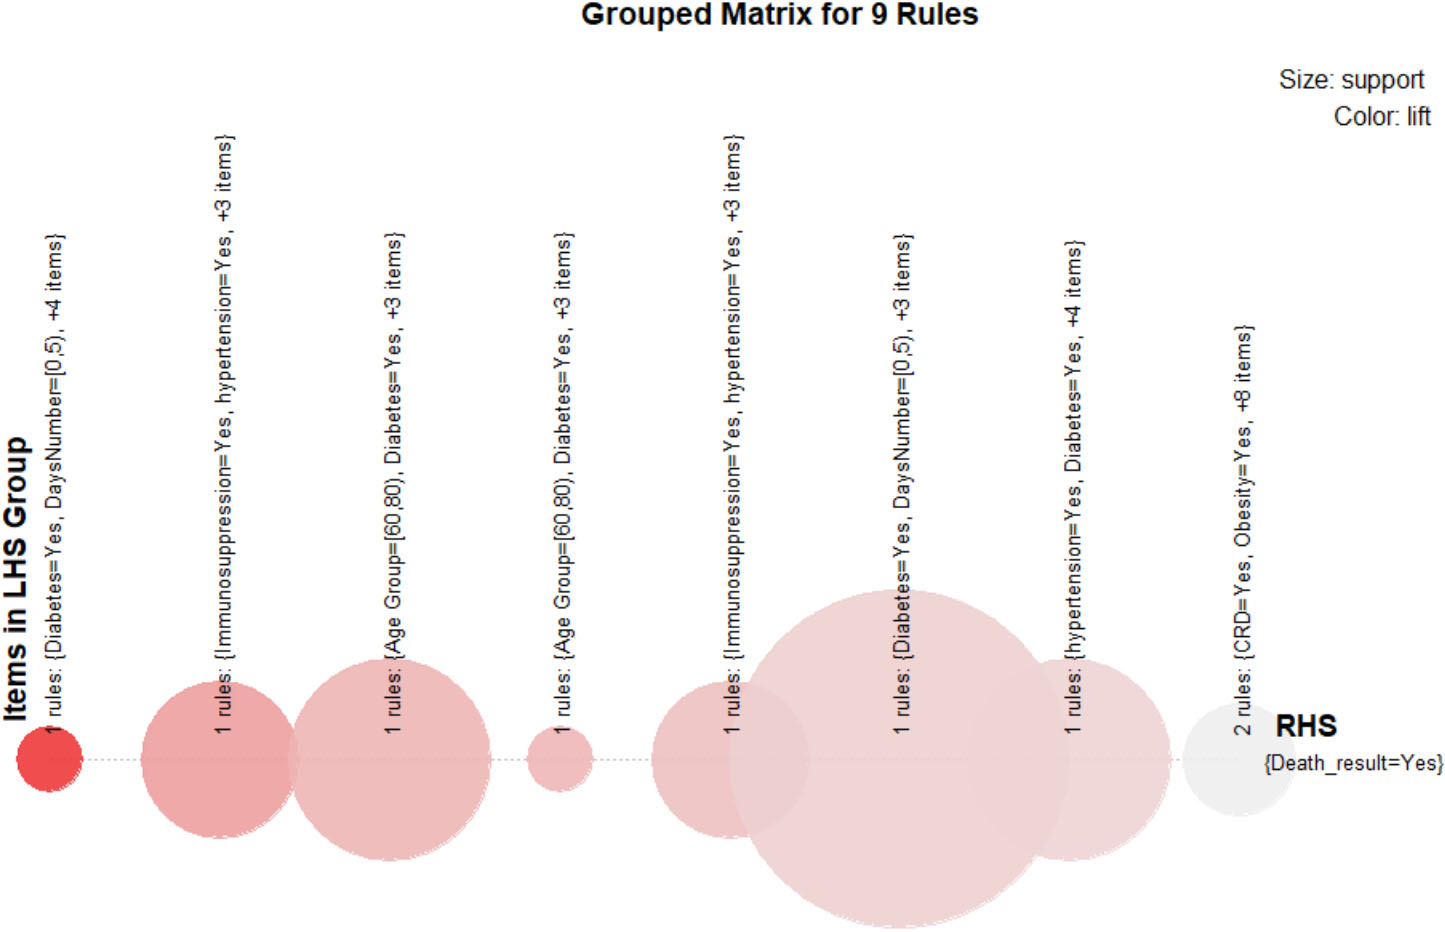
Figure 6.
Grouped matrix visualization.
In the diagram below, one can observe the most frequent comorbidities along with two other factors (Age interval and Days before hospitalization) in the full dataset. We should keep in mind that this diagram was created from the original dataset before applying the Apriori algorithm. This means that it comprises people who survived as well.
It is obvious that Pneumonia is the more frequent disease, followed by Hypertension Diabetes and Obesity.
Most of the people who died were men, although they were hospitalized almost immediately (days [0,5]) after the COVID-19 symptoms manifested, the age group was [40,60], and most of them were monitored by Mexico’s System USMER.
On the other hand, we can observe that there many variables with a low frequency like all of the day intervals above 15 days, other diseases under the variable Other, Asthma, Immunosuppression, CRD, Smoking, CKF, Heart diseases, and Age between 80–100 and 0–20. These low frequent factors do not necessarily mean that they are not responsible for the death of patients. They indeed affect results like unknown factors. It is just that these diseases exist in limited number in our sample.
4.5Analytic results
The results of our analysis following the proposed algorithmic approach were as below.
The above matrix can be read as follows; The column “lhs” represents the cluster with the comorbidities that result into “rhs” value (the death of the individual).
From the above matrix, one can see that the combination of Pneumonia, Diabetes, Heart Diseases, and CKF, even though the patients were under the supervision of VRDM, and they were hospitalized immediately, has the most contribution to a Death result. This means that someone with all these diseases has a probability of 2,886% bigger than someone else to die. Also, this combination was found at a rate of 80% in patients who died. According to the above translation, one can infer for the rest of the cases.
To visualize the grouped matrix, we use a balloon plot with antecedent groups as columns and consequents as rows (see Fig. 6). Since there is only one consequent (death
5.Discussion
In the first part of our study, we tried to find important factors that contribute to the severity of COVID-19 disease. Most of the papers in the literature examine comorbidities to assess the fatality of the disease. In our study we used other factors as well, like Population rate under 15 years old, Population rate over 60 years old, health expenditure in GDP, life expectancy from birth for both sexes, number of cigarettes consumed per 100,000 inhabitants. These factors can reveal more information to the researchers. For instance, if we take into account “Health expenditure in GDP” feature we extract conclusion that the mortality of COVID-19 is lower in countries with high expenditure in health. Our research though revealed that it is not in the top positions of feature importance, but still it occupies the 10
As for the second part, with Market Basket Analysis and Apriori algorithm, apart from our findings, we wanted to show how a methodology that primarily implied on other type of research (supermarket marketing, shops selves’ position, etc.) with some elaboration can be suitable for this problem. We utilized this method that examines the shopping habits of a customer. If a customer purchases a specific product, then it is very likely that he has product A, product B, and other products in his basket. We employed the analogy to the human body and COVID-19 impact. So, we examined what other comorbidities there are in a person-body. This way we hope one can see that algorithms and methodologies from totally different fields and sectors can help in a sector that is under investigation. That is the essence of research after all. We hope that this will give new ideas to other researchers.
6.Conclusions and future steps
In this research study, we show that it is in fact possible to combine data coming from multiple COVID-19 data sources with multiple levels of both medical and socio-economic dimensions instead of focusing on either of them individually. The combination of social and economic parameters combined increases the overall accuracy on both cross-country macro level as well as in micro one. Our study shows the socio-economic correlations that affect COVID-19 mortality levels based on unsupervised learning techniques.
The key objective of our initial part 1 of the study is to identify major social and medical environment factors for the mortality of COVID-19 disease. Following, the objective in the second part of our study is the identification of significant social and medical factors for the mortality of COVID-19 disease.
As a result, we show that our proposed approach can achieve 96% overall accuracy based on extreme gradient boost models when employing a multi-level approach of macro and micro features. Our approach outdoes previous study results that utilize machine learning to assist medical decision-making in COVID-19 prognosis.
Although Asthma is the most important factor in country characteristics is not included in the deadliest comorbidities. The Pneumonia seems to be included in all sets of comorbidities which make it lethal. However, pneumonia is included in “Lower respiratory infections” which has the 9
We have seen that the combination of Pneumonia, Diabetes, Heart Diseases, and CKF, even though the patients were under the supervision of USMER (Use of Viral Respiratory Disease Monitoring Units
COVID-19 and in general health conditions are an ongoing research challenge. Though the first part of the dataset does not appear to have any changes across recent years, it would be interesting though to run the second part to see after almost one year period if the same factors would keep their significance. And this because the data in hospitals increase rapidly in one year and the accuracy and predictability would be better.
Another limitation and a future extension in this study is the inaccessibility to hospital data due to lack of interoperability or centralized data sets. We could not find open centralized hospital data for other countries except Mexico. The access to hospital data would give more clear conclusions.
Future steps include the comparative application of our methodology to geographically neighboring countries as well as to countries within the same socio-economical category.
References
[1] | World Health Organization. Coronavirus disease (COVID-19). 2020 [updated 2021 September 12; cited 2021 November 3]. Available from: https://www.who.int/health-topics/coronavirus#tab=tab_1. |
[2] | World Health Organization. Global literature on coronavirus disease. 2021 [updated 2021 September 12; cited 2021 November 3]. Available from: https://search.bvsalud.org/global-literature-on-novel-coronavirus-2019-ncov/. |
[3] | Squazzoni F, Polhill JG, Edmonds B, Ahrweiler P, Antosz P, Scholz G, Chappin E, Borit M, Verhagen H, Giardini F, Gilbert N. Computational models that matter during a global pandemic outbreak: A call to action. Journal of Artificial Societies and Social Simulation. (2020) ; 23: (2); doi: 10.18564/jasss.4298. |
[4] | Shearer FM, Moss R, McVernon J, Ross JV, McCaw JM. Infectious disease pandemic planning and response: Incorporating decision analysis. PLoS Medicine. (2020) ; 17: (1); doi: 10.1371/journal.pmed.1003018. |
[5] | Sharma A, Shukla A, Tiwari R, Mishra A. Mortality Prediction of ICU patients using Machine Leaning: A survey. ICCDA ’17: Proceedings of the International Conference on Compute and Data Analysis, (2017) . |
[6] | Sánchez-Montañés M, Rodríguez-Belenguer P, Serrano-López AJ, Soria-Olivas E, Alakhdar-Mohmara Y. Machine Learning for Mortality Analysis in Patients with COVID-19. International journal of environmental research and public health. (2020) ; 17: (22). 8386. doi: 10.3390/ijerph17228386. |
[7] | Mohammad P, Mahdi S. Predicting mortality risk in patients with COVID-19 using machine learning to help medical decision-making. Smart Health. (2021) ; 20: . doi: 10.1016/j.smhl.2020.100178. |
[8] | An C, Lim H, Kim DW, Chang JH, Choi YJ, Kim SW. Machine learning prediction for mortality of patients diagnosed with COVID-19: a nationwide Korean cohort study. Sci Rep 10, (2020) ; 10: (1): 18716; doi: 10.1038/s41598-020-75767-2. |
[9] | Bhargava A, Fukushima EA, Levine M, Zhao W, Tanveer F, Szpunar SM, Saravolatz L, Predictors for Severe COVID-19 Infection. Clinical Infectious Diseases. (2020) ; 71: (8): 1962-1968; doi: 10.1093/cid/ciaa674. |
[10] | Du RH, Liang LR, Yang CQ, Wang W, Cao TZ, Li M, Guo GY, Du J, Zheng CL, Zhu Q, Hu M, Li XY, Peng P, Shi HZ. Predictors of mortality for patients with COVID-19 pneumonia caused. Eur Respir. (2020) ; 55: (5): 2000524. doi: 10.1183/13993003.00524-2020. |
[11] | Zhou F, Yu T, Du R, Fan G, Liu Y, Liu Z, Xiang J, Wang Y, Song B, Gu X, Guan L, Wei Y, Li H, Wu X, Xu J, Tu S, Zhang Y, Chen H, Cao B. Clinical course and risk factors for mortality of adult inpatients with COVID-19 in Wuhan, China: a retrospective cohort study. The Lancet. (2020) ; pp. 1054-1062; doi: 10.1016/S0140-6736(20)30566-3. |
[12] | Du Y, Tu L, Zhu P, Mu M, Wang R, Yang P, Wang X, Hu C, Ping R, Hu P, Li T, Cao F, Chang C, Hu Q, Jin Y, Xu G. Clinical Features of 85 Fatal Cases of COVID-19 from Wuhan. American Journal of Respiratory and Critical Care Medicine. (2020) ; pp. 1372-1379; doi: 10.1164/rccm.202003-0543OC. |
[13] | Zheng Z, Peng F, Xu B, Zhao J, Liu H, Peng J, Li Q, Jiang C, Zhou Y, Liu S, Ye C, Zhang P, Xing Y, Guo H, Tang W. Risk factors of critical & mortal COVID-19 cases: A systematic literature review and meta-analysis. The Journal of Infection. (2020) ; 81: (2): e16-e25; doi: 10.1016/j.jinf.2020.04.021. |
[14] | Bertran Recasens B, Martinez-Llorens JM, Rodriguez-Sevilla JJ, Rubio MA. Lack of dyspnea in patients with COVID-19: another neurological conundrum? European Journal of Neurology. (2020) Sep; 27: (9): e40; doi: 10.1111/ene.14265. |
[15] | Lippi G, Wong J, Henry BM. Hypertension in patients with coronavirus disease 2019 (COVID-19): a pooled analysis. Polish Archives Of Internal Medicine. (2020) ; 130: (4): 304-309; doi: 10.20452/pamw.15272. |
[16] | Guo W, Li M, Dong Y, Zhou H, Zhang Z, Tian C, Qin R, Wang H, Shen Y, Du K, Zhao L, Fan H, Luo S, Hu D. Diabetes is a risk factor for the progression and prognosis of COVID-19. Diabetes/metabolism Research and Reviews. (2020) ; 31: : e3319; doi: 10.1002/dmrr.3319. |
[17] | Aktar S, Talukder A, Ahamad MM, et al. Machine Learning Approaches to Identify Patient Comorbidities and Symptoms That Increased Risk of Mortality in COVID-19. Diagnostics (Basel). (2021) ; 11: (8): 1383; doi: 10.3390/diagnostics11081383. |
[18] | Ikemura K, Bellin E, Yagi Y, Billett H, Saada M, Simone K, Stahl L, Szymanski J, Goldstein DY, Reyes Gil M. Using Automated Machine Learning to Predict the Mortality of Patients With COVID-19: Prediction Model Development Study. J Med Internet Res. (2021) ; 23: (2): e23458. doi: 10.2196/23458. |
[19] | The Tobacco Atlas. Consumption. 2018 [updated 2021 September 12; cited 2021 November 3]. Available from: https://tobaccoatlas.org/topic/consumption/. |
[20] | World Health Organization, Global Health Estimates 2020: Deaths by Cause, Age, Sex, by Country and by Region, 2000-2019. Geneva. 2020 [updated 2021 September 12; cited 2021 November 3]. Available from: https://www.who.int/healthinfo/global_burden_disease/estimates/en/. |
[21] | Chawla NV, Bowyer KW, Hall LO, Kegelmeyer WP. SMOTE: Synthetic Minority Over-sampling Technique. Journal of Artificial Intelligence Research. (2020) ; pp. 321-357; doi: 10.1613/jair.953. |
[22] | Friedman JH. Greedy Function Approximation: A Gradient Boosting Machine. Ann. Statist. (2001) ; 29: (5): 1189-1232; doi: 10.1214/aos/1013203451. |
[23] | Tianqi C, Guestrin C. XGBoost: A Scalable Tree Boosting System. 22nd SIGKDD Conference on Knowledge Discovery and Data Mining, (2016) . |
[24] | Mexico Subsecretaría de Prevención y Promoción de la Salud. Datos Abiertos. 2020 [updated 2021 September 12; cited 2021 November 3]. Available from: https://www.gob.mx/cms/uploads/attachment/file/604028/Datos_abiertos_historicos_2020.pdf. |
[25] | Hastie T, Tibishirani R, Friedman J. The Elements of Statistical Learning. New York: Springer, (2008) . |
[26] | Srikant R, Agrawal R. Mining Generalized Association Rules. Future Generation Computer Systems. (1997) ; 13: (2,3): 161-180. doi: 10.1016/S0167-739X(97)00019-8. |
[27] | De Souza F, Sumika H, Hojo-Souza NS, Dos Santos EB, Da Silva CM, Guidoni DL. Predicting the Disease Outcome in COVID-19 Positive Patients Through Machine Learning: A Retrospective Cohort Study With Brazilian Data. Frontiers in Artificial Intelligence. (2021) ; 4. doi: 10.3389/frai.2021.579931. |


