
Symptom based COVID-19 test recommendation system using machine learning technique
Abstract
At present, the mankind of the entire world is under serious threat due to the unexpected COVID-19 pandemic. The advent of this pandemic exposes many drawbacks in the medical and healthcare system. As per the guidelines of WHO, the spread of the virus must be controlled through proper measures that help cease the virus. Tracing infected subjects (people/patients) is exceedingly difficult across the globe. The testing process in many countries is hampered by the unavailability of COVID-19 Test kits. Therefore, a testing process needs a robust mechanism to identify the infected subject to reduce the infection rate. To address this issue, a Symptom-based COVID-19 Test Recommendation System using Machine Learning methods is proposed and tested on real data set. It is found that the results of the system are promising and accurate up to 99%. The proposed piece of work undergoes four steps. First, it creates synthesized data set by using inputs of the Superintendent of Physical Health Centre (Rajam). Second, the synthesized data set is balanced by using Random under-sampling (RUS) followed by Synthetic minority oversampling (SMOTE). Third, different machine learning techniques such as K-Nearest Neighbor (KNN), Decision Tree (DT), Naïve Bayes, Random Forest (RF), Stochastic Gradient Descent (SGD), and Support vector machine (SVM) are applied on both the Synthesized and balanced data sets to classify subjects into different classes based on age, comorbidity-chronic disease- and other symptoms (cold, cough, fever, and breathlessness). Finally, the COVID-19 Test Recommended System is created and integrated with the best classification model. From the experimental results, it is observed that the training and testing accuracy of all the classification models is more than 99% consequently, the COVID-19 Testing recommended system also gives 100% accuracy in predicting the category of a subject based on input symptoms.
1.Introduction
The International Committee on Taxonomy of Viruses (ICTV) labeled Severe Acute Response Syndrome coronavirus (SARS-CoV2) induced coronavirus disease (COVID-19) [1] pandemic initially started in Wuhan, China since January 2020 and spread all over the world. The COVID-19 is belonging to Coronaviridae family, and size is 65–125 nm diameter creates severe respiratory problems and ease of spread through air and droplets of human while coughing.
Currently, many developed countries in the world are severely affected by this virus due to the lack of authorized information about this virus. At the same time, ignorance, unpreparedness, and reluctance of public authorities of different countries increased the severity of this virus. The dynamic gene mutative nature of the COVID-19 virus enables it to adapt to quick changes in the environment and helps to sustain in different weather conditions. This peculiar behavior of the virus poses many challenges to the entire world. The advent of this pandemic exposes many drawbacks in the medical and healthcare system. It exposes many vulnerabilities especially related to the readiness of societies to such kinds of health emergencies. The World Health Organization (WHO) releases several guidelines to face the current situation from time to time. Many countries following either the 3T (Test, Treat, Track) or 5T (Test, Trace, Treat, Teamwork, Track, and monitoring) formula to contain the virus. Many countries have announced Lock-down to reduce the spread of the virus.
In India till 22 March 2020 around 360 people have been infected with COVID-19 and 7 were dead. At present, according to the statics of the Indian government as of 19 Jan 2021 exactly 1,05,81,837 has been infected with COVID-19, the death toll was 1,52,556, the death rate is 1.44% and discharged cases (cured) after treatment is 96.66%. This analysis shows that India is on the safer side because of strict implementation of lock-down till 31 May 2020 and subsequent unlock rules till date. On the other hand, In Andhrapradesh (AP) state 886245 people have been infected with COVID-19, 877443 were cured, active cases are 1660, the death toll was 7142, the death rate is 0.8%, and discharge rate is 99% as of 19 Jan 2021.
Mucahid Barstugan et al. [2] proposed the machine learning-based classification of COVID-19 CT images which applies feature extraction methods such as Grey Level Co-occurrence Matrix (GLCM), Local Directional Pattern (LDP), Grey Level Run Length Matrix (GLRLM), Grey-Level Size Zone Matrix (GLSZM), and Discrete Wavelet Transform (DWT) to improve the performance in classification. The Support Vector Machines (SVM) algorithm is used for the effective classification of infected regions of CT abdominal images.
Zifeng Yang et al. [3] proposed the Modified SEIR and AI prediction of the trend of the epidemic of COVID-19 in China under public health interventions which integrates machine learning techniques with Susceptible-Exposed-Infectious-Removed (SEIR) model to predict the progression of COVID-19 epidemic in china. The domestic migration and the most recent COVID-19 epidemiological data are applied to the modified SEIR model to predict the status of coronavirus in china. In Japan, according to COVID-19 policy, people with high fever for more than four days are recommended for COVID-19 test, and the people with mild COVID-19 symptoms are restricted to homes. This situation hides the deaths due to COVID-19.
The society coexisting with COVID-19 [4] discusses how badly Japan country affected due to the delay in COVID-19 testing. Hence, a recommender system for selecting a potential subject or candidate for COVID 19 testing is proposed. Machine Learning algorithms are used to classify a subject into any of the five classes such as No-symptom, General symptoms, Low-risk, Medium-risk, High-risk. The people labeled as Low-risk, Medium-risk, and High-risk are recommended for the COVID-19 test. This proposed work considers five-cold, cough, fever, breath, and comorbodities-ill-health symptoms and age as the other important factor.
The rest of this paper is organized as follows, Section 2 discusses past literature related to different disease recommender systems. Section 3 explains the working approach of the proposed work. Performance evaluation of classification techniques discussed in section 4. Implementation of the symptom-based recommended system presented in section 5. Finally, conclusion and discussion for future scope in Section 6.
Table 1
Rajam rural and urban data set from primary health center
| High risk factor | High risk factor | High risk factor | ||||
| sno | Secretariat | Number | General | General | Age | Age |
| of | public | symptomatic | and comorbidities | and comorbidities | ||
| houses | symptomatic | and Age | ||||
| 1 | SYAMPURAM | 738 | 1 | 0 | 0 | 0 |
| 2 | ANTHAKAPALLI | 1271 | 1 | 0 | 0 | 1 |
| 3 | G.C.PALLI | 616 | 2 | 1 | 0 | 0 |
| 4 | GURAVAM | 983 | 17 | 9 | 4 | 1 |
| 5 | SOPERU | 1278 | 14 | 10 | 1 | 0 |
| 6 | BODDAM | 1646 | 12 | 6 | 11 | 11 |
| 7 | POGIRI2 | 923 | 2 | 1 | 1 | 1 |
| 8 | RAJAYYAPETA | 1216 | 0 | 0 | 0 | 0 |
| 9 | VOMMI | 648 | 7 | 4 | 0 | 0 |
| 10 | DRNVALSA | 781 | 21 | 5 | 0 | 3 |
| 11 | PENUBAKA | 1161 | 3 | 1 | 0 | 1 |
| 12 | POGIRI1 | 887 | 2 | 1 | 0 | 0 |
| 13 | M.J.VALASA | 1001 | 7 | 3 | 17 | 15 |
| 14 | AGURU | 784 | 1 | 1 | 4 | 3 |
| 15 | GADIMUDIDAM | 897 | 10 | 2 | 0 | 0 |
| 16 | KANCHARAM1 | 859 | 2 | 2 | 0 | 0 |
| 17 | KANCHARAM2 | 823 | 2 | 1 | 0 | 0 |
| 18 | LATCHAYYETA-01 | 1606 | 27 | 6 | 1 | 0 |
| 19 | KONDAMPETA | 915 | 37 | 10 | 0 | 0 |
| 20 | MITTIREDDYSTREET | 926 | 8 | 4 | 0 | 0 |
| 21 | MADIGAVEEDHI | 1377 | 77 | 29 | 5 | 0 |
| 22 | INDIRAMMACOLONY | 903 | 3 | 2 | 1 | 0 |
| 23 | BUTCHIMPETA | 973 | 1 | 1 | 1 | 0 |
| 24 | PONUGUTIVALASA | 1366 | 17 | 10 | 1 | 11 |
| 25 | ADARSHNAGAR | 1047 | 9 | 2 | 4 | 15 |
| 26 | KOTHAVALASA | 1005 | 14 | 6 | 1 | 0 |
| 27 | SATYANARAYANAPURAM | 828 | 11 | 5 | 0 | 0 |
| 28 | LATCHAYYETA-02 | 868 | 6 | 4 | 15 | 15 |
2.Related work
Patil et al. [5] discussed suitable machine learning algorithms used to predict, decision making, and analyze medical data related to diabetes. The authors experimented on PIMA Indian diabetic data set. The proposed method applies different pre-processing techniques, future (Forward and Backward) selection methods, and then applied five different classifiers (ADABoost, Decision Tree, XGBoost, Voting Classifier, and Stacking Classifier) to produce five different trained models on the PIMA Indian data set. Finally, it is concluded that the results of ADABoost and Random Forest are best out of all five classifiers in terms of accuracy and other metrics.
Mumtaz Ali et al. [6] proposed a neutrosophic recommended system for medical diagnosis based on algebraic neutrosophic measures which identify or recommend disease of a patient based on three issues such as symptoms of a patient, the probable symptoms of a respective disease, and identification of disease based on symptoms possessed by a patient.
Chen et al. [7] proposed Disease Diagnosis and Treatment Recommendation System is an ontology-based Diabetes Medication Recommendation system which creates knowledge on different attributes – the nature of the diabetic drug, dispensing type of drug, and side effects – of each drug/medicine and ontology information on symptoms of a patient to advise/recommend a potential prescription to the diabetic diseased person. Phanich et al. [8] proposed the Food Recommendation System (FRS) which suggests a healthy and nutritional diet plan for diabetic patients. The food clustering analysis is performed by FRS to recommend food with less sugar and fat content. In recent times, the importance and usage of natural herbs for chronic diseases are increased and the Choi et al. [9] proposed HerDing which is a herb recommended system useful for treating a chronic disease like leukaemia, diabetics, heart diseases, etc. The HerDing recommends respective natural products (herbs) based on symptoms of a patient.
Table 2
Description of data set shown in Table 1
| Secretariat | Is an government office at each village. |
|---|---|
| Number-of-Houses | The total number of houses under each Secretariat. |
| General Public Symptomatic | The number of people suffering from general symptoms – Cold, Cough and Fever problem – in each Secretariat. |
| High Risk Factors | Divided into three categories by considering three symptoms such as Age, Breathing and Comorbidites along with general symptoms.
|
| General Symptomatic and Age | The number of people who are above 60 years and having general symptoms in each Secretariat. |
| Age | The number of people who are above 60 years, having Comorbidities and having general symptoms in each Secretariat. |
| Age | The number of people who are below 60 years,having Comorbidities and having general symptoms in each Secretariat. |
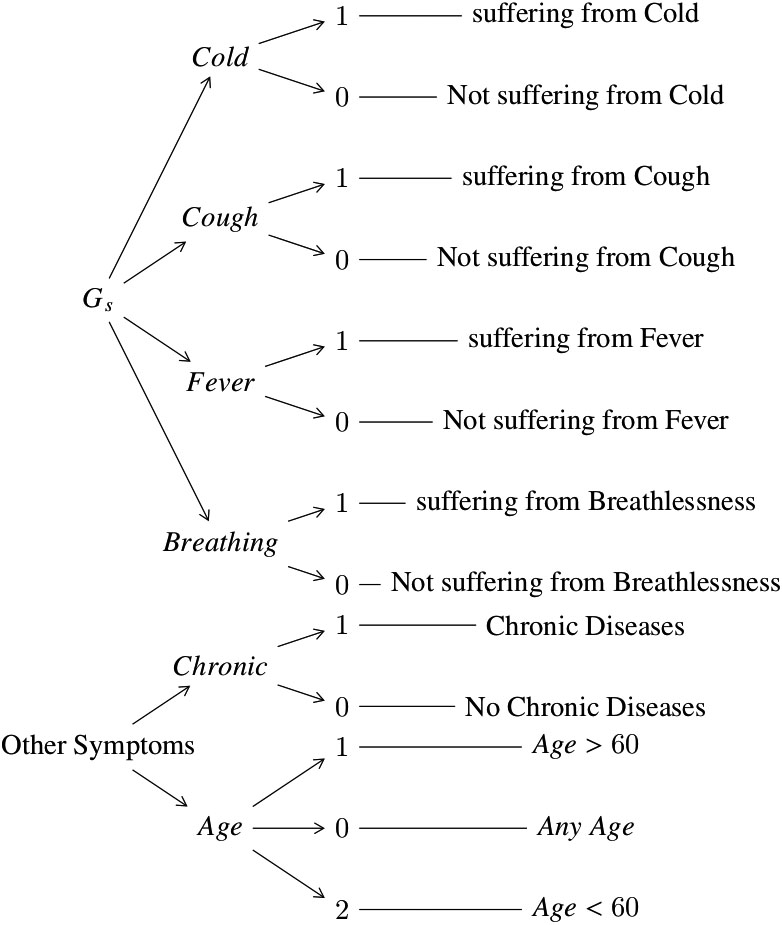
In the literature, recommended systems [5, 6, 7, 8, 9] using different machine learning techniques were proposed. In addition to this, recently, Srinivasa Rao et al. [10] proposed a machine learning-based web survey through mobile phone for the improvement in the identification of possible COVID-19 cases and to reduce the spread of the virus among susceptible people who are under quarantine. The survey intention is to collect travel history and symptoms from a person who is under COVID-19 investigation. Similarly, AI techniques are applied on such preliminary data for early identification of people with COVID-19 and non-COVID-19 symptoms as well as to classify them into no-risk, minimal-risk, moderate-risk, and high-risk groups. The identified high-risk people can be recommended for isolation. In line with the proposed web survey through mobile phone [10], in this paper, we proposed COVID-19 test recommendation system using machine learning techniques on house-to-house survey data collected by the health department of Andhra pradesh (AP) state government to identify the people infected with General and High-risk symptoms. This proposed work recommends people for COVID-19 test based on disease class – No-Symptoms, General Symptoms, Low-risk, Medium-risk, and High-risk – identified using machine learning methods like KNN, DT, Naïve Bayes, RF, SGD, and SVM. The proposed symptom-based test recommendation system gives more than 99% accuracy in recommending COVID-19 test to the people who suffer from defined ill-health symptoms described in Algorithms 3.1 and 3.2. These algorithms are prepared based on inputs of the Superintendent of Physical Health Center (Rajam) mentioned in Table 2 and representation of each symptom is as shown in Fig. 1.
Figure 1.
The Symptom and it’s representation.
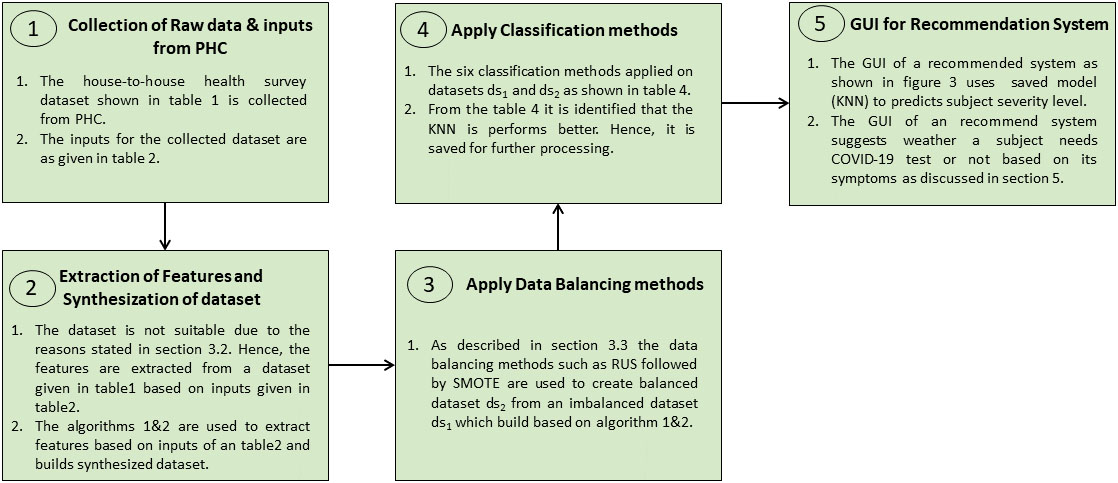
In this piece of work, the proposed Algorithms 3.1 and 3.2 are applied on house-to-house surveyed data to build a synthesized data set and then, data balancing methods applied to this synthesized data set to make it balanced. Now, the machine learning techniques like KNN, DT, Naïve Bayes, RF, SGD, and SVM are applied on a both synthesized and balanced data set to identify different classes based on age, comorbidity, and other symptoms (which are defined by the health department of AP) of people suffering from various diseases.
Figure 2.
The flow of proposed work.
3.Symptom based COVID-19 test recommendation system using machine learning techniques
The recent statistics reveal that spread of the COVID-19 virus transformed into a pandemic form epidemic. The mankind of the entire world is fighting against the COVID-19 pandemic. The World Health Organization (WHO) [11, 12] strictly recommends more tests to admit COVID-19 infected people in COVID-Hospitals to decrease community spread of COVID-19. It also recommends different testing priorities and strategies [12] for early detection of infected people as well as best utilization of available medical – testing infrastructure, medical staff, etc. – resources. The proposed COVID-19 testing recommender system is very useful to detect and separate probable high-risk category people. The flow of proposed work is as shown in Fig. 2.
3.1About data set
To address the COVID-19 testing problem, the Andhra predesh (AP) state government of India conducted a house-to-house survey in the entire state through village/Town level employees to find the health status of people. Because of this, the data set consisting of a rural and urban population of Rajam Mandal is collected from the Primary Health Center (PHC) of Rajam, Srikakulam district. Table 1 shows the Secretariat (an AP government office established for one village or group of villages based on population) wise survey data. It consists of fields like the name of Secretariat, the number of houses visited under that Secretariat, public suffering from General symptoms, and three levels of risk factors
Initialization of features such as Cold,Cough, Fever, Breath, Age, Chronic and Recommendation. The variables such as
3.2Implementation of rules to create synthesized data set
The original data set shown in Table 1 is imbalanced and not suitable for the learning process because of the below reasons
• Huge set of people without symptoms in the given data set.
• The number of people in each house is not known since it populates secretariat wise data.
• The populated data shows how many people under one secretariat have symptoms in each category such as the total number of persons either male or female who has general symptoms (
• The symptoms – cold, cough, fever, or breathing – of a patient is unknown in each category.
In this connection, the below steps are implemented to extract features based on the data given in Tables 1 and 2 to address the above-said reasons.
Step 1: According to the Indian context, it is assumed that the total number of people who dwell in each house is four. So, the number of houses multiplied by four is the total population in each secretariat. As a result, the total surveyed population
Step 2: According to the inputs of PHC superintendent a subject does not have any symptoms treated as No-Symptoms (
Step 3: The features or symptoms such as Cold, Cough, Fever, Breathing, Chronic (Comorbidities), and Age are identified according to step 2
Step 4: The value 1 (one) of a corresponding feature represents that the people suffering from that symptom and value 0 (zero) means not suffering from the corresponding symptom as shown in Fig. 1.
Step 5: Among
Step 6: Based on the data set shown in Table 1 the symptoms of a person who is under
Step 7: In the same way as in step 6 the people who suffer from
Step 8: As per step 6&7 multiply the total people under
[b]
To initialize symptoms under each class for all possible cases. The class number(
Table 3
The class labels of data sets
| Classes | [rgb]0.2,0.2,0.2 | [rgb]0.2,0.2,0.2 | [rgb]0.2,0.2,0.2After splitting[rgb]0.2,0.2,0.2of | [rgb]0.2,0.2,0.2After splitting[rgb]0.2,0.2,0.2of | |||
|---|---|---|---|---|---|---|---|
| RUS | SMOTE | Train (70%) | Test (30%) | Train (70%) | Test (30%) | ||
| 0 | 113192 | 1072 | 2247 | 79200 | 33992 | 749 | 323 |
| 1 | 2247 | 2247 | 2247 | 1572 | 675 | 1590 | 657 |
| 2 | 1968 | 1968 | 2247 | 1397 | 571 | 1359 | 609 |
| 3 | 1072 | 1072 | 2247 | 757 | 315 | 764 | 308 |
| 4 | 1232 | 1232 | 2247 | 871 | 361 | 851 | 381 |
Figure 3.
The data balancing methods
These steps are used to synthesize the data set according to the data given in Table 1 by extracting the necessary features based on inputs of PHC superintendent (Rajam) given in Table 2 followed by providing proper initialization of extracted features to make them suitable for classification as described in Algorithms 3.1 and 3.2. Finally, prepare the data set
3.3Data balancing techniques
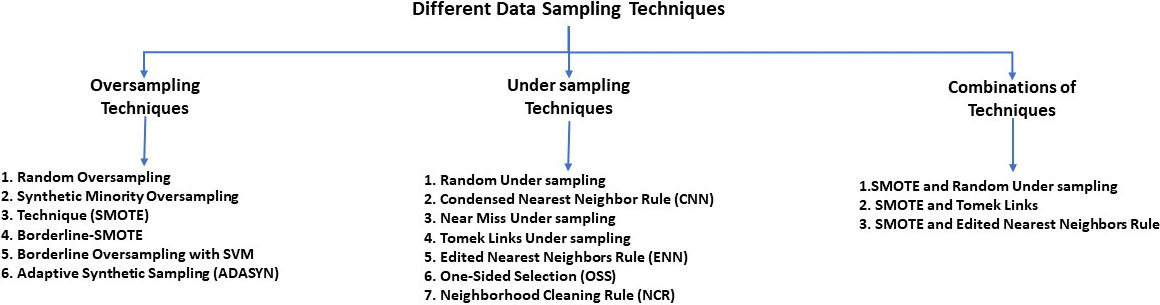
The data re-sampling methods are widely used techniques to make imbalanced class distribution of a respective data set as balanced distribution. The approaches such as under-sampling and over-sampling are two variants for data re-sampling. The uneven train and test data split of class labels of an imbalanced data set is a major drawback. The data sampling techniques shown in Fig. 3 are used to make an equal number of class labels of a respective data set through either oversampling or under-sampling methods. In this piece of work, RUS followed by SMOTE [13, 14, 15] is used to create a balanced data set
3.4Classification techniques
The supervised learning method [16, 17] like classification has two variants such as Binary and Multi-class classifiers are used to classify entries of a data set into the identified class labels. A binary classifier classifies a subject into either of two classes 0 or 1, Yes or No, Male or Female, True or False, etc. A Multiclass classifier works on a data set with more than two class labels and classifies a subject into either of those classes.
The classification methods such as KNN, DT, Naive Bayes, RF, SGD and SVM are applied on both
The DT [19, 20] takes more time for training and less time for prediction and it builds a classification model during its training process. It is one of the popular supervised learning techniques used to solve both classification and regression problems, but it is widely used to classify given data set for accurate decision making. The DT builds a tree for a given data set which consists of two nodes such as Decision-node (Root-node) and Leaf-node. The starting point of the tree is called as Root-node. The Decision-node consists of multiple branches each branch shows a direction towards a final decision. The Leaf-node does not contain branches and gives the final result for the given conditions. The Naïve Bayes classification model is most suitable for large data sets, it is quick in prediction, performs well for multi-class prediction, and needs less training data. This model is designed based on the Bayes theorem. RF is a less biased and less data-sensitive ensemble learning model. It creates a specified number of DT instances on a given data set and takes the majority opinion of DT instances as an outcome.
SGD [21] is one variant of gradient descent optimization algorithms. It takes a very small amount of data from a training set for each iteration to compute the gradient and updates its weight matrix subsequently for each iteration to quickly reach an optimal point. Hence, this algorithm is much faster than other gradient descent algorithms and very useful for huge training sets for quick converge.
SVM is a supervised learning algorithm used for both classification and regression problems. However, it is widely used in classification. It finds a right hyper-plane that differentiates all classes accurately.
4.Evaluation of synthesized data set and classification models
The performance of machine learning models is evaluated using accuracy, sensitivity, specificity, precision, rate of misclassification, and F1-score metrics [19]. The calculation of evaluation metrics uses numerical values of true positive (TP), true negative (TN), false positive (FP), and false-negative (FN) which are obtained from confusion matrices of a respective classification model is as shown below:
• Accuracy
• Sensitivity or Recall or true positive rate
• Specificity or True negative rate
• Precision
• Rate of mis-classification
• F1-measure
Table 4
The training and testing accuracy of all six classification methods on
|
|
|
|
| |||||||||||||||||||||||
|---|---|---|---|---|---|---|---|---|---|---|---|---|---|---|---|---|---|---|---|---|---|---|---|---|---|---|
|
|
|
|
|
|
|
|
|
| ||||||||||||||||||
| K-nearest neighbor | 1.0 | 1.0 | 1.0 | 1.0 | 1.31 | 40.25 | 0.02 | 0.06 | ||||||||||||||||||
| Decision tree | 0.99 | 1.0 | 0.99 | 1.0 | 0.06 | 0.01 | 0.003 | 0.001 | ||||||||||||||||||
| Naive bayes | 0.99 | 1.0 | 0.99 | 1.0 | 0.08 | 0.01 | 0.003 | 0.002 | ||||||||||||||||||
| Random forest | 0.99 | 1.0 | 0.99 | 1.0 | 1.13 | 0.39 | 0.19 | 0.03 | ||||||||||||||||||
| Stochastic gradient descent | 0.99 | 1.0 | 0.99 | 1.0 | 0.49 | 0.21 | 0.015 | 0.004 | ||||||||||||||||||
| Support vector machine | 0.99 | 1.0 | 0.99 | 1.0 | 2.39 | 0.76 | 0.25 | 0.07 | ||||||||||||||||||
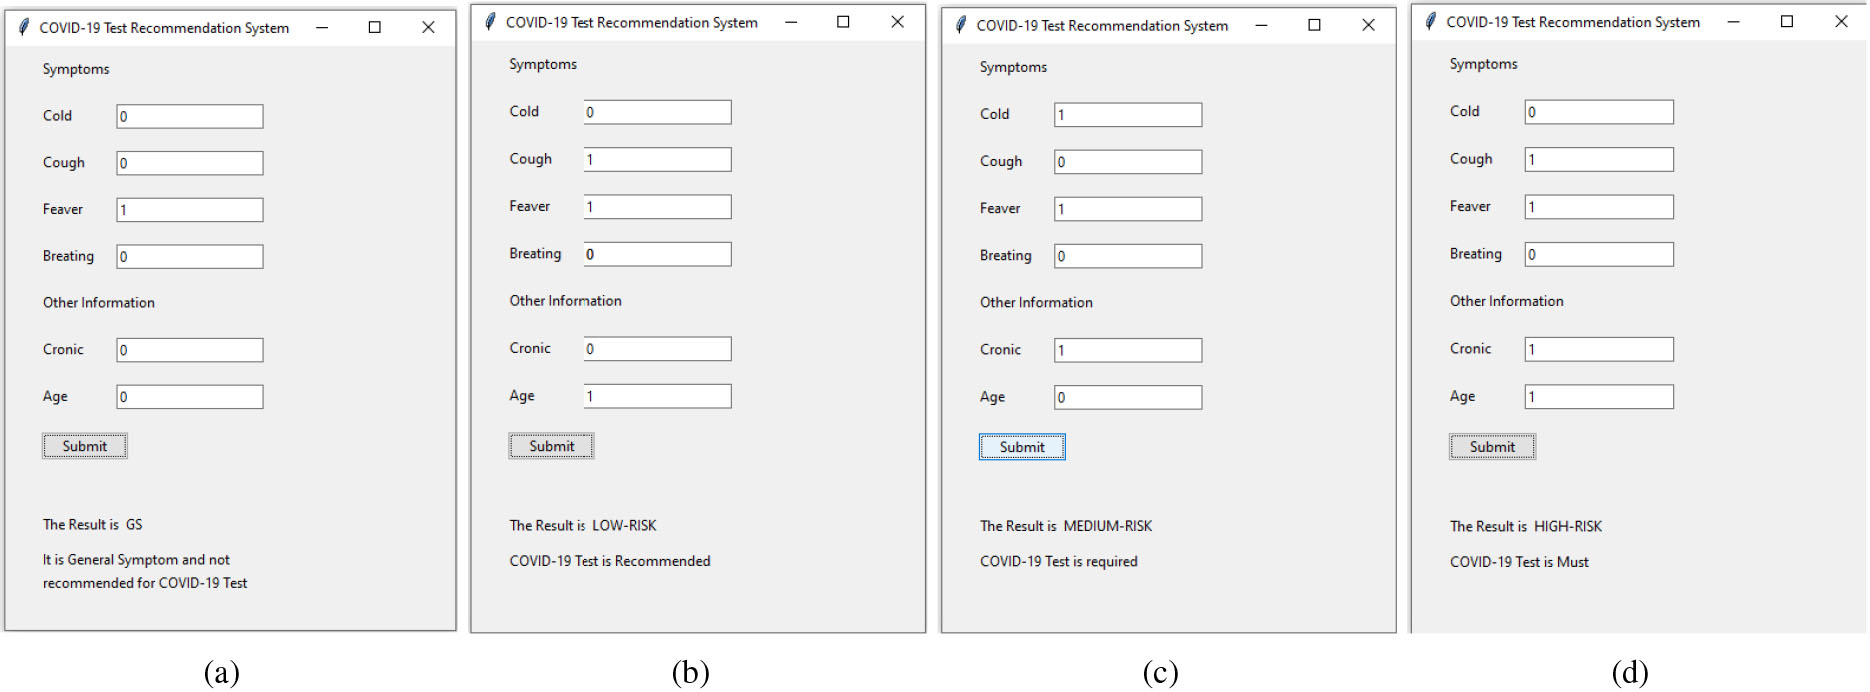
Figure 4.
(a) General symptom, (b) Low-risk, (c) Medium-risk, (d) High-risk.
Four steps are performed in this piece of work. At first, the COVID-19 survey data shown in Table 1 is not suitable for learning as described in Section 3.2. Hence, the Algorithms 3.1 and 3.2 are applied on Table 1 to create synthesized data set
In first task, the data set
In the second task, the RUS data balancing method makes data samples of a maximum category is equal to the minority class of the respective data set by deleting the required number of entries from the maximum category. On the other hand, the data oversampling method SMOTE makes the number of data samples of all classes is equal by adding the required number of extra data samples to each class which are less than the maximum data entries class of the same data set. The RUS followed by SMOTE applied on
In the third task, The training and testing accuracy of classification models like KNN, DT, Naïve Bayes, RF, SGD, and SVM is applied on both
From the results as shown in Table 4 KNN classifier performs well on both the datasets when compared with other classifiers. It is a multi-class classifier suits to the datasets
5.The symptom based recommended system
The results discussed in Section 4 shows the performance of all six classification methods such as KNN, DT, Naïve Bayes, RF, SGD, and SVM gives better results on both the data sets. However, the KNN outperformed other classifiers with both training and testing data. Henceforth, it is saved and used in the GUI of a recommended system to predict the status of a person based on collected symptoms. The proposed recommended system collects symptoms of Cold, Cough, Fever, Breath, Chronic (Comorbidities), and Age from the user as shown in Fig. 4. This information is used to recommend whether the COVID-19 test is required or not as well as the level of severity in collected symptoms. The proposed recommended system is useful for both web and mobile-based survey. The symptoms of a subject are entered through the GUI shown in Fig. 4. A health assistant can enter either 0 or 1 in a specific text field of the GUI. As shown in Fig. 1 the value 0 (Zero) indicates the no presence of a symptom, and the value 1 (One) indicates the presence of a symptom.
The machine learning algorithms are applied on the synthesized dataset where the algorithms are adopted from the sklearn API. All the modules in the proposed work such as creation of synthesized data, data balancing, classification, saving of model and GUI are implemented in python. The source code of this work is available at https://github.com/KLakshmanarao/covid19 for reference.
6.Conclusion and future work
We have evaluated our proposed model with six classification algorithms. From the experimentation results, it is observed that the evaluation metrics – Sensitivity, Specificity, Precision, Rate of misclassification, and F1-Score – and train-test accuracy are good and similar on both the data sets
References
[1] | Krishnakumar B, Rana S. COVID 19 in INDIA: Strategies to combat from combination threat of life and livelihood. Journal of Microbiology, Immunology and Infection. (2020) Jun 1; 53: (3): 389–91. |
[2] | Barstugan M, Ozkaya U, Ozturk S. Coronavirus (covid-19) classification using ct images by machine learning methods. arXiv preprint arXiv:2003.09424. (2020) Mar 20. |
[3] | Yang Z, Zeng Z, Wang K, Wong SS, Liang W, Zanin M, Liu P, Cao X, Gao Z, Mai Z, Liang J. Modified SEIR and AI prediction of the epidemics trend of COVID-19 in China under public health interventions. Journal of Thoracic Disease. (2020) Mar; 12: (3): 165. |
[4] | Tanabe K. Society coexisting with COVID-19. Infection Control & Hospital Epidemiology. (2020) Aug; 41: (8): 988–9. |
[5] | Carter JA, Long CS, Smith BP, Smith TL, Donati GL. Combining elemental analysis of toenails and machine learning techniques as a non-invasive diagnostic tool for the robust classification of type-2 diabetes. Expert Systems with Applications. (2019) Jan 1; 115: : 245–55. |
[6] | Ali M, Thanh ND, Van Minh N. A neutrosophic recommender system for medical diagnosis based on algebraic neutrosophic measures. Applied Soft Computing. (2018) Oct 1; 71: : 1054–71. |
[7] | Chen RC, Huang YH, Bau CT, Chen SM. A recommendation system based on domain ontology and SWRL for anti-diabetic drugs selection. Expert Systems with Applications. (2012) Mar 1; 39: (4): 3995–4006. |
[8] | Phanich M, Pholkul P, Phimoltares S. Food recommendation system using clustering analysis for diabetic patients. In 2010 International Conference on Information Science and Applications. IEEE. (2010) Apr 21. pp. 1–8. |
[9] | Choi W, Choi CH, Kim YR, Kim SJ, Na CS, Lee H. HerDing: herb recommendation system to treat diseases using genes and chemicals. Database. 2016 Jan 1; 2016. |
[10] | Rao AS, Vazquez JA. Identification of COVID-19 can be quicker through artificial intelligence framework using a mobile phone-based survey when cities and towns are under quarantine. Infection Control & Hospital Epidemiology. (2020) Jul; 41: (7): 826–30. |
[11] | Al-Muharraqi MA. Testing recommendation for COVID-19 (SARS-CoV-2) in patients planned for surgery-continuing the service and ‘suppressing’ the pandemic. The British Journal of Oral & Maxillofacial Surgery. (2020) Jun; 58: (5): 503. |
[12] | World Health Organization. Laboratory testing strategy recommendations for COVID-19: interim guidance, 21 March 2020. World Health Organization; (2020) . |
[13] | Pecorelli F, Di Nucci D, De Roover C, De Lucia A. A large empirical assessment of the role of data balancing in machine-learning-based code smell detection. Journal of Systems and Software. (2020) Nov 1; 169: : 110693. |
[14] | Susan S, Kumar A. SSOMaj-SMOTE-SSOMin: Three-step intelligent pruning of majority and minority samples for learning from imbalanced datasets. Applied Soft Computing. (2019) May 1; 78: : 141–9. |
[15] | Alghamdi M, Al-Mallah M, Keteyian S, Brawner C, Ehrman J, Sakr S. Predicting diabetes mellitus using SMOTE and ensemble machine learning approach: The Henry Ford ExercIse Testing (FIT) project. PloS One. (2017) Jul 24; 12: (7): e0179805. |
[16] | Singh A, Thakur N, Sharma A. A review of supervised machine learning algorithms. In 2016 3rd International Conference on Computing for Sustainable Global Development (INDIACom). IEEE. (2016) Mar 16. pp. 1310–1315. |
[17] | Alpaydin E. Introduction to machine learning. MIT press; 2020 Mar 24. |
[18] | Friedman JH, Baskett F, Shustek LJ. An algorithm for finding nearest neighbors. IEEE Transactions on Computers. (1975) Oct; 100: (10): 1000–6. |
[19] | Choudhury A, Gupta D. A survey on medical diagnosis of diabetes using machine learning techniques. In Recent Developments in Machine Learning and Data Analytics. Springer, Singapore. (2019) . pp. 67–78. |
[20] | Argentiero P, Chin R, Beaudet P. An automated approach to the design of decision tree classifiers. IEEE Transactions on Pattern Analysis and Machine Intelligence. (1982) Jan; 4: (1): 51–7. |
[21] | Ruder S. An overview of gradient descent optimization algorithms. arXiv preprint arXiv:1609.04747. (2016) Sep 15. |
[22] | Bernheim A, Mei X, Huang M, Yang Y, Fayad ZA, Zhang N, Diao K, Lin B, Zhu X, Li K, Li S. Chest CT findings in coronavirus disease-19 (COVID-19): relationship to duration of infection. Radiology. (2020) Feb 20: 200463. |
[23] | Ai T, Yang Z, Hou H, Zhan C, Chen C, Lv W, Tao Q, Sun Z, Xia L. Correlation of chest CT and RT-PCR testing for coronavirus disease 2019 (COVID-19) in China: A report of 1014 cases. Radiology. (2020) Aug; 296: (2): E32–40. |
[24] | Shi H, Han X, Jiang N, Cao Y, Alwalid O, Gu J, Fan Y, Zheng C. Radiological findings from 81 patients with COVID-19 pneumonia in Wuhan, China: A descriptive study. The Lancet Infectious Diseases. (2020) Apr 1; 20: (4): 425–34. |
[25] | Hanke H, Knees D. A phase-field damage model based on evolving microstructure. Asymptotic Analysis. (2017) Jan 1; 101: (3): 149–80. |
[26] | Lefever E. A hybrid approach to domain-independent taxonomy learning. Applied Ontology. (2016) Jan 1; 11: (3): 255–78. |
[27] | Meltzer PS, Kallioniemi A, Trent JM. Chromosome alterations in human solid tumors. The genetic basis of human cancer. New York: McGraw-Hill. (2002) : 93–113. |
[28] | Murray PR, Rosenthal KS, Pfaller MA. Medical microbiology E-book. Elsevier Health Sciences; (2020) Mar 10. |
[29] | Wilson E. Active vibration analysis of thin-walled beams (Doctoral dissertation, Ph. D. Dissertation, University of Virginia). |


