GeoNLPlify: A spatial data augmentation enhancing text classification for crisis monitoring
Abstract
Crises such as natural disasters and public health emergencies generate vast amounts of text data, making it challenging to classify the information into relevant categories. Acquiring expert-labeled data for such scenarios can be difficult, leading to limited training datasets for text classification by fine-tuning BERT-like models. Unfortunately, traditional data augmentation techniques only slightly improve F1-scores. How can data augmentation be used to obtain better results in this applied domain? In this paper, using neural network explicability methods, we aim to highlight that fine-tuned BERT-like models on crisis corpora give too much importance to spatial information to make their predictions. This overfitting of spatial information limits their ability to generalize especially when the event which occurs in a place has evolved and changed since the training dataset has been built. To reduce this bias, we propose GeoNLPlify,1 a novel data augmentation technique that leverages spatial information to generate new labeled data for text classification related to crises. Our approach aims to address overfitting without necessitating modifications to the underlying model architecture, distinguishing it from other prevalent methods employed to combat overfitting. Our results show that GeoNLPlify significantly improves F1-scores, demonstrating the potential of the spatial information for data augmentation for crisis-related text classification tasks. In order to evaluate the contribution of our method, GeoNLPlify is applied to three public datasets (PADI-web, CrisisNLP and SST2) and compared with classical natural language processing data augmentations.
1.Introduction
Environmental degradation and the increasing effects of climate change are causing an augmentation of the number of disasters and their impacts [1]. The combination of disasters aggravates crisis situations. Monitoring the evolution of crises is therefore a major challenge to help those affected. Social and press media can fulfill this role since they can provide information that can assist with disaster response efforts. Indeed, they offer the potential to retrieve valuable information for reporting local crisis situations, such as identifying individuals who are still in danger or volunteers who offer help and shelter [2, 3]. In order to enable better management of these situations, it is necessary to use efficient data analysis methods using natural language processing (NLP). The problem we face is the limited labeled data available. In particular, for health crises, the rarity and nonsimilarity of events are important [4]. Even by applying adaptation methods to the crisis domain [5], no satisfactory solution exists.
At the same time, as NLP has been revolutionized by the rise of language models (LMs), this study aims to enhance the performance of these methods for crisis-related situations. These models, based on attention mechanisms [6], have given pride to very large datasets. Even if LMs are intended to be used in transfer learning downstream tasks using a smaller corpus, they still need a sizeable dataset [7]. How can these major advancements be beneficial when working on a small corpus? Borrowed from the computer vision field, different data augmentation techniques have been developed in NLP [8]. The objective is to improve the performance of a text classification model by artificially generating new labeled data to increase the training corpus size. These methods work at multiple textual levels: sentence level, word level, and character level. At the sentence level, methods such as back-translation, text paraphrasing, and sentence shuffling are employed to generate diverse instances by manipulating the order and structure of sentences. Word-level augmentations involve word substitution, where synonyms or semantically similar words replace existing words in the text. Additionally, contextual word replacement techniques utilize surrounding context with language models to generate alternative words. At the character level, noise injection methods introduce random perturbations by adding, removing, or modifying characters in the text. However, several approaches are ineffective when using LM because they are invariant to various transformations [9], such as replacing letters in words or predicting self-masked words in documents. As manually annotated data by humans are too expensive, the goal is to find new data augmentation methods that have a positive impact on LM classifiers for crisis monitoring.
In this paper, we present an analysis of the outcomes obtained from employing a deep learning explanation method [10] on a fine-tuned language model. Our investigation reveals that fine-tuned BERT-like models exhibit a propensity for overfitting on spatial information when trained on crisis corpora. Since the majority of documents in crisis corpora mention a location (such as a country, a city or a place name where an event takes place), models tend to associate certain locations with labels. Indeed, for example, if its training dataset a model learned that Pakistan is associated with flood, it may misclassify other events occurring in Pakistan.
Our hypothesis [11] is that BERT-like fine-tuned models overfit on spatial information in this context. Among all the methods to reduce overfitting, only data augmentation does not change the model architecture. Indeed, different regularization methods exist such as dropout (randomly deactivates some neurons) or L2 (reduces the weights of neurons when these are too high compared to the others). The model we use in this paper, RoBERTA, already includes these regularization mechanisms, leading us to focus on data augmentation. To do this, we aim to create variations of the original documents by replacing the locations mentioned in texts. This helps to expand the model’s exposure to different variations of geographical entity names, reducing the overfitting on pairs of places and labels encountered in the training dataset and increasing the model’s generalizability to new examples. By employing this approach, the model is guided to redirect its attention towards the non-spatial words present in the document, thereby enhancing their significance in the overall attention mechanism. This approach can lead to an effective data augmentation with a strong quality of the artificially labeled data and reduce this geographical overfitting. Thus, we introduce GeoNLPlify, a new approach that integrates three data augmentation techniques based on the spatial information contained in texts. GeoNLPlify has a positive impact on the performance of LM classifiers.
GeoNLPlify detects location mentions with Spacy and then geocodes them using OpenStreetMap data. Finally, GeoNLPlify proposes to replace these places with others (either at the same spatial level or by zooming in or out) in order to create artificially labeled documents.
To evaluate the GeoNLPlify impact on the spatial overfitting reduction, we apply it to three datasets. The first two are directly related to crises since the first, PADI-web [12],22 deals with epidemiological crises in animal health and the second, crisisNLP [13],33 with natural disasters. The last one, SST2 [14],44 does not focus on disasters at all but on sentiment analysis in film reviews. It, therefore, allows us to evaluate the contribution of GeoNLPlify when spatial overfitting is not observed. For all these datasets, we compare GeoNLPlify with two state-of-the-art NLP data augmentation provided by nlpaug [15] by substituting words with (i) WordNet (nlpaug_synonym) [16] and (ii) contextual embedding (nlpaug_contextual_embedding) [17].
To sum up, this article proposes two main contributions: (i) We demonstrate that BERT-like models overfit on spatial information in the context of crises and (ii) Our method, GeoNPLlify, is effective to reduce this bias.
In the following of this paper, we will provide an overview of related work in the field of data augmentation in Section 2. Our proposed methods, detailed in Section 3, will demonstrate that BERT-like models overfit on spatial information and the using of GeoNLPlify reduces this bias. Section 4 will describe, in details, the experimental framework and provide the results of the benchmark comparison of several data augmentations on three public datasets. In the Discussion Section 5, we will interpret the results to better understand why GeoNLPlify performs so well on crisis-related corpora, but also to identify if there are new potential sources of bias when using our method. Finally, the Conclusion Section 6 will summarize our findings and recommendations for future work.
2.Related work
The natural language processing (NLP) domain has been significantly improved by the emergence of language models (LMs). Several models have been trained and made available, such as BERT [18] and RoBERTa [19]. The strength of these approaches, in addition to the quality of their deep learning architecture, relies on pre-training, which requires very large datasets. These models are nonspecific and can be specialized or fine-tuned to a particular domain, such as crisis management [2], which is of interest to us in this study. Unfortunately, this field struggles with a lack of data [20], also called a low data regime (
To overcome this issue, manually labeled datasets must be enlarged. The first way is to ask experts to manually label new data. However, these processes are unfortunately not always possible due to the cost, nonavailability of experts and time needed [21]. The other way is to artificially create new labeled data. Different semisupervised training can be applied [22] to unlabeled data. They can be based on heuristics (for example, in sentiment classification, if an unlabeled document contains words, such as “cry” or “sadness”, the pseudo label can be artificially set as negative) [22], but these kinds of rules are not easily findable. Another way is to train a second model that will generate, by inferring from unlabeled data, reliable pseudo labels [23]. The text classifier model is then trained on the labeled and pseudo-labeled data. Other methods propose using a single model that will be interrupted in its training to infer (with the current weights of the model) unlabeled data [24, 23]. Two limitations can be opposed to these approaches. The first is to overrepresent the data for which the classification is simple, and the other is to take the risk of generating incorrect pseudo-labels.
In contrast to these previous methods, data augmentation (DA) does not operate on unlabeled data to artificially generated pseudo labels. The objective is to make some variations of labeled data to generate new labeled data while guaranteeing the quality of the annotations. Although DA is very popular in computer vision, it is difficult to apply it in NLP due to the data complexity [21]. However, several DA strategies have been provided by the community. Easy data augmentation [25] aims to create a variation of labeled data content by replacing, subsisting or adding characters or words by synonyms or random mechanisms. LM can also be used to replace words with another word enriched by their context [17, 26]; the model will self-mask a word and will infer a replacement thanks to the contextual information. Unfortunately, due to their nature, LM classifiers are invariant to this kind of variation [9]. DA is also applied to evaluate NLP models, which is called adversarial training, by introducing some variations in data until the models infer a wrong label [27, 28, 29, 30]. Data interpolation between two labeled data points can be performed using their LM embedding representation [27], but the quality of the artificially labeled data is not guaranteed. Other NLP tasks, such as translation or summarizing, can benefit from back translation (translating a sentence to another language and returning to the original one) [31].
In this paper, we propose an original spatial data augmentation strategy that has a positive impact on text classifiers. To justify the choice to work on spatial information, we propose to analyze which kind of words the fine-tuned classifier relies on its predictions using saliency maps, such as LIME [10] or SHAP [32]. As it will describe and evaluate in Sections 3 & 4, the analysis of these explainable techniques shows that LMs overfit the spatial information when working on a small corpus related to crises.
3.Method
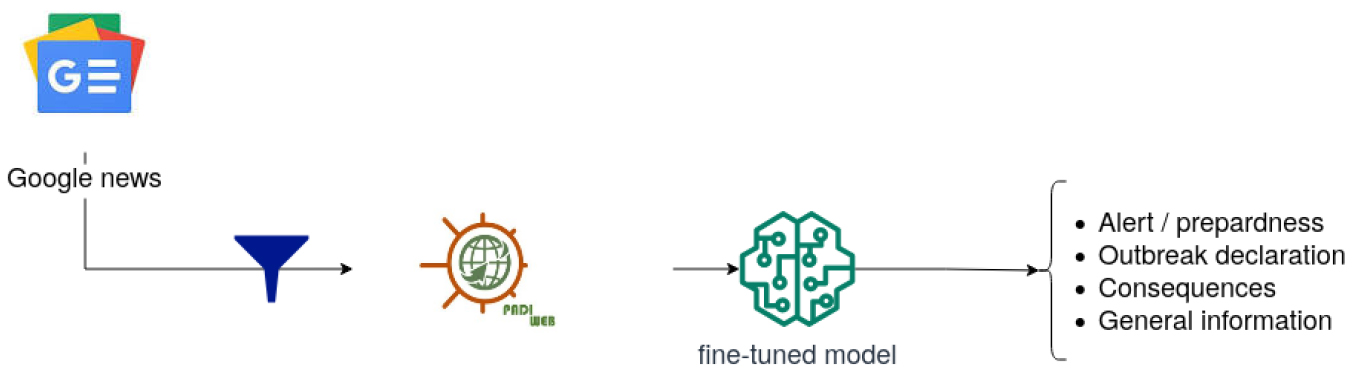
The crisis management field struggles with a lack of data [4, 5], so our main objective is to increase the training dataset since it is not enough to let BERT-like models generalize on new data. To highlight this issue, we introduce our training pipeline as illustrated by Fig. 1. The data used for fine-tuning RoBERTa [19] is PADI-web [12], a corpus of expert annotated documents related to animal health surveillance. Labels corresponding to a crisis stage are assigned to press media articles. For example, the article called “Bird flu cases confirmed at Nottingham’s Colwick Country Park as public warned” (published by Nottingham Post)55 has been annotated as an outbreak declaration, whereas “The decline in the supply of chicks penalizes the poultry sector” (published by El Watan)66 received the label Consequences.
Figure 1.
Prediction workflow.
Using this pipeline, we aim to find out which kind of token the models overfit on to lead our DA strategy. We then propose GeoNLPlify, a set of new data augmentation approaches based on spatial information contained in words. As stated by Longpre et al. [9], LMs are invariant to common data augmentation. Thus, before introducing GeoNLPlify, we propose an interpretation of explanation techniques for LMs that highlight the salience of spatial information for text classification on a tiny crisis-related corpus for which BERT-like models overfit. GeoNLPlify takes advantage of this finding by focusing its variations on geographic information.
3.1Saliency map
To understand what types of words our fine-tuned RoBERTa relies on its predictions, we use LIME [10] as the interpretation method. LIME trains local explanatory models by monitoring the impact of input token variations on the prediction (output) of the model to be explained. Thereby LIME detects which token contributes the most to the predicted class. In the example of Fig. 2, the title of the article “Human case of avian influenza A (H5N1) in Nepal” has been classified with the label Outbreak and the tokens that contribute the most were Case, H5N1, Nepal, Influenza, whereas Human decreased the confidence of the model. This is called local explanation. The token “case” has the highest contribution score, i.e. when the model encounters this word in this sentence, it relies on it to assign the label “outbreak declaration”. Indeed, outbreak declarations often report several cases. On the other hand, how does the geographical information “Nepal” (3rd contributor) help the model to classify the document as an “outbreak declaration”? Why does its prediction also rely on this word? Our hypothesis is because our fine-tuned RoBERTa encounters, in its training dataset, several documents containing “Nepal” and manually labeled by experts as “outbreak declaration”. However, we are aware that explicability or interpretability methods in LM are controversial [33], so we do not use it as a full explanation of our classifier, but we consider the LIME result to be a powerful tool to gain intuition about our fine-tuned model.
Figure 2.
LIME results for text: “Human case of avian influenza A (H5N1) in Nepal”.
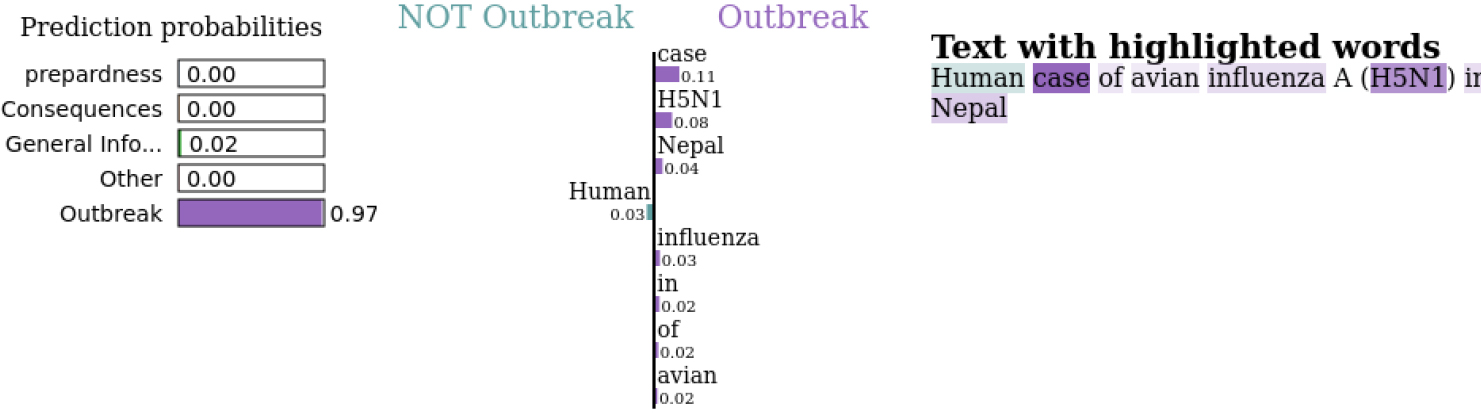
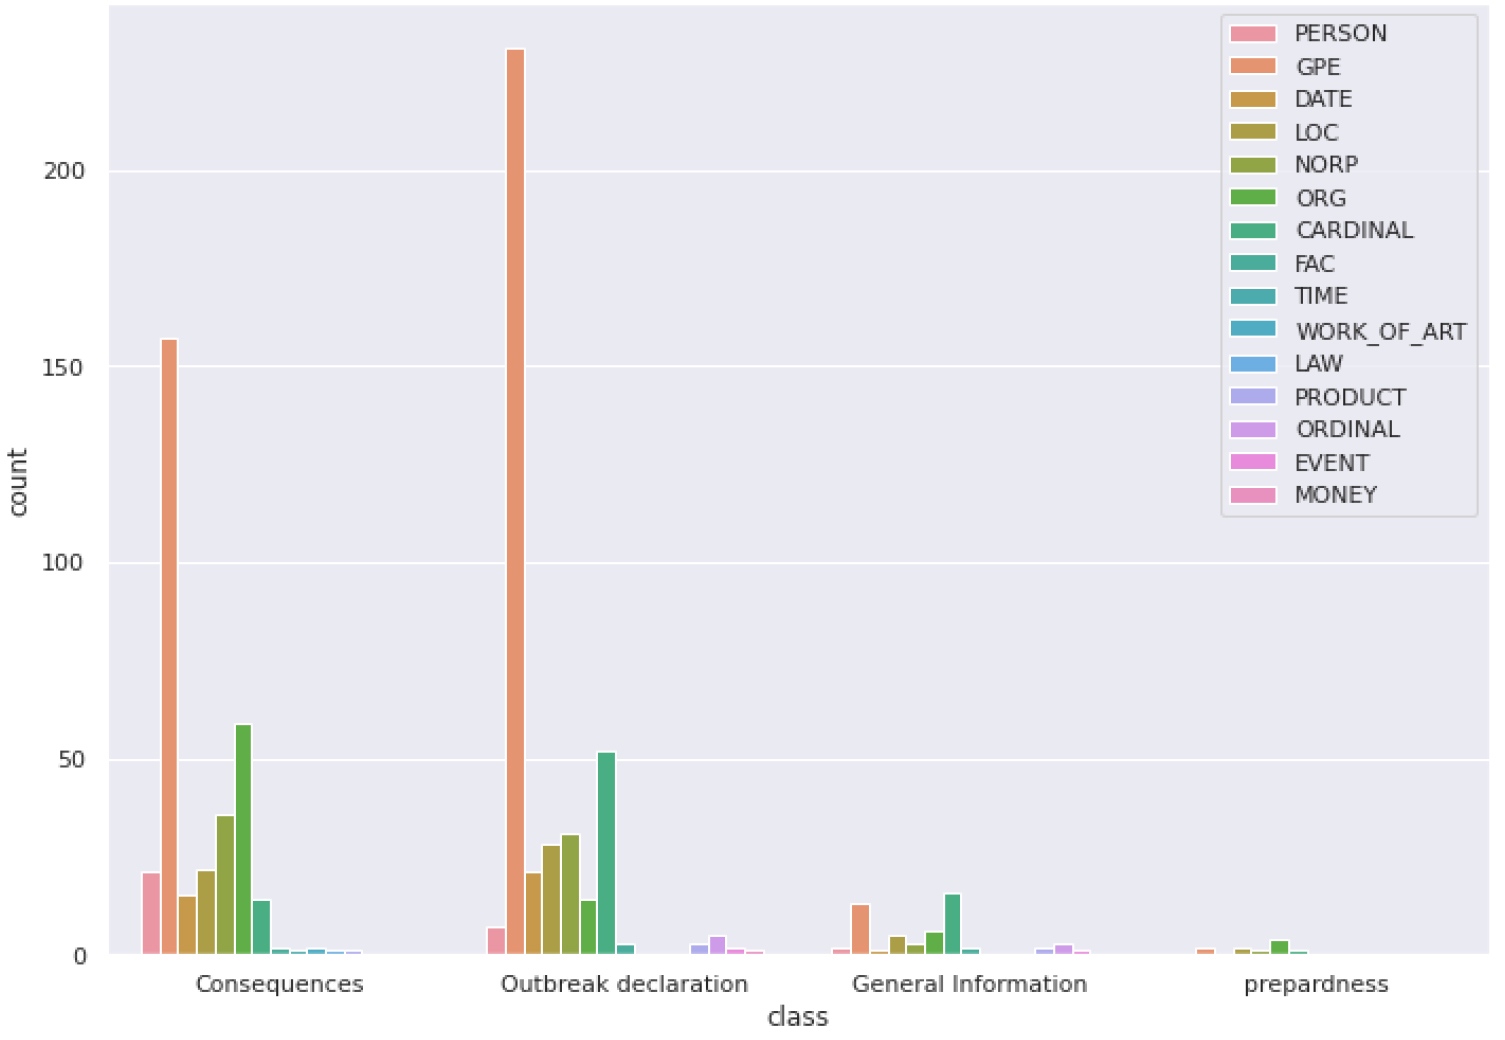
Figure 3.
Distribution of the most salient tokens in NER categories by crisis phase.
For each data point in the annotated corpus, we extract the three most salient words of each inference. Let
For each salient token, we apply name entity recognition (NER), a NLP task that classifies tokens into well-known predefined categories, such as a person names, organizations, locations or GeoPolitical entities (GPE), which are cities, states or countries. We use spaCy,77 which provides an easy-to-use LM implementation and is often used as a baseline for studies that aim to improve the NER task [34].
As illustrated by Fig. 3, the GPE tokens contribute the most to the RoBERTa fine-tuned classifiers local predictions (explained in details in the experiments in Section 4.2.1). These results confirm our hypothesis that the classifiers rely on spatial information to make their predictions. However, the importance given by models to spatial information can lead to misclassification. Indeed, when situations evolve over time, the type of information reported in the newspapers or social networks also evolves, leading to a change of document label related to a place over time. However, if the model learned to associate a type of information with a place, it will have difficulty generalizing future situations that will occur in this place. For this reason, in the next section, we attempt to take advantage of the spatial information saliency to propose several data augmentation strategies and to reduce this spatial overfitting.
3.2GeoNLPlify
Figure 4.
Number of spatial levels of geocoded GPE entities by crisis phase.
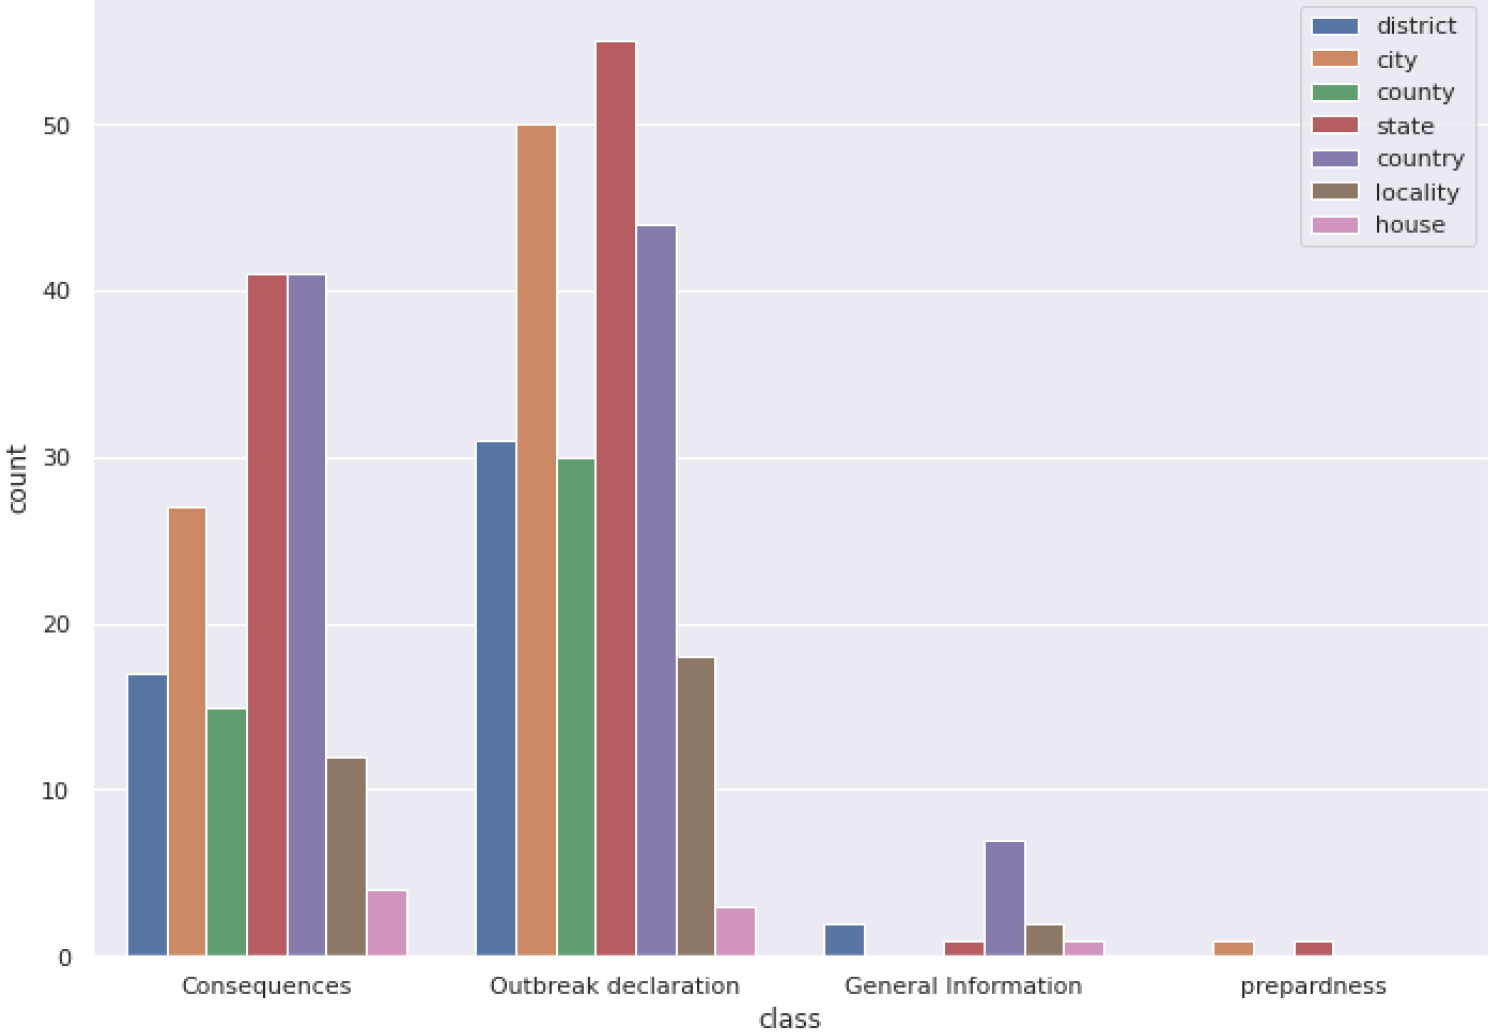
Figure 5.
GeoNLPlify: The 3 Spatial enhancements.
GeoNLPlify is a set of three data augmentation methods that make variations of original annotated data using spatial information to increase the training corpus size. Indeed, as highlighted in the previous section, fine-tuned BERT-like models tend to overfit on tokens carrying spatial information when working with crisis-related datasets. By artificially creating new documents by making variations on geographical entities, GeoNLPlify aims to expose the model to a lot of new different locations, which makes it better able to generalize when it encounters, in inference mode, new places or when spatial information is missing. Its attention to spatial entities decreases in favor of the other words in the document. At the same time, our empirical intuition is that the spatial level has an influence on the classification (by spatial level, we mean city, state or country level); people provide a better report of the local situation during a crisis by being at the right spatial level [35, 36]. For example, an outbreak declaration will focus on the city or state level where the case occurs, although the consequences will be reported at a country level, as illustrated by Fig. 4. This figure shows the spatial level distribution in the training dataset, by label, of GPE tokens that contribute the most to model predictions. To evaluate this assumption, we define three strategies.
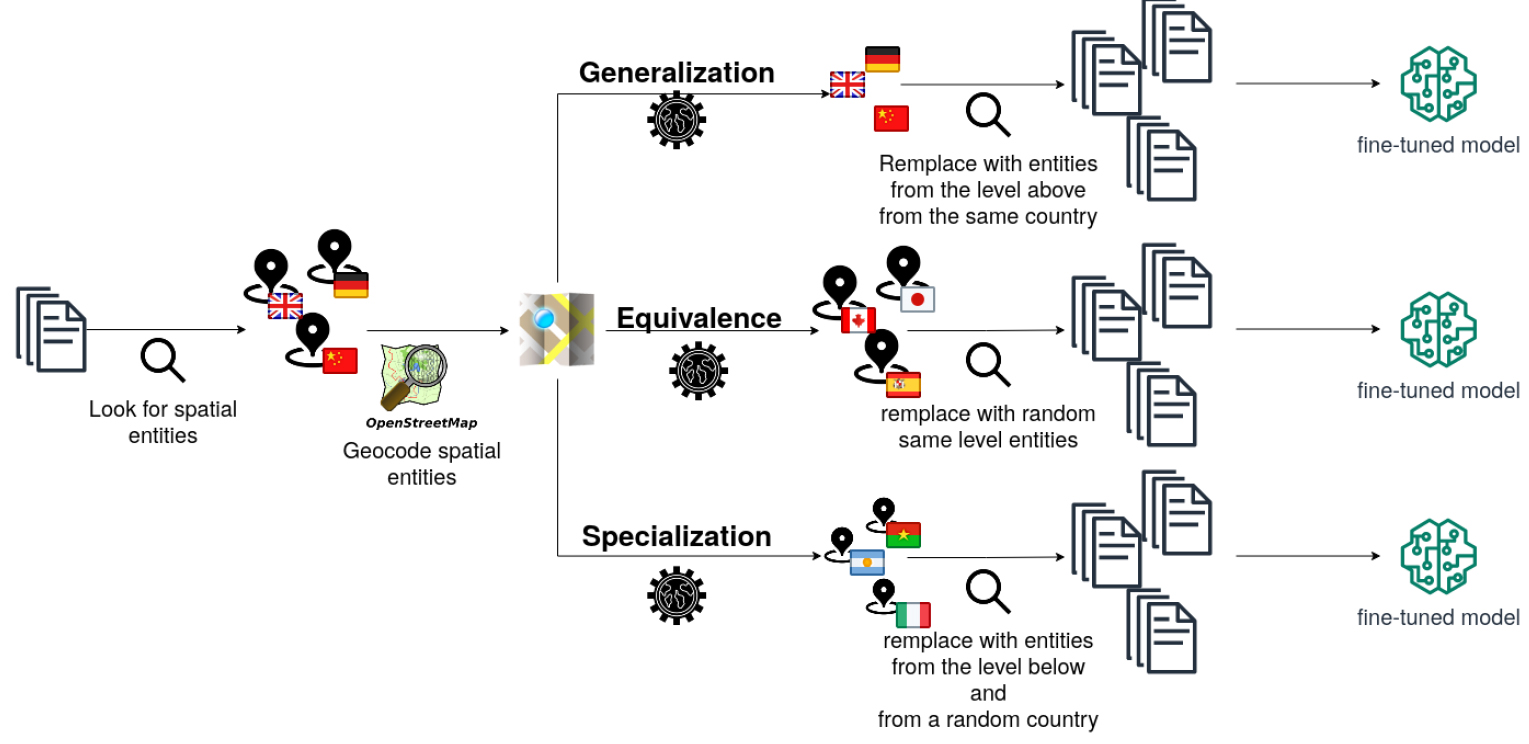
The three GeoNLPlify DA methods are illustrated in Fig. 5. The first one, Generalization, duplicates annotated documents that contain GPE tokens (at a city level) and replace them by their countries. For example, the title of this new article: “2 Cases of Powassan Virus Confirmed in New Jersey” will be duplicate to “2 Cases of Powassan Virus Confirmed in United-States. Equivalence, the second method, duplicates documents by making variations at the same level of GPE tokens. The variant is selected randomly among “world cities” from Simple Maps.88 For example, the document “2 Cases of Powassan Virus Confirmed in Philadelphia” is duplicated by “2 Cases of Powassan Virus Confirmed in Glasgow”. Finally, the last method, Specialization, duplicates documents that contain GPE at a country level by a randomly chosen city. We use, once again, the database “world cities”. For example, we duplicate the document “Kenya issues alert to foot and mouth disease outbreaks” by creating “Munich issues alert to foot and mouth disease outbreaks”. Munich is randomly selected from the list of cities.
4.Experiments
In this study, we aimed to highlight the spatial overfitting of BERT-like models on crisis-related corpora and to propose a new data augmentation to reduce this bias. To achieve this, we conducted a series of experiments using two crisis-related datasets and a third not dealing with this subject.
The experiments process involves saliency maps and different RoBERTa fine-tuning on several data augmentation methods in order to compare them on these datasets.
The results of our experiments show GeoNLPlify is successful in reducing spatial overfitting and allows fine-tuned models with the best F1-score.
4.1Dataset description
We present the three datasets used in our study: PADI-web, CrisisNLP and SST2.
4.1.1PADI-web
Figure 6.
PADI-web class distribution.
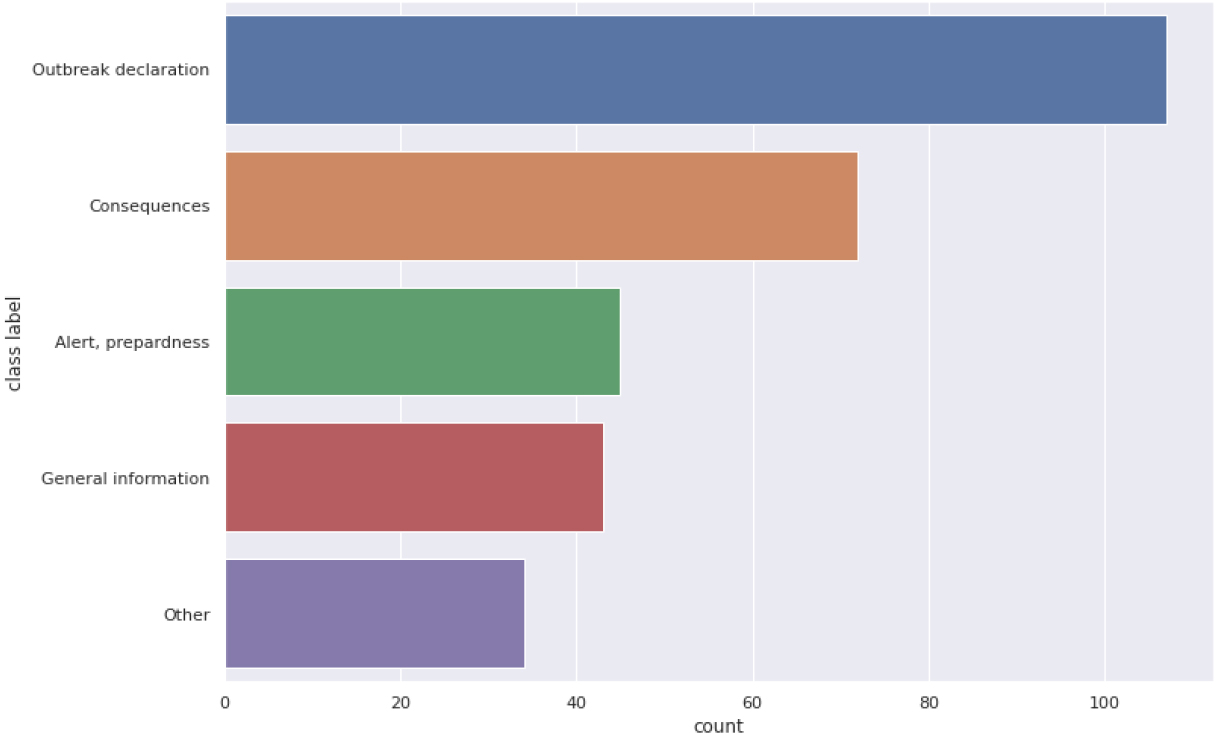
PADI-web is a manually annotated corpus of new articles. The dataset of 300 fully annotated articles addresses outbreak diseases in an animal health context. For each document, the annotation provides a category corresponding to a crisis stage (preparedness, outbreak detection, consequences and general information). The distribution of documents between these categories is illustrated in Fig. 6.
4.1.2CrisisNLP
Figure 7.
CrisisNLP class distribution.
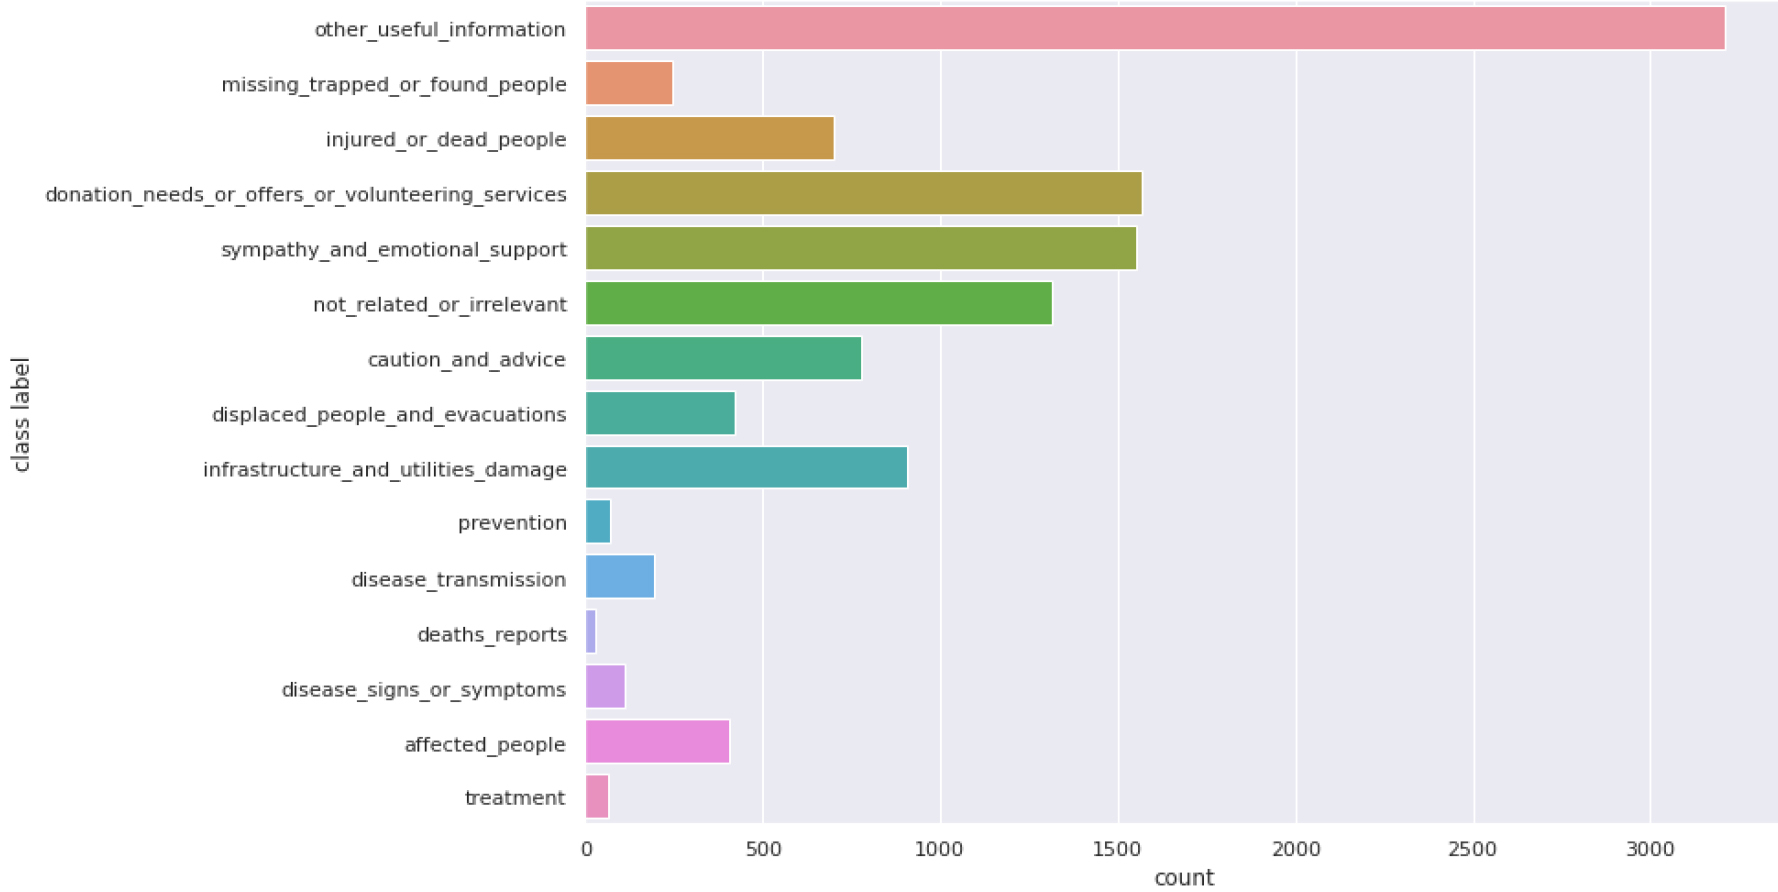
CrisisNLP is a human-annotated Twitter corpora of crisis-related messages [13] collected during 19 different crises between 2013 and 2015. Two kinds of annotation were performed: one by volunteers and the second by paid workers. For this benchmarking, we use both to obtain 11570 tweets with a label among 14 categories (Affected people, caution and advice, deaths reports, disease signs or symptoms, disease transmission, displaced people and evacuations, donation needs, offers or volunteering services, infrastructure and utilities damage, injured or dead people, missing trapped people of found people, not related or irrelevant, other useful information, prevention and sympathy and emotional support). The distribution is, once again, very unbalanced, as illustrated by Fig. 7. What interests us in using CrisisNLP is that it is a reference dataset in crisis management. Another aspect is although CrisisNLP is a dataset with acceptable dimensions for fine-tuning a model (i.e.,
4.1.3SST2
The Stanford Sentiment Treebank (SST) consists of sentences from movie reviews and human annotations of their sentiment (positive/negative). SST-2 is part of the general language understanding evaluation benchmark [14], which is a collection of resources for training, evaluating and analyzing natural language understanding systems.99 The training dataset contains more than 67K sentences. As this study focuses on tiny corpora, we artificially reduced the number of documents by random selection to 300 and 11000 to be closer to the PADI-web and CrisisNLP corpus sizes. In using SST, the objective is to analyze how GeoNLPlify performs on a dataset when the spatiality does not matter to better evaluate the generality of our method.
4.2Experimental process description
Two experiments have been conducted. The first one, the saliency map, aims at showing the overestimation of the role of spatial information granted by fine-tuned models on a non-augmented corpus related to crises. To set up this experimentation, a pre-trained RoBERTa has been fine-tuned on PADI-web data and LIME has been applied to each prediction of our model for the whole dataset. The second experiment aims to compare GeoNLPlify against classical NLP data augmentation on three public datasets. The technical aspects of both experiments are described in the two following sections.
4.2.1Saliency map
To gain insight into which type of tokens a pre-trained model (such as RoBERTa) relies on to classify documents, saliency maps are computed by the Python library LimeTextExplainer,1010 which implements LIME [10]. The three most salient tokens are extracted for each document and categorized using name entity recognition (NER) with spaCy, as shown in Fig. 3. As described in Section 3, fine-tuned model on non-augmented corpus relies on its prediction on GeoPolitical Entities (GPE) tokens. This means that the model considers certain locations as class markers. For example, if in the training dataset, an outbreak event occurs in Indonesia, then the model may classify new documents with Indonesia as a new outbreak. However, the article may well report on the end of a crisis or general information. We interpret this as overfitting that we aim to reduce using GeoNLPlify as a data augmentation method.
4.2.2GeoNLPlify evaluation process
The evaluation framework is divided into three steps. The first one is applying the multiple DAs (three GeoNLPlify and two nlpaug). The second one deals with the training strategy. Finally, the last step is the evaluation protocol.
Applying data augmentation
From the original datasets, five augmented datasets are processed. The three first come from GeoNLPLify and the two last from nlpaug.
GeoNLPlify data augmentation relies on a three-step pipeline: NER, geocoding and spatial variation. First introduced in 1996 [37], NER aims to provide a category to tokens, such as organization, person or location. Since then, multiple methodologies have been used [38]. To simplify the implementation, our pipeline uses a spaCy algorithm.1111 The second step focuses on tokens identified by NER as geographical entities (GPEs). Using OpenStreetMap (OSM)1212 data through the photon geocoder,1313 the pipeline retrieves a token’s spatial information, such as its spatial level (i.e., city/county/state/country). To reduce the number of queries for the geocoder, the results are stored in a cache.1414
Depending on the spatial data augmentation methods, the third step uses spatial-level information to create variation. The generalization approach replaces the GPE cities by their country, while the specialization retrieves a randomly selected city for each GPE country, and finally, the spatial equivalence replaces the GPE cities. The two last methods use the Simple Maps database.1515 We provide a Python library to easily re-use GeoNLPlify. The repository is available at https://github.com/remydecoupes/GeoNLPlify.
To compare the GeoNLPlify data augmentation to classical NLP data augmentation approaches, the nlpaug python library [15] is used. This library provides several augmentations at different levels (i.e., character, word and sentence) through multiple approaches (contextual embedding, synonym, back translation, random variation, etc.). Two augmentations have been used for the comparison, both at the world level (such as GeoNLPlify): (i) nlpaug_synonym: based on synonyms (using WordNet [16]) and (ii) nlpaug_contextual_embedding based on contextual word embedding (using the BERT model [18]). Multiple studies used DA at the word level [25, 17, 26]. It first randomly selects tokens from the document and then replaces the drawn tokens with one of its variant candidates proposed by WordNet or BERT (also randomly selected). The default parameters are used, i.e., up to 30% of words are changed in documents.
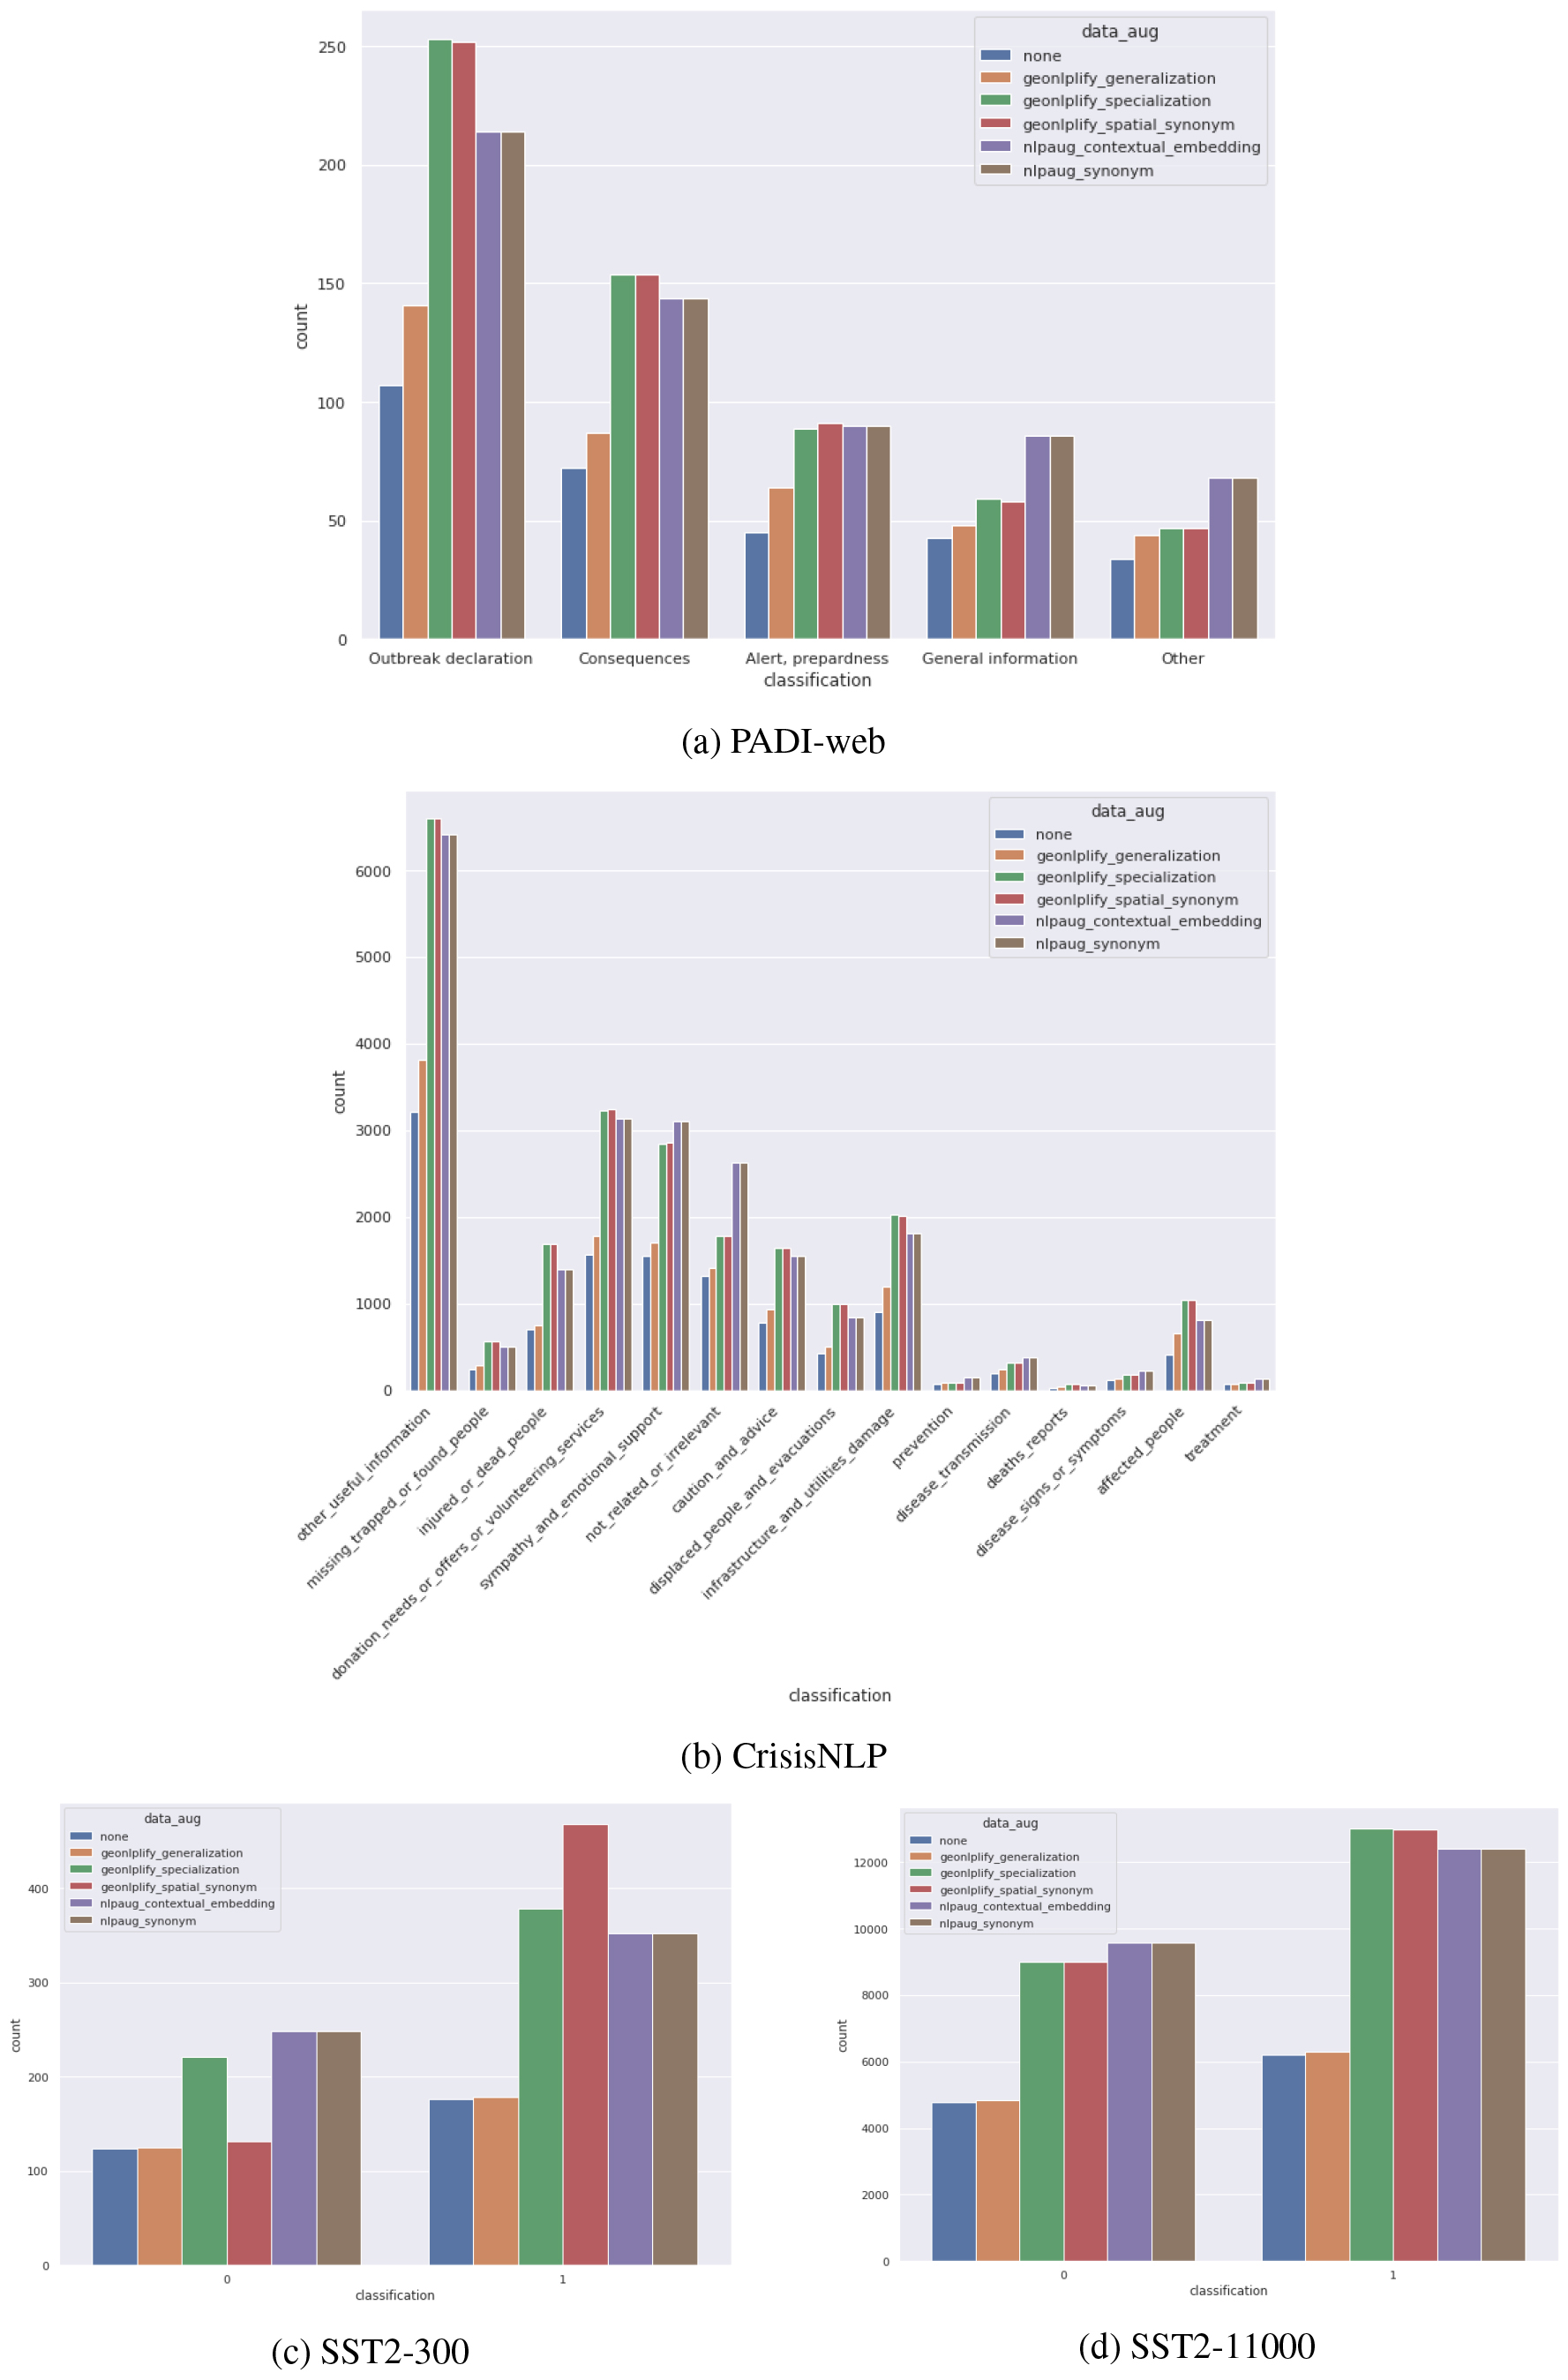
As shown in Fig. 8, the different classes of the three datasets are not equally augmented. Indeed, while nlpaug can generate variation in any sentence, GeoNLPlify only amplifies documents that contain spatial information. For example for the PADI-web, the classes “General Information” and “Other” appear to be disadvantaged. As spatial information is scarce in SST2, the GeoNLPlify variations are made on a small group of documents. For example, the sentence it seems a disappointingly thin slice of lower-class london life has been used to create seven geonlplify_spatial_equivalence such as it seems a disappointingly thin slice of lower-class Tappan life.
Figure 8.
Data augmented distribution.
Training strategy
Both GeoNLPlify & nlpaug augmentations and the original datasets use the same training pipeline. A cross-validation process is used with ten folds. The folds preserve the class imbalance. RoBERTa is then fine-tuned with 3 epochs on a server with a V100 NVIDIA and 315 GB RAM using the HuggingFace python library.1616 To make the results reproducible, all random seeds (shuffling data and the last fine-tuning layers initiating weights) are fixed [39].
Evaluation protocol
The evaluation metrics are computed on the 10-fold evaluation datasets without any augmentation (they are all removed to keep only original documents). The means of the evaluation metrics (F1-score, recall and precision) on k-folds are calculated (with their standard deviation) for each data augmentation method to be compared in the next section.
We propose to compare the three GeoNPLify data augmentations with two other NLP data augmentation methods: nlpaug_synonym (by replacing words with Wordnet [25]) and nlpaug_contextual_embedding (by self-masking words and replacing them by inferring using an LM [17]).
In addition, we add 4 combinations of the previous methods to further improve the scores. Among all the possible combinations, we propose the following: (i) combined_nlpaug: which applies nlpaug_synonym and nlpaug_contextual_embedding, (ii) combined_geonlplify_s_eq: for GeoNLPlify_specialization, (iii) combined_geonlplify_all: for all the three GeoNLPlify methods and GeoNLPlify_equivalence (which obtained the best results) and finally (iv) combined_geonlplify_nlpaug: for GeoNLPlify_specialization & GeoNLPlify_equivalence and nlpaug_synonym & nlpaug_contextual_embedding.
The benchmarking is performed on three different datasets. The first two are related to crises (PADI-web [12] and CrisisNLP [13]). The third one is dedicated to sentiment analysis applied to movie critics (SST2), and it is part of the general language understanding evaluation (GLUE) [14]. SST2 was created to evaluate the text classification models. Since SST2 has very little spatial information, it is interesting to observe how GeoNLPify behaves with corpora for which spatiality matters very little.
4.3Results
4.3.1PADI-web
The five data augmentation methods alone and the four combinations are applied to the PADI-web dataset. The F1-score of each class is shown in Table 1. Concerning the benchmark of the DAs alone, the first observation is that all augmentation techniques achieve better results than without augmentation (called “None” in the figure). Second, two GeoNPLlify methods, “spatial equivalence” and “Specialization” obtain better results comparing the nlpaug “Synonym” except for the class “General Information”. The fact that this class has little geographic information does not completely explain the poorer results that GeoNLPlify receives since we do not observe a decrease in results for the “Other” class.
The best combination is “combined_geonlplify_nlpaug” which obtains also the best results for all the classes.
Table 1
Comparing the average F1-score for each class using the data augmentation strategy on a k-fold
| Prepardness | Outbreak declaration | Consequences | General information | Other | Weighted avg | |
|---|---|---|---|---|---|---|
| None | 0.29 | 0.81 | 0.54 | 0.54 | 0.5 | 0.6 |
| Nlpaug_synonym | 0.55 | 0.87 | 0.69 | 0.64 | 0.66 | 0.73 |
| Nlpaug_contextual_embedding | 0.56 | 0.87 | 0.69 | 0.71 | 0.72 | 0.75 |
| Geonlplify_specialization | 0.77 | 0.94 | 0.82 | 0.65 | 0.65 | 0.82 |
| Geonlplify_equivalence | 0.8 | 0.94 | 0.8 | 0.61 | 0.69 | 0.82 |
| Geonlplify_generalization | 0.52 | 0.85 | 0.63 | 0.59 | 0.76 | 0.71 |
| Combined_nlpaug | 0.69 | 0.9 | 0.8 | 0.68 | 0.65 | 0.8 |
| Combined_geonlplify_s_eq | 0.48 | 0.87 | 0.69 | 0.61 | 0.68 | 0.72 |
| Combined_geonlplify_nlpaug | 0.88 | 0.94 | 0.91 | 0.85 | 0.82 | 0.91 |
| Combined_geonlplify_all | 0.48 | 0.87 | 0.69 | 0.61 | 0.68 | 0.72 |
4.3.2CrisisNLP
The same five data augmentation methods and the four combinations are applied on CrisisNLP. As
Table 2
Comparing the average F1-score for each class using the data augmentation strategy on a k-fold
| Accuracy | Affected_ people | Caution_ and_ advice | Deaths_ reports | Disease_ signs_or_ symptoms | Disease_ transmission | Displaced_ people_ and_ evacuations | Donation_ needs_or_ offers_or_ volunteering_ services | Infrastructure_ and_utilities_ damage | Injured_ or_ dead_ people | Macro avg | Missing_ trapped_ or_ found_ people | _related_ or_ irrelevant | Other_ useful_ information | Prevention | Sympathy_ and_ emotional_ support | Treatment | Weighted avg | |
| None | 0.75 | 0.84 | 0.58 | 0.66 | 0.64 | 0.73 | 0.77 | 0.82 | 0.75 | 0.89 | 0.74 | 0.65 | 0.74 | 0.7 | 0.65 | 0.84 | 0.84 | 0.75 |
| Nlpaug_synonym | 0.82 | 0.86 | 0.68 | 0.78 | 0.69 | 0.78 | 0.81 | 0.87 | 0.8 | 0.93 | 0.8 | 0.77 | 0.84 | 0.77 | 0.73 | 0.89 | 0.82 | 0.82 |
| Nlpaug_contextual_embedding | 0.77 | 0.85 | 0.61 | 0.78 | 0.69 | 0.76 | 0.78 | 0.83 | 0.76 | 0.91 | 0.77 | 0.7 | 0.78 | 0.71 | 0.66 | 0.86 | 0.85 | 0.77 |
| Geonlplify_specialization | 0.86 | 0.92 | 0.79 | 0.81 | 0.71 | 0.83 | 0.89 | 0.91 | 0.87 | 0.95 | 0.85 | 0.84 | 0.81 | 0.84 | 0.75 | 0.9 | 0.86 | 0.86 |
| Geonlplify_equivalence | 0.85 | 0.92 | 0.79 | 0.81 | 0.72 | 0.81 | 0.89 | 0.9 | 0.86 | 0.94 | 0.84 | 0.83 | 0.82 | 0.82 | 0.69 | 0.89 | 0.85 | 0.85 |
| Geonlplify_generalization | 0.78 | 0.87 | 0.63 | 0.81 | 0.71 | 0.78 | 0.78 | 0.83 | 0.78 | 0.91 | 0.78 | 0.7 | 0.76 | 0.72 | 0.73 | 0.85 | 0.85 | 0.78 |
| Combined_nlpaug | 0.84 | 0.87 | 0.69 | 0.86 | 0.73 | 0.8 | 0.85 | 0.89 | 0.81 | 0.94 | 0.83 | 0.8 | 0.86 | 0.79 | 0.75 | 0.9 | 0.84 | 0.84 |
| Combined_geonlplify_s_eq | 0.83 | 0.85 | 0.73 | 0.82 | 0.65 | 0.8 | 0.87 | 0.88 | 0.83 | 0.93 | 0.81 | 0.79 | 0.79 | 0.79 | 0.69 | 0.87 | 0.82 | 0.82 |
| Combined_geonlplify_nlpaug | 0.89 | 0.88 | 0.81 | 0.88 | 0.73 | 0.83 | 0.92 | 0.93 | 0.87 | 0.96 | 0.87 | 0.89 | 0.88 | 0.86 | 0.81 | 0.93 | 0.81 | 0.89 |
| Combined_geonlplify_all | 0.83 | 0.85 | 0.73 | 0.82 | 0.65 | 0.8 | 0.87 | 0.88 | 0.83 | 0.93 | 0.81 | 0.79 | 0.79 | 0.79 | 0.69 | 0.87 | 0.82 | 0.82 |
illustrated by Table 2, GeoNLPlify, especially in terms of spatial equivalence and specialization, has better performance. For only one class, “not related or irrelevant”, the NLP classical synonym (Wordnet) competes with GeoNLPlify.
Once again, the best combination is “combined_geonlplify_nlpaug” which outperforms all methods except for two classes (“affected people” & “treatment”) where GeoNLPlify_specialization is better.
4.3.3SST2
Table 3
Comparing the average F1-score for each class using the data augmentation strategy on a k-fold
| Accuracy | Macro avg | Negative | Positive | Weighted avg | |
|---|---|---|---|---|---|
| None | 0.83 | 0.81 | 0.76 | 0.87 | 0.82 |
| Nlpaug_synonym | 0.94 | 0.94 | 0.93 | 0.95 | 0.94 |
| Nlpaug_contextual_embedding | 0.86 | 0.84 | 0.78 | 0.89 | 0.85 |
| Geonlplify_specialization | 0.91 | 0.91 | 0.88 | 0.93 | 0.91 |
| Geonlplify_spatial_synonym | 0.86 | 0.85 | 0.82 | 0.88 | 0.86 |
| Geonlplify_generalization | 0.89 | 0.89 | 0.87 | 0.91 | 0.89 |
| Combined_nlpaug | 0.95 | 0.92 | 0.87 | 0.96 | 0.93 |
| Combined_geonlplify_s_eq | 0.86 | 0.86 | 0.82 | 0.89 | 0.86 |
| Combined_geonlplify_nlpaug | 0.97 | 0.96 | 0.96 | 0.97 | 0.97 |
| Combined_geonlplify_all | 0.86 | 0.86 | 0.82 | 0.89 | 0.86 |
Table 4
Comparing the average F1-score for each class using the data augmentation strategy on a k-fold
| Accuracy | Macro avg | Negative | Positive | Weighted avg | |
|---|---|---|---|---|---|
| None | 0.85 | 0.83 | 0.78 | 0.88 | 0.83 |
| Nlpaug_synonym | 0.78 | 0.72 | 0.59 | 0.84 | 0.73 |
| Nlpaug_contextual_embedding | 0.72 | 0.63 | 0.47 | 0.8 | 0.66 |
| Geonlplify_specialization | 0.91 | 0.91 | 0.9 | 0.92 | 0.91 |
| Geonlplify_equivalence | 0.9 | 0.89 | 0.88 | 0.91 | 0.9 |
| Geonlplify_generalization | 0.83 | 0.79 | 0.71 | 0.87 | 0.8 |
| Combined_nlpaug | 0.73 | 0.63 | 0.44 | 0.81 | 0.65 |
| Combined_geonlplify_s_eq | 0.88 | 0.88 | 0.87 | 0.89 | 0.88 |
| Combined_geonlplify_nlpaug | 0.74 | 0.66 | 0.5 | 0.82 | 0.68 |
| Combined_geonlplify_all | 0.88 | 0.88 | 0.87 | 0.89 | 0.88 |
The results are shown in Tables 3 and 4. The first observation is that no augmentation method truly stands out from the original dataset (e.g., without augmentation). The second observation is that the size of the dataset (300 reviews or 11000 reviews) greatly influences the results and their stability. Indeed, for the dataset truncated at 300 reviews, “nlpaug_synonym” is the best, while “geonlplify_specialization” comes first on the 11000 reviews dataset. The third observation is that GeoNLPlify still performs better than it would without augmentation for all the sizes, whereas nlpaug performance is completely degraded on the 11000 documents corpus (especially for the negative class). This may be because some reviews are very small. Often, these reviews do not contain spatial information, so GeoNLPlify is unable to create variations from them. The nlpaug, however, offers variations that completely degrade the meaning of the review. For example, the review “deep deceptions” gives the nlpaug_contextual_embedding variation “political deceptions” and the nlpaug_synonym “deep illusion”, which are far from the original meaning and cannot be easily inferred by the text classifiers for this particular task: does the review say that the film is good?
5.Discussion
The results of our study suggest that GeoNLPlify is an effective method for data augmentation in text classification tasks, but does not provide information explaining why it achieves good results compared to baselines and if it induces new bias when a class is correlated to geopolitical entities. That is why, in this discussion, we explore both the interpretation of GeoNLPlify’s effectiveness, potential sources of bias and avenues for future research.
5.1Interpretation of GeoNLPlify effectiveness
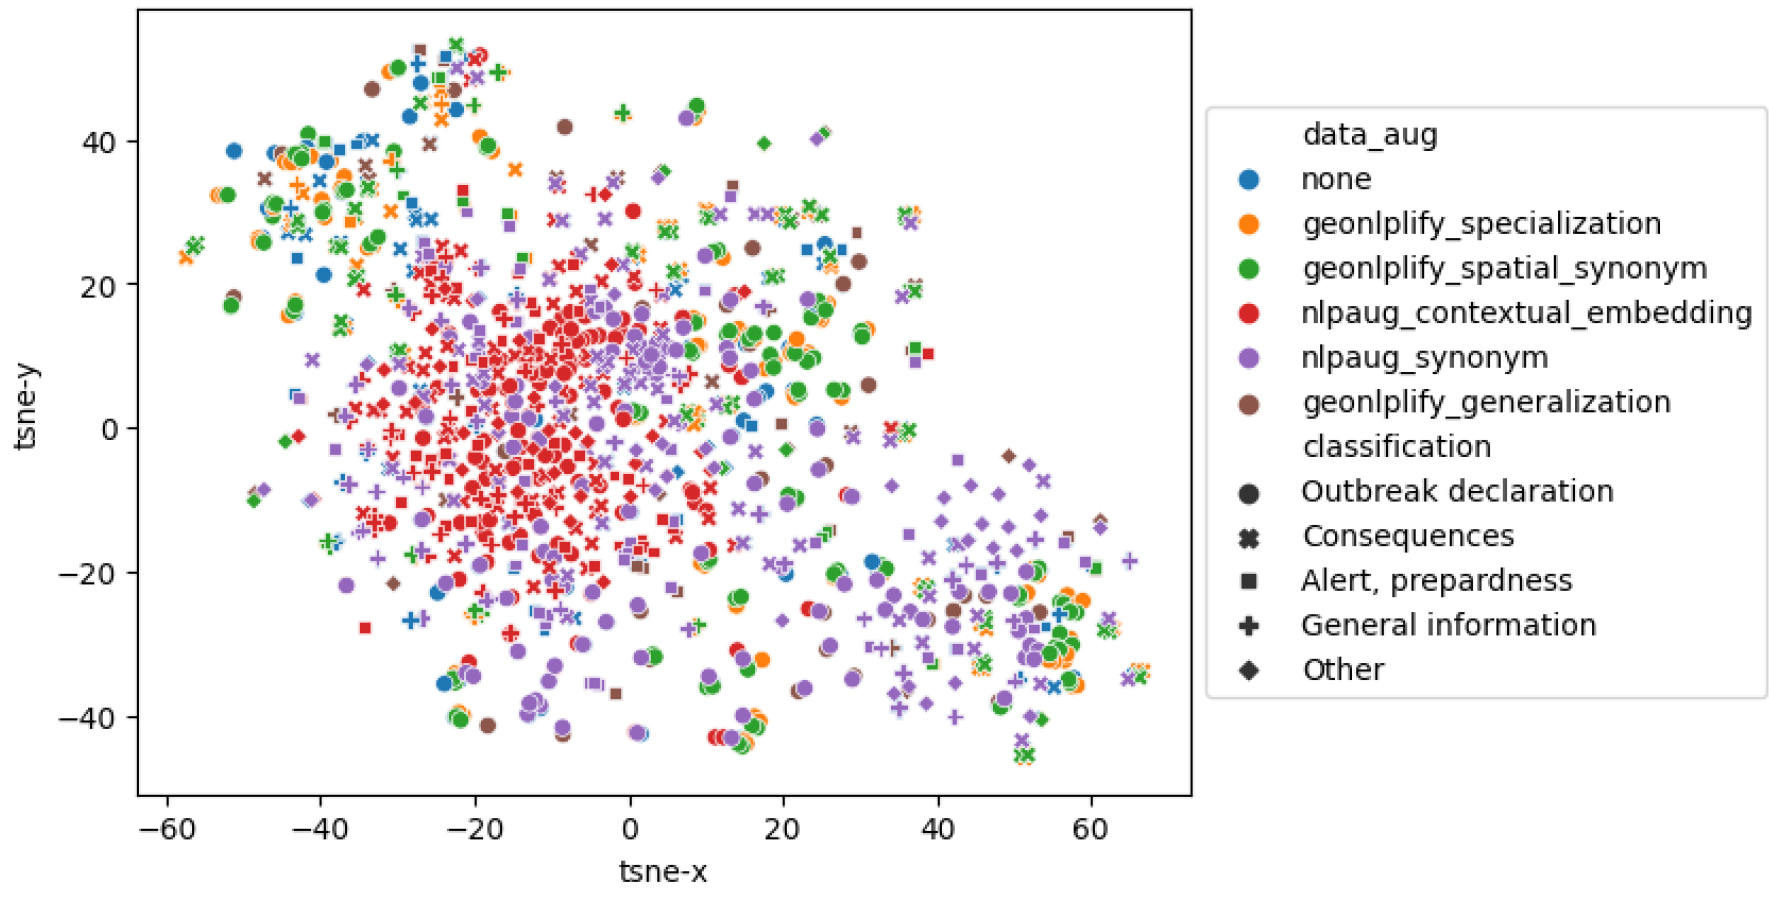
As shown in the experiments Section 4, GeoNLPlify substantially improves a fine-tuned LM on text classification even on datasets for which the spatial information matters less, such as sentiment analysis on movie reviews (SST-2). However, GeoNLPlify is similar to other data augmentation approaches, i.e., duplicating documents by making changes at the word level. How then, can we explain the better results achieved by GeoNLPlify compared to the classical techniques? Longpre et al. [9], by an empirical study, stated that DA techniques help only when they provide linguistic patterns that are not seen during pretraining. Linguistic patterns are a set of grammar, syntax rules and semantics. According to [40], the BERT-like models store their syntax knowledge in their token representations (embedding) and not on their attention heads. Indeed, even if attention layers capture some basic syntax links between tokens (such as subject and verb), most of the syntax and semantic information are contained in the token embedding [40].
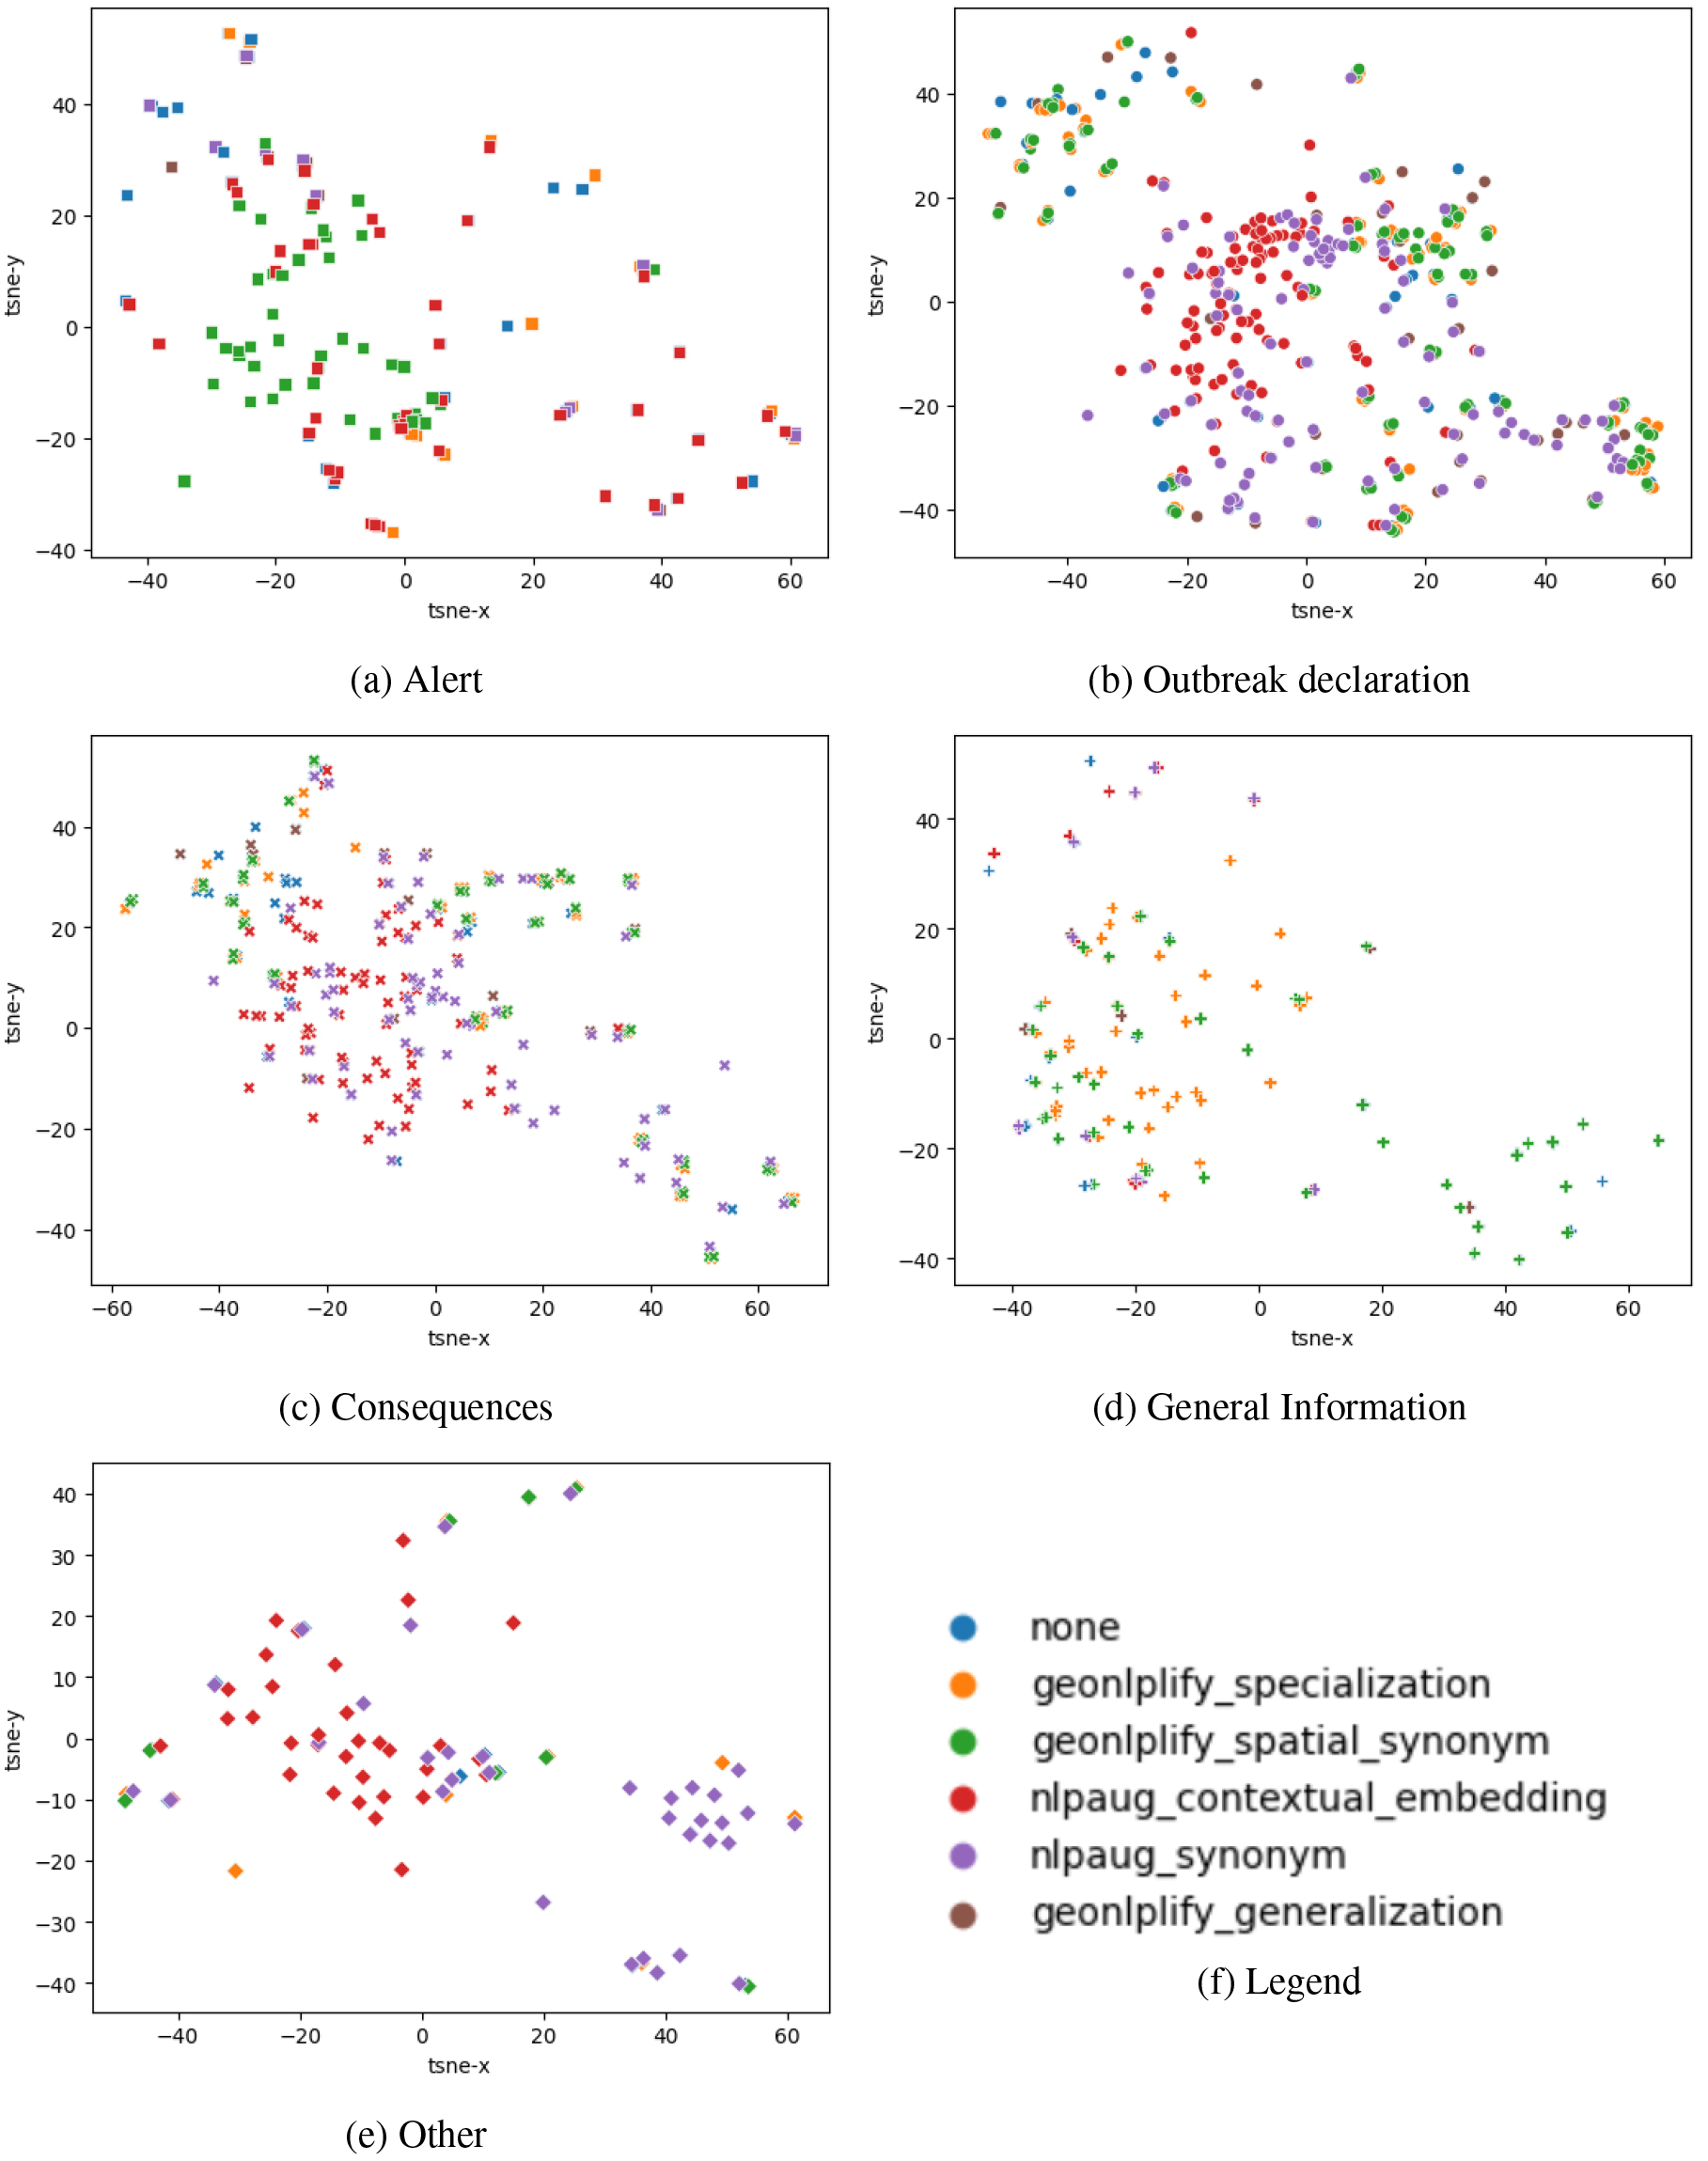
To better understand what GeoNLPlify brings to the model in terms of syntax and semantic representation, we propose to analyze documents embedded representations for each DA corpus. Thus, for each document, its embeddings are retrieved in the form of a 768-dimensional vector. To visualize the document representations in a scatter plot vectors dimensions are reduced to two dimensions (using T-SNE). Figure 9 shows the distribution of DA documents for each class in this space for PADI-web data (for more details see Appendix A). In this figure, the proximity of the dots indicates the degree of similarity between the corresponding documents as measured by the model. The closer the dots are, the more similar the documents are. We can observe that the GeoNLPlify and nlpaug_synonym have documents with representations that are the most distant. Since it can be difficult to visually analyze the extent brought by each DA in the figure, we propose to compute and compare the area of the smallest polygon containing all the 2D points for each DA. The sizes of these polygons enable to estimate and compare the semantic extent in order to quantify the linguistic patterns brought by each DA. Table 5 shows these results and we can see that the GeoNLPlify methods increase the semantic extent of the training dataset significantly. GeoNPLify artificially creates labeled data very similar to the original data for a human but not for an LM. For example, the cosine similarity (which is the common measure of the distance between two vectors) between the embedding of two countries, such as New Zealand and France is only 17% (for Germany and France it is 60%). France and New Zealand seem to have very different representations, yet semantically, they are close; they both indicate a country. Therefore, if “France” is replaced by “New Zealand” in a document, the meaning of the sentence does not change, especially for a text classification task, but it will introduce new linguistic patterns to the model.
Table 5
Extent of minimum bounding polygon for data augmentation sentence embeddings on PADI-web data. The first row shows the semantic extent for each original dataset augmented by a DA. The second row indicates the increase in the surface area provided by the data augmentations
| None | Geonlplify generalization | Geonlplify specialization | Geonlplify spatial equivalence | Nlpaug contextual embedding | Nlpaug synonym | |
|---|---|---|---|---|---|---|
| Area of MBP | 8641 | 8641 | 8774 | 8721 | 8644 | 8642 |
| Increase over none | 0 |
The contribution of these new linguistic patterns is not sufficient to explain the significant GeoNLPlify results observed on the corpora related to crises. Indeed, it is also important to note that the variation of words carrying geographical information leads to a decrease in overfitting. To highlight this, let us observe the evaluation loss during the multiple DA training on PADI-web data. The mean and standard deviation (STD) of evaluation loss during the training (over the 10-folds training), shown in Table 6, reveals fine-tuned models without DA overfits more than with DA. GeoNLPlify specialization and spatial_equivalence obtain the smallest evaluation loss. By exposing the models to new and multiple combinations of label and location during the training, GeoNLPlify helps models to better generalize when they encounter new combinations during the evaluation. Indeed, the overfitting reduced by GeoNLPlify seems to come from a too strong association between a place and the types of events that happened there in the training.
Table 6
Mean and STD of eval loss during training over the 10-folds on PADI-web data. The smaller the average evaluation loss, the less the learning process has led to overfitting. The standard deviation indicates whether the evaluation loss was consistent across folds (when its STD is low)
| None | Geonlplify generalization | Geonlplify specialization | Geonlplify spatial equivalence | Nlpaug contextual embedding | Nlpaug synonym | |
|---|---|---|---|---|---|---|
| Mean eval loss | 0.95 | 0.72 | 0.42 | 0.44 | 0.83 | 0.53 |
| STD eval loss | 0.2 | 0.14 | 0.19 | 0.18 | 0.14 | 0.14 |
Figure 9.
Sentence embedding representation of DA techniques on PADI-web data for all classes.
Finally, and contrary to our empirical intuition, the level of the spatial hierarchy does not matter. Indeed, in Section 3, we had shown that spatial levels were associated with certain labels as illustrated by Fig. 4 in the training non-augmented dataset. For example, newspapers reporting on a flood will use city-level locations, while those talking about the consequences of a crisis will report at the country level. Indeed, GeoNLPlify specialization obtains sometimes better results than spatial equivalence. This indicates that changing the spatial hierarchy level (from country to a random city) also reduces the spatial overfitting bias as shown in Table 6. This leads us to believe that BERT-like models make little or no use of the level of the spatial hierarchy. The spatial variations with the greatest impact are therefore not to conserve the spatial scale (replace a city with another city for example), but the change by a very distant location. Thus, the semantics carried by this new location (and thus its vector representation) brings new linguistic patterns.
5.2Potential source of bias
One of the potential risks of using data augmentation is the introduction of new biases into the data. This is particularly true for textual data, where the use of natural language can introduce subtle biases that are difficult to detect. The risk that we identify when using GeoNLPlify is that real links between labels and geographical entities may be unlearned by the models.
To estimate this, we propose to analyze the texts for which the models trained with GeoNPlify make a classification error while the models trained without augmentation do not. The Table 7 shows the results for PADI-web data of the first fold for each GeoNPLify augmentation and combination. Thus for each augmentation, we apply two models (augmentation and without augmentation) on 10% of the PADI-web dataset, i.e., approximately 30 data points. Furthermore, we add a column, GPE, indicating whether a geographical entity is contained in the text. On this fold of 30 data points, GeoNLPlify_generalization misclassified seven points, GeoNLPlify_specialization two points, and GeoNLPlify_equivalence only one. The classification errors of the combinations appear to be inherited from the simple augmentations. Out of the 16 errors, only less than half (seven) contain a geographical entity. Based on this observation, we can estimate that GeoNLPlify does not create a systematic bias and does not break the real links between labels and locations.
5.3Future directions
The approach proposed in this paper, which led to the development of GeoNLPlify, can be further expanded in two ways. Firstly, by continuing the exploration of variations in the geographical dimension. Secondly, by investigating other dimensions of textual corpora, such as temporality or thematic aspects.
5.3.1Enhance GeoNLPlify with complex geographical relationships
In addition to the inclusion, generalization, and equivalence relations used by GeoNLPlify, other geographical relationships can be explored. Specifically, variations can be created based on adjacency and varying distances of spatial entities. These relationships could complement the spatial equivalence method proposed by GeoNLPlify. Through experimentation, we could assess the significance of the distance between spatial entity variations in generating new linguistic patterns, while also avoiding the reinforcement of the bias mentioned in the previous paragraph.
Furthermore, GeoNLPlify could also consider the co-occurrence of spatial entities and their relationships. Presented in [36], spatial textual representations (STRs) are spatial representation graphs of spatial entity co-occurrences found in texts. This formalization in the form of STR enables the comparison of different documents based on their respective list of spatial entities. GeoNLPlify could leverage these findings to further enhance its capabilities by generating STR. Experimentation could be conducted by comparing models trained using data augmentations based on coherent and incoherent variations of co-occurrences via the STR approach. Coherence would involve preserving the type of spatial relationship between the co-occurrences, i.e., preserving the original relationships such as inclusion, generalization, or distance between spatial entities. This would enable evaluating whether BERT-type models take into account these types of spatial relationships.
Table 7
List of texts misclassified by GeoNLPlify but correctly classified without augmentation. The columns name Label, DA_prediction, without_DA_prediction stand respectively for ground truth label, label predicted by a model trained with DA and labeled predicted by a model without DA. The column da shows the DA used and column GPE indicates if there is a GPE contained in the text. Rows in red indicate, also, the presence of GPE in the original text
| Text | Label | DA_prediction | Without_DA_ prediction | Da | GPE |
|---|---|---|---|---|---|
| Vietnam takes urgent measures after ASF outbreak | Outbreak | Alert | Outbreak | generalization | True |
| Unusual egg glut | Consequences | Outbreak | Consequences | generalization | False |
| Pork Volatility: The New Norm? | Consequences | General Information | Consequences | generalization | False |
| National Symposium on Prevention and control of African swine fever launched in Harbin | Swine fever _ Sina Finance _ Sina | Alert | General Information | Alert | generalization | True |
| Weather conditions favorable to tick population | Alert | General Information | Alert | generalization | False |
| WHO tests preparedness for disease outbreak | General Information | Alert | General Information | generalization | False |
| China successfully separates the first African swine fever virus strain-Xinhua | General Information | Outbreak | General Information | generalization | True |
| Pork Producers Applaud USDA Enhanced Efforts on African Swine Fever Prevention | Alert | Consequences | Alert | specialization | False |
| Global avian flu situation eases | General Information | Consequences | General Information | specialization | False |
| Global Bird Flu Treatment Market Growth | General Information | Other | General Information | spatial_synonym | False |
| Pig infected with African swine fever ‘unlikely to have contracted virus before it entered Hong Kong’ says mainland Chinese agency | Outbreak | Alert | Outbreak | generalization:specialization:spatial_synonym | True |
| African swine fever epidemic benefits Finnish meat industry | Consequences | Outbreak | Consequences | genralization:specialization:spatial_synonym | True |
| Global avian flu situation eases | General Information | Consequences | General Information | genralization:specialization:spatial_synonym | False |
| Pig infected with African swine fever ‘unlikely to have contracted virus before it entered Hong Kong’ says mainland Chinese agency | Outbreak | Alert | Outbreak | specialization:spatial_synonym | True |
| African swine fever epidemic benefits Finnish meat industry | Consequences | Outbreak | Consequences | specialization:spatial_synonym | True |
| Global avian flu situation eases | General Information | Consequences | General Information | specialization:spatial_synonym | False |
5.3.2Exploring other dimensions
For crisis-related corpora such as PADI-web or CrisisNLP, spatial information is ubiquitous and can lead to overfitting between class and spatial entities. It is conceivable that this type of overfitting may occur in other dimensions of information as well. For instance, the temporal dimension could also be explored. As demonstrated in this study by using model explicability methods like LIME [10] or SHAP [32], the models might unfortunately learn to classify certain documents based on the temporal entities found in the text. For example, in the context of crisis management, if the training dataset contains a large number of documents about floods that occurred in 2018, would the classification model tend to classify all new documents containing “2018” as flood events? If so, data augmentation by varying this dimension could mitigate this overfitting bias and facilitate domain transfer, such as training a model on a flood corpus to use it on a wildfire event for example.
Variations on other types of entities could be considered, provided that they lead to overfitting between a class and a type of entity. However, the risk of introducing new biases appears to be more significant than with spatial and temporal dimensions, as their variations minimally alter the semantic meaning of the text. For instance, replacing organization or personal names could potentially alter the sentence’s intended meaning.
6.Conclusion
In conclusion, this paper presents a significant contribution to the field of text classification by demonstrating the potential of exploiting spatial information to improve text classification performance on crisis-related data. Our study demonstrates the issue of BERT-like models overfitting on words carrying spatial information, and offers a solution, GeoNLPlify, a set of data augmentation methods that reduces significantly the bias of spatial overfitting. Our experiments show that all NLP data augmentation used in this paper reduce overfitting but GeoNLPlify goes one step further and outperforms existing data augmentation techniques on multiple datasets, indicating its effectiveness in enhancing the performance of language models on text classification tasks.
However, this study also raises important questions about the representation of spatial information by language models. Further research is needed to better understand how these models use and reason on spatial information, and how their spatial knowledge can be leveraged to enhance their performance on downstream tasks. GeoNLPlify could be used to reinforce the BERT-like model representations of spatial information (and its hierarchy) to increase their knowledge of spatiality. Our results suggest that the exploitation of spatial information has the potential to unlock new capabilities in language models and contribute to the advancement of the field.
Notes
12 wurlhttps://www.openstreetmap.org.
Acknowledgments
This study was partially funded by EU grant 874850 MOOD and is cataloged as MOOD059. The contents of this publication are the sole responsibility of the authors and do not necessarily reflect the views of the European Commission. We would like to thank Bruno Martins (INESC-ID, Portugal) and other participants of the MOOD project for their suggestions to enrich this work.
References
[1] | D.P. Coppola, Introduction to international disaster management, Third edition edn, Elsevier/Butterworth-Hein, Amsterdam, (2015) , OCLC: ocn910948503. ISBN 978-0-12-801477-6. |
[2] | G. Ma, Tweets Classification with BERT in the Field of Disaster Management, Technical Report, Stanford University, (2019) . |
[3] | G. Burel, H. Saif and H. Alani, Semantic Wide and Deep Learning for Detecting Crisis-Information Categories on Social Media, in: The Semantic Web – ISWC 2017, Vol. 10587, C. d’Amato, M. Fernandez, V. Tamma, F. Lecue, P. Cudré-Mauroux, J. Sequeda, C. Lange and J. Heflin, eds, Springer International Publishing, Cham, (2017) , pp. 138–155, Series Title: Lecture Notes in Computer Science. ISBN 978-3-319-68287-7 978-3-319-68288-4. doi: 10.1007/978-3-319-68288-4_9. http://link.springer.com/10.1007/978-3-319-68288-4_9. |
[4] | C. Buntain, R. McCreadie and I. Soboroff, Incident Streams 2020: TRECIS in the Time of COVID-19, (2020) , 20. |
[5] | C. Wang, P. Nulty and D. Lillis, Crisis Domain Adaptation Using Sequence-to-Sequence Transformers, (2021) , 12. |
[6] | A. Vaswani, N. Shazeer, N. Parmar, J. Uszkoreit, L. Jones, A.N. Gomez, L. Kaiser and I. Polosukhin, Attention Is All You Need, arXiv, (2017) , Number: arXiv:1706.03762 arXiv:1706.03762 [cs]. http://arxiv.org/abs/1706.03762. |
[7] | J. Phang, T. Févry and S.R. Bowman, Sentence Encoders on STILTs: Supplementary Training on Intermediate Labeled-data Tasks, arXiv, (2019) , arXiv:1811.01088 [cs]. http://arxiv.org/abs/1811.01088. |
[8] | M. Bayer, M.-A. Kaufhold and C. Reuter, A Survey on Data Augmentation for Text Classification, ACM Computing Surveys, (2022) , 3544558. doi: 10.1145/3544558. |
[9] | S. Longpre, Y. Wang and C. DuBois, How Effective is Task-Agnostic Data Augmentation for Pretrained Transformers? arXiv, (2020) , arXiv:2010.01764 [cs, stat]. http://arxiv.org/abs/2010.01764. |
[10] | M.T. Ribeiro, S. Singh and C. Guestrin, “Why Should I Trust You?”: Explaining the Predictions of Any Classifier, arXiv, (2016) , Number: arXiv:1602.04938 arXiv:1602.04938 [cs, stat]. http://arxiv.org/abs/1602.04938. |
[11] | R. Decoupes, M. Roche and M. Teisseire, GeoNLPlify: Une augmentation spatiale de corpus liés aux crises pour des taches de classification, Revue des Nouvelles Technologies de l’Information Extraction et Gestion des Connaissances, RNTI-E-39, (2023) , 441–448. |
[12] | E. Arsevska, S. Valentin and J. Rabatel, Web monitoring of emerging animal infectious diseases integrated in the French Animal Health Epidemic Intelligence System, PLOS ONE, (2018) , 25. doi: 10.1371/journal.pone.0199960. |
[13] | M. Imran, P. Mitra and C. Castillo, Twitter as a Lifeline: Human-annotated Twitter Corpora for NLP of Crisis-related Messages, arXiv:1605.05894 [cs], (2016) , arXiv:1605.05894. http://arxiv.org/abs/1605.05894. |
[14] | A. Wang, A. Singh, J. Michael, F. Hill, O. Levy and S. Bowman, GLUE: A Multi-Task Benchmark and Analysis Platform for Natural Language Understanding, in: Proceedings of the 2018 EMNLP Workshop BlackboxNLP: Analyzing and Interpreting Neural Networks for NLP, Association for Computational Linguistics, Brussels, Belgium, (2018) , pp. 353–355. doi: 10.18653/v1/W18-5446. http://aclweb.org/anthology/W18-5446. |
[15] | E. Ma, nlpaug, (2019) , original-date: 2019-03-21T03:00:17Z. https://github.com/makcedward/nlpaug. |
[16] | G.A. Miller, WordNet: A lexical database for English, Communications of the ACM 38: (11) ((1995) ), 39–41. doi: 10.1145/219717.219748. |
[17] | S. Kobayashi, Contextual Augmentation: Data Augmentation by Words with Paradigmatic Relations, arXiv, (2018) , arXiv:1805.06201 [cs]. http://arxiv.org/abs/1805.06201. |
[18] | J. Devlin, M.-W. Chang, K. Lee and K. Toutanova, BERT: Pre-training of Deep Bidirectional Transformers for Language Understanding, in: Proceedings of the 2019 Conference of the North {A}merican Chapter of the Association for Computational Linguistics: Human Language Technologies, Volume 1 (Long and Short Papers), (2019) , p. 16. doi: 10.18653/v1/N19-1423. |
[19] | Y. Liu, M. Ott, N. Goyal, J. Du, M. Joshi, D. Chen, O. Levy, M. Lewis, L. Zettlemoyer and V. Stoyanov, RoBERTa: A Robustly Optimized BERT Pretraining Approach, arXiv, (2019) , Number: arXiv:1907.11692 arXiv:1907.11692 [cs]. http://arxiv.org/abs/1907.11692. |
[20] | J. Bongard and J. Kersten, Combining Supervised and Unsupervised Learning to Detect and Semantically Aggregate Crisis-Related Twitter Content, ISCRAM 2021, pico, (2021) . doi: 10.5194/egusphere-egu21-8637. https://meetingorganizer.copernicus.org/EGU21/EGU21-8637.html. |
[21] | S. Feng, V. Gangal, J. Wei, S. Chandar, S. Vosoughi, T. Mitamura and E. Hovy, A Survey of Data Augmentation Approaches for NLP, in: Findings of the Association for Computational Linguistics: ACL-IJCNLP 2021, Association for Computational Linguistics, Online, (2021) , pp. 968–988. doi: 10.18653/v1/2021.findings-acl.84. https://aclanthology.org/2021.findings-acl.84. |
[22] | R. Shams, Semi-supervised Classification for Natural Language Processing, arXiv, (2014) , arXiv:1409.7612 [cs]. http://arxiv.org/abs/1409.7612. |
[23] | Z.-z. Li, D.-w. Feng, D.-s. Li and X.-c. Lu, Learning to select pseudo labels: A semi-supervised method for named entity recognition, Frontiers of Information Technology & Electronic Engineering 21: (6) ((2020) ), 903–916. doi: 10.1631/FITEE.1800743. |
[24] | J. Chen, Z. Yang and D. Yang, MixText: Linguistically-Informed Interpolation of Hidden Space for Semi-Supervised Text Classification, in: Proceedings of the 58th Annual Meeting of the Association for Computational Linguistics, Association for Computational Linguistics, Online, (2020) , pp. 2147–2157. doi: 10.18653/v1/2020.acl-main.194. https://www.aclweb.org/anthology/2020.acl-main.194. |
[25] | J. Wei and K. Zou, EDA: Easy Data Augmentation Techniques for Boosting Performance on Text Classification Tasks, arXiv, (2019) , arXiv:1901.11196 [cs]. http://arxiv.org/abs/1901.11196. |
[26] | Y. Nie, Y. Tian, X. Wan, Y. Song and B. Dai, Named Entity Recognition for Social Media Texts with Semantic Augmentation, in: Proceedings of the 2020 Conference on Empirical Methods in Natural Language Processing (EMNLP), Association for Computational Linguistics, Online, (2020) , pp. 1383–1391. doi: 10.18653/v1/2020.emnlp-main.107. https://www.aclweb.org/anthology/2020.emnlp-main.107. |
[27] | Y. Cheng, L. Jiang, W. Macherey and J. Eisenstein, AdvAug: Robust Adversarial Augmentation for Neural Machine Translation, in: Proceedings of the 58th Annual Meeting of the Association for Computational Linguistics, Association for Computational Linguistics, Online, (2020) , pp. 5961–5970. doi: 10.18653/v1/2020.acl-main.529. https://www.aclweb.org/anthology/2020.acl-main.529. |
[28] | C. Zhu, Y. Cheng, Z. Gan, S. Sun, T. Goldstein and J. Liu, FreeLB: Enhanced Adversarial Training for Natural Language Understanding, arXiv, (2020) , arXiv:1909.11764 [cs]. http://arxiv.org/abs/1909.11764. |
[29] | D. Jin, Z. Jin, J.T. Zhou and P. Szolovits, Is BERT Really Robust? A Strong Baseline for Natural Language Attack on Text Classification and Entailment, arXiv, (2020) , arXiv:1907.11932 [cs]. http://arxiv.org/abs/1907.11932. |
[30] | J.X. Morris, E. Lifland, J.Y. Yoo, J. Grigsby, D. Jin and Y. Qi, TextAttack: A Framework for Adversarial Attacks, Data Augmentation, and Adversarial Training in NLP, arXiv, (2020) , arXiv:2005.05909 [cs]. http://arxiv.org/abs/2005.05909. |
[31] | R. Sennrich, B. Haddow and A. Birch, Improving Neural Machine Translation Models with Monolingual Data, in: Proceedings of the 54th Annual Meeting of the Association for Computational Linguistics (Volume 1: Long Papers), Association for Computational Linguistics, Berlin, Germany, (2016) , pp. 86–96. doi: 10.18653/v1/P16-1009. http://aclweb.org/anthology/P16-1009. |
[32] | S.M. Lundberg and S.-I. Lee, A Unified Approach to Interpreting Model Predictions, (2017) , 10. |
[33] | P.-J. Kindermans, S. Hooker, J. Adebayo, M. Alber, K.T. Schütt, S. Dähne, D. Erhan and B. Kim, The (Un)reliability of Saliency Methods, in: Explainable AI: Interpreting, Explaining and Visualizing Deep Learning, Vol. 11700, W. Samek, G. Montavon, A. Vedaldi, L.K. Hansen and K.-R. Müller, eds, Springer International Publishing, Cham, (2019) , pp. 267–280, Series Title: Lecture Notes in Computer Science. ISBN 978-3-030-28953-9 978-3-030-28954-6. doi: 10.1007/978-3-030-28954-6_14. http://link.springer.com/10.1007/978-3-030-28954-6_14. |
[34] | C. Berragan, A. Singleton, A. Calafiore and J. Morley, Transformer based named entity recognition for place name extraction from unstructured text, International Journal of Geographical Information Science, (2022) , 1–20. doi: 10.1080/13658816.2022.2133125. |
[35] | R. Decoupes, R. Kafando, M. Roche and M. Teisseire, H-TFIDF: What makes areas specific over time in the massive flow of tweets related to the covid pandemic? AGILE: GIScience Series 2: ((2021) ), 1–8. doi: 10.5194/agile-giss-2-2-2021. https://agile-giss.copernicus.org/articles/2/2/2021/. |
[36] | J. Fize, M. Roche and M. Teisseire, Could spatial features help the matching of textual data? Intelligent Data Analysis 24: (5) ((2020) ), 1043–1064, Publisher: IOS Press. doi: 10.3233/IDA-194749. |
[37] | R. Grishman and B. Sundheim, Message Understanding Conference-6: A Brief History, COLING ’96: Proceedings of the 16th conference on Computational linguistics 1: ((1996) ), 6. doi: 10.3115/992628.992709. |
[38] | D. Nadeau and S. Sekine, A survey of named entity recognition and classification, Lingvisticae Investigationes 30: (1) ((2007) ), 3–26. doi: 10.1075/li.30.1.03nad. |
[39] | J. Dodge, G. Ilharco, R. Schwartz, A. Farhadi, H. Hajishirzi and N. Smith, Fine-Tuning Pretrained Language Models: Weight Initializations, Data Orders, and Early Stopping, arXiv, (2020) , arXiv:2002.06305 [cs]. http://arxiv.org/abs/2002.06305. |
[40] | A. Rogers, O. Kovaleva and A. Rumshisky, A Primer in BERTology: What we know about how BERT works, arXiv: 2002.12327 [cs], (2020) , arXiv:2002.12327. http://arxiv.org/abs/2002.12327. |
[41] | I. Temnikova and C. Castillo, EMTerms 1.0: A Terminological Resource for Crisis Tweets, in: ISCRAM, (2015) , p. 13. |
[42] | A. Olteanu, S. Vieweg and C. Castillo, What to Expect When the Unexpected Happens: Social Media Communications Across Crises, in: Proceedings of the 18th ACM Conference on Computer Supported Cooperative Work & Social Computing, ACM, Vancouver BC Canada, (2015) , pp. 994–1009. ISBN 978-1-4503-2922-4. doi: 10.1145/2675133.2675242. |
[43] | A. Olteanu, C. Castillo, F. Diaz and S. Vieweg, CrisisLex: A Lexicon for Collecting and Filtering Microblogged Communications in Crises, in: ICWSM, (2014) , p. 10. |
[44] | I. Hassouneh, A. Radwan, T. Serra and J.M. Gil, Food scare crises and developing countries: The impact of avian influenza on vertical price transmission in the Egyptian poultry sector, Food Policy 37: (3) ((2012) ), 264–274. doi: 10.1016/j.foodpol.2012.02.012. https://linkinghub.elsevier.com/retrieve/pii/S0306919212000164. |
[45] | A.J. McMinn, Y. Moshfeghi and J.M. Jose, Building a large-scale corpus for evaluating event detection on twitter, in: Proceedings of the 22nd ACM International Conference on Conference on Information & Knowledge Management – CIKM ’13, ACM Press, San Francisco, California, USA, (2013) , pp. 409–418. ISBN 978-1-4503-2263-8. doi: 10.1145/2505515.2505695. http://dl.acm.org/citation.cfm?doid=2505515.2505695. |
[46] | K. Zahra, M. Imran and F.O. Ostermann, Automatic identification of eyewitness messages on twitter during disasters, Information Processing & Management 57: (1) ((2020) ), 102107. doi: 10.1016/j.ipm.2019.102107. https://linkinghub.elsevier.com/retrieve/pii/S0306457319303590. |
[47] | C. Wang, P. Nulty and D. Lillis, Transformer-based Multi-task Learning for Disaster Tweet Categorisation, (2021) , 14. |
[48] | M. Imran, C. Castillo, J. Lucas, P. Meier and S. Vieweg, AIDR: artificial intelligence for disaster response, in: Proceedings of the 23rd International Conference on World Wide Web, ACM, Seoul Korea, (2014) , pp. 159–162. ISBN 978-1-4503-2745-9. doi: 10.1145/2567948.2577034. |
[49] | Y. Gu, R. Tinn, H. Cheng, M. Lucas, N. Usuyama, X. Liu, T. Naumann, J. Gao and H. Poon, Domain-specific language model pretraining for biomedical natural language processing, ACM Transactions on Computing for Healthcare 3: (1) ((2022) ), 1–23, arXiv: 2007.15779. doi: 10.1145/3458754. http://arxiv.org/abs/2007.15779. |
[50] | S. Valentin, E. Arsevska, J. Rabatel, S. Falala, A. Mercier, R. Lancelot and M. Roche, PADI-web 3.0: A new framework for extracting and disseminating fine-grained information from the news for animal disease surveillance, One Health, (2021) , 100357. doi: 10.1016/j.onehlt.2021.100357. https://linkinghub.elsevier.com/retrieve/pii/S2352771421001476. |
[51] | D. Joseph and J.C. Samuel, Highly pathogenic avian influenza H5N1 – a global animal health crisis: Profound challenges to science and society, Entwicklung und Laendlicher Raum, (2006) , Accepted: 2015-03-18T06:55:36Z. https://cgspace.cgiar.org/handle/10568/58465. |
[52] | D.-H. Lee, Pseudo-Label: The Simple and Efficient Semi-Supervised Learning Method for Deep Neural Networks, (2013) , 7. |
[53] | D. Berthelot, N. Carlini, I. Goodfellow, N. Papernot, A. Oliver and C. Raffel, MixMatch: A Holistic Approach to Semi-Supervised Learning, arXiv, (2019) , arXiv:1905.02249 [cs, stat]. http://arxiv.org/abs/1905.02249. |
[54] | L. Tunstall, Natural Language Processing with Transformers, (2022) , 409. |
[55] | Z. Yang, Z. Dai, Y. Yang, J. Carbonell, R. Salakhutdinov and Q.V. Le, XLNet: Generalized Autoregressive Pretraining for Language Understanding, arXiv, (2020) , arXiv:1906.08237 [cs]. http://arxiv.org/abs/1906.08237. |
[56] | M. Imran, P. Mitra and C. Castillo, Twitter as a Lifeline: Human-annotated Twitter Corpora for NLP of Crisis-related Messages, arXiv, (2016) , arXiv:1605.05894 [cs]. http://arxiv.org/abs/1605.05894. |
Appendices
Appendix
Sentence embedding representation of data augmentations applied on PADI-web data
In this appendix, we present in more details Fig. 9 which is decomposed into two sets of subplots. The first one (Fig. 10) proposes a decomposition by data augmentation and the second by PADI-web classes (Fig. 11).
The subplots in Fig. 10 show the distribution of document representations for the different data augmentation methods: ‘none’, ‘nlpaug synonym’, ‘nlpaug contextual embedding’, ‘geonlplify specialization’, ‘geonlplify spatial synonym’, and ‘geonlplify Generalization’. The first observation is that nlpaug augmentations are more compact than GeoNLPlify. Furthermore, nlpaug augmentations are in the center of the original dataset representation space (“none”) whereas GeoNLPlify tends to push the boundaries by augmenting at the edge of the dataset. This, as illustrated in Table 5, shows that GeoNPLify extends the representation space further.
The subplots in Fig. 11 propose to analyze the sentence embedding representations by PADI-web classes: “Alert”, “Outbreak declaration”, “Consequences”, “General Information” and “Other”. We observe, once again, that GeoNLPlify does not augment all classes in a balanced way. The three classes the less augmented by GeoNLPlify (“Alert”, “Other”, “General Information”) did not benefit from the same quality of augmentation. As illustrated in Table 1, “Other” and “General information” are the two only classes for which nlpaug is better than Geonlplify_specialization and Geonlplify_equivalence. The scarcity of spatial information alone does not explain GeoNLPlify’s performance on data-poor classes. The original distribution and heterogeneity of document spatiality have an impact on the effectiveness of GeoNLPlify. Thanks to the embeddings in Fig. 11, we can see that the original documents (“none”) in “General Information” were already very semantically dispersed, so GeoNLPlify adds no new semantic pattern. Concerning the “Other” class, it is probably too noisy to be interpreted. Finally, as also seen in the previous Figure (Fig. 10), it appears that GeoNLPlify extends the most the semantic space of representation (except for the “Alert” class).
Figure 10.
Sentence embedding representation of data augmentations applied on PADI-web data – by Data Augmentation.
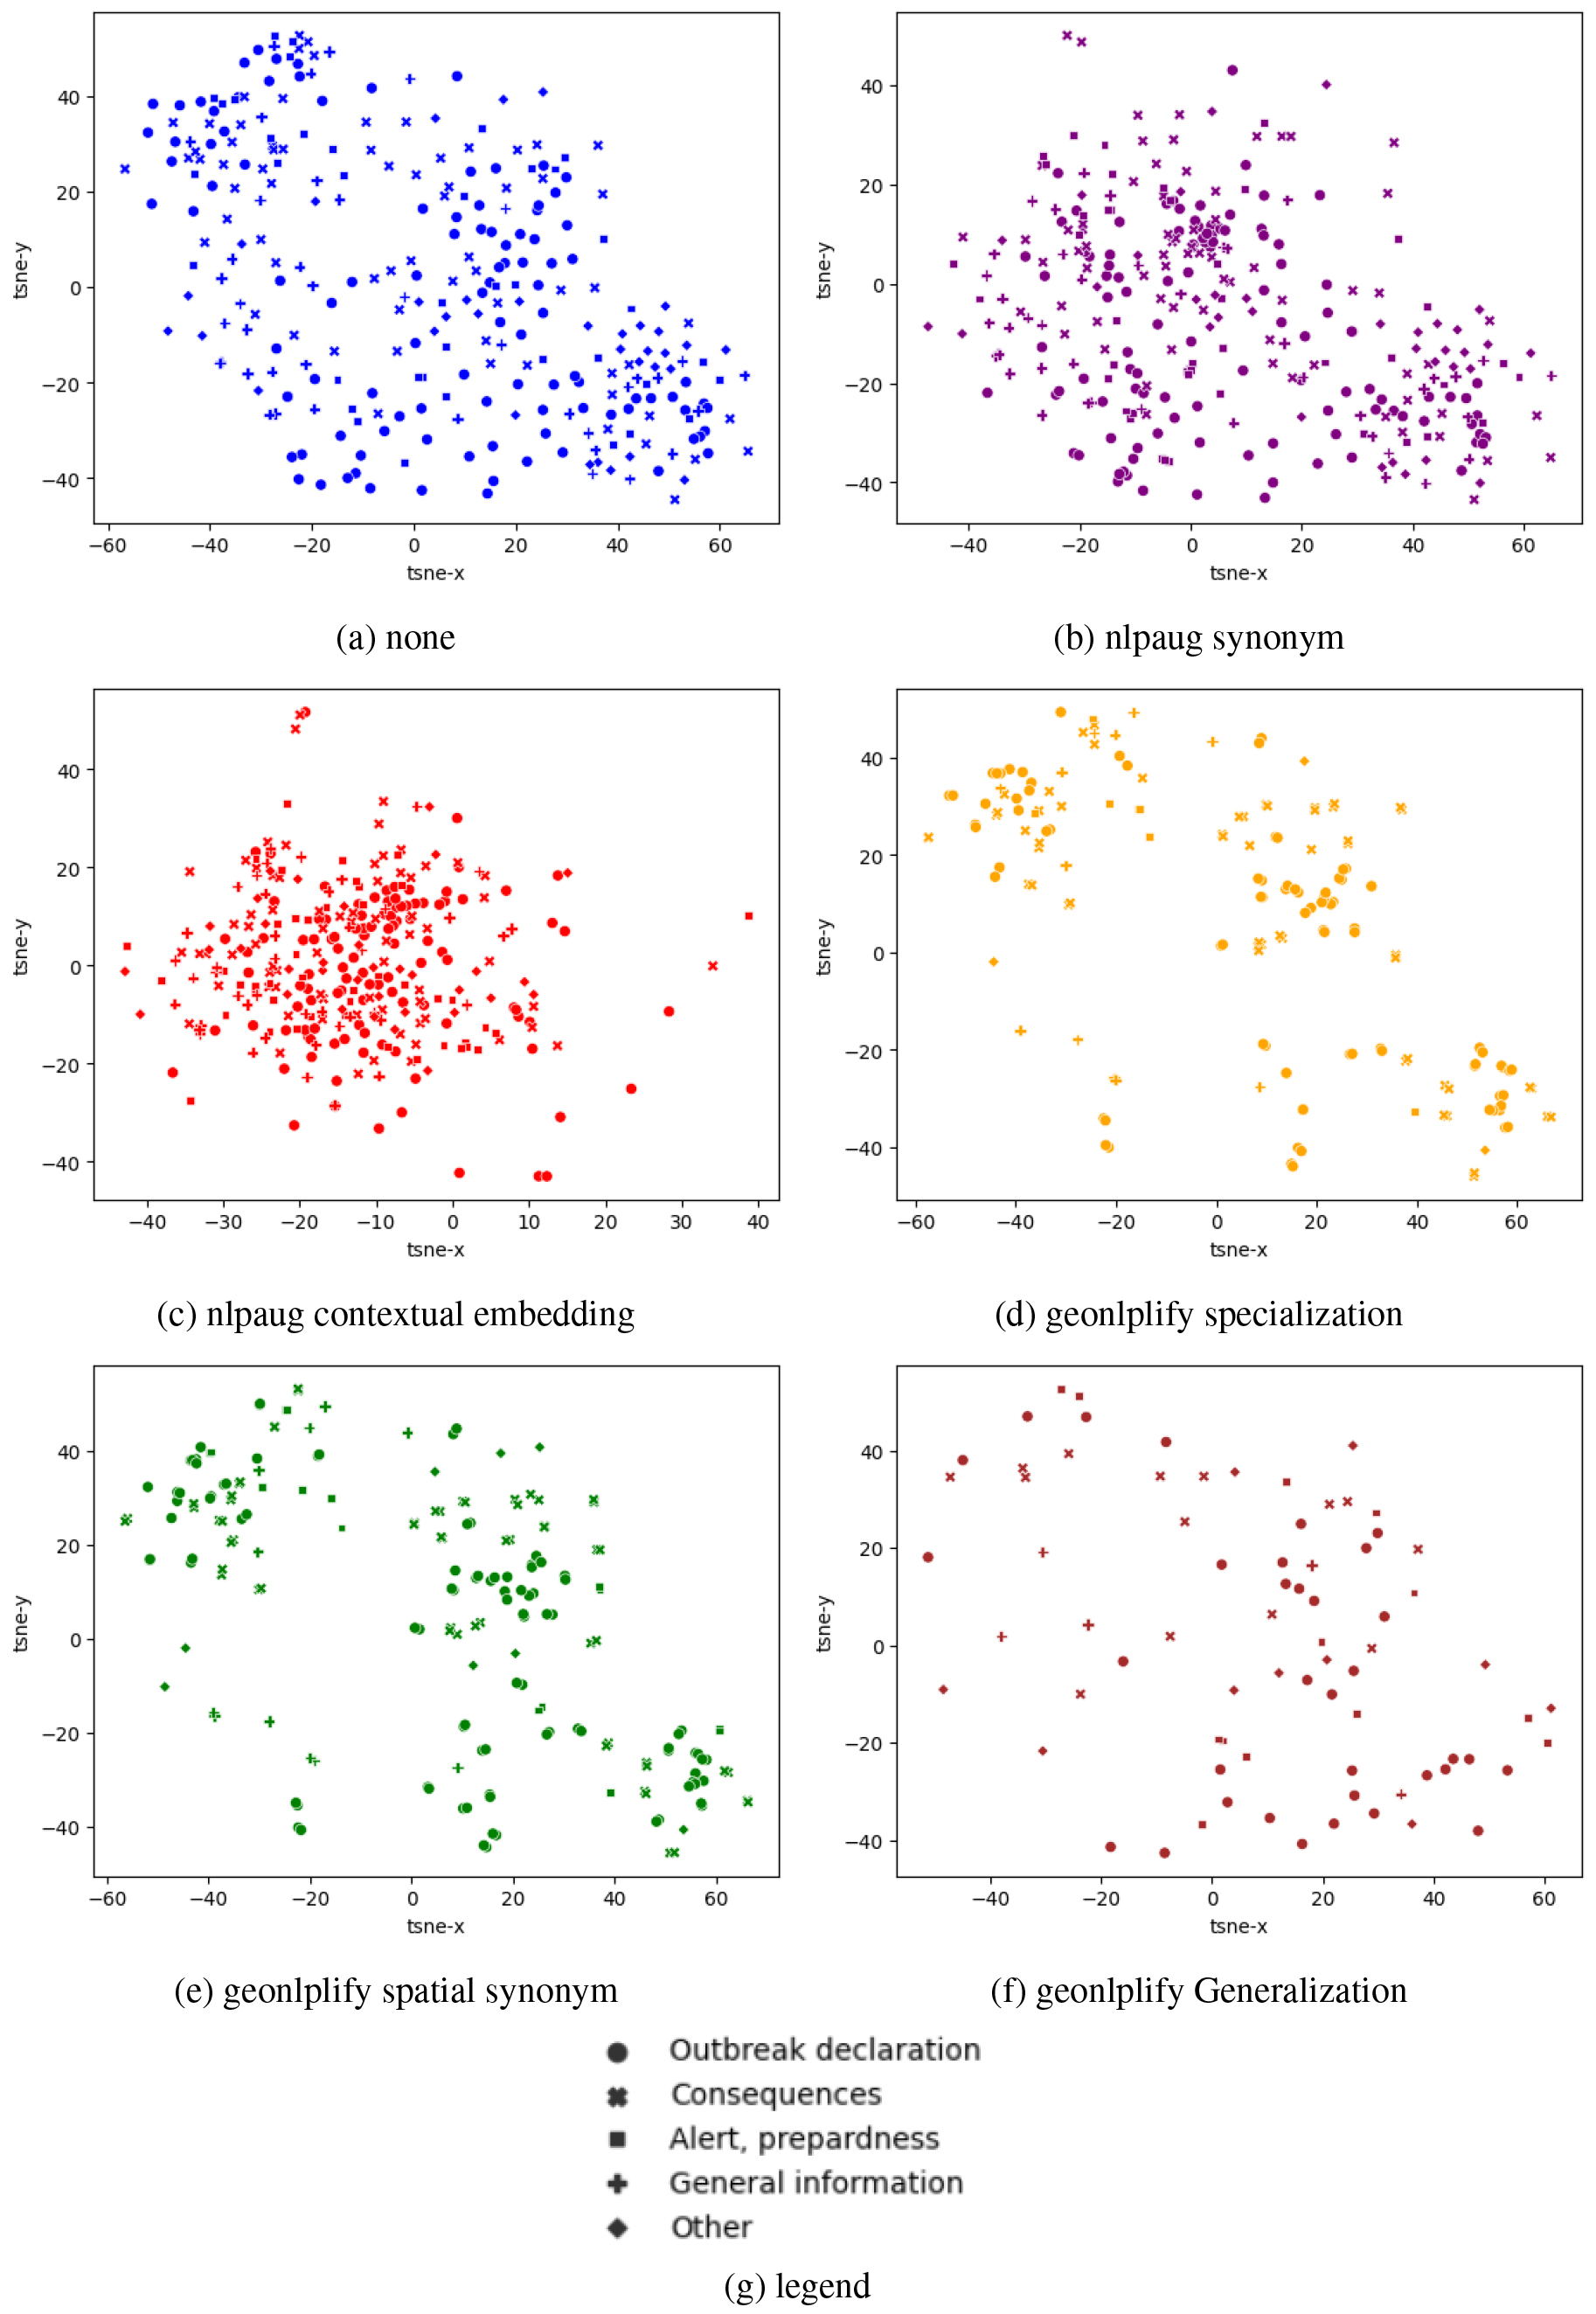
Figure 11.
Sentence embedding representation of data augmentations applied on PADI-web data – by Class.