
Virtual sensor for probabilistic estimation of the evaporation in cooling towers
Abstract
Global natural resources are affected by several causes such as climate change effects or unsustainable management strategies. Indeed, the use of water has been intensified in urban buildings because of the proliferation of HVAC (Heating, Ventilating and Air Conditioning) systems, for instance cooling towers, where an abundant amount of water is lost during the evaporation process. The measurement of the evaporation is challenging, so a virtual sensor could be used to tackle it, allowing to monitor and manage the water consumption in different scenarios and helping to plan efficient operation strategies which reduce the use of fresh water. In this paper, a deep generative approach is proposed for developing a virtual sensor for probabilistic estimation of the evaporation in cooling towers, given the surrounding conditions. It is based on a conditioned generative adversarial network (cGAN), whose generator includes a recurrent layer (GRU) that models the temporal information by learning from previous states and a densely connected layer that models the fluctuations of the conditions. The proposed deep generative approach is not only able to yield the estimated evaporation value but it also produces a whole probability distribution, considering any operating scenario, so it is possible to know the confidence interval in which the estimation is likely found. This deep generative approach is assessed and compared with other probabilistic state-of-the-art methods according to several metrics (CRPS, MAPE and RMSE) and using real data from a cooling tower located at a hospital building. The results obtained show that, to the best of our knowledge, our proposal is a noteworthy method to develop a virtual sensor, taking as input the current and last samples, since it provides an accurate estimation of the evaporation with wide enough confidence intervals, contemplating potential fluctuations of the conditions.
1.Introduction
Climate change is an evidence whose effects not only include a rise of global temperature, changing precipitation patterns, and causing intense heat waves or more droughts [41] but it also produces serious impacts in global natural resources, such as water. The reduction of global water supplies could be accelerated in several parts of the world due to certain management strategies which require intensive extraction of groundwater from large aquifers without returning the content [50, 37, 18]. In addition, water scarcity is accentuated in cities because of fast urbanization, insufficient maintenance of water infrastructures and unsatisfactory waste management [36].
The public water supply represents 21% of the consumption in the European Union [8], including buildings that account for the greater use, in particular commercial and institutional ones [55, 52]. Some reports state that up to 30% of the volume of water consumed in buildings could be saved [8]. However, a sustainable water management in buildings would help to preserve global water resources [52]. The majority of buildings use Heating, Ventilating and Air Conditioning (HVAC) systems that consume a significant amount of water (around 48% of the total), especially the water-based cooling systems such as cooling towers [27, 16, 55]. Measures for enhancing the efficiency of these systems could therefore provide important water savings [27, 17]. In addition, the performance of the cooling towers depends mainly on ambient conditions, given a fixed quantity of heat to dissipate. For this reason, knowing how water is used in cooling towers is an interesting subject in order to support management decisions and operation strategies.
Figure 1.
Cooling tower scheme.
A cooling tower is a HVAC system designed to transfer heat from the water to the air (see Fig. 1). The warm water flow entering to the tower is sprayed while an air draft is generated in the opposite direction, in order to achieve the evaporation. In this process, the water exchanges the latent heat with the air, so that the cold water flow leaving the tower is obtained [32]. A lot of water is lost in the evaporation, so additional water must be continuously added to the system. Although other processes taking place in the tower such as drift or blow-down increase slightly the loss of water, evaporation represents the main part of the losses and has a significant effect in the environment and the cost [30]. Furthermore, evaporation is directly influenced by the ambient conditions that fluctuate over time and determine the operation and performance of the cooling tower. For that reason, the evaporation flow should be measured in a cooling tower, although these systems do not usually incorporate a meter for this purpose.
Although there are some systems using recycled water, it is not contemplated in hospital applications, where cooling towers must use fresh water treated with biocides to comply with a strict health regulation and to prevent legionella. In this context, a virtual sensor could be used to estimate the evaporation in a cooling tower, facilitating to plan its operation and to improve its performance, consequently saving fresh water.
A virtual sensor is a software sensor that estimates an indirect variable using readings from related physical sensors [39]. The applications are wide, ranging from the estimation of a measure that is difficult or even impossible to obtain to support in case of a failure or replacement of an installed sensor. A virtual sensor requires computational methods such as neural networks that replicate the functional behavior of the process accurately. The virtual sensor should consider the surrounding conditions, i.e., the operating and environmental conditions as well as their possible variations. Moreover, it should take advantage of past states of the cooling tower. The virtual sensor should be able to estimate the range of values in which the evaporation could be found and with what confidence, i.e., the probability distribution instead of a single value of evaporation to accommodate slight variations of the surrounding conditions. For that purpose, the method should provide a probabilistic estimation in order to take into account these mentioned conditions and fluctuations.
In this paper, we propose a deep generative approach to develop a virtual sensor for probabilistic estimation of the evaporation in cooling towers, given the operating and environmental conditions. The proposed deep generative approach considers the potential fluctuations of the surrounding conditions and the previous states of the cooling tower. Novel deep learning methods can be appropriate for estimating the probability distribution of the evaporation in cooling towers. Deep architectures based on a Generative Adversarial Network (GAN) could yield likely estimations in both normal and abnormal scenarios and recurrent networks could learn from the past states of the cooling tower. This paper extends the approach first presented in [5] and introduces novelties in several directions:
• The introduction of previous samples to the input of the model.
• The processing of the noise in the intermediate layers in order to allow the model to capture patterns in the first layers.
• The use of a recurrent network to remember past states of the cooling tower.
• The comparison of the proposed deep generative approach with other state-of-the-art methods.
• The use of a different test dataset to assess and compare all the models, increasing the training and validation data.
• The use of several metrics, suitable for evaluating probabilistic distributions.
The remainder of the paper is organized as follows: Literature is reviewed in Section 2. In Section 3, the proposed deep generative approach used to address the problem is explained in detail. Section 4 describes the cooling tower, the dataset, the evaluation metrics and the experimental setup. In Section 5, the results are presented and discussed. Finally, conclusions are drawn in Section 6.
2.Related work
One of the main challenges in the operation of cooling towers is to reduce the evaporation (preserving fresh water sources) while minimizing energy consumption [20]. However, the measurement of the evaporation is challenging. A virtual sensor can estimate a variable, which is difficult or expensive to measure, through models created using lower cost or related physical sensors. Although the virtual sensing technique has been applied in many fields, building systems are slower to adopt some technologies because of the costs [39]. The adaptation of virtual sensors in embedded devices within a building can provide an improvement in monitoring the performance. In this section, related works concerning models for simulation and prediction of the behaviour of this type of HVAC systems are briefly reviewed. State-of-the-art approaches can be categorized in the following groups:
• Physical models that try to simulate the system by means of mathematical formulas.
• Data-based models which can extract patterns of a system from data described by several variables of the process.
• Generative models that estimate data distribution and can generate new plausible data instances.
Initial approaches for water loss in cooling towers are referred to mathematical models [48, 26]. Merkel developed a baseline theory of cooling towers using differential equations of heat and mass transfer [44]. For that purpose, several assumptions have to be taken, such as the Lewis factor (heat and mass transfer relation) being equal to one, the saturation of exit air by water vapor and its characterization by its enthalpy, or neglecting the evaporation of water flow rate. In following works, these assumptions were modified. For example, other values of the Lewis number were considered [24] whereas Kloppers and Kröger specified the influence of the Lewis relation on water outlet temperature for dry conditions of ambient air [33]. A model based on Merkel’s theory was proposed [51] for the prediction of energy and water consumption under variable wet-bulb temperatures and airflow rates. Besides, Li et al. [40] proposed a dynamic model for a mechanical draft counterflow cooling tower by simulating its transient behaviour for three different inlet conditions of tower: fixed condition, change in evaporator inlet water temperature and change in ambient air condition. Although these approaches represent the system closely, they require complex developments and a complete understanding of the physical laws, including the specification of several parameters. Furthermore, several assumptions are involved that do always not adjust to the real conditions of the system and might lead to poor accuracy in the results.
In contrast, data-based methods possess the ability to extract non-linear relationships from several variables describing a process, without a complete understanding of the underlying physical system [9, 1]. Indeed, data-driven models provide flexible methods that can be used for energy and performance prediction in a context of smart infrastructures. The applicability of artificial neural networks (ANN) for prediction of the performance of cooling towers covering several ambient conditions was shown on an experimental system [30, 19].
Another data-based approach for energy prediction is the use of ensemble methods that use a set of predictors (using decision trees) to estimate a final value. A modeling method based on gradient boosting machine was proposed for energy consumption in several commercial buildings [53]. Random forest (RF) was used for hourly building energy prediction and its performance was evaluated in educational buildings [54]. A comparison of the performance of ANN and RF for electricity consumption prediction in a HVAC system showed a better behavior of the ANN model [2].
The above methods learn a model from training data that simulates the behaviour of the system, but new situations not included in training data could appear, so that the model would be unable to capture certain operations of the system. In order to deal with this issue, a function for all the possible input values should be inferred consistently from training data. In this sense, Gaussian processes [49] are a probabilistic method, based on multivariate Gaussian distributions, to model the underlying distribution over possible functions. A direct application area is regression, using a mean vector (frequently assumed to be zero) and a covariance matrix, defined by evaluating various types of similarity measures, such as linear or radial basis functions, through a kernel. Additional information can be incorporated from training data using Bayesian inference, which serves to constrain the set of functions. This modeling has been used for determining energy savings and uncertainty levels in measurement and verification practices [28] or estimating brain activity [42]. An enhanced probabilistic neural network was presented in [3] using local decision circles with an increase of its robustness for classification. Also a generalization of the RF algorithm, called quantile regression forest (QRF) [43], can be more suitable for representing a prediction with uncertainties [58].
On the other hand, recent deep learning approaches have produced advances in several fields such as computer vision applications [21, 46, 7] or natural language processing [22]. These approaches have also been applied to other novel scenarios, for instance, real-time crack assessment for civil structure inspection [31] data compression in structural health monitoring [6, 47], a deep learning framework proposed for data streaming classification [38], or the addition in the algorithm of prior knowledge and temporal information [13]. Generative adversarial networks (GAN) [23] provide a generative model that is able to obtain predictions that can occur in real situations, but that are not included in training data. Although GAN was initially applied to domains where the evaluation method can be intuitive such as images [25], later they have also been applied to time-series data in several domains such as sensory data [35]. In the field of energy management, the use of GAN was proposed for the task of scenario generation, so that new scenarios can be produced using historical data from renewable resources without explicitly modeling the distribution [14]. A data-driven approach was also proposed to generate synthetic data using GAN based on learned conditional probability distribution [57].
In this paper, a probabilistic estimation of the evaporation in cooling towers is performed taking into account contextual and novel information and past states. For that purpose, a deep generative approach is used and assessed under a real scenario using data collected from a cooling tower located in a hospital building [5]. This work differs from the above mentioned works, since it does not only consider the surrounding conditions but also their potential fluctuations and the dynamics of the process, remembering prior states. In addition, it provides a probability distribution instead of just an estimated value.
3.Methodology
This paper addresses the development of a virtual sensor able to provide a probabilistic estimation of the evaporation in cooling towers, given the surrounding conditions. The virtual sensor should consider the influence of the operating and environmental variables on the evaporation. Furthermore, it should tackle the potential fluctuations of these conditional variables due to abnormal situations, such as a peak in thermal load, an increase of the outdoor temperature during a heatwave or a rise of the relative humidity because of fog banks. In addition, it should learn from previous operations and the dynamics of the thermodynamic process in a cooling tower. Therefore, the virtual sensor should estimate the evaporation in both normal and abnormal situations. Likewise, it should estimate not only a single value of the evaporation, but also the probability distribution of the evaporation, in order to determine a range to which the evaporation could belong with certain confidence level.
In order to deal with this problem, we propose a deep generative approach to obtain probabilistic estimations of the evaporation. It is based on a Generative Adversarial Network (GAN) [23] that can provide a plausible estimation of the evaporation, even in novel unseen situations. A GAN architecture allows us to create generative models through an adversarial process. It consists of two parts: the generator whose function is to yield new credible data that are very similar to real data by capturing the data distribution; and the discriminator which is in charge of classifying data as either real or artificial by providing if a sample is from the input dataset or from the generator.
Training the GAN architecture entails, first, training and updating the discriminator assuming that the class is always real. Next, both the generator and the discriminator models are trained assuming that the class is always fake, but only the generator is updated. The final aim of training a GAN architecture is to achieve a generator which is able to fool the discriminator by providing real-looking data which are used as output.
3.1The proposed deep generative approach
Since some operating and environmental variables influence the evaporation, the GAN architecture should be conditioned by these contextual variables. For that purpose, a conditional version of the GAN architecture, called Conditioned Generative Adversarial Network (cGAN) [45], is used in this paper. In a cGAN architecture, both the generator and discriminator are conditioned on some extra information in order to manage the data generation process. In this case, the cGAN considers the operating and environmental conditions, the previous states of the cooling tower and the dynamics of the thermodynamic process. The effort focuses on building the deterministic models for both the generator and the discriminator.
Figure 2.
The proposed deep generative approach (cGAN-GRU).
Figure 2 summarizes the proposed deep generative approach (cGAN-GRU) based on a conditioned GAN. Using this approach, the evaporation
(1)
where
The environmental and operating variables for current time
(2)
and for past times
(3)
being
The noise representing the variations of the contextual variables is
(4)
being
The generator should consider prior states and the dynamics of the evaporation process. For that purpose, we propose the use of a recurrent layer which is able to learn from the past environmental and operating conditions. The deep generative approach includes a GRU (Gated Recurrent Unit) layer [15] since its structure is less complex and computationally more efficient than other recurrent alternatives, such as LSTM (Long Short-Term Memory) [29]. The generator should also consider potential fluctuations of the environmental and operating variables. For that reason, a concatenate layer is introduced after the recurrent layer to add noise to the model [34], representing these variations.
The input to the generator are
The discriminator should evaluate if the estimation yielded by the generator is plausible or not, given the current context of the cooling tower, i.e., the environmental conditions and the operating modes of the cooling tower. Therefore, in this case, the model could be built as a deep network but, unlike for the generator, without the specific use of a recurrent layer for acquiring information from the past.
The input to the discriminator is a vector representing the current state of the cooling tower (comprising the current samples of
The output of the proposed deep generative approach (cGAN-GRU) should be a probability distribution of the evaporation, considering different scenarios. For that, a distribution of values (not only a single value) for each noisy variable is introduced to the generator, i.e.,
3.2Additional methods
The proposed deep generative approach is compared with other state-of-the-art methods:
• Conditioned GAN with dense layers (cGAN- Dense): A conditioned generative adversarial network with dense layers (cGAN-Dense), which consists of a generator and a discriminator deep networks based on dense layers (with a certain number of hidden layers) [5]. On the one hand, noise is introduced to the generator, together with the conditional variables that influence the estimation. The generator has one or several dense layers and provides the estimation as its output. On the other hand, the estimated and the real values are concatenated with the conditional variables and they are fed into the discriminator. As the generator, the discriminator comprises one or several dense layers. The output of the discriminator is the class of the estimation, i.e., it returns whether this value is real or not.
• Gaussian Process Regression (GPR): Gaussian process regression [49] is a nonparametric Bayesian approach that computes the probability distribution over all admissible functions that fit the data instead of calculating the probability distribution of parameters of a specific function. GPR infers a probability distribution over all possible values so that it has the ability to provide uncertainty measurements on the estimations. A Gaussian process is completely specified by a mean function and a positive definite covariance function.
• Quantile Regression Forest (QRF): This method is a generalization of the standard random forest (RF), which produces an accurate approximation of the conditional distribution of a response variable, not only about the conditional mean [43]. A QRF model infers the full conditional distribution of a response variable [43], whereas a RF models calculates the mean value of the target variable in each tree leaf [11]. Thus, QRF gives a non-parametric and accurate way of estimating conditional percentiles for high-dimensional predictor variables, what can be used to build prediction intervals and detect outliers in the data.
4.Experiments
4.1System and dataset
A mechanical draft cooling tower (Baltimore Aircoil S-3654-NM) is used in the experiment (see Fig. 3). This tower, located at the Hospital of León, is used to condense water from a chiller [5]. The air flow is generated by an axial fan with a three-phase induction motor (18.5 KW) which is driven by a variable speed drive (Moeller DF6-340-22K). The water flow is provoked by two pumps Grundfos NK 150-315/307/BAQE with a three-phase induction motor (30 KW) each. Two Johnson Controls TS-9101- 8224 sensors measure input and output temperatures of the water.
![Photo of cooling tower [5].](https://content.iospress.com:443/media/ica/2021/28-4/ica-28-4-ica210654/ica-28-ica210654-g003.jpg)
A dataset is created, acquiring and storing data from the operation of the cooling tower for 40 days, sampled at 1 hour. This dataset comprises 960 samples and 6 variables (see Table 1). Ambient temperature (Ta) and humidity (Hr), input (
Table 1
Variables in the dataset
| Symbol | Variable name | Unit |
| Ta | Dry-bulb temperature | |
| Hr | Relative humidity | % |
|
| Input water temperature (warm) | |
|
| Output water temperature (cold) | |
| Fs | Fan speed | % |
|
| Evaporated water flow |
|
4.2Evaluation metrics
Several metrics can be used for evaluating estimations and comparing the performance between the methods in this context [10]. They are described in the following. On the one hand, several metrics are related to prediction error defined by the difference between an observed value
One measure that compares estimation performance is the mean absolute percentage error (MAPE) that takes into account relative errors of the estimation as follows:
(5)
Also, a widely known measure, root mean squared error (RMSE) is considered for the evaluation:
(6)
On the other hand, Continuous Ranked Probability Score (CRPS) can be used to compare the accuracy of a probabilistic estimation quantitatively [56]. CPRS considers the probability distribution of the estimations as a whole, without focusing on any specific point of the distribution. CRPS generalizes the mean absolute error (MAE) to the case of probabilistic estimations. It is a quadratic measure of the difference between the predicted cumulative distribution function (CDF) and the empirical CDF of the observation. The CRPS between an observation
(7)
being
4.3Experiment setup
The data from the original dataset are preprocessed and scaled in range [
(8)
where the conditional variables
(9)
The length of the sliding window
Vector
The proposed and state-of-the-art methods are trained and tested using the previously defined dataset (data from 40 days sampled at 1 hour). For that purpose, it is split into training, validation and test subsets. Data from the first 35 days are used for training and validation and data from the last 5 days are used for testing.
A 5-fold cross-validation is applied to select the parameters which provide the lowest errors for each method. Specifically, a range of hyperparameters was established after several preliminary runs. Then, a grid search is performed to tune the hyperparameters of each model. Table 2 summarizes the hyperparameters considered for tuning each method. Another alternative could be the use of an automated methodology for designing the architecture and its parameters [12].
Table 2
Overview of the hyperparameter tuning
| Hyperparameter | Range | Best value |
| QRF | ||
| Window | [0–9] | 0 |
| Estimators | [100–2000] | 500 |
| Depth | [1–10] | 5 |
| GPR | ||
| Window | [0–9] | 3 |
| Kernel | Linear, Matern, | |
| RBF, DotProduct | DotProduct | |
| cGAN-Dense | ||
| Window | [0–9] | 1 |
| Noise dimension | [1–10] | 4 |
| Neurons G1 | [20–150] | 150 |
| Neurons G2 | [20–150] | 100 |
| Neurons D1 | [20–150] | 150 |
| Neurons D2 | [20–150] | 100 |
| cGAN-GRU | ||
| Window | [0–9] | 1 |
| Noise dimension | [1–10] | 4 |
| Neurons G1 | [20–150] | 100 |
| Neurons G2 | [20–150] | 50 |
| Neurons D1 | [20–150] | 50 |
| Neurons D2 | [20–150] | – |
As a result of this process, the following hyperpara- meters have been selected. In QRF method, the selected number of estimators is 500 and the depth of each tree is 5. In this case, the input comprises only the current sample (no sliding window). GPR method uses a dot product function as a kernel and the input comprises the current and 3 past samples (
Figure 4.
Losses and accuracy for the generator and discriminator of cGAN-GRU.
The experiments described have been executed on a PC equipped with an Intel Core i7-6700 3.40 GHz CPU and 16 GB RAM. No GPU memory is used. Keras 2.3.1, Tensorflow 1.14 and scikit-learn 0.22.1 libraries are used to implement all methods.
5.Results and discussion
In this section, results from the proposed approach (cGAN-GRU) and the baseline methods (QRF, GPR and cGAN-Dense) are presented and compared. In order to determine the probability distribution of data, 2000 values are computed for each observation. In the proposed approach case, 2000 values are generated randomly according to a normal distribution for each noisy variable
Three evaluation metrics (CRPS, MAPE and RMSE) are computed in order to assess and compare the methods.
Table 3 presents the results from all methods with tuned hyperparameters using the validation dataset (comprising 7 days of data for each of the 5 folds). Note that the lowest values are highlighted in bold. The mean and standard deviation of the 5 folds are calculated. In general, all methods provide acceptable results. However, the proposed approach (cGAN-GRU) performs slightly better. Indeed, it is the best performing method according to the CRPS and MAPE and the second one (closely to the first one) with regard to the RMSE. GPR is also a valuable method to perform the probabilistic estimation of the evaporation since it provides low values of the three metrics, close to the cGAN-GRU. In terms of the RMSE, GPR obtains the best results and it is the second best for the CRPS and MAPE. Furthermore, GPR ensures a fast inference time. cGAN-Dense would be the third option to develop the virtual sensor whereas the results from the QRF are the worst.
Table 3
Validation errors (mean and standard deviation of the 5 folds)
| CRPS | MAPE | RMSE | |
|---|---|---|---|
| Method | ( | ( | ( |
| QRF | 7.7 | 0.95 | 15.0 |
| GPR | 6.5 | 0.78 |
9.70 |
| cGAN-Dense | 6.6 | 0.98 | 12.1 |
| cGAN-GRU |
6.2 |
0.77 | 9.80 |
Table 4 presents the results from all methods with tuned hyperparameters using the test dataset (comprising 5 days of data). Note that the lowest values are highlighted in bold. There is consistency between the test and validation results. Again, the proposed approach provides the best results. Although all methods yield great results, cGAN-GRU obtains the lowest errors according to the CRPS and MAPE and the second lowest one considering the RMSE (but closely to the lowest one). The other GAN-based approach (cGAN-Dense) provides the second best results according to the CRPS and RMSE. However, the MAPE for cGAN-Dense is higher than the MAPE for GPR, which should be seen as the third option to develop the virtual sensor. Analyzing all evaluation metrics, QRF provides again the worst results.
Table 4
Test errors
| CRPS | MAPE | RMSE | |
|---|---|---|---|
| Method | ( | ( | ( |
| QRF | 7.5 | 1.41 | 11.0 |
| GPR | 6.0 | 1.01 | 8.6 |
| cGAN-Dense | 5.2 | 1.15 | 7.3 |
| cGAN-GRU | 4.3 | 0.95 | 7.4 |
CRPS is one of the most widely used metrics to assess probabilistic estimations, so we will focus mainly on its results. In view of both validation and test results, it can be stated that the proposed approach (cGAN-GRU) is a noteworthy option to develop a virtual sensor for probabilistic estimation of the evaporation in cooling towers. Figure 5 shows the probabilistic estimation of the evaporation using the test dataset for all methods. At the top of each subfigure, the real values of the evaporation
Figure 5.
Probabilistic estimation of the evaporation with confidence intervals, using the test dataset.
Figure 5a depicts the probabilistic estimation of the evaporation using the cGAN-GRU method. It can be observed that the confidence ranges are fitted and uniform, slightly wider in the valleys of the evaporation curve, but wide enough to contemplate potential variations of the environmental and operating conditions of the cooling tower since always the real values fit in the interval. The errors (difference between the real value and the mean of the distribution) are low. The variability of the evaporation can be found in the range
Figure 5b shows the probabilistic estimation of the evaporation using the cGAN-Dense method. It can be seen that the estimated mean value and the confidence ranges are similar to the CGAN-GRU but a little broader. This shows that the distribution of data captured by the cGAN-Dense is slightly more dispersed. In this case, the variability of the evaporation can be found in the range
Figure 5c illustrates the probabilistic estimation of the evaporation using the GPR method. Although the error of this method is quite low, the confidence intervals are very narrow. The variability of the evaporation is most likely in the range
Figure 5d depicts the probabilistic estimation of the evaporation using the QRF method. It can be seen that the confidence intervals are irregular and loose. Although this method gives the broadest confidence intervals, since the variability of the evaporation can be found in the range
Figure 6.
Probability distributions of the evaporation in different operating points of the cooling tower (Top: peak hour in the evaporation curve; center: off-peak hour in the evaporation curve; bottom: valley hour in the evaporation curve).
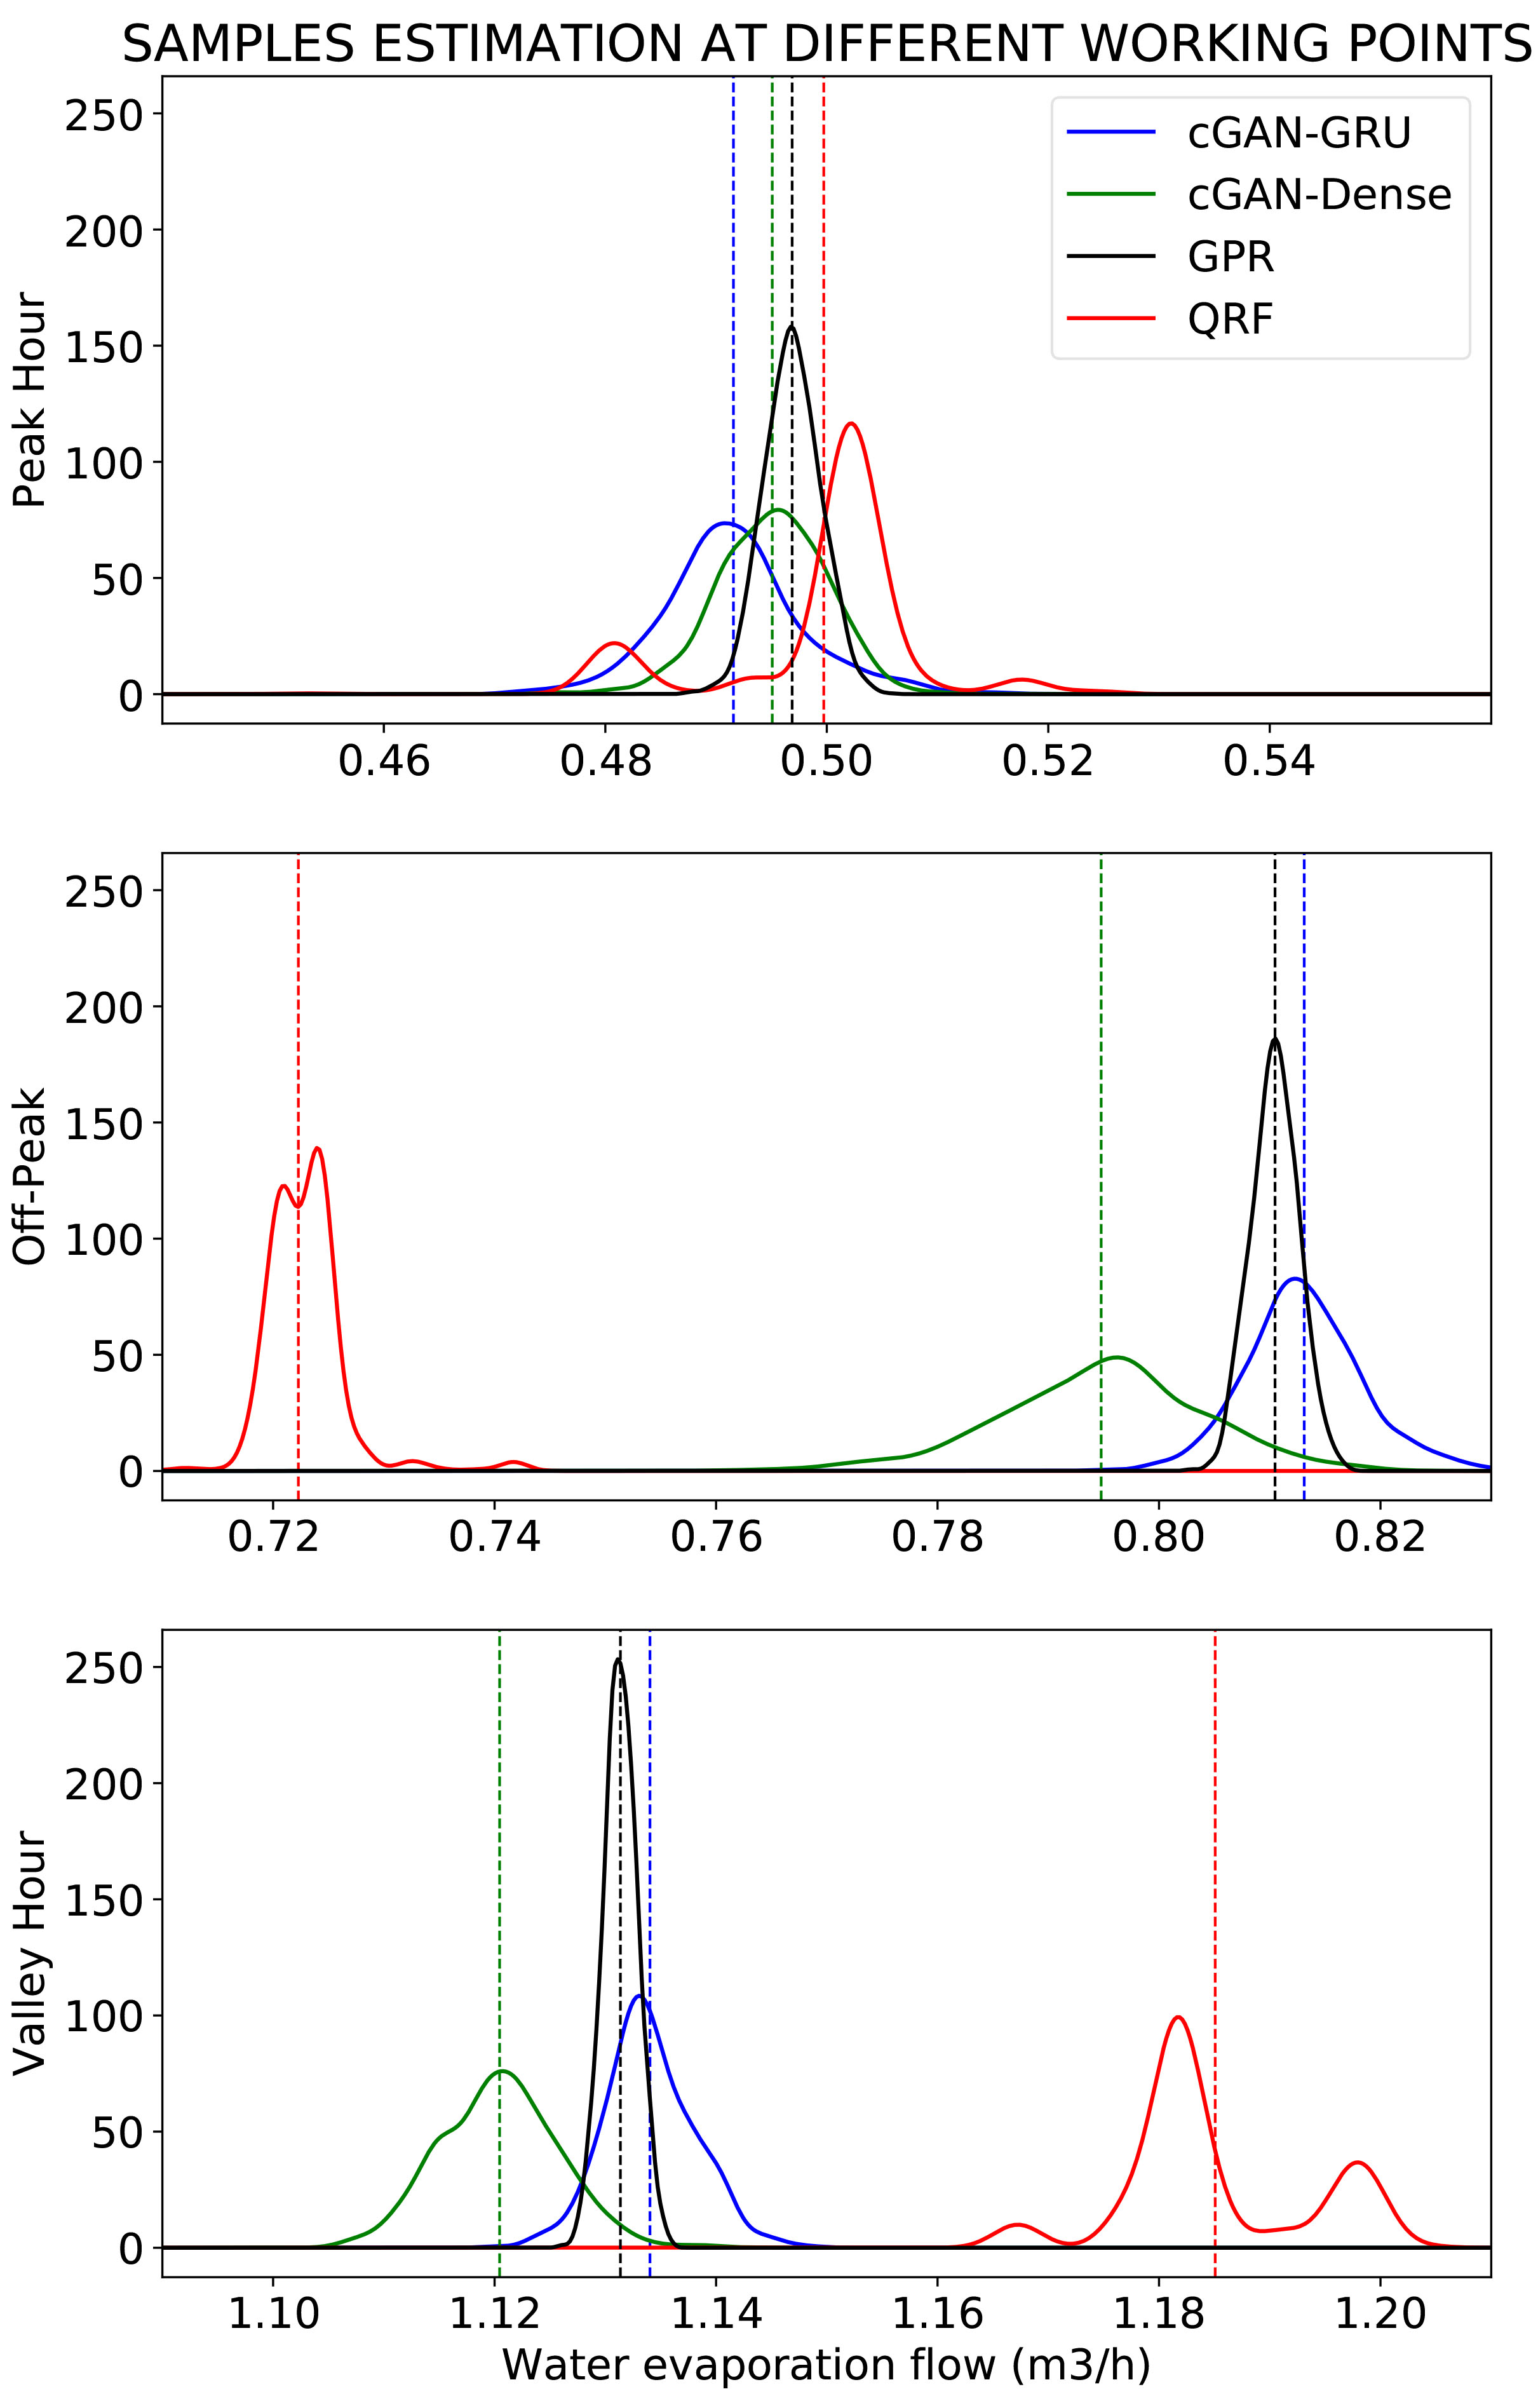
Finally, we show the probability distributions of the evaporation in three representative operating points of the cooling tower for all methods (see Fig. 6). The distributions drawn at the top of the figure correspond to a sample located in a peak of the evaporation curve (normally, at midday) whereas those plotted at the bottom of the figure correspond to a sample in which the evaporation is low (typically, at night). The distributions in the center of the figure are for a sample where the evaporation is either rising or falling (during the morning or afternoon).
As expected, most of the distributions look like a symmetric normal one, presenting more values at the center of the distribution and relatively few in the tails (except the one provided by the QRF method which is a bimodal distribution). The proposed approach (cGAN-GRU) provides a balanced normal distribution (blue) with a broad dispersion for the three representative operating points of the cooling tower. The distributions given by the cGAN-Dense (green) are similar to those from the proposed approach, observing a wider dispersion with intermediate evaporation (center). The results from the GPR (black) show a normal distribution with most values concentrated around the mean and so the dispersion is narrower that the ones obtained with both GAN-based approaches for the three cases. The mean of the distribution of the three mentioned methods is close to each other, revealing a similar behaviour regarding their accuracy. On the contrary, the distributions from the QRF (red) are bimodal and their means are far away from those of the remaining methods for the three representative operating points of the cooling tower. For that reason, it presents the highest errors.
Summarizing, generative approaches are able to provide probabilistic estimations, contemplating different situations. Specifically, the proposed deep generative approach (cGAN-GRU) gives accurate estimations within tight confidence intervals. However, the training of generative approaches is very sensitive to the hyperparameters tuning and can become unstable.
6.Conclusions
This paper proposes a deep generative approach to develop a virtual sensor for probabilistic estimation of the evaporation in cooling towers, given the environmental and operating conditions. This deep generative approach considers the potential fluctuations of the surrounding conditions and the previous states of the cooling tower. It is based on a conditioned generative adversarial network with a GRU recurrent layer to learn from the past states and a dense layer processing the fluctuations of the conditions. The proposed approach (cGAN-GRU) is evaluated and compared against other probabilistic state-of-the-art methods using three metrics, one of them (CRPS) considering the distribution as a whole. Real data from a cooling tower located at a hospital building are used for the experiments. cGAN-GRU is found to be a noteworthy method to develop a virtual sensor that yields the whole probability distribution of the evaporation, taking into account any operating scenario.
To sum up, generative approaches can learn the distribution of the input data and approximate it to the true distribution using the power of deep networks. Although the training procedure is not trivial and convergence or mode collapse problems could appear, deep generative approaches can provide noteworthy results when the training succeeds. Furthermore, they can give the whole probability distribution of the estimated variable instead of a single estimated value, if a distribution of values is introduced as noise, and they can be trained even with small training data. It is possible to conduct the data generation process by conditioning a deep generative approach on extra information. In time domain problems, the use of deep architectures comprising recurrent layers instead of densely connected layers improves the probabilistic estimation. Thus, deep generative approaches with recurrent layers are very promising for estimation of sensor readings and their distributions. However, methods based on Gaussian processes could be considered in applications where there are complications in handling GAN-based architectures in terms of tuning and stability. In this case, the training data should include as much information as possible about the process, since they usually fail to contemplate the variations.
As future work, other recent algorithms such as an enhanced probabilistic network [3] or dynamic ensemble learning [4] can be taken into account for including additional features and refining the estimation and its uncertainty. Also, methods for probabilistic forecasting of the evaporation several hours ahead should be investigated. This functionality could be useful for the virtual sensor because it would facilitate anticipating and modifying the planning and operation of the cooling tower. On the other hand, it would also be interesting to implement the proposed deep generative approach in a low-cost embedded board for an easier integration in production environments.
Acknowledgments
This research was funded by the Spanish Ministry of Science and Innovation and the European Regional Development Fund under project DPI2015-69891-C2-1-R/2-R and the Universidad de León.
References
[1] | Aguilar R, Torres J, Martín C. Machine learning for system identification. A case study in wind farm generation. Revista Iberoamericana de Automática e Informática industrial. (2019) ; 16: (1): 114-127. |
[2] | Ahmad MW, Mourshed M, Rezgui Y. Trees vs neurons: Comparison between random forest and ann for high-resolution prediction of building energy consumption. Energy and Buildings. (2017) ; 147: : 77-89. |
[3] | Ahmadlou M, Adeli H. Enhanced probabilistic neural network with local decision circles: A robust classifier. Integr. Comput.-Aided Eng. (2010) ; 17: (3): 197-210. |
[4] | Alam KMR, Siddique N, Adeli H. A dynamic ensemble learning algorithm for neural networks. Neural Computing and Applications. (2020) ; 32: (12): 8675-8690. |
[5] | Alonso S, Morán A, Pérez D, Prada MA, Fuertes JJ, Domínguez M. Probabilistic estimation of evaporated water in cooling towers using a generative adversarial network. In Iliadis L, Angelov PP, Jayne C, Pimenidis E, editors, Proceedings of the 21st EANN (Engineering Applications of Neural Networks) 2020 Conference, EANN 2020, Cham. Springer, (2020) ; 2: : 307-319. |
[6] | Azimi M, Pekcan G. Structural health monitoring using extremely compressed data through deep learning. Computer-Aided Civil and Infrastructure Engineering. (2020) ; 35: (6): 597-614. |
[7] | Benito-Picazo J, Domínguez E, Palomo EJ, López-Rubio E. Deep learning-based video surveillance system managed by low cost hardware and panoramic cameras. Integrated Computer-Aided Engineering. (2020) ; 27: (4): 373-387. |
[8] | BIO Intelligence Service (2012). Water performance of buildings. Technical report, Final report prepared for European Commission, DG Environment. |
[9] | Bourdeau M, Zhai XQ, Nefzaoui E, Guo X, Chatellier P. Modeling and forecasting building energy consumption: A review of data-driven techniques. Sustainable Cities and Society. (2019) ; 48: : 101533. |
[10] | Bowerman B, O’Connell R, Koehler A. Forecasting, Time Series, and Regression: An Applied Approach. (Duxbury advanced series in statistics and decision sciences). Thomson Brooks/Cole, (2005) . |
[11] | Breiman L. Random forests. Machine Learning. (2001) ; 45: : 5-32. |
[12] | Charte F, Rivera A.J, Martínez F, del Jesus MJ. Evoaaa: An evolutionary methodology for automated neural autoencoder architecture search. Integrated Computer-Aided Engineering. (2020) ; 27: (3): 211-231. |
[13] | Chen S, Leng Y, Labi S. A deep learning algorithm for simulating autonomous driving considering prior knowledge and temporal information. Computer-Aided Civil and Infrastructure Engineering. (2020) ; 35: (4): 305-321. |
[14] | Chen Y, Wang Y, Kirschen D, Zhang B. Model-free renewable scenario generation using generative adversarial networks. IEEE Transactions on Power Systems. (2018) ; 33: (3): 3265-3275. |
[15] | Cho K, van Merrienboer B, Gulcehre C, Bahdanau D, Bougares F, Schwenk H, Bengio Y. Learning phrase representations using rnn encoder-decoder for statistical machine translation. CoRR, abs/1406.1078, (2014) . |
[16] | Dziegielewski B, Kiefer JC, Opitz EM, Porter GA, Lantz GL. Commercial and Institutional End Uses of Water. American Water Works Association Research Foundation, (2000) . |
[17] | Eades WG. Energy and water recovery using air-handling unit condensate from laboratory HVAC systems. Sustainable Cities and Society. (2018) ; 42: : 162-175. |
[18] | Famiglietti JS. The global groundwater crisis. Nature Climate Change. (2014) ; 4: (11): 945-948. |
[19] | Gao M, Sun F-Z, Zhou S-J, Shi Y-T, Zhao Y-B, Wang N-H. Performance prediction of wet cooling tower using artificial neural network under cross-wind conditions. International Journal of Thermal Sciences. (2009) ; 48: (3): 583-589. |
[20] | Garcia C, Ruiz J, Lucas M. Optimum design and operation of an hvac cooling tower for energy and water conservation. Energies. (2017) ; 10: (3): 299. |
[21] | García-González J, Ortiz-de Lazcano-Lobato JM, Luque-Baena RM, López-Rubio E. Background subtraction by probabilistic modeling of patch features learned by deep autoencoders. Integrated Computer-Aided Engineering. (2020) ; 27: (3): 253-265. |
[22] | Goodfellow I, Bengio Y, Courville A. Deep Learning. MIT Press, (2016) . http//www.deeplearningbook.org. |
[23] | Goodfellow I, Pouget-Abadie J, Mirza M, Xu B, Warde-Farley D, Ozair S, Courville A, Bengio Y. Generative adversarial nets, In Ghahramani Z, Welling M, Cortes C, Lawrence ND, Weinberger KQ. editors, Advances in Neural Information Processing Systems 27, Curran Associates, Inc, (2014) , pp. 2672-2680. |
[24] | Grange J. Calculating the evaporated water flow in a wet cooling tower. Technical report, Electricite de France (EDF), (1994) . |
[25] | Gui J, Sun Z, Wen Y, Tao D, Ye J. A review on generative adversarial networks: Algorithms, theory, and applications, CoRR, abs/200106937. (2020) . |
[26] | Halasz B. A general mathematical model of evaporative cooling devices. Revue générale de thermique. (1998) ; 37: (4): 245-255. |
[27] | Hawit O, Jaffe T. Water-energy nexus: Heat rejection systems. ASHRAE Journal. (2017) ; 59: (9): 28-39. |
[28] | Heo Y, Zavala VM. Gaussian process modeling for measurement and verification of building energy savings. Energy and Buildings. (2012) ; 53: : 7-18. |
[29] | Hochreiter S, Schmidhuber J. Long short-term memory. Neural Computation. (1997) ; 9: (8): 1735-1780. |
[30] | Hosoz M, Ertunc H, Bulgurcu H. Performance prediction of a cooling tower using artificial neural network. Energy Conversion and Management. (2007) ; 48: (4): 1349-1359. |
[31] | Jiang S, Zhang J. Real-time crack assessment using deep neural networks with wall-climbing unmanned aerial system. Computer-Aided Civil and Infrastructure Engineering. (2020) ; 35: (6): 549-564. |
[32] | Jin G-Y, Cai W-J, Lu L, Lee EL, Chiang A. A simplified modeling of mechanical cooling tower for control and optimization of HVAC systems. Energy Conversion and Management. (2007) ; 48: (2): 355-365. |
[33] | Kloppers JC, Kröger DG. The Lewis factor and its influence on the performance prediction of wet-cooling towers. International Journal of Thermal Sciences. (2005) ; 44: (9): 879-884. |
[34] | Koochali A, Dengel A, Ahmed S. If you like it, gan it. probabilistic multivariate times series forecast with gan. CoRR, abs/2005.01181, (2020) . |
[35] | Koochali A, Schichtel P, Ahmed S, Dengel A. Probabilistic forecasting of sensory data with generative adversarial networks – ForGAN. CoRR, abs/1903.12549, (2019) . |
[36] | Koop SHA, van Leeuwen CJ. The challenges of water, waste and climate change in cities. Environment, Development and Sustainability. (2017) ; 19: : 385-418. |
[37] | Kundzewicz ZW, Döll P. Will groundwater ease freshwater stress under climate change? Hydrological Sciences Journal. (2009) ; 54: (4): 665-675. |
[38] | Lara-Benítez P, Carranza-García M, García-Gutiérrez J, Riquelme JC. Asynchronous dual-pipeline deep learning framework for online data stream classification. Integrated Computer-Aided Engineering. (2020) ; 27: (2): 101-119. |
[39] | Li H, Yu D, Braun JE. A review of virtual sensing technology and application in building systems. HVAC&R Research. (2011) ; 17: (5): 619-645. |
[40] | Li X, Li Y, Seem JE. Dynamic modeling of mechanical draft counter-flow wet cooling tower with modelica, In Dynamic Systems and Control Conference, (2010) ; 44182: : 687-694. |
[41] | Lindner M, Maroschek M, Netherer S, Kremer A, Barbati A, Garcia-Gonzalo J, Seidl R, Delzon S, Corona P, Kolström M, Lexer MJ, Marchetti M. Climate change impacts, adaptive capacity, and vulnerability of european forest ecosystems. Forest Ecology and Management. (2010) ; 259: (4): 698-709. |
[42] | Martinez-Vargas JD, Duque-Muñoz L, Vargas-Bonilla F, Lopez JD, Castellanos-Dominguez G. Enhanced data covariance estimation using weighted combination of multiple gaussian kernels for improved m/eeg source localization. International Journal of Neural Systems. (2019) ; 29: (6): 1950001. |
[43] | Meinshausen N. Quantile regression forests. Journal of Machine Learning Research. (2006) ; 7: : 983-999. |
[44] | Merkel F. Verdunstungskühlung. VDI-Verlag, (1925) . |
[45] | Mirza M, Osindero S. Conditional generative adversarial nets. CoRR, abs/1411.1784, (2014) . |
[46] | Mishra P, Piciarelli C, Foresti GL. A neural network for image anomaly detection with deep pyramidal representations and dynamic routing. International Journal of Neural Systems. (2020) ; 30: (10): 2050060-2050060. |
[47] | Ni F, Zhang J, Noori MN. Deep learning for data anomaly detection and data compression of a long-span suspension bridge. Computer-Aided Civil and Infrastructure Engineering. (2020) ; 35: (7): 685-700. |
[48] | Qureshi BA, Zubair SM. A unified approach to predict evaporation losses in evaporative heat exchangers. International Journal of Refrigeration. (2011) ; 34: (8): 1866-1876. |
[49] | Rasmussen CE, Williams CK. Gaussian processes for machine learning. The MIT Press, (2006) . |
[50] | Richey AS, Thomas BF, Lo M-H, Reager JT, Famiglietti JS, Voss K, Swenson S, Rodell M. Quantifying renewable groundwater stress with GRACE. Water Resources Research. (2015) ; 51: (7): 5217-5238. |
[51] | Stabat P, Marchio D. Simplified model for indirect-contact evaporative cooling-tower behaviour. Applied Energy. (2004) ; 78: (4): 433-451. |
[52] | Stec A. Sustainable Water Management in Buildings, volume 90 of Water Science and Technology Library, Springer International Publishing, (2020) . |
[53] | Touzani S, Granderson J, Fernandes S. Gradient boosting machine for modeling the energy consumption of commercial buildings. Energy and Buildings. (2018) ; 158: : 1533-1543. |
[54] | Wang Z, Wang Y, Zeng R, Srinivasan RS, Ahrentzen S. Random forest based hourly building energy prediction. Energy and Buildings. (2018) ; 171: : 11-25. |
[55] | Weimar D, Browning A. Reducing water costs in building HVAC systems. Facilities Engineering Journal. (2010) ; 37: (3): 24-26. |
[56] | Zamo M, Naveau P. Estimation of the continuous ranked probability score with limited information and applications to ensemble weather forecasts. Mathematical Geosciences. (2018) ; 50: (2): 209-234. |
[57] | Zhang C, Kuppannagari SR, Kannan R, Prasanna VK. Generative adversarial network for synthetic time series data generation in smart grids. In 2018 IEEE International Conference on Communications, Control, and Computing Technologies for Smart Grids (SmartGridComm), (2018) , pp. 1-6. |
[58] | Zhang W, Quan H, Srinivasan D. Parallel and reliable probabilistic load forecasting via quantile regression forest and quantile determination. Energy. (2018) ; 160: : 810-819. |


