
Data management at scale
Abstract
This paper offers a high-level, non-scientific assessment regarding the impact of research library based data management services, particularly related to predictive data analytics – an area where the corporate sector has arguably made more tangible impact. The fundamental premise rests upon the assertion that research libraries should consider the potential consequences, need for interpretation and degree of control to better allocate and optimize scarce resources for data management. By doing so, it may be possible to support broader goals of data management at scale, identify network effects through linked data and highlight possibilities for partnerships, including with the corporate sector.
1.Introduction
This paper offers a high-level, non-scientific assessment regarding the impact of research library-based data management services, particularly related to predictive data analytics – an area where the corporate sector has arguably made a more tangible impact.
Several research libraries have developed data management services to support their local researchers, largely in response to the requirements of federal funding agencies that are based on the guidelines from the White House Office of Science and Technology Policy (OSTP) memorandum [3]. While these services have supported local researchers, it remains unclear regarding their impact on a broader scale. Data management is a means, not an end unto itself. While complying with Data Management Plan (DMP) requirements is important, the federal funding agencies and the OSTP memorandum cite the importance of overarching drivers such as data sharing, data preservation, reproducibility, research productivity, economic activity and better public health and medicine.
The Sheridan Libraries at Johns Hopkins University (JHU) have conducted data management activities for more than a decade through direct engagement with both scientists and humanists. The Digital Research and Curation Center (DRCC) at the Sheridan Libraries began transferring astronomy data in the early 2000s from the Sloan Digital Sky Survey (SDSS) and creating medieval French data in the late 1990s through the Roman de la Rose Digital Library. Through these experiences, the DRCC has developed a viewpoint of data management that spans beyond compliance with federal funding agency requirements. While data represent a new form of special collections [1], the Sheridan Libraries’ work on service and software development has highlighted possible gaps in research libraries’ approaches to data management, particularly related to the broader goals such as predictive data analytics.
How can research libraries allocate their scarce resources for more impactful data management, especially at scale? By focusing on the dimensions of consequences, interpretation and control, it may be possible to leverage comparative advantage such that research libraries work together with each other and other organizations including private sector corporations. By creating information graphs that highlight connections between linked data, it may be possible to highlight a broader network perspective so that libraries allocate their resources collectively and optimally, thereby bolstering the value of data management services at scale.
2.Big Data
Before focusing on consequences, interpretation, and control as dimensions for data management at scale, it is worthwhile to define Big Data. There is arguably no consistent definition of Big Data. There are other concepts (e.g., digital preservation) that also suffer from this lack of consistency in definition, but there are sometimes frameworks or reference models (e.g., Open Archival Information System) that offer a benchmark. Definitions of Big Data tend to emphasize the “V’s” such as volume, velocity, veracity or viscosity. These definitions are perfectly appropriate, but they are data centric in the sense that they focus on attributes of the data. Based on experience at JHU, I have proposed a definition of Big Data based on “M’s” or research methods. Based on observations of both scientists and humanists, I believe data become “Big” when they require new research methods to deal with them. That is, when a designated community becomes overwhelmed with data to the point of developing new research methods to cope with them, the data have become “Big” to them.
Astronomers were initially overwhelmed by the scope and complexity of the SDSS data. Their historical methods for processing and querying large amounts of flat files were no longer adequate for the SDSS data. Consequently, they developed new database techniques, querying methods, and publication modes so that they could conduct new modes of science and engage a broader community. Many astronomers now conduct their research within databases rather than using the telescope directly and many amateur astronomers make notable contributions through resources such as SkyServer (http://skyserver.sdss.org) and GalaxyZoo (https://www.galaxyzoo.org/).
While it may seem unusual to draw a comparison between astronomers and medievalists, there are fundamental similarities in this context. Medievalists had been accustomed to viewing manuscripts in person and using their cognitive skills (e.g., memory) to interpret those manuscripts. This approach scales reasonably well for a limited number of manuscripts. But as soon as the Roman de la Rose Digital Library encompassed dozens of manuscripts, it was no longer reasonable to rely on human “instrumentation.” Instead, humanists using the Rose Digital Library now rely upon a completely novel method for organizing the manuscripts and for querying them based on metadata and linked data. One anecdote may be particularly illuminating in this regard. A graduate student who had just defended his dissertation contacted our Library to thank us for the Rose Digital Library, noting that he never imagined completing his dissertation without ever viewing a manuscript in person.
In each case, the scale and complexity of the data overwhelmed their respective communities’ ability to deal with them using previous research methods. The development and introduction of new research methods marked the “Big” phase of their interaction with data. With this viewpoint of Big Data, the data-centric attributes such as absolute volume are not as critical. The SDSS data collection comprises over one hundred terabytes; the Rose Digital Library is at least an order of magnitude smaller. The threshold for becoming “Big” might be different in terms of absolute volume, but the shift in research methods is the important characteristic. I hope that research libraries do not start the practice of measuring value based on the number of datasets or bytes of collected data, but rather based on our collective ability to support the broader goals of data management such as predictive data analytics.
3.Predictive data analytics
At the JHU Institute for Data Intensive Engineering and Science (IDIES) 2014 annual symposium, Professor Steven Salzberg from JHU’s Department of Medicine and Biostatics spoke about the remarkable progress in genomic sequencing and computational biology over the last fifteen years. Even with these impressive gains in capacity to sequence genomes at faster and cheaper rates, Salzberg raised a provocative question regarding whether researchers’ abilities to conduct data analytics had advanced correspondingly, particularly as they relate to prediction of medical or public health events.
At the time, the Ebola outbreak in West Africa had lasted for over a year and showed no sign of abatement. Salzberg asked why researchers could not accurately predict the rise of Ebola before it became a widespread phenomenon. At the time, I thought about Google’s ability to track – and perhaps even predict – the spread of the flu. I also noted that Target predicted a high school student’s pregnancy before her father had become aware [2]. Target did so based on the purchase of twenty-five products as a proxy predictor of pregnancy early in the term.
The United Nations (UN) demonstrated simple, yet innovative, uses of corporate data in the form of call detail records (CDRs) as part of the 2013 Global Pulse report. The UN produced a primer on using CDRs for humanitarian and development purposes. A CDR is a telecommunication event that records information such as time of call, duration of call, etc., but not the content of the call itself. The primer indicates that the list of itemized calls on one’s mobile phone bill is essentially a list of CDRs. It is important to note that the UN used CDRs only and did not use other mobile data such as GPS coordinates. Using the CDRs, the UN was able to produce the following analyses outlined in Figs 1 and 2.
Fig. 1.
Population migration in Haiti following 2010 earthquake.
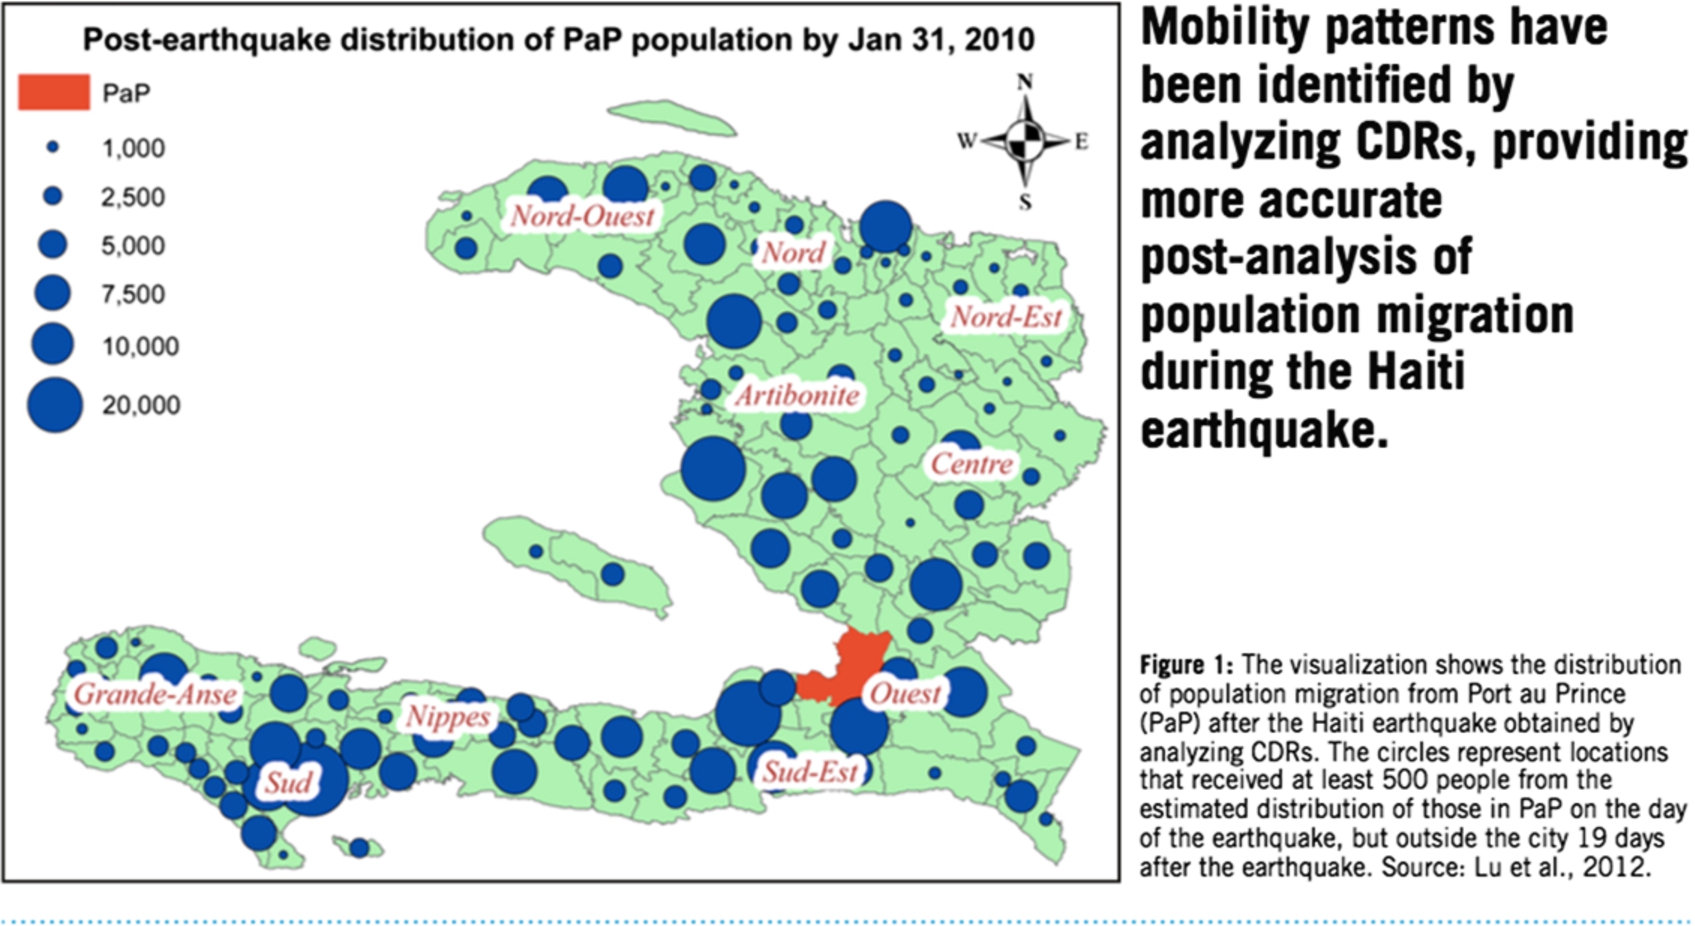
Figure 1 depicts the migration of individuals following the 2010 earthquake in Haiti. Post-recovery efforts following natural disasters can arguably be more hampered by uncertainty regarding distribution of resources rather than a lack of resources (given a surge of worldwide donations). This use of CDRs offered an innovative approach to track the migration of populations to perhaps better coordinate rescue and recovery efforts.
Fig. 2.
Poverty levels in Ivory Coast.
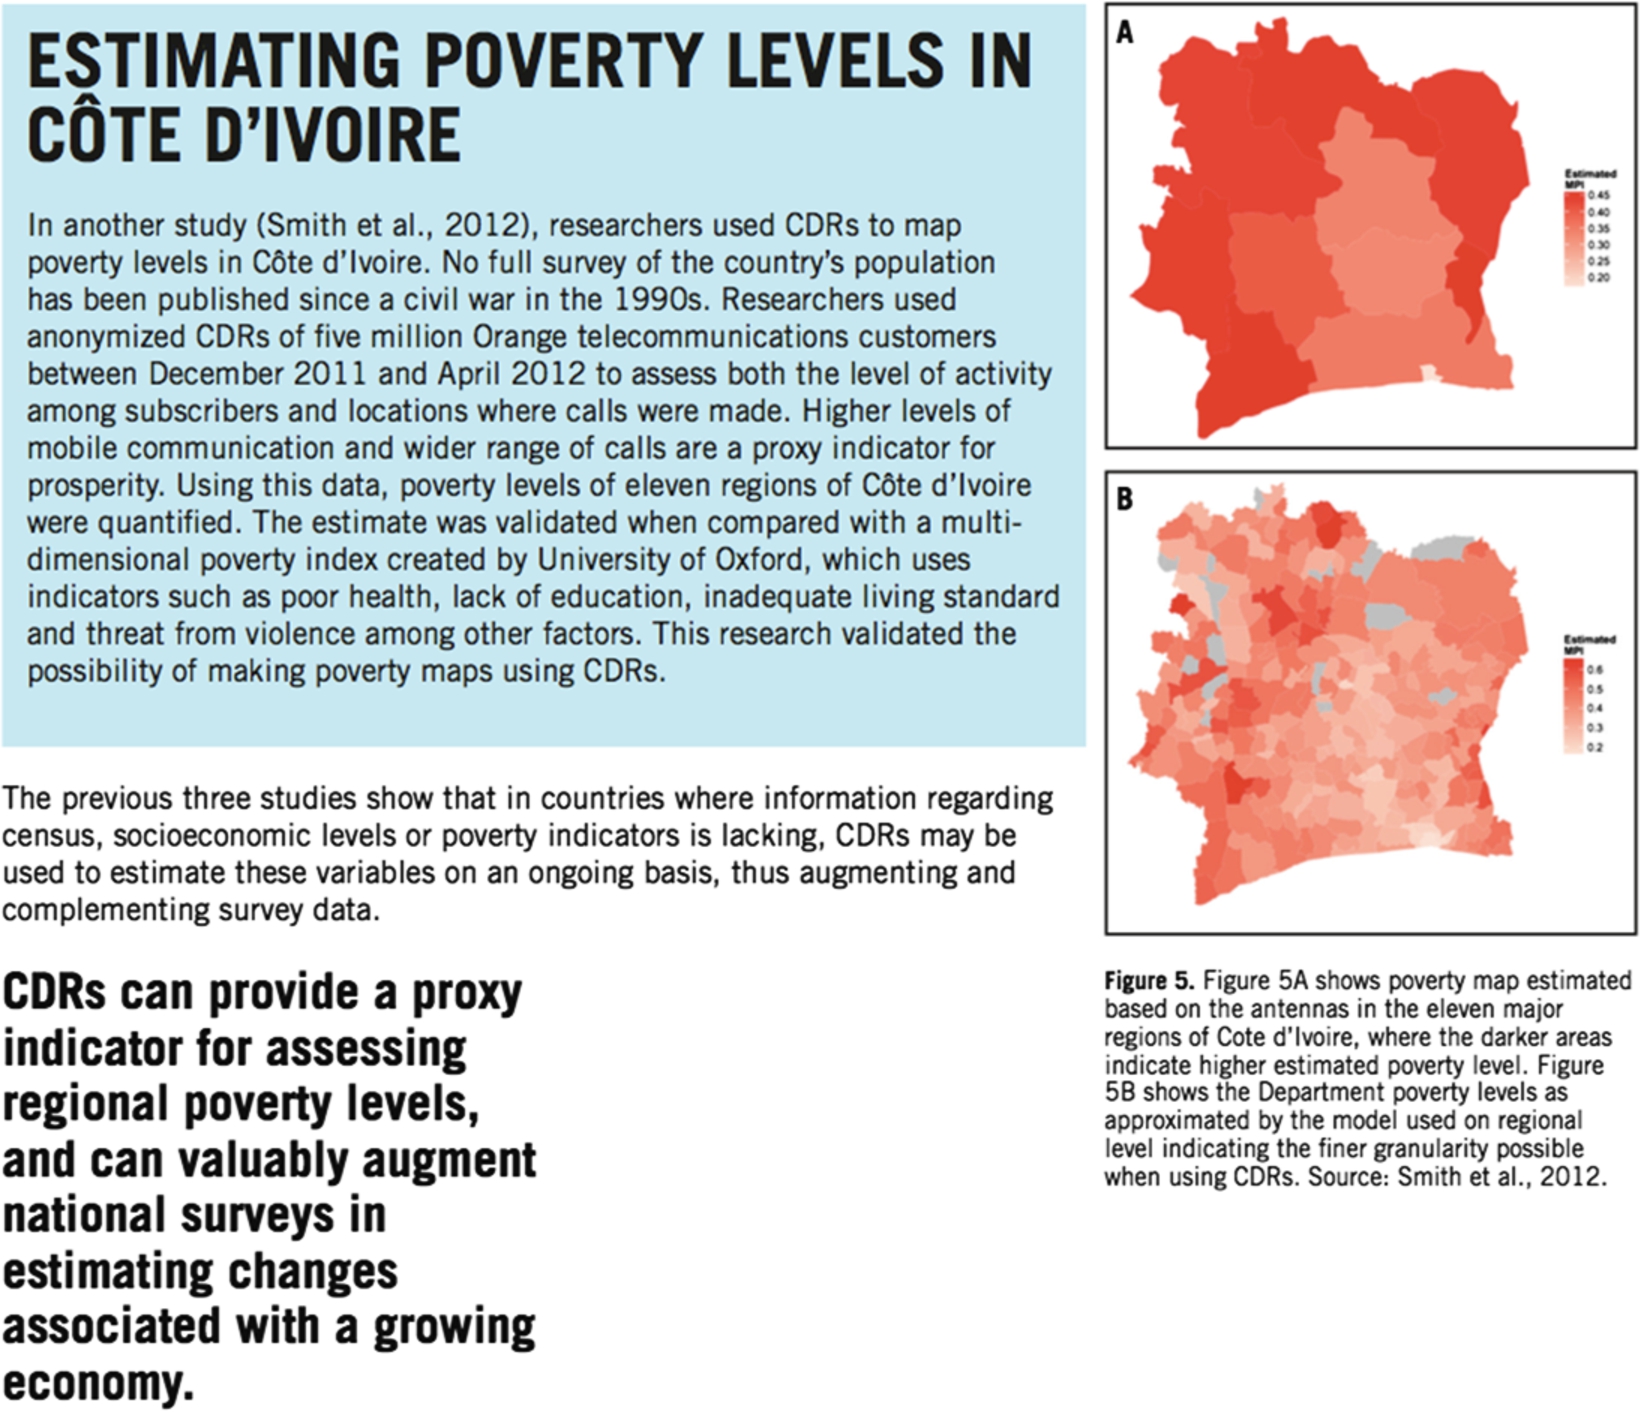
Figure 2 outlines an even more innovative use of CDRs to estimate poverty levels using a proxy. The underlying premise is that individuals with greater wealth are more likely to call individuals they do not know. It is reasonable to assert that one must have a certain level of disposable income to call shops, taxis, repair technicians, etc., rather than specific, known individuals. What is most striking about this study and figure is the level of granularity between the map on top (based on national, government data) and the map on the bottom based on the CDR and proxy approach. One could easily imagine more refined or targeted policies or actions to remediate poverty with the finer level of granularity.
Not all use of corporate data features this level of innovative data analytics. A couple of years ago, when a friend informed me that she wanted to buy a pair of boots, I decided to surprise her by buying her a pair of boots. She had mentioned the website Zappos.com as her one of main sources. After spending a considerable amount of time on Zappos.com, I realized the following:
Women’s boots are very expensive.
I know basically nothing about women’s boots.
And Zappos.com mercifully offers gift certificates.
After purchasing and sending the gift certificate to my friend, I assumed my experience with Zappos.com was over. But upon checking my email (on Gmail), looking at my Facebook feed, visiting Amazon.com, reading The New York Times online, and visiting a host of other websites, I found myself inundated with advertisements for Zappos.com and women’s boots. Thinking about my digital footprint, I started to develop a bit of a complex regarding what it might mean (since I do not really like or normally buy women’s boots…really I don’t). But as anyone who has experienced this phenomenon can attest, the surge of advertisements was temporary. Soon enough, the advertisements returned to reflect my more typical interests, purchases, etc.
Even though this experience might seem trivial, the temporary rise and rather quick fall of the targeted advertisements demonstrates the value of scale. It is a rather crude algorithm that decides because of one (albeit long) web session and one purchase that someone’s interests have fundamentally changed. But given the large number of searches, transactions, purchases, etc. that occur on sites like Amazon or Google, these algorithms correct themselves quickly.
That is, the value of scale is that even crude algorithms or methods can adjust quickly. And perhaps even learn.
My experience with Zappos.com occurred sometime ago. More recently, I have noticed that some of my advertisements are targeted in much more specific ways without a discernible event to explain them. As the temperature soared in Baltimore this year, I installed my window air conditioners. The windows in the front of my house are quite small, making it a challenge to install a window unit. Shortly after I installed the air conditioner, I noted advertisements for a new air conditioner that is apparently 40% smaller than standard units. I did not search for air conditioners on any website. I did not make any related purchases. The one new addition in my life that might explain this phenomenon is the presence of an Amazon Echo in my home office. But I still cannot draw a direct connection. Unless maybe I was talking to myself while installing the air conditioner…
4.Consequences, interpretation and control
With the aforementioned definition of Big Data and these stories about predictive data analytics, I return to the dimensions of consequences, interpretation, and control for data management at scale.
Looking at each of these stories with the lens of potential consequences, it seems reasonable to assert that inaccurately predicting the spread of flu or pregnancy could have large consequences. With the UN’s use of CDRs, the potential consequences of inaccurate predictions are still notable, but arguably lower, especially since their analysis augments other sources of information. With the Zappos.com “prediction” the consequences of a (temporary) mistake are minimal.
Adding the dimension of interpretation, it is worth noting that there is a similar trajectory. Tracking the flu or predicting pregnancy based on purchases requires a high degree of interpretation. The UN study of poverty also requires some degree of interpretation (i.e., using calls to unknown individuals as a proxy for relative wealth). The Zappos.com advertisement surge requires almost no interpretation. Google and Target probably benefitted from public data (e.g., Centers for Disease Control or CDC) or academic research – Target hired an ex-academic who leveraged research from various disciplines including psychology, statistics and economics).
The UN’s proxy of relative wealth based on CDRs requires a modest level of interpretation, but not in the same manner. They compared their findings to national, government data but did not require that data or academic research to conduct their data analytics.
In the case of advertisements generated based on my singular experience at Zappos.com, there is literally no interpretation. And there is no use of public data or academic research either.
Is it possible that as the consequences of incorrect prediction and need for interpretation rise, there are natural opportunities – perhaps even compelling drivers – for the public and private sector to work together?
When thinking of the control dimension, it is actually unfair to compare corporations versus academia for data analytics. Corporations such as Google, Facebook, or Amazon define their own data models, linked data graphs, etc. with a high degree of control that constrains their problem space. Their data are not as heterogeneous as research data, their use cases are arguably not as complex, their business rules are perhaps more simple, and so on. Having said this, it is worth noting that they manage to work with and combine publicly-available data with their own data. None of these companies share data with each other explicitly, yet they take advantage of common frameworks (e.g., cookies of a browser). In cases where individuals use the “ecosystem” of one company (e.g., Gmail, Android device, Google docs), it is rather amazing to see their anticipatory or predictive capabilities.
Do research libraries have similar frameworks or methods? Does depositing data into an institutional repository offer the same opportunities for intra- or inter-institutional data analytics?
5.The Zika virus and the Olympics
Consider these issues in the context of another, current public health outbreak in the news today – the Zika virus. There are major questions regarding the modes of transmission and its possible effects. Given the consequences, interpretation and control dimensions of data associated with the Zika virus, what might be the role of public and private sector?
Would anyone trust a private source to determine the causes of the Zika virus, its possible modes of transmission (e.g., sexual activity) or its effects (e.g., microcephaly)? Given the really high consequences and need for interpretation, these questions are best left addressed by academic researchers and public health organizations such as the World Health Organization or CDC. A Google search as of the writing of this paper for “Zika virus” does not reveal a map. Even if one clicks on the maps tab, the search resolves to the CDC. Perhaps Google realizes that the level of consequences and interpretation are too high in this case to make inferences or predictions.
But consider the important question of whether the Rio Olympics should be postponed or moved. WHO has announced the risk of spreading the Zika virus from the Rio Olympics is “very low.” And many academic researchers agree. But some do not. Would it be helpful to incorporate private sector data in the form of airline ticket purchases to understand the possible pathways of tourists during the Olympics? Are there insights from Google searches that might influence the analyses and predictions? Would these companies be willing to even share such data? Or at least provide some interface to them?
6.Where are research libraries in this picture?
In most cases, these types of questions and conversations focus on trust, which is undoubtedly an important and critical dimension. But how often do research libraries consider the dimensions of consequences, interpretation, and control when making decisions about allocating scarce resources for data management. Are all data equal in terms of these dimensions or the potential to support predictive data analytics? Are libraries developing infrastructures and linked data graphs that will allow our researchers and the general public to understand the connections between seemingly disparate data? Are there common frameworks where libraries might work together or even with the private sector?
I believe that we need to consider and address these questions as a community so that our data management efforts become inspirational – rather than run the risk of becoming transactional.
About the author
G. Sayeed Choudhury is the Associate Dean for Research Data Management and Hodson Director of the Digital Research and Curation Center at the Sheridan Libraries of Johns Hopkins University. He is a member of the Executive Committee for the Institute of Data Intensive Engineering and Science (IDIES) based at Johns Hopkins, a member of the Board of the National Information Standards Organization (NISO), and a member of the Advisory Board for OpenAIRE2020. He has been a member of the National Academies Board on Research Data and Information, the ICPSR Council, the DuraSpace Board, Digital Library Federation advisory committee, Library of Congress’ National Digital Stewardship Alliance Coordinating Committee and Federation of Earth Scientists Information Partnership (ESIP) Executive Committee. He has been a Senior Presidential Fellow with the Council on Library and Information Resources, a Lecturer in the Department of Computer Science at Johns Hopkins and a Research Fellow at the Graduate School of Library and Information Science at the University of Illinois at Urbana-Champaign. He is the recipient of the 2012 OCLC/LITA Kilgour Award.
References
[1] | G. Choudhury, The virtual observatory meets the library, The Journal of Electronic Publishing 11(1) (2008). doi:10.3998/3336451.0011.111. |
[2] | C. Duhigg, How companies learn your secrets, The New York Times, February 16 (2012), http://www.nytimes.com/2012/02/19/magazine/shopping-habits.html?_r=0, (last checked June 19, 2016). |
[3] | J. Holdren, Increasing Access to the Results of Federally Funded Scientific Research, Office of Science and Technology Policy, Washington DC, (2013) , https://www.whitehouse.gov/sites/default/files/microsites/ostp/ostp_public_access_memo_2013.pdf, (last checked June 19, 2016). |


