Analyzing usage: Visualizing end-user workflows to drive product development
This article illustrates the importance of harvesting usage analytics to improve user experience on a platform. In the shift from print to digital, user engagement has replaced content as the key contributor of growth. Visualizing end-user workflows through a content platform allows organizations to understand what features contribute to higher engagement or just clutter the interface and negatively affect usage.
1.Introduction
Publishing has gone through tremendous change in the past ten years, as we have transitioned from print to digital. In the past when publishing was print-based, one could argue that content was king. If publishers produced exceptionally good content it would sell and the company would thrive, but the digital transformation has created a new reality where the user is king.
Content is still important, but if it is not discoverable within an intuitive user interface then customers will seek alternative services for their content needs. How do we build products so that as publishers we do not just become PDF repositories? How do publishers build a platform that is intuitive, but not cost prohibitive? How do we put the user at the very center of what we do?
2.Understanding our users
In the past, companies relied on an approach that consisted mainly of “asking” users what they wanted and using the depth of experience internally at publishing houses to build high-quality content that met customers’ needs. Very little thought went into distribution as it was, for the most part, one dimensional.
In this reality, companies conducted focus groups, surveys and face-to-face interviews. The results were then interpreted and disseminated. This was an ongoing process that was labor-intensive and expensive.
We now need to complement this approach with one where we “watch” and “study” user behavior. In this approach we understand how the delivery system can positively or negatively affect engagement. The content is the destination, but publishers have the power to provide end users with an enriching journey.
3.Visualizing end-user workflows
There is no better way to create an enriching content environment than to study how customers behave. Visualizing end-user workflows gives product managers and publishers insights that lead to innovation.
Therefore, every publishing company should have an accessible system to track and analyze customer usage. Delivery is as important as the content itself. There are three key areas I would like to discuss in order to highlight the value of usage analytics.
Where are my end users coming from? How do users behave in a platform? What drives engagement? And what creates disengagement? How do I make my platform more efficient for users?
4.Where are my end users coming from?
When visualizing end-user workflows, the first thing you would logically study is where users are coming from. What percentage of customers comes from Google versus a direct link in a learner management system? What is the geographic makeup and how has that changed over time? This can lead to actionable improvements in product development as well as allocating the right resources and funds to drive discoverability. If your user base from Asia has double-digit increases you might want to invest in supporting Asian characters in search queries.
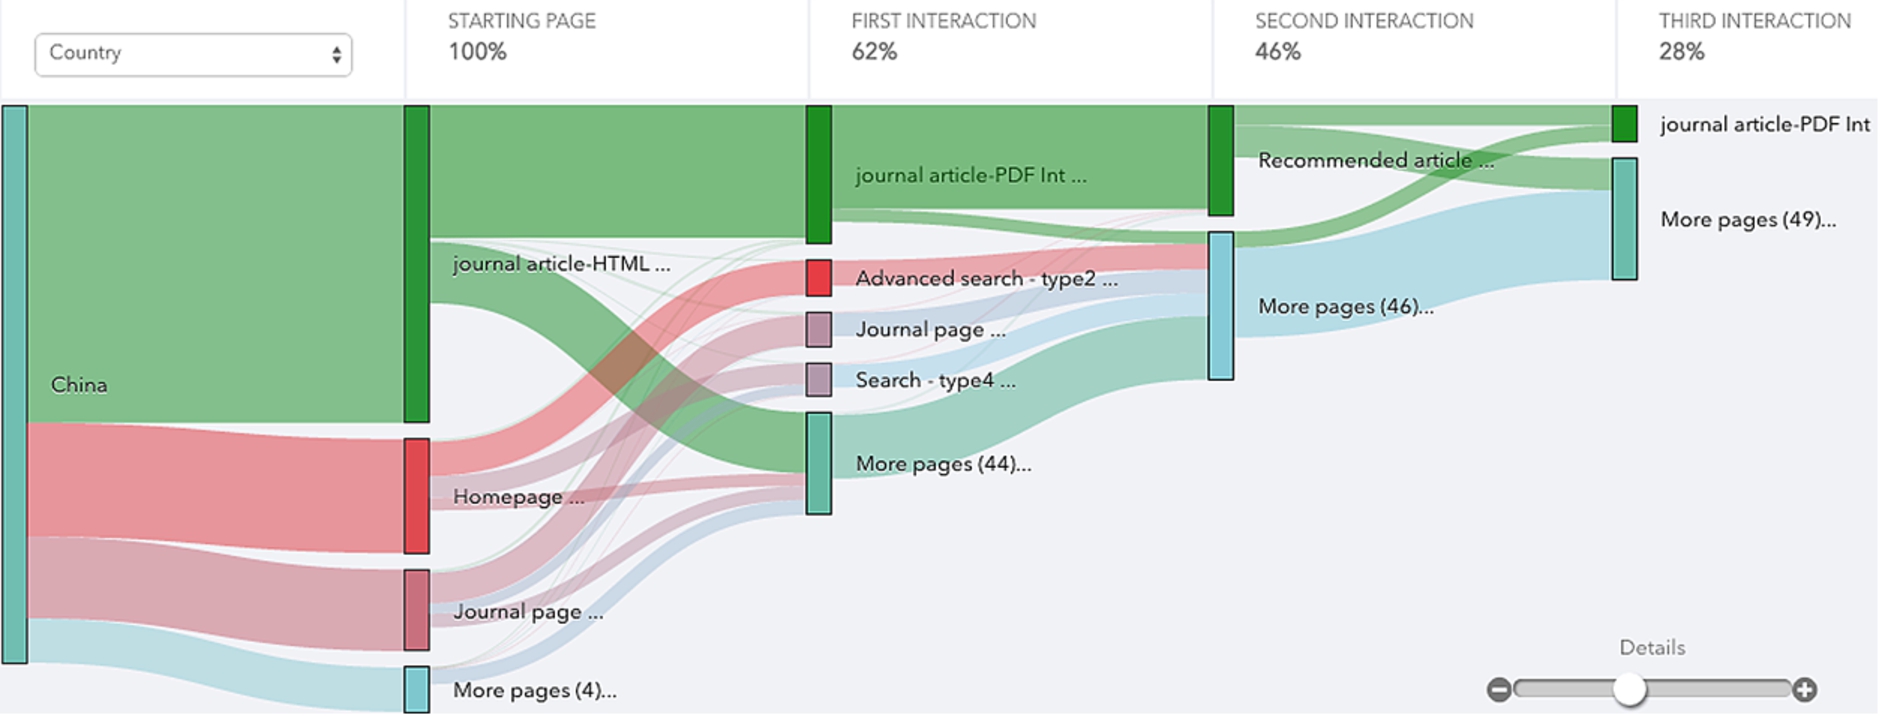
To highlight this, the example below shows the flow through a platform from users based in China. See Fig. 1. The interactions are color coded as follows: green for a favorable interaction (higher % of article views) and red for an unfavorable interaction. By looking at this example, we can easily see that traffic through the homepage resulted in a lower percentage of article views. This visualization helps the product manager quickly identify where the problems reside and further investigation will lead him/her to conclude that one problem is the inability to support Chinese characters in an advanced search.
Fig. 1.
End-user workflow flow through a platform by country. (Colors are visible in the online version of the article; http://dx.doi.org/10.3233/ISU-150770.)
How do users behave in a platform? What drives engagement? And what creates disengagement? In this digital age it is imperative to study user behavior in order to determine what drives user engagement and what does not. Asking customers is not effective.
Platform technology teams at publishing companies are under tremendous pressure to both build out features to increase engagement and keep the environment intuitive. This tension will not go away, but can be mitigated by building out delivery platforms in a reiterative way, with many small changes over a quick period of time versus the larger yearly update that forces users to relearn how a platform works.
Product managers and publishers need to visualize end-user workflows to see if new features contribute to higher engagement or just clutter the interface and negatively affect the user experience. Does embedded media in an article (which is expensive to build) drive engagement, or do people drop off articles with lots of video? Does advanced search work? How about links to recommended articles?
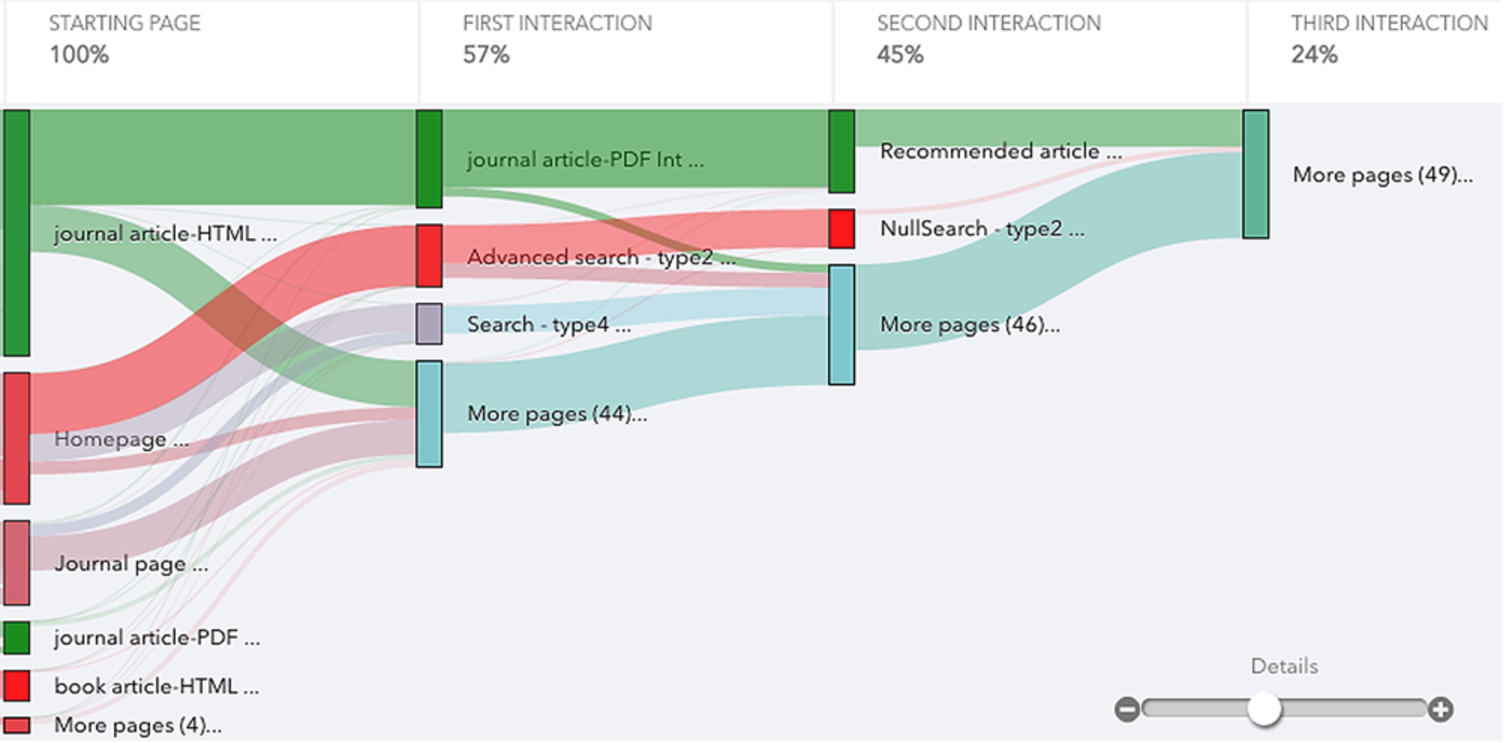
In the example below we can see users will click on links to recommended articles which results in a positive outcome (green) and drives engagement (they will visit more pages on the website based on the recommended article links), whereas advanced search leads to null search results and users drop out of the platform creating disengagement. See Fig. 2.
Fig. 2.
The start of end-user workflow flow through a platform at the first interaction. (Colors are visible in the online version of the article; http://dx.doi.org/10.3233/ISU-150770.)
5.How do I make my platform more efficient for users?
Publishers need to familiarize themselves with the most common paths through their content platform and then investigate ways to make them more productive. Are your users spending too much time searching for what they need? How about the login process?
Creating efficiencies in a cost-conscious company can only be realized when publishers prioritize on where the majority of customers spend time. Path analysis can quickly pinpoint trouble spots in the most common paths through a website.
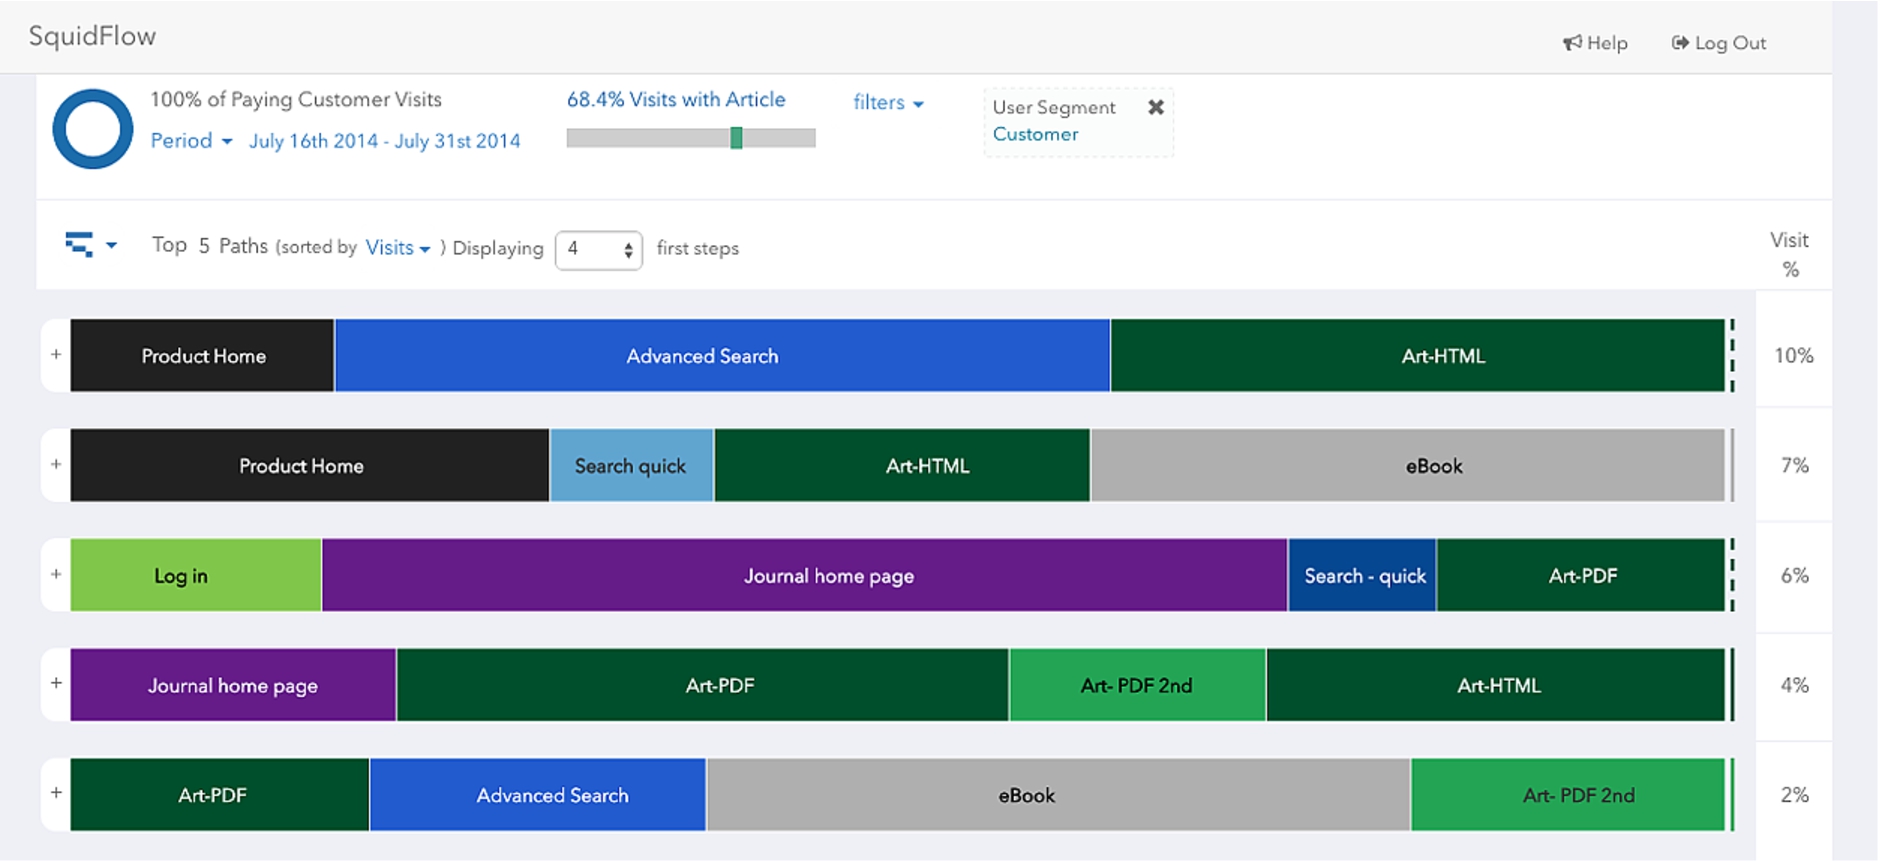
The example below targets the five most common paths through a platform and the percentage of visits they represent. The different colors represent an action or step within the path and the length of time it represents. See Fig. 3.
You can clearly see that in the first path users are spending too much time on searching for articles. In the second path users are getting to the article quicker, suggesting that quick search functions much better than advanced search. Visualizing end-user workflows in this way allows publishers to make common journeys more efficient, increasing customer satisfaction.
Fig. 3.
The five most common user paths through a platform. (Colors are visible in the online version of the article; http://dx.doi.org/10.3233/ISU-150770.)
Publishers have successfully made the transition to digital, but now need the proper tools to study user behavior so they can constantly make improvements in the user experience. User behavior will change over time and will vary depending on a number of factors too long to list. Visualizing end-user workflows will inevitably be an essential part of any successful publishing venture.
About the author

Pierre Montagano has worked for over 15 years in publishing in both sales and marketing at Pearson, McGraw-Hill and Cambridge University Press. He has extensive experience working with platform technology teams in developing next generation products paying special attention to user interface and user experience. He is currently the Business Development Director for Squid Solutions www.squidsolutions.com. He can be reached at Twitter @pierre_montagan.