
The role of open government data and co-creation in crisis management: Initial conceptual propositions from the COVID-19 pandemic
Abstract
During the COVID-19 pandemic, open government data (OGD) was often used as a valuable crisis management resource. Unfortunately, there is limited research that explores how OGD can be used during times of crisis as a crisis management tool. To ensure that OGD can be used effectively in future crises, there is a need to understand how it may be used and what benefits its usage may bring. This paper brings new insight into this topic by conducting a comparative exploratory case study of three Central and Eastern European (CEE) countries – Czech Republic, Estonia and Latvia, where OGD was used at different levels to help manage different aspects of the COVID-19 pandemic. As a result of this research, three contributions are made: (1) it integrates OGD into previous crisis management literature, offering new and initial conceptual propositions; (2) it demonstrates how OGD enables the co-creation of new services that create public value during times of crisis; and (3) it provides empirical examples of OGD-driven co-created services.
1.Introduction
There is a growing body of research on the topic of open government data (OGD) and research has explored how the usage of OGD may bring about numerous benefits (Janssen et al., 2012; Kucera & Chlapek, 2014; Safarov et al., 2017; Ubaldi, 2013). One benefit that is often discussed in relation to OGD is its ability to drive data-driven innovation and the development of new services (Janssen et al., 2012; Jetzek et al., 2014). For example, research has shown that OGD can drive and enable new digital co-creation processes for digital public service development, which ultimately have the potential to create public value (Khayyat & Bannister, 2017; McBride et al., 2019). While there are numerous approaches to conceptualizing and understanding co-creation, in this paper, co-creation is understood as “a process through which two or more public and private actors solve a shared problem, challenge, or task through a constructive exchange of different kinds of knowledge, resources, competences, and ideas that enhance the production of public value” (Torfing et al., 2019, p. 55). Unfortunately, research that empirically examines the OGD-driven co-creation process is still rather limited, providing a clear opportunity and need for research.
It is from this need for research that this paper emerged. It offers new understanding into how OGD enables and drives the co-creation of new services and, in the process, creates public value within the context of a crisis – specifically the COVID-19 pandemic. The research started from several observations: in previous crises (such as floods and forest fires) OGD had seen use (Azevedo et al., 2015; de Mendonça et al., 2015; Shidik & Ashari, 2014), that during the COVID-19 pandemic OGD was being released in large amounts, and COVID-19 related OGD were being reused consistently. During the earliest stages of the pandemic research was conducted that explored the adoption and implementation of data-driven innovations and services during the COVID-19 pandemic (Brem et al., 2021; Dahlke et al., 2021; Grinin et al., 2021; Sampaio et al., 2022; Nikiforova, 2020, 2021; Alamo et al., 2020; Maione et al., 2021; Khan, 2021), but this research often focused only on new services, datasets released, or the potential value that has been created from these services. Research that explored the role that OGD specifically played in the crisis management process was missing.
While there are several different understandings of a crisis, for example both a political scandal or a natural disaster could be considered a crisis, this paper is concerned primarily with crises that have a potential to directly and negatively impact large number of individuals; this would include natural disasters, conflicts, or – like COVID-19 – public health crises. The common factors for these crises being that there is a large divergence from normal operating conditions, there is risk to wellbeing, and that these risks must be managed quickly and, often, with only limited information available. In such a situation, OGD may play an important role by aiding in the creation, collection, and dissemination of information, thus creating new opportunities for service co-creation, potentially aiding in the management of a crisis.
To generate new insight into how OGD was used during the COVID-19 pandemic as a crisis management tool a comparative exploratory case study was conducted, focusing on three Central and Eastern European (CEE) countries: Czech Republic, Estonia, and Latvia. The CEE region is united by a shared history, traditionally lower levels of administrative capacity, and the relative newness of their public administrations (Bouckaert et al., 2011; Randma-liiv & Drechsler, 2017). Within this context, technology is often embraced to subsidize missing capacities, unsurprisingly, many CEE countries are viewed as leaders when it comes to the use of digital technologies by the public sector (Randma-Liiv & Drechsler, 2017). In the case of the selected countries for this research, all three belong to the very high e-government development index grouping in the United Nation’s e-Government Development Index.11 Taken in totality this provides an ideal context for exploring how OGD could be used during a crisis – states that are already used to using digital technologies in their administrations, often to overcome strategic shortages or skill gaps in their administrations, which may provide incentives for administrations to engage in co-creation.
With the cases selected, two primary research questions were formulated and used to drive the study:
RQ1: What is the role of OGD in crisis management? RQ2: How does OGD influence the co-creation of services that assist in crisis management?
In conducting the research to answer these questions, three clear contributions emerged. First, this paper provides new insight into the role that OGD may play during times of crisis and offers initial conceptual propositions about the role of OGD in the crisis management process. As a second contribution, this paper provides new empirical exploration into how OGD drives the co-creation of new services. Third, the paper empirically demonstrates the potential that OGD has when it is released and used. Ultimately, this paper aims to be of use both to practitioners who may be directly involved in the management of a crisis or in the management of an OGD initiative, for academics interested in studying the impacts of OGD or crisis management, and also for citizens to see how they can play an active role in co-creation processes and thereby create value.
2.Background literature
2.1Crisis management
A crisis can be defined as “a serious threat to the basic structures or the fundamental values and norms of a social system, which under time pressure and highly uncertain circumstances – necessitates making critical decisions” (Rosenthal et al., 1989, cited in Rosenthal & Kouzmin, 1997, p. 280). Crisis management can be further understood as “the processes by which an organization deals with a crisis before, during, and after it has occurred” (Christensen et al., 2016, p. 888).
A crisis is a strenuous time for any public administration, as they often have “prepared neither themselves nor the public for appropriate responses once tragedy strikes” (Rosenthal & Kouzmin, 1997). Additionally, bureaucratic institutions that are slow by design are now required to work in an increasingly adaptive way (Janssen & van der Voort, 2020) with time-sensitive and critical decisions needing to be made – often without discussion. This forces institutions and administrators into the realm of the unknown, where laws, regulations, and standard procedures are no longer valid (Boin & Lodge, 2016). In these situations, it could be said that crisis management would be better handled by organizations that are able to be more adaptive or flexible with their arrangements (Boin & McConnell, 2007; Comfort, 2007). One way that has been highlighted in the literature to improve adaptability and flexibility is through the adoption and usage of digital technologies, particularly those that allow for data and information to be gathered, analysed, and utilized by decision makers (Comfort, 1993; Moynihan, 2008; Pan et al., 2008). If true, then one key component to any crisis management strategy must involve clear processes for obtaining, releasing, and using data and information.
Figure 1.
Crisis management process (Pearson & Clair, 1998).
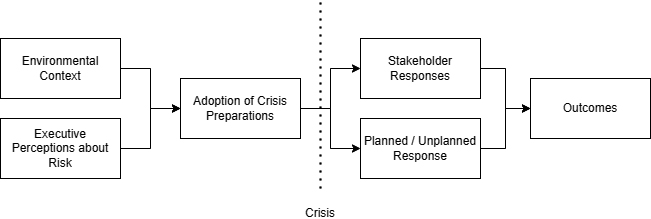
When looking at the actual process of managing a crisis there are several ways it may be conceptualized. For example, in the context of the COVID-19 pandemic, Zheng et al. (2021) draw on Fink’s crisis lifecycle model that includes four stages: (1) prodromal, (2) acute, (3) chronic, and (4) resolution, which maps out the entire crisis process from start to resolution. That model is based, at least in part, on research from Pearson and Clair (1998) that conceptualized the crisis management process that integrates viewpoints from “psychological, social-political, and technological-structural perspectives” (p. 59). For Pearson and Clair (1998), the crisis management process (shown below in Fig. 1) is influenced by the environmental context and administrative crisis preparations, and consists of the planned responses to a crisis as well as the individual and collective reactions to a crisis. For this paper, the model proposed by Pearson and Clair (1998) was selected as the basis for understanding the crisis management process. How this model relates to OGD and co-creation is further explicated in the following section.
2.2OGD, OGD-driven co-created services, and COVID-19
2.2.1OGD and the COVID-19 pandemic
OGD is data provided by a government, under a reusable license, in human- and machine-readable format, released without discrimination or cost to the public (Ubaldi, 2013). Research dealing with OGD has often found that there are many benefits associated with the use and release of OGD, such as economic benefits, transparency, accountability, innovation, etc. (Hansen & Schrøder, 2019; Janssen et al., 2012). However, as Janssen et al. (2012) have highlighted, in order for OGD to actually create some value or benefit, something must be done with it. During the COVID-19 pandemic OGD was used. It created value.
One of the most comprehensive reviews on the use of OGD during the COVID-19 pandemic emerged from a cooperation between TheGovLab and the OECD, which released a report titled “Open Data in action. Initiatives during the initial stage of the COVID-19 pandemic”. That report argued that the COVID-19 pandemic “increased the demand for access to timely, relevant, and quality data” and that “during the initial stage of the COVID-19 pandemic, many governments were active in promoting OGD, both in terms of releasing data and re-using them to build different types of data products” (Gonzalez-Zapata et al., 2021). The studied applications and services built on top of OGD were, primarily, focused specifically on the public health aspects of the pandemic and were primarily citizen focused and oriented towards providing updates and situational awareness (Gonzalez-Zapata et al., 2021). Though many of these services were being supported, built, and maintained by governmental organizations, many non-governmental stakeholders also played an active role. An interesting example of this early in the pandemic was seen in Italy (Fig. 2), when an OGD user remarked on 10 March 2020 that the government had made data available, numerous developers were already contributing, and that it was something previously unseen at such a scale.
Figure 2.
Tweet showing interest in OGD and co-creation at earliest stages of the pandemic. Source: https://twitter.com/Zizzamia/ status/1237258789973188608.
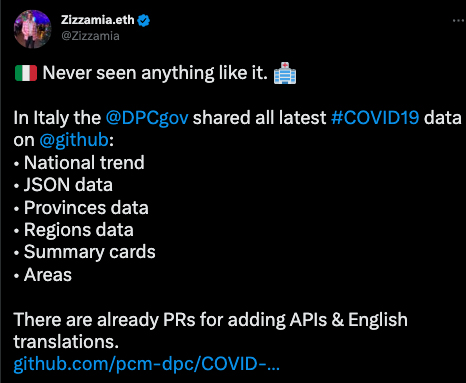
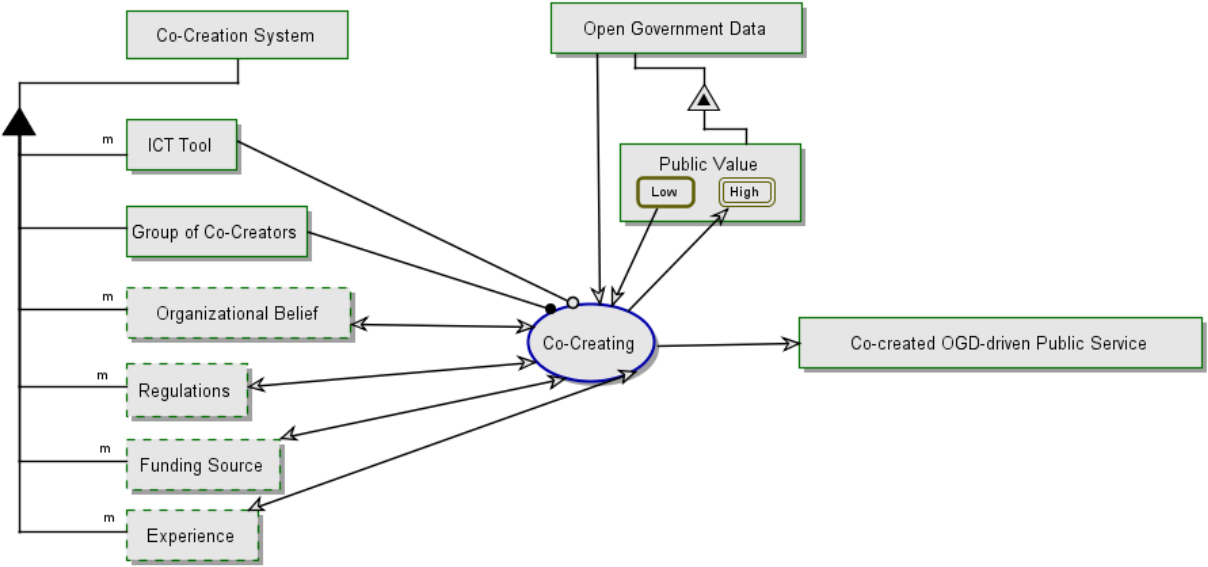
Figure 3.
OGD-driven co-created public service system. Source: (McBride et al., 2017).
Similarly, academic organizations also began to quickly collect, gather, clean, and provide new insight based on OGD from around the world. For example, the University of Oxford launched a Government Response Tracker, Johns Hopkins University quickly created a map to easily visualize the spread of COVID-19 around the world, and journalist organizations such as the Financial Times and the New York Times used OGD to conduct statistical analyses and provide daily updates to concerned readers about COVID-19. OGD was being released, OGD was being used, services were being co-created from OGD, and OGD was creating value at a global scale.
2.2.2OGD-driven co-created services
One clear way that value can be created from OGD is through the development of new services, and this is especially the case when services are co-created. There is increasing research focusing precisely on services of this nature – OGD-driven co-created services (Jarke, 2019; Khayyat & Bannister, 2017; McBride, Aavik et al., 2019; Mergel et al., 2018). An OGD-driven co-created service may be defined as a service that is “producing public value, that rely on OGD, and have been developed by stakeholders from different groups coming together in a co-creative process” (McBride, Aavik et al., 2019). The OGD-driven co-creation process can be conceptualized within a broader ecosystem (Dawes et al., 2016; Harrison et al., 2012), that consists of the ICT tools used to build the service, the data, the co-creator(s), and the environmental factors that influence this ecosystem (McBride, Toots, et al., 2019).
OGD is often viewed from an ecosystem perspective, with Dawes et al. (2016) clearly outlining the dynamics that exist within such an ecosystem. In this paper, the focus is on the OGD co-creation ecosystem, rather than OGD more broadly, and is shown above as Fig. 3. This ecosystem model was developed as part of an international research project, developed iteratively, and empirically tested and validated with several cases (McBride et al., 2017). The figure shows that the co-creation process requires a co-creation system that consists of ICT tools and a group of stakeholders who will perform the co-creation, is influenced by organizational beliefs, regulations, funding, and previous experience, and that by “co-creating” a new OGD-driven public service it is possible to create value from OGD.
2.3Summary and initial conceptual propositions
Reflecting on the existing knowledge and relevant background research a clear line of argumentation begins to emerge. First, crises are hard. To overcome these challenges organizations must have data for the decisions they need to make, and they must have the capacity to make decisions based on this data. As demonstrated during the COVID-19 pandemic, OGD can play an important role in the crisis management process. However, for the future, this process must be better understood, institutionalized, and strategized as it is likely the case that OGD may be used as a tool to better navigate future crises.
Starting with the process outlined in Fig. 1, it is possible to identify two concrete areas where OGD and co-creation with OGD occur in the crisis management process – in the stakeholder responses and in the planned/unplanned responses. When a crisis occurs, individual and collective reactions are triggered (the co-creation of new services would fall under this dynamic) additionally there are the planned and ad hoc responses (the release of OGD would fall under this dynamic). Thus, the model can be extended within the context of OGD as shown above in Fig. 4.
Figure 4.
Open government data driven co-creation during crises. Source: Authors, extended from (Pearson & Clair, 1998).
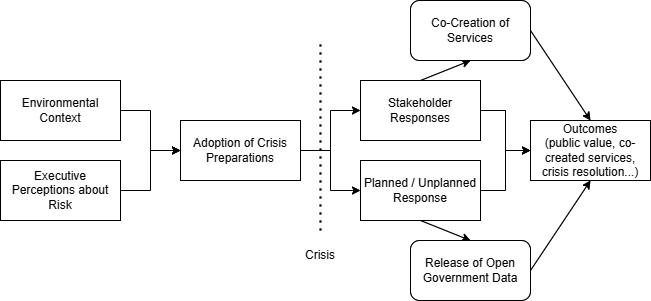
The effect that OGD will have on the crisis management process will also likely be influenced by the environmental context, for example, does the organization have experience with releasing OGD or co-creation?
Based on this initial overview of the literature, and in attempting to synthesize the initial insight from the theoretical and contextual background, several themes and arguments can be identified:
• first, the literature argues that OGD can help governments respond to crises by decreasing barriers for information exchange and increasing the rate and span of information exchange (Comfort, 1993; Moynihan, 2008; Pan et al., 2008);
• second, the availability of OGD during crises may drive the development of new ecosystems that focus on the co-creation of OGD-driven services (Toots et al., 2017), especially during times of crisis;
• third, in this newly created ecosystem, stakeholders will naturally emerge to engage in OGD co-creation together with the government to help manage a crisis (Scognamiglio et al., 2022);
• fourth, during a time of crisis, these services are likely initiated by the release of OGD from the public sector, driven and developed by non-governmental stakeholders, and likely focused externally towards information dissemination (Gonzalez-Zapata et al., 2021).
These arguments will form the basic framework for analyzing the cases conducted for this research and it is through this discussion and exploration that the research questions may be answered so that the paper’s contributions may emerge.
3.Methodology
For this research, a holistic comparative exploratory case study approach was used (Yin, 2018). Exploratory case studies are especially useful when there is a need to develop new hypotheses and propositions, particularly when the issue of study is a contemporary issue with limited empirical information available (Eisenhardt, 1989; Yin, 2018, Chopard & Przybylski, 2021). In this paper the unit of analysis is the usage of OGD during COVID-19 pandemic, not each individual application or solution. Rather, this paper is concerned with the overall ecosystem and process within each country (Czech Republic, Estonia, and Latvia).
While the case selection was justified and discussed previously, it must be highlighted that in the case of both Estonia and Latvia authors of this research had direct involvement with the country’s OGD initiatives surrounding the COVID-19 pandemic. While this does raise potential issues for the objectivity of the research, it is also well established that having direct insight and observation of the object of study offers important insight that may not otherwise be available to the scholarly community (Yin, 2018). To prevent any potential for bias numerous sources of empirical evidence were used to triangulate the findings. Furthermore, during the data analysis for each case the data was reviewed individually by each of the authors and the conclusions drawn compared to further improve objectivity in the analysis of the results.
The data utilized included: the OGD provided related to COVID-19 within each respective country, physical artifacts (the OGD-driven co-created services and applications built during the pandemic), government documents, press releases, statistical reports, news articles, participant involvement and direct observations. Data were collected and archived over the more than two-year duration of this study (March 2020 to September 2022). To analyze the data, several approaches were used. For the physical artefacts and the OGD released particular attention was paid to what data were being released, the size of the data, number of datasets available on the portal, the datasets being used by the application, the contributors to the application (for example, by monitoring public GitHub pages), and the usage of the application. Textual data, e.g., news articles and press releases, were analyzed for mentions of either OGD or the co-created applications. By analyzing data in this way, it is possible to construct a timeline of the pandemic and its management, including key events such as political and policy changes as well as releases of OGD or the launch of a new co-created application.
4.Case overview
4.1Czech republic
4.1.1Availability of data
Data related to the COVID-19 pandemic are primarily collected by the Institute of Health Information and Statistics of the Czech Republic and regional hygiene stations. The datasets related to the COVID-19 pandemic are then published by the Ministry of Health of the Czech Republic through the OGD portal. In addition to this main portal, OGD related to COVID-19, and services built on top of these data, can be found in portals at different levels of government – for example, at the municipal level. Though actual OGD does exist in these portals, many other relevant datasets related to COVID-19 required permission to access. The datasets that were released for reuse and, therefore available openly for co-creation, were those describing characteristics related to epidemiology, hospital-based care, and vaccination (Komenda et al., 2022). Due to the access restrictions set on several datasets, most services built in the Czech Republic that relied on OGD (and additional restricted datasets) were developed by public authorities or academics, limiting the potential opportunities for widespread co-creation.
4.1.2Developed solutions
The development of OGD solutions relevant for crisis management in the COVID-19 era can be described in the context of two phases. The first one is bounded by the time when first positive cases were identified and the second during the time when the vaccination process had begun. At the beginning of the pandemic, the government created an interactive web-based application that summarized the important information in the form of maps and charts. This service included an option to download the relevant datasets as OGD (Komenda et al., 2020). However, as OGD available for download were limited only to selected administrative levels, there were no significant OGD-based services developed at the start of the COVID-19 pandemic.
The official web-based application is called Onemocnění aktuálně and was developed and launched in March 2020. This service provides the official numbers including basic overview, vaccinations, cumulative reports, etc. Open datasets are available for each category of numbers as well as widgets for websites. Thus, these statistics are reused in both these forms by other websites, such as news sites (seznam.cz, aktualne.cz), to provide the value as a trustworthy source of information for the public and media.
The second phase was represented by solutions that reuse OGD about vaccination. Many of these services were created as the government’s solution for displaying vaccination-related statistics was not well developed. One of the most widely used services was developed within the OpenDataLab project and was launched in January 2021, providing important information related to vaccinations. The website provided data and displayed the statistics of the vaccination points including average time between registration and booking of a specific date, types of COVID-19 vaccines available, etc. Various dashboards were also developed by the Central Bohemian Region, which visualizes the numbers of citizens’ registrations in the central reservation system and the number of people who already have a vaccination date. The Smart data portal of Prague and Data portal of Brno also enable access to visualizations about COVID-19 via their platforms.
4.1.3Case summary
Looking at the release of OGD in the Czech Republic, and the development of OGD-based solutions, within the context of the COVID-19 pandemic it is possible to identify some interesting occurrences. First, the Czech government made the conscious decision not to release many datasets in an open format due to the desire to limit the potential of misinterpretation of the statistics. This shows that there may be some reluctance amongst governmental stakeholders to open the crisis management process. Second, when it comes to OGD-based and co-created solutions, many services were only created after initial governmental efforts failed (e.g., related to vaccination statistical visualization). This seems to imply that OGD and the co-creation of services may be more likely to occur in the absence or poor performance of a government-backed solution.
4.2Estonia
4.2.1Availability of data
At the beginning of the COVID-19 pandemic in Estonia there was a clear interest from numerous stakeholder groups in helping the public sector manage the crisis. However, as described in the newspaper article “Scientists and Experts are not able to help the country with the coronavirus crisis as they will not provide us with data” (Laine et al., 2020), the Estonian government was not providing data. This was somewhat surprising due to Estonia’s image as a leader in digital government (Kalvet, 2012; McBride, 2021). When data did start to be released, they were only available in the press releases from Terviseamet (Estonian Health Board). This triggered interested stakeholder groups such as academics and NGOs (non-governmental organizations) to crowdsource a database of statistics, which were subsequently transformed into graphs and visualizations. Eventually the government began to make data available as an Excel file on the national OGD portal, though this was improved further when the Ministry of Social Affairs’ information technology unit created an API for COVID-19 related statistical information.22 These data are directly generated from the Estonian e-Health information system and updated daily. Data are available across numerous dimensions such as hospitalizations, total tests, test results, vaccinations, and these dimensions could be further viewed by age groups, time, location, and gender.
4.2.2Developed solutions
In Estonia there are three primary examples related to the use of OGD for the management of the COVID-19 pandemic. The first is known as Koroonakaart.ee and is a data visualization platform that was developed as part of the Hack the Crisis hackathon that was organized early on during the start of the emergency situation in Estonia. This dashboard was developed initially by a group of citizens who wanted to help provide insight into the spread of the virus in Estonia but was eventually brought underneath the organization of Open Knowledge Estonia, an NGO. This service was used by the government, promoted by the prime minister and other key crisis managers, and utilized by all major press outlets. Though this service was popular with the government and citizens at the beginning of the pandemic, the Health Board eventually developed their own solution (closed source, using Tableau, but relying on OGD) which became more widely used. At its peak in March of 2020 koroonakaart.ee recorded a maximum of 50,000 unique daily users, by September of 2022 it was less than 200.
A second example of how OGD was used to co-create and develop solutions comes from the University of Tartu. Researchers at the University created many applications under the domain koroona.ut.ee. Several different visualizations were developed by researchers, utilizing OGD, and done with the intention of helping decision makers. These developments, and the research accompanying it, were funded by private donations from members of the Estonian public. Though the tools have not been as used by the public as koroonakaart.ee, they still strongly demonstrate how different stakeholders can come together to develop new OGD-driven services and were well funded by individual donators.
The final example of how OGD was used to assist in the management of the COVID-19 pandemic in Estonia is related to the work of the Estonian science council,33 but particularly the work of statistician Krista Fischer. To help give decision makers a more comprehensive and scientific-based overview of the pandemic in Estonia, several visualizations and statistical analyses were prepared.44 Such visualizations utilized and relied on OGD and provided critical input to decision makers. However, due to the relevance and importance of such information, these graphics and the analysis of the scientific council were highly utilized and sought after by the press to better articulate to the public what the country could expect in the future from the pandemic.
4.2.3Case summary
From these examples it can be seen that in Estonia there was a demand for OGD from the beginning of the pandemic. However, it is also possible to see that, when it comes to releasing data during a crisis, it is of paramount importance that it is of high quality and reliable. If there is a crisis, and OGD is released, and it is accurate it will be possible for new solutions to be co-created that assist in the crisis management process.
Looking back to the beginning of the pandemic and the relevant created solutions, over time interest and interaction with the developed tools faded. There are several mechanisms that likely influence this. First, the government made a conscious decision to stop releasing COVID-19 data in an open format daily and switched to a longer release schedule. Additionally, there was an accompanying decrease in interest in accessing the created solutions and data as the influence of the pandemic on everyday life began to decrease. Finally, most developed services were the primary responsibility of a few volunteers and, when interest began to fade in the services, the motivation to maintain them decreased. Interestingly, as observed in the Czech Republic, the absence of governmental solutions gave rise to a data visualization service, but, when the government service became available, the co-created solution diminished in use. This seems to further imply the importance of governmental involvement, as well as how the absence of a governmental solution can “activate” stakeholders to create new OGD-driven services.
4.3Latvia
4.3.1Availability of data
The Latvian Open Data Portal provides six datasets related to COVID-19, five of them are focused on the situation only in Latvia and one provides data on the number of cases in other countries. These datasets are provided by two data publishers: the Center for Disease Prevention and Control and the National Health Service of the Republic of Latvia.
All datasets are provided in a machine-readable format under CC0 license55 Regarding the timeliness of the data, the first datasets were published with a delay of one month, with improved results for vaccination data opened in a week after vaccination began. However, both results of the COVID-19 related OGD release are relatively good compared to other countries (Nikiforova, 2020, 2021).
In 2021, Latvia-related datasets were updated daily, while the dataset that covered other countries was updated weekly. However, with time, maintenance of some of these datasets was paused.
As with many other countries, the provision of COVID-19 open data has also increased the popularity of Latvia’s open data portal, where the relevant datasets have quickly become the most popular datasets on the portal in 2021. In 2022, however, their popularity decreased and only one COVID-19 dataset ranked as the 2
4.3.2Developed solutions
In Latvia, there are several examples related to the use of OGD for the management of the COVID-19 pandemic.
The first example, which gained international popularity, and is also the only solution mentioned by the Latvian open data portal, is the “Apturi Covid” (“Stop Covid”) contact tracing application.66 This application was released at the end of May 2020 for both Android and iOS. The app lets the user know if there was a contact with a positive COVID-19 patient, when their device also had the app installed. Although it is not a fully OGD-based application, it utilizes them – connects to the OGD portal on a daily basis and retrieves the most up-to-date data to be provided to app users. Thus, OGD are mainly used as supplementary data (secondary data) that are informative in nature.
Another example of an OGD-based service related to the crisis in Latvia is a fully open data-based solution that provides an interactive dashboard for COVID-19 statistics.77 This data visualization service was one of the first in the country and is an example of a co-created service that was driven primarily by citizens/open data enthusiasts as well as academia. This service allowed users to manipulate data in numerous dimensions. Compared to other visualizations created in 2020, this website allows users to gain an insight in (almost) real-time, i.e., data are retrieved from the Latvian open data portal. Its support was discontinued in 2023.
A third example is the informative page on the spread of COVID-19 in Latvia, which has been developed and maintained by the State Chancellery88 with the support and involvement of other governmental stakeholders (Center for Disease Prevention and Control, Ministry of Health, Cabinet of Ministers), which at the beginning were also supported by the public. This page visualized and provided daily updated OGD on COVID-19 in the country. A similar visualization was launched with the reference to vaccination, however, while it is still online, it does not reflect on the current state of affairs since the data supply was discontinued by September 2022. In addition to the above, there was also a visualization service showing the 14-day cumulative incidence of COVID-19 in municipalities,99 but it is no longer active.
4.3.3Case summary
Throughout the duration of the pandemic in Latvia it can be said that there have been initial efforts to make OGD available related to the COVID-19 pandemic. There are also additional examples of how such data have been used by both governmental and non-governmental stakeholders, including some examples with the reference to the open data journalism.1010 Furthermore, there are clear examples of services that have been co-created. However, it does not appear to be the case that, in Latvia, the government has placed a strong emphasis on engaging in co-creation of OGD-based services. Even more, one of the reasons mentioned during the debates on discontinuation of OGD hackathons for younger people representing Generation Z, was related to the fact that it was assumed that they will be purely COVID-19 related with the high prevalence of dashboards and visualizations. At the same time, when these hackathons were organized, only a few solutions were devoted to it, although some of them were relatively advanced. This, however, demonstrates the value of open data and potential of younger minds as digital natives, but, on the other hand, surprisingly low interest in using OGD in co-creating solutions valuable for pandemic combating (Nikiforova, 2022). All in all, while some services have been created, their level of development and actual impact appear to be minimal.
5.Discussion
This paper began by arguing that OGD was likely able to play a role in the management of crises by enabling opportunities for OGD-driven service co-creation. However, the process in which OGD could be used in the crisis management process was not yet well defined in the literature. This paper remedies this gap by conducting an exploratory and comparative case study into the topic and, because of this exploration, it has been possible to generate new insight and knowledge. As a starting point for this analysis, Table 1 has been prepared, which lists the services identified during this study, the stakeholders involved, and whether the service continued to function throughout the duration of the study. The included services only represent services that were co-created during the pandemic, and those that utilized OGD, while every attempt has been made to be as comprehensive as possible, it is always possible that other services exist that meet both requirements and were not included.1111
To better structure the discussion and the analysis of the cases, the four arguments offered in the background section of this paper are used and presented in the following paragraphs.
The first argument emerging from the literature was that OGD could help governments respond to crises by decreasing barriers for data and information exchange as well as increasing the rate and span of information exchange. Based on this research, there does appear to be support for this argument. In all countries usage of the OGD portal saw clear increases when COVID-19 data were made available and the related datasets also saw large amounts of interaction (e.g., in numbers of downloads). In all countries studied again there were demonstrable examples of how stakeholders outside of the government utilized OGD in some form to either generate models for decision makers or to disseminate information. Thus, it does appear to be the case that OGD does play an important role in enabling new forms of information dissemination during a crisis.
The second argument emerging from the literature was that the availability of OGD during a crisis may drive the development of new ecosystems that focus on the co-creation of OGD-driven services. This finding appears to be only supported in part, and with an important caveat.
For an OGD-driven co-created ecosystem to be sustainable, continual government support and involvement is important.
While, in theory, governmental organizations do not need to play an active role in the co-creation of new OGD-driven services, their support does appear to be critical in maintaining these ecosystems over time. As seen in Table 1, in a clear majority of services studies government was a key or participating stakeholder. This has been seen in previous research as well, where research has shown that “government-led initiatives tend to survive longer than citizen-led initiatives after controlling for multiple mediating factors” (Cingolani, 2021). This observation was also seen in the studied cases. In Estonia, for example, there was a large amount of support from the government at the beginning for co-created solutions, once this support disappeared the usage and maintenance of the co-created systems declined. Similarly, in Latvia and Czech Republic, where governmental support was minimal from the beginning for co-created applications, the impact and quality of the solutions tended to be lower. This also seems to highlight the temporal component for both OGD co-creation ecosystems and public value during crises where, at the earliest stages of a crisis, there is a higher level of co-creation and support, it has a plateau, and then begins to decline over time as the crisis resolves and support for the ecosystem begins to dwindle.
Table 1
Crisis management process (Pearson & Clair, 1998)
| Country | Service name | Type of service | Stakeholder(s) | Link | Is it still active |
|---|---|---|---|---|---|
| Estonia | Koroonakaart.ee | Data visualization | NGOs, government, academia, individual citizens | Yes | |
| Estonia | Koroona.ut.ee | Data visualization, forecast modeling | Academia, individual citizens | Yes | |
| Estonia | COVID-19 Eestis | Data visualization and forecast modeling | Academia, government | No | |
| Czech Republic | Onemocnění aktuálně | Data visualizations and statistics, access to datasets (files, API) | Government, academia | Yes | |
| Czech Republic | OpenDataLab – COVID-19 vaccination | Data visualizations and statistics | Academia, private sector | Yes | |
| Czech Republic | Golemio – Statistics for COVID-19 | Data visualization | Government, private sector | Yes | |
| Czech Republic | Current statistics on the development of the COVID-19 epidemic in the South Moravian Region | Data visualization | Government, private sector | Yes | |
| Latvia | Spread of COVID-19 in Latvia | Informative page with data visualizations and statistics | Government | Yes | |
| Latvia | “Apturi Covid” (“Stop Covid”) | Contact tracing application | Government, academia, and private sector | Yes | |
| Latvia | COVID-19 skaitļos | Interactive dashboard with data visualizations and statistics | Academia, individual citizens | No | |
| Latvia | COVID-19 vaccination statistics | Data visualizations and statistics | Government |
https://covid19.gov.lv/covid-19/statistika/ covid-19-vakcinacijas-statistika | No |
| Latvia | COVID-19 in Latvia by county | Interactive dashboard with data visualizations, statistics, interactive maps | Government |
https://spkc.maps.arcgis.com/apps/webappvie wer/index.html?id=593bb3ab785341d5b64d e7df14125f21 | No |
The third argument emerging from the literature was that in OGD co-creation ecosystems, stakeholders will naturally emerge to co-create new solutions together with the government to aid in the crisis management process. In all three studied cases there were clear examples of how the release of OGD activated interested stakeholders to start co-creating OGD-based solutions together in partnership with the government. Thus, there does appear to be some support for the idea that in a crisis, when OGD is released, co-creation can naturally emerge between stakeholders. However, in all three cases, the actual number of people working on such solutions was low, and those involved are those who have either previous experience with OGD, or those who are already directly involved somehow with crisis management via their occupation. Thus, the success of a given OGD co-creation ecosystem seems to be additionally highly dependent on the presence of individual motivated actors with a higher level of digital skills and competences, particularly those that enable them to effectively work with OGD.
The final argument emerging from the literature was that during a crisis co-created services were likely to be built on top of OGD, driven and developed by non-governmental stakeholders, and likely focused externally on information dissemination. In all three countries studied during this research support was seen for this proposition. However, it is also the case that the government was often playing an active role in the provision of OGD, and the non-governmental stakeholders were more involved with the design and development of the service. This finding seems to hint that it may be the case that certain stakeholders have certain proclivities towards specific roles in the co-creation process. When looking at the actual nature of the services themselves, in the studied countries, most services studied were focused on information dissemination, for example dashboards. Thus, this argument may potentially be reframed as follows: during a crisis governmental and non-governmental stakeholders will engage in co-creation, enabled by OGD, and that the OGD-driven co-created services will primarily focus on information dissemination and visualization contributing to the understandability of the data/information.
Drawing on the above findings, it is possible to answer the primary research questions of the paper. The first question asked what is the role of OGD in crisis management. It can be said that OGD does help public sector organizations with crisis management and that OGD helps by providing a way to increase information availability and dissemination. This is clearly supported by the conducted research. In all three countries OGD was released and made available to the public via the country’s national OGD portals. OGD that was released was used to develop solutions that could be presented to both decision makers and the public to help provide an overview of the current crisis situation, for example, by displaying the number of hospitalizations, the total vaccination rate, or the number of people infected in certain specific geographic regions.
The second research question asked how does OGD influence the co-creation of services that assist in crisis management? To answer this question, it can be said that OGD enables new co-creation ecosystems, and that these ecosystems allow for different stakeholders to cooperate and co-create new services that solve problems directly related to the management of a crisis. This answer is also supported clearly by all three studied cases. The best example of a co-created solution comes from Estonia, whereas the examples in Latvia and the Czech Republic appeared to have lower levels of uptake. There are at least two reasons for this that are apparent from the research. First, in Estonia there was a strong governmental commitment at the earliest stages of the pandemic to utilize citizen co-created solutions, due to missing governmental capacity, this political support was not present in the other two studied countries. Second, in Estonia there were a larger number of stakeholders involved, spanning academia, the private sector, government, and the media, whereas in the other two countries studied, the number of stakeholder groups included was smaller. This demonstrates how previous government experience with co-creation, government commitment to co-creation, and higher levels of involvement from non-governmental stakeholders leads to better co-creation outcomes.
Figure 5.
Crisis management with open government data availability and government co-creation involvement continuum. Source: Authors.
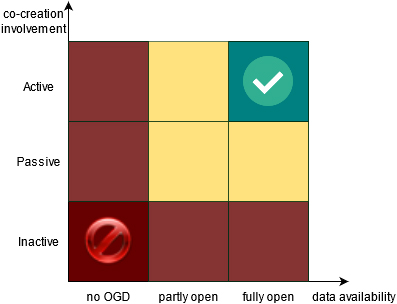
Finally, based on the initial exploration of the cases, it is possible to identify a matrix that maps together OGD, co-creation, and crises. This matrix is shown below as Fig. 5 and consists of two primary dimensions. The first is the involvement of government in the OGD co-creation ecosystem and ranges from inactive to passive to active. The second dimension is the availability of OGD, this ranged from no OGD availability to partial openness to full openness. Important to note for this dimension is that it must also consider the quality of the data that is being provided, for example if a dataset is not accurate, poorly documented, not up-to-date, or not maintained, but it is available, it must not be considered fully open. Depending on where a specific government is within this matrix when responding to a crisis, a different level of impact is likely to emerge, with a different level of sustainability of the co-created services. Importantly, as highlighted in this discussion section, there also appears to be a temporal nature to a country’s path through this matrix. At the earliest stages of a pandemic, when a government is releasing and actively involved in releasing information, it may rapidly shoot up to the top right corner of the matrix, thereby creating a higher level of impact. However, over time as involvement slows, it may start to fall towards the bottom of the matrix, demonstrating a decrease in impact.
One potential explanation for this temporal component can be found in the previous literature on crisis management. At the start of a triggering event, there is not much information available, and many stakeholders are involved as the government begins to handle the crisis. At this stage, many stakeholders may get involved and try to assist – this is especially true when limited information is available. As the crisis goes on, and more data get released as OGD, some initial co-created services will emerge. However, as the crisis continues to go on, and the government gains more control of the situation, the government may begin to reassert itself as the core stakeholder and become passive or inactive in the co-creation process.
6.Conclusion
The results of the research presented in this paper make important contributions for both crisis management and digital government related research by generating new understanding on the relationship between OGD and crisis management. These contributions are made in three core dimensions. First, the paper directly integrated OGD into the previous literature on crisis management, identifying where and how OGD can be used by crisis managers and argues that in addition to increasing the availability of information, OGD is also used in the co-creation of services that subsequently create value for decision makers and citizens alike. While previous research has explored ideas relating to the use of digital technologies for the co-creation of services (Rodriguez Müller et al., 2021; Lember et al., 2019), such research did not directly explore how co-created services could be used as a crisis management tool. Second, the paper builds on existing arguments in the extent literature on OGD and crisis management and tests their veracity through an empirical comparative case study. The third contribution is related to its empirical demonstration of how OGD was released and used in co-creative processes to create important services.
For scholars of crisis management, this paper highlights the potential benefits that engaging with non-governmental stakeholders may have for the management process, particularly in areas dealing with information and data availability. As the availability of data increases, openness becomes increasingly prevalent, and familiarity with data analysis increases it is increasingly likely that co-creation and OGD will become a core tool in the crisis managers toolbelt. Similarly, for scholars of OGD and digital government, this paper provides important insight into important possibilities of OGD reuse, but also highlights the importance of context and governmental support for co-creation.
In addition to the above-mentioned academic contributions, there are also several important recommendations that can be made for practice:
• OGD can aid in governmental communication during a time of crisis, however, it is important that data released are accurate and timely. Special effort must be paid to data quality, including, but not limited to data accuracy, data availability and accessibility;
• Governmental involvement in the co-creation of new OGD-driven services is a key. To fully gain the benefit from such services, it is important to have the necessary experience and capacity in place;
• During a crisis, citizens are motivated to help and can be activated to do so. Releasing OGD can serve this purpose, but there is also a need for an accompanying legal framework to integrate non-governmental input into the crisis management process;
• It appears to be the case that the more stakeholders involved in a co-creation initiative, the more impact it is able to create. To get the biggest benefit from OGD and co-created solutions, new incentives to bring diverse groups of stakeholders together should be developed;
• Sustainability of solutions is important, hence having an agreed plan for the maintenance of a co-created solution from the beginning is necessary.
Though this research does make a number of new contributions to the literature, there are several opportunities for future research that must be explored. During the analysis of the cases two potential risks came to light when OGD was used as a crisis management tool. First, when governments released data in an open format at the earliest stages of the crisis they were often accompanied by mistakes in the data, often due to inaccurate data collection methods or improper data handling techniques. This has an unfortunate effect of lowering trust in the government’s ability to properly manage the crisis. Thus, there appears to be a dynamic at work between a government’s desire to release data in an open format, and their need to appear in control of the situation and in the accuracy of the data being used to drive their decision making. The “quality over quantity” principle seems to remain valid and crucial for the overall success of OGD initiative in the crisis management context (Sadiq & Indulska, 2017). Second, when governments opened up data during the pandemic it was no longer possible to control the narrative or communication strategy for how the crisis was being managed. Future research should explore these dynamic struggles between the desire of the government to use OGD as a crisis management tool, with the desire of the government to maintain trust and control. Similarly, in all three cases there were unclear processes in place for how to engage in co-creation, officially, with non-governmental stakeholders. Further research could be conducted that outlines how to best integrate non-governmental stakeholders into the planned response of government to a crisis.
Another important opportunity for future research is in relation to OGD-driven co-created services themselves. In the current research most of these services were focused primarily on visualization, but there are likely other forms of services that could be utilized and developed to assist in crisis management It is important to establish an understanding of these different forms and how they may be created. In the research several different stakeholder groups were identified as having taken part in the co-creation process, however, exactly which role each stakeholder group played in the co-creation was not well elucidated. It may be the case that certain stakeholder groups are predisposed for certain roles in the co-creation process, for example perhaps the government mainly plays a supervisory role as the data provider, but future research should explore this in more detail. Finally, as a third aspect of future research, there is a clear need to both expand the comparative aspect of this study, moving outside of just one administrative context, and to additionally explore the usefulness of OGD in different crises (for example, financial crises).
Notes
1 Survey available from: https://desapublications.un.org/sites/default/files/publications/2022-09/Web%20version%20E-Gover nment%202022.pdf (last accessed 28 January, 2023).
2 The data and their description may be accessed here: https://opendata.digilugu.ee/docs/#/en/readme (last accessed, 28 January, 2023).
3 The Estonian scientific council was gathered by the Minister of Social Affairs, Tanel Kiik, and included a number of scientists knowledgeable on epidemiology and public health. Together they worked together to analyze the current state of the pandemic in Estonia and provide science-based insight and evidence to the minister to better guide decisions at the governmental level.
4 These can be viewed here: http://www-1.ms.ut.ee/krista/covid/covid_pildid.html.
5 CC0 licenses are often used for sharing OGD, for more information on these licenses see: https://creativecommons.org/share-your-work/public-domain/cc0/ (last accessed 28 January, 2023).
7 Available from: https://covid19-visualisation.herokuapp.com/.
11 As OGD licenses do not necessarily require users mention the usage of OGD, it may be possible that services were created, that these services use OGD, but these services do not declare this usage. This can add additional complication to comprehensively studying services or value generated from OGD.
Acknowledgments
This research has been partly funded by European Social Fund via IT Academy programme (AN).
References
[1] | Alamo, T., Reina, D.G., Mammarella, M., & Abella, A. ((2020) ). Covid-19: Open-data resources for monitoring, modeling, and forecasting the epidemic. Electronics, 9: (5), 827. |
[2] | Azevedo, P.C.N., Bastos, G.S., & Parreiras, F.S. ((2015) ). A linked open data approach for visualizing flood information: A case study of the Rio Doce Basin in Brazil. In 2015 1st International Conference on Geographical Information Systems Theory, Applications and Management (GISTAM), IEEE, pp. 1-6. |
[3] | Boin, A., & Lodge, M. ((2016) ). Designing resilient institutions for transboundary crisis management: A time for public administration. Public Administration, 94: (2), 289-298. doi: 10.1111/padm.12264. |
[4] | Boin, A., & McConnell, A. ((2007) ). Preparing for critical infrastructure breakdowns: The limits of crisis management and the need for resilience. Journal of Contingencies and Crisis Management, 15: (1), 50-59. doi: 10.1111/j.1468-5973.2007.00504.x. |
[5] | Bouckaert, G., Nakrošis, V., & Nemec, J. ((2011) ). Public administration and management reforms in CEE: Main trajectories and results. NISPAcee Journal of Public Administration and Policy, 4: (1), 9-29. |
[6] | Brem, A., Viardot, E., & Nylund, P.A. ((2021) ). Implications of the coronavirus (COVID-19) outbreak for innovation: Which technologies will improve our lives? Technological Forecasting and Social Change, 163: , 120451. doi: 10.1016/J.TECHFORE.2020.120451. |
[7] | Chopard, K., & Przybylski, R. ((2021) ). Methods Brief: Case Studies. Available from: https://www.jrsa.org/pubs/factsheets/jrsa-research-methods-brief-case-studies.pdf. (accessed 28 January, 2023). |
[8] | Christensen, T., Laegreid, P., & Rykkja, L.H. ((2016) ). Organizing for crisis management: Building governance capacity and legitimacy. Public Administration Review, 76: (6), 887-897. doi: 10.1111/puar.12558. |
[9] | Cingolani, L. ((2021) ). The survival of open government platforms: Empirical insights from a global sample. Government Information Quarterly, 38: (1), 101522. doi: 10.1016/j.giq.2020.101522. |
[10] | Comfort, L.K. ((1993) ). Integrating information technology into international crisis management and policy. Journal of Contingencies and Crisis Management, 1: (1), 15-26. |
[11] | Comfort, L.K. ((2007) ). Crisis management in hindsight: Cognition, communication, coordination, and control. Public Administration Review, 67: (SUPPL. 1), 189-197. doi: 10.1111/j.1540-6210.2007.00827.x. |
[12] | Dahlke, J., Bogner, K., Becker, M., Schlaile, M.P., Pyka, A., & Ebersberger, B. ((2021) ). Crisis-driven innovation and fundamental human needs: A typological framework of rapid-response COVID-19 innovations. Technological Forecasting and Social Change, 169: , 120799. doi: 10.1016/J.TECHFORE.2021.120799. |
[13] | Dawes, S.S., Vidiasova, L., & Parkhimovich, O. ((2016) ). Planning and designing open government data programs: An ecosystem approach. Government Information Quarterly, 33: (1), 15-27. |
[14] | de Mendonça, P.G.A., Maciel, C., & Viterbo, J. ((2015) ). Visualizing Aedes aegypti infestation in urban areas: A case study on open government data mashups. Information Polity, 20: (2–3), 119-134. |
[15] | Eisenhardt, K.M. ((1989) ). Building theories from case study research. Academy of Management Review, 14: (4), 532-550. doi: 10.5465/amr.1989.4308385. |
[16] | Gonzalez-Zapata, F., Perez, J.A.R., Chauvet, L., Emilsson, C., Zahuranec, A., & Young, A. ((2021) ). Open data in action: initiatives during the initial stage of the COVID-19 pandemic. GovLab, Organisation for Economic Co-operation and Development (OECD). |
[17] | Grinin, L., Grinin, A., & Korotayev, A. ((2021) ). COVID-19 pandemic as a trigger for the acceleration of the cybernetic revolution, transition from e-government to e-state, and change in social relations. Technological Forecasting and Social Change, 121348. doi: 10.1016/J.TECHFORE.2021.121348. |
[18] | Hansen, H.S., & Schrøder, L. ((2019) ). The Societal Benefits of Open Government Data with Particular Emphasis on Geospatial Information. In A. Kö, E. Francesconi, G. Anderst-Kotsis, A.M. Tjoa, & I. Khalil (Eds.), 8th International Conference of Electronic Government and the Information Systems Perspective (EGOVIS 2019), Springer International Publishing, pp. 31-44. doi: 10.1007/978-3-030-27523-5_3. |
[19] | Harrison, T.M., Pardo, T.A., & Cook, M. ((2012) ). Creating open government ecosystems: A research and development agenda. Future Internet, 4: (4), 900-928. |
[20] | Janssen, M., Charalabidis, Y., & Zuiderwijk, A. ((2012) ). Benefits, adoption barriers and myths of open data and open government. Information Systems Management, 29: (4), 258-268. doi: 10.1080/10580530.2012.716740. |
[21] | Janssen, M., & van der Voort, H. ((2020) ). Agile and adaptive governance in crisis response: Lessons from the COVID-19 pandemic. International Journal of Information Management, 55: , 102180. doi: 10.1016/j.ijinfomgt.2020.102180. |
[22] | Jarke, J. ((2019) ). Open government for all? Co-creating digital public services for older adults through data walks. Online Information Review, 43: (6), 1003-1020. doi: 10.1108/OIR-02-2018-0059. |
[23] | Jetzek, T., Avital, M., & Bjorn-Andersen, N. ((2014) ). Data-driven innovation through open government data. Journal of Theoretical and Applied Electronic Commerce Research, 9: (2), 100-120. |
[24] | Kalvet, T. ((2012) ). Innovation: A Factor Explaining E-Government Success in Estonia. Electronic Government, 9: (2), 142-157. doi: 10.1007/s13398-014-0173-7.2. |
[25] | Khan, R.E. ((2021) ). Accessible or Illusory Transparency? COVID-19 and Philippine Open Government Data. Philippine Political Science Journal, 42: (2), 149-175. |
[26] | Khayyat, M., & Bannister, F. ((2017) ). Towards a model for facilitating and enabling co-creation using open government data. Information Polity: The International Journal of Government & Democracy in the Information Age, 22: (4), 211-231. doi: 10.3233/IP-170406. |
[27] | Komenda, M., Bulhart, V., Karolyi, M., Jarkovský, J., Mužík, J., Májek, O., Šnajdrová, L., Ružičková, P., Rážová, J., Prymula, R., Macková, B., Březovský, P., Marounek, J., Černý, V., & Dušek, L. ((2020) ). Complex reporting of the COVID-19 epidemic in the czech republic: Use of an interactive web-based app in practice. J Med Internet Res 2020;22(5):E19367 Https://Www.Jmir.Org/2020/5/E19367, 22: (5), e19367. doi: 10.2196/19367. |
[28] | Komenda, M., Jarkovský, J., Klimeš, D., Panoška, P., Šanca, O., Gregor, J., Dušek, L., et al. ((2022) ). Sharing datasets of the COVID-19 epidemic in the Czech Republic. Plos One, 17: (4), e0267397. |
[29] | Kucera, J., & Chlapek, D. ((2014) ). Benefits and risks of open government data. Journal of Systems Integration, 5: (1), 30-41. |
[30] | Laine, M., Roonemaa, H., & Kund, O. ((2020) , March 17). Teadlased ja eksperdid ei saa koroonakriisis riiki aidata: meile ei anta andmeid. Eesti Päevaleht. https://epl.delfi.ee/uudised/teadlased-ja-eksperdid-ei-saa-koroonakriisis-riiki-aidata-meile-ei-anta-andmeid?id=89249689. |
[31] | Lember, V., Brandsen, T., & Tõnurist, P. ((2019) ). The potential impacts of digital technologies on co-production and co-creation. Public Management Review, 21: (11), 1665-1686. |
[32] | Maione, G., Sorrentino, D., & Kruja, A.D. ((2021) ). Open data for accountability at times of exception: An exploratory analysis during the COVID-19 pandemic. Transforming Government: People, Process and Policy, 16: (2), 231-243. |
[33] | McBride, K. ((2021) , March 11). Image of ‘digital Baltics’ cracks under weight of pandemic – New Eastern Europe – A bimonthly news magazine dedicated to Central and Eastern European affairs. New Eastern Europe. https://neweasterneurope.eu/2021/03/11/image-of-digital-baltics-cracks-under-weight-of-pandemic/. |
[34] | McBride, K., Aavik, G., Toots, M., Kalvet, T., & Krimmer, R. ((2019) ). How does open government data driven co-creation occur? Six factors and a ‘perfect storm’; insights from Chicago’s food inspection forecasting model. Government Information Quarterly, 36: (1), 88-97. doi: 10.1016/j.giq.2018.11.006. |
[35] | McBride, K., Toots, M., Kalvet, T., & Krimmer, R. ((2019) ). Turning Open Government Data into Public Value: Testing the COPS Framework for the Co-creation of OGD-Driven Public Services. In Public Administration and Information Technology, Springer, Vol. 31, pp. 3-31. doi: 10.1007/978-3-030-14446-3_1. |
[36] | McBride, K., Toots, M., Kalvet, T., Krimmer, R., Kalampokis, E., Tambouris, E., & Tarabanis, K. ((2017) ). Deliverable 2.2 OpenGovIntelligence framework. Available at: https://ec.europa.eu/research/participants/documents/downloadPublic?documentIds=080166e5c2df87df&appId=PPGMS. |
[37] | Mergel, I., Kattel, R., Lember, V., & McBride, K. ((2018) ). Citizen-oriented digital transformation in the public sector. ACM International Conference Proceeding Series. doi: 10.1145/3209281.3209294. |
[38] | Moynihan, D.P. ((2008) ). Learning under Uncertainty: Networks in Crisis Management. Public Administration Review, 68: (2), 350-365. doi: 10.1111/j.1540-6210.2007.00867.x. |
[39] | Nikiforova, A. ((2020) ). Timeliness of Open Data in Open Government Data Portals through Pandemic-related Data: A long data way from the publisher to the user. 2020 4th International Conference on Multimedia Computing, Networking and Applications, MCNA 2020, pp. 131-138. doi: 10.1109/MCNA50957.2020.9264298. |
[40] | Nikiforova, A. ((2021) ). Smarter open government data for society 5.0: Are your open data smart enough? Sensors 2021, Vol. 21, Page 5204, 21: (15), 5204. doi: 10.3390/S21155204. |
[41] | Nikiforova, A. ((2022) ). Open data hackathon as a tool for increased engagement of Generation Z: to hack ornot to hack. 2022 Electronic Governance with Emerging Technologies Conference, Springer. Forthcoming. |
[42] | Pan, S.L., Pan, G., & Devadoss, P.R. ((2008) ). E-government capabilities and crisis management: Lessons from combating SARS in singapore. MIS Quarterly Executive, 4: (4), 3. |
[43] | Pearson, C.M., & Clair, J.A. ((1998) ). Reframing crisis management. The Academy of Management Review, 23: (1), 59. doi: 10.2307/259099. |
[44] | Randma-Liiv, T., & Drechsler, W. ((2017) ). Three decades, four phases: Public administration development in Central and Eastern Europe, 1989–2017. International Journal of Public Sector Management. |
[45] | Rodriguez Müller, A.P., Casiano Flores, C., Albrecht, V., Steen, T., & Crompvoets, J. ((2021) ). A scoping review of empirical evidence on (digital) public services co-creation. Administrative Sciences, 11: (4), 130. |
[46] | Rosenthal, U., Charles, M.T., & Hart, P. ((1989) ). Coping with crises: The management of disasters, riots, and terrorism. Charles C Thomas Pub Limited. |
[47] | Rosenthal, U., & Kouzmin, A. ((1997) ). Crises and Crisis Management: Toward Comprehensive Government Decision Making. In Public Administration Research and Theory: J-PART (Vol. 7, Issue 2). https://www.jstor.org/stable/1181713?seq=1&cid=pdf. |
[48] | Sadiq, S., & Indulska, M. ((2017) ). Open data: Quality over quantity. International Journal of Information Management, 37: (3), 150-154. |
[49] | Safarov, I., Meijer, A., & Grimmelikhuijsen, S. ((2017) ). Utilization of open government data: A systematic literature review of types, conditions, effects and users. Information Polity, 22: (1), 1-24. |
[50] | Scognamiglio, F., Sancino, A., Caló, F., Jacklin-Jarvis, C., & Rees, J. ((2022) ). The public sector and co-creation in turbulent times: A systematic literature review on robust governance in the COVID-19 emergency. Public Administration. |
[51] | Shidik, G.F., & Ashari, A. ((2014) ). Linked open government data as background knowledge in predicting forest fire. Journal of Theoretical and Applied Information Technology, 62: (3), 570-581. |
[52] | Toots, M., McBride, K., Kalvet, T., Krimmer, R., Tambouris, E., Panopoulou, E., Kalampokis, E., & Tarabanis, K. ((2017) ). A Framework for Data-Driven Public Service Co-Production. EGOV-EPART2017 St.Petersburg, 1-13. |
[53] | Torfing, J., Sørensen, E., & Røiseland, A. ((2019) ). Transforming the public sector into an arena for co-creation: Barriers, drivers, benefits, and ways forward. Administration & Society, 51: , 795-825. |
[54] | Ubaldi, B. ((2013) ). Open Government Data: Towards Empirical Analysis of Open Government Data Initiatives (22nd ed.). OECD Publishing. doi: 10.1787/5k46bj4f03s7-en. |
[55] | Yin, R.K. ((2018) ). Case Study Research and Applications (Sixth Edit, Vol. 53). |
[56] | Zheng, S., Li, H., & Sun, H. ((2021) ). Crisis lifecycle, policy response, and policy effectiveness. Public Management Review, 1-27. |
Appendices
Author biographies
Keegan McBride is a departmental research lecturer in AI, Government, and Policy at the Oxford Internet Institute and an expert on topics such as digital government, digital innovation, the use of AI in the public sector, digital well-being and happiness, and government interoperability and data exchange. He is an active member of the scholarly community, participating in several high-level digital government focused conferences and publishing in leading peer-reviewed digital government focused journals. In his research he aims to develop an understanding about the future trajectory of the state in the digital age by exploring the complex and co-evolutionary relationships between technology, society, and the state.
Anastasija Nikiforova is an assistant professor of Information Systems at University of Tartu and a part of European Open Science Cloud Task Force “FAIR Metrics and Data Quality”. Her current research interests include, but are not limited to, data management with a particular focus on data quality, open government data, Smart City, Society 5.0, sustainable development, IoT, HCI and digitization. She is an expert of European Cooperation in Science & Technology (COST), Latvian Council of Sciences, and an associate member of the Latvian Open Technology Association (LATA). She serves as a program committee for 20
Martin Lnenicka is an assistant professor at the Faculty of Economics and Administration, University of Pardubice, Czech Republic. He has published over 40 papers in international conference proceedings and peer-reviewed journals, such as International Journal of Information Management, Government Information Quarterly or Telematics and Informatics. His work currently focuses mainly on issues relating to open government, big and open linked data, data lifecycle, enterprise architecture, and impacts of modern technologies in the public sector.


