
Women and digital government in rural India: Extending TAM with user assisted service
Abstract
Public service delivery is an essential component of e-governance initiatives but the digital divide limits citizens’ access to e-government services, especially in rural communities. The Digital India initiative launched Common Service Centers (CSCs) to mitigate the physical-digital divide issue. The privately operated local kiosks are meant to ensure easy access to digital government services in India’s remote pockets. Although the literature indicates that females generally have lower perceptions and adoption rates of digital government, existing studies commonly assume women directly interact with government websites. We know little about gender-specific experiences of digital government through the user assisted and privately operated local kiosks. This survey study utilizes the Technology Acceptance Model (TAM) to explore the gender-specific acceptance of public service through local kiosks in rural India. This paper argues that user-assisted kiosks help mitigate the gender digital divide by increasing the usefulness and ease of use of e-government, which improves rural women’s acceptance and use of digital government services. This field research brings insights from the developing world while recording women’s voices from underserved communities.
1.Introduction
Digital government or e-government refers to governments’ use of internet-based applications to enhance government information and delivery systems. Digital government aims to provide information and public services in a more personal and cost-effective manner (Bekkers & Zouridis, 1999; Heeks, 2003; Prins, 2001). However, research on gender and digital government indicate a gender digital divide in information and communication technology (ICT) for various reasons, including access and skill and socio-cultural factors (Huong, 2007; Jaeger, 2006; Mumporeze & Prieler, 2017) such as income and education (Hilbert, 2011). In other words, the gender digital divide and acceptance of digital government is affected by individual and socio-cultural factors beyond physical access. Nonetheless, environments specific to females’ digital acceptance and usage often remain unrecognized in government policies.
The Digital India initiative launched Common Service Centers (CSCs) to counter the roadblocks in e-government service delivery through various projects. This study specifically focuses on an e-government project, namely eMitra, which is implemented in all 33 districts of Rajasthan, India. eMitra kiosks are managed by small local-level entrepreneurs who collect service fees from the beneficiaries and assist in providing access to several public and administrative services. Do these initiatives address the gender digital divide? How do women perceive and accept digital government services through the user assisted local kiosks?
The Technology Acceptance Model (TAM) investigates factors affecting users’ acceptance of technology, and this approach has received strong theoretical and empirical recognition in the literature (Davis, 1989; Davis et al., 1989, Assaker, 2020). The model provides a theoretical framework that defines perceived ease of use and usefulness as the two primary predictors of effective acceptance and use of information technology and digital government. The effect of gender roles on TAM received early recognition (Gefen & Straub, 1997; Venkatesh & Morris, 2000) and has continued to be an important consideration in the model (Al-Emran et al., 2018). The literature on technology acceptance and gender generally indicates gender differences in digital government perceptions and adoption for various personal and environmental reasons. However, recent studies remain inconclusive and may depend on context to explain the moderating effect of gender on online technology and information usage, which is a finding that merits further attention (Assaker, 2020).
Studies commonly assume women directly interact with government websites but we know little about the gender-specific digital government experiences through user assisted local kiosks. This field research addresses this gap while recording rural women’s experiences in accessing digital-government services. Five districts of Rajasthan are selected to survey around 600 citizens who are presumably the digital government initiative’s target beneficiaries. The study explores the advantages and roadblocks that women beneficiaries identified in seeking basic public services through local kiosks. This research explores the impact of local kiosks on women’s experiences with digital government. While utilizing the TAM theoretical framework, this study examines women’s perceptions of ease of use and usefulness of digital services through local kiosks. This paper argues that digital government services through local kiosks positively impact rural women’s acceptance and use of digital government services. This survey study contributes to the body of knowledge of the gender digital divide while recording women’s experiences and digital government perceptions through user assisted local kiosks within a rural setting. This study also contributes to the understanding of intersectionality in the gender digital divide by examining female beneficiaries’ perspectives across various demographics.
2.eMitra: Digital public service through local kiosks
eMitra is a citizen-centered e-governance initiative of the Government of Rajasthan, an Indian state situated in the northwest part of the country. It is one of the seven most underdeveloped states in India. It lies below the national average in per capita income and per capita real investment (Dholakia & Dholakia, 1980; Government of India, 2021), which is why the state has been a target for e-governance programs to improve access to ICT, especially for women (Gupta et al., 2017). The project is implemented in all 33 districts of the state through the Public-Private Partnership (PPP) model. The project aims to provide government information and services to urban and rural citizens, nearly at their doorsteps.
The eMitra was launched with a limited set of citizen services. The list of services offered at e-Mitra is growing steadily. The one-stop-shop became popular, and many government and private agencies have approached the implementing agency to include their services under the umbrella of eMitra. The scope of services provided through eMitra kiosks includes central government, state government, and some private sector domains (such as life insurance and mobile phone service providers). The most common public services offered at the e-Mitra centers that the respondents of this study primarily accessed are listed below:
• Application for passport.
• Digital domicile certificate, death, and birth registration, caste certificate, and Marriage Certificate.
• National Rural Employment Guarantee Services.
• Payment of utility bills – water bills, electricity bills of electricity board.
• Payment of telephone service provider bills.
The primary beneficiary in any e-governance project is the citizen. Citizens access public services through the eMitra centers and make payments, including transaction charges to eMitra centers wherever applicable. The contact point for any citizen to receive services from various organizations is through e-Mitra kiosk centers. The kiosk centers serve citizens who seek certificates or identity cards, including submissions of applications, and application fee payment. The citizen is only required to physically visit the concerned government representative if the service entails a statutory personal verification. These centers are managed and operated by private partners/entrepreneurs. The web interface allows users to access services through the internet. The following case example described at the Rajasthan government website (www.emitra.rajasthan.gov) illustrates a woman’s digital government interaction through local kiosks.
“Chanda Devi walks into the eMitra kiosk in her village, Mahar Kalan, to get her resident certificate. Kishan at the eMitra counter gives her a printed form and explains the required documents to be submitted. She returns in the evening with the filled form and all requisite documents. Kishan logs into the eMitra portal and fills in details in an online form, takes his stipulated processing fee, and gives her a receipt for the payment. Later in the day, he scans and uploads her form and documents. Chanda Devi gets a system generated text message alert on her mobile. At the same time, the dealing authority also gets an alert for the application. The dealing assistant checks the form and submitted documents and forwards it with his comments to the Tehsildar for approval and issuance of the certificate. Both Chanda Devi and the Tehsildar get another status alert.22 The Tehsildar logs in, checks the application once again, and approves it. Chanda Devi gets another alert and goes to the eMitra kiosk. She gets her certificate printed and walks out.”
This case illustrates a woman’s digital government interaction through local kiosks, where women do not directly interact with the government website. The local kiosk operator serves as a facilitator and enables women to access the services effectively and on time. The case also indicates that the local kiosk is influencing beneficiaries’ experiences of digital government service. Hence, the user assisted local kiosks can influence women’s perceived ease of use and usefulness of digital government, which can help to overcome the gender digital divide by eliminating rural women’s barriers to information technology.
3.Digital government and gender
Digital government aims to provide information and public services in a more personal and cost-effective manner (Bekkers & Zouridis, 1999; Heeks, 2003; Prins, 2001). Public service enhancements (through enhanced access, convenience, and effectiveness) are one of the core objectives and public benefits of digital government (Karunasena & Deng, 2012). Another definition states that e-government regards customer services, social inclusion, and democracy and accountability (Layne & Lee, 2001). Thus, there is a consensus that e-government services are crucial in transforming citizens’ social, economic, and technological lives.
However, there is a general understanding that e-government projects have been limited in dealing with the gender digital divide, especially in developing and rural areas (Al-Rababah & Abu-Shanab, 2010; Okunola et al., 2017). Countries that have rapidly adopted ICT can approach closing the divide (Choi & Park, 2013; Moreno et al., 2013) but even cities that adopt digital government are at risk of perpetuating inequalities if gender is not considered in how systems are designed (Nesti, 2019). Knowledge on the extent of the divide is also especially scarce for low-income countries (Brännström, 2012).
The research related to gender and e-government points to the gender digital divide in ICT access. Studies on the gender digital divide suggest various reasons for this gap, including access, skills, disposable income, or lack of time and/or interest (Deursen et al., 2006). Moreover, access alone is insufficient to overcome the divide (Mariscal et al., 2019). Gender roles and socio-cultural customs, including domestic chores, difficulty traveling to access cybercafés and telecentres, and safety and security concerns of women traveling away from their homes limit their access to digital government (Jaeger, 2006). However, most recent e-government applications have not addressed women’s issues and needs (Bhatnagar, 2004), and even where progress has been made divides remain (Martínez-Cantos, 2017). Additionally, e-government initiatives have been designed without recognizing that females and males everywhere have different interaction patterns and acceptance for computers and the internet (Martin & Goggin, 2016).
3.1Technology Acceptance Model (TAM)
The TAM (Davis, 1989; Davis et al., 1989) is adapted from the theory of Reasoned Action (TRA) in investigating factors affecting users’ acceptance of the technology (Ajzen & Fishbein, 1980; Fishbein & Ajzen, 1975). The TAM presumes a determining role of two variables: perceived ease of use and perceived usefulness in explaining users’ behavior toward technology. Davis defined perceived usefulness as the degree to which the person believes that using the particular system would enhance her/his job performance, whereas the perceived ease of use was defined as the degree to which the person believes that using the particular system would be free of effort. Perceived ease of use is defined as the degree to which a person believes that using the system would be free of effort (Davis, 1989).
The perceived ease of use is supported by the framework of self-efficacy, defined as “judgment of how well one can execute courses of action required to deal with the prospective situation” (Bandura, 1982: p22). However, the self-efficacy paradigm does not offer a general measure applicable to all situations since efficacy beliefs are theorized to be situationally specific, with measures tailored to the domain under study (Bandura, 1982). Self-efficacy and perceived ease of use relationships are founded on theoretical arguments (Davis, 1989; Mathieson, 1991) and empirical studies that have tested the theoretical causal link between computer self-efficacy and perceived ease of use (Chau, 2001; Venkatesh & Davis, 1996; Dzandu et al., 2016). These studies suggest that computer self-efficacy has a significant positive effect on perceived ease of use for digital services.
Perceived usefulness is defined as the degree to which a person believes that using a particular technology would enhance his or her job performance (Davis, 1989). This follows from the definition of the word useful: capable of being used advantageously. A significant body of research has shown that perceived usefulness positively affects behavioral intention to use (Davis et al., 1989; Venkatesh, 1999, 2000; Venkatesh & Morris, 2000; Scherer et al., 2015; Alsabawy et al., 2016).
3.2TAM and gender
The effect of gender roles on TAM began receiving recognition at the turn of the century (Gefen & Straub, 1997; Venkatesh & Morris, 2000) and the impact of gender on technology use and acceptance have since been widely studied. Research generally indicates that gender influences digital adoption and use for various reasons. Studies suggest that women typically display higher levels of computer anxiety and lower self-efficacy toward computers or the internet (Durndell & Hagg, 2002; Okebukola, 1993; Whitely, 1997; Simsek, 2011). Men’s computer self-efficacy ratings, perceived usefulness, perceived ease of use, and behavioral intentions to use the internet and e-learning are higher than women’s (Ong & Lai, 2006; Gray et al., 2017). Females view computers as more difficult to use compared to their male counterparts (Thompson & Lim, 1996), and males are more experienced than females with computer programming and games (Morahan-Martin, 2001) in part because of a sexist culture in computing and gaming (Heron et al., 2014). Accordingly, the greater experience accounts for the greater degree of competency and comfort with both the internet and computers. Girls feel less confident with computers than boys (Braak’s, 2004). However, females are more likely to use the system if it was easy to use and rewards their efforts (Terzis & Economides, 2011). Thus, the theoretical framework and empirical findings indicate that gender influences the perceived ease of use and perceived usefulness of digital government.
Nonetheless, the recent literature remains inconclusive in explaining the impact of gender on technology acceptance and suggests mixed results across various contexts. In the context of online and mobile shopping, some studies found that the relationship between perceived usefulness and the behavioral intention was stronger among males than females (Mandari & Chong, 2018; Acheampong et al., 2018). Amin et al. (2015) and Escobar-Rodriguez et al. (2017) found that the effect of trustworthiness on users’ online purchase intentions was stronger for females as opposed to males. Another study (Dutta, 2018) suggests that perceived usefulness, ease of use, and attitude toward using physical health records significantly influenced individuals’ intentions to personal health record use. Additionally, results also indicated that perceptions of health-care technology self-efficacy more strongly influenced women.
On the other hand, in the context of online and mobile shopping, literature suggest that gender does not moderate the relationships between perceived usefulness and ease of use on users’ purchase intention (Amin et al., 2015; Lian & Yen, 2014; Tan & Ooi, 2018). Similarly, studies in the context of hotel tablet apps (Kim, 2016) and email usage (Wong et al., 2012) do not suggest any moderating effect of gender on customers’ usage intentions. In addition, in the school context, Papadakis (2018) found no gender difference regarding the teacher acceptance of smart mobile devices in school, and Drossel et al. (2017) could not detect gender differences in the teachers’ use of ICT in class. Thus, the moderating effect of gender on online technology and information usage is disputed and contextual and requires further attention.
Moreover, existing studies commonly assume women directly interact with government websites. There is limited knowledge on gender-specific experiences of digital government through user assisted and privately-operated local kiosks. As explained above, the context of digital government exposure through local kiosks influences women’s experiences and perceptions of digital government. Although women generally perceive lower ease of use and usefulness of e-government for various reasons, kiosks help remove barriers for women to utilize e-government. As the kiosk operator helps beneficiaries, it impacts the relationship between self-efficacy and ease of use. In a sense, regardless of their self-efficacy, digital government services through kiosks improve the relationship of women’s self-efficacy and perceived ease of use and usefulness for computer and digital services, which positively impacts their acceptance and use of digital government services. This study constructs the following hypotheses from this argument.
H1: Women are more likely than men to find digital government service through kiosks easy to use.
H2: Women are more likely than men to find kiosks more useful.
4.Research design and data collection
In the summer of 2019 (May to June), the corresponding author of this study dedicated time to exploring the Rajasthan state, specifically regarding e-Mitra intervention. The researcher interacted with local communities and kiosk owners to understand the process and nuances of the e-Mitra service. This time was also utilized to conduct formal and informal interviews with local women who had utilized the service. These insights were crucial in creating and modifying the survey instrument pertinent to the specific community and digital service.
After the initial exploration, six young male interviewers were recruited from the network of the Manjari Foundation, a local nongovernmental organization (NGO) and training was provided to conduct the survey. The independent interviewers were chosen from the community and had no direct association with kiosk owners to avoid any potential bias in the data. Although the surveyors were male, they were recruited from the local community as a means of assuring trust between the respondents and the interviewers. In addition to their belongingness to the community, the surveyors had previously worked with the NGO. Therefore, these surveyors were arguably trusted by the community, and women were comfortably responding to them. The male interviewers were also selected based on recognizing the cultural and local nuances of the community. Commuting to various locations was easily possible and more acceptable for males than the females. Interviewers were supervised by the researchers and were provided with the required training and guidance before administering the survey. The survey was conducted from July 2019 to March 2020.
The constructs of ease of use and usefulness are adopted from the theoretical framework of TAM. While following the existing literature around TAM, the survey instruments (items) were crafted according to the context of service and respondents. As mentioned before, the formal and informal interviews provided insights to modify the survey items according to the context of user-assisted kiosks in rural communities. This paper presents a portion of the survey items, as the other items were not germane to this paper’s research question. For instance, the field research also collected data on how eMitra impacts their lives and their trust in government which fits into a separate body of literature.
This research primarily includes questions related to the use and benefits of local kiosks. The questions were designed to record the rural community’s voice on digital government initiatives and services through local kiosks. Thirty (37) panchayats were randomly selected based upon the availability of the NGO’s (Manjari Foundation) network from within five of Rajasthan’s districts, namely, Bhilwara, Chittorgarh, Dholpur, Rajsamand, and Udaipur. These five districts provide broad coverage of various population sizes within the state, with each quartile represented by at least one district. Table 1 provides a list of districts and panchayats in each district. The political units in India are organized from largest to smallest as county, state, district, division, block, and gram panchayat. A gram panchayat (village council) is a specific political unit with local government institutions.
Table 1
District and panchayat
| District | Bhilwara | Chittorgarh | Dholpur | Rajsamand | Udaipur |
|---|---|---|---|---|---|
| Panchayat | Anguksha | Chanderia | Audi | Amndi | Amarpura |
| Arvan | Dhanet kala | Basai Nabab | Gilund | Aunda | |
| Gulabpura | Kashmor | Dholpur | Manda | Barapal | |
| Hurda | Madesar | Ghadi Chatola | Mehanduriya | Javar | |
| Kotiya | Putali | Maloni Panvar | Railmagra | Kaivada | |
| Shapura | Shahri | Maniya | Rajayvas | Shahri | |
| Vijay Nagar | Suvrima | Nagla Harlal | Rajsamand | Tiddi | |
| Saipau | Sindesarkala |
Twenty respondents were randomly selected within each panchayat community. Around 600 adult beneficiaries of local kiosks were randomly surveyed. Informed consent of the participants was sought for voluntary participation in the interview. The participants were also informed about the purpose of the research and informed that they could leave the interview at any time. On average, each interview took around 20 minutes. The research sample consists of around 60% females and 40% males. Respondents were well divided across different age and socio-economic backgrounds. The data indicate that around 53% of respondents have a lower level (below secondary) of education and 46% of respondents have at least some secondary education or were literate. Around 94% of respondents in the sample are Hindus. The average age of respondents is 36 with the lowest age of 18 and the highest age of 80 years old. The average distance from kiosks is 1.2 kilometers with a minimum of 0.1 and a maximum of eight kilometers. (Table 2 presents the demographic indicators of the respondents).
Table 2
Descriptive statistics of demography
| Frequency | Percent | |||
| Gender | Female | 369 | 61.50 | |
| Male | 231 | 38.50 | ||
| Education | Above Secondary | 280 | 46.67 | |
| Below Secondary | 320 | 53.33 | ||
| Religion | Hindu | 558 | 94.10 | |
| Jain | 1 | 0.17 | ||
| Muslim | 32 | 5.40 | ||
| Sikh | 2 | 0.34 | ||
| Mean | Standard Dev. | Min | Max | |
| Age | 36.41 | 10.60 | 18 | 80 |
| Distance | 1.28 | 1.52 | 1 | 8 |
The study models outcome variables by ordinary least squares (OLS) estimation. OLS is also preferred to analyze these data because it is better suited for a relatively small sample size (King & Ryan 2002; Pohlman & Leitner, 2003). Additionally, since the dependent variables are dichotomous, OLS coefficients can be interpreted as probabilities in a linear probability model. All the models have standard errors clustered by block to control for serial correlation between respondents in similar geographic units. Variance inflation factor (VIF) tests are also performed for each of the models to account for collinearity.
4.1Measurement of variables
The dependent variables represent the perceived ease of use and perceived usefulness of digital government services through local kiosks. The concept of ease of use is measured with dummy variables of speed, fees, wait, and respect, and the concept of usefulness is measured with dummy variables of service and satisfaction with the kiosks. The dummy variables of speed, fees, wait, respect, satisfaction, and service are each recorded as dichotomous variables with a yes, no option. Each variable is coded as 0 for negative experiences and 1 for positive experiences so that good experiences are associated with positive coefficients. Table 3 illustrates the survey questions corresponding to each dependent variable.
The primary explanatory variable used in this analysis is gender, which is measured as zero for males and one for females. Other demographic factors are also taken into consideration as controls. Conventional variables are used to control the individual factors that may account for beneficiaries’ social standing such as age, education, religion, and distance from the kiosk centers. Each of these control variables may be associated with perceptions of kiosks but may also be associated with gender.
Table 3
Measure of dependent variables
| Question | Variables |
|---|---|
| Do you get any service through the kiosk/booth? | Service |
| Are you satisfied/happy with the service you received? | Satisfaction |
| Are you satisfied/happy with the speed of the service? | Speed |
| Are you satisfied/happy with the fee of the service/s? | Fee |
| Does the service provider make you wait longer (unnecessary)? | Wait |
| Does the service provider treat you respectfully? | Respect |
5.Result and analysis
Six OLS regression models test the hypotheses for gender differences in usefulness and ease of use of digital government through local kiosks. The concept of usefulness is analyzed in Model 1 and Model 2 which estimate the service and satisfaction variables respectively. The concept of ease of use is analyzed in Model 3 (speed), Model 4 (fees), Model 5 (wait), and Model 6 (respect). The coefficients in each model can be interpreted as 100*coefficient
Table 4
OLS regression models of usefulness and ease of use of local kiosks
| (1) | (2) | (3) | (4) | (5) | (6) | |
| Service | Satisfaction | Speed | Fees | Wait | Respect | |
| Female | 0.045 | 0.103 | 0.084 | 0.040 | 0.093 | 0.096 |
| (0.024) | (0.029) | (0.039) | (0.057) | (0.050) | (0.053) | |
| Age | ||||||
| (0.001) | (0.001) | (0.001) | (0.002) | (0.001) | (0.001) | |
| Above secondary | 0.023 | |||||
| (0.018) | (0.033) | (0.024) | (0.036) | (0.023) | (0.028) | |
| Minority religion | 0.020 | 0.043 | ||||
| (0.032) | (0.064) | (0.064) | (0.104) | (0.072) | (0.092) | |
| Distance | 0.004 | 0.005 | 0.008 | 0.022 | 0.012 | 0.012 |
| (0.007) | (0.007) | (0.004) | (0.006) | (0.005) | (0.007) | |
| Constant | 0.977 | 0.872 | 0.923 | 0.818 | 0.870 | 0.858 |
| (0.058) | (0.041) | (0.048) | (0.082) | (0.055) | (0.073) | |
| Observations | 561 | 543 | 532 | 530 | 525 | 525 |
|
| 0.019 | 0.036 | 0.036 | 0.018 | 0.028 | 0.029 |
Service and satisfaction are usefulness variables. Speed, fees, wait, and respectful are ease of use variables. Errors clustered by block are in parentheses. The sample includes both males and females. The base categories are males for gender, below secondary for education, and Hindu for religion.
Table 4 provides the results of the analysis. Model 1 estimates the service variable, and Model 2 estimates the satisfaction variable of the usefulness concept. Model 1 suggests that the results are generally consistent with the hypothesis. Gender (female) has a statistically significant (at the 0.90% level) and positive association on service use. Women are more likely than men to use the service by about 4.5 percentage points. While age and education relate to kiosk service negatively, distance and minority religion (non-Hindu) have a positive relationship with kiosk service, but none of these relationships are statistically significant.
Model 2 also indicates that the results are consistent with the hypothesis. The coefficient on female has a statistically significant (at the 99% level) and positive association with satisfaction with eMitra. Women are more likely than men to be satisfied with the service by about 10.3 percentage points. Age, education, and minority religion (non-Hindu) seem to relate to satisfaction negatively, and distance positively correlates with satisfaction. However, none of these relationships are statistically significant. Thus, gender (women) is the main predictor of service and satisfaction. Women are predicted to use kiosks and find the digital service more useful than men.
Model 3 (speed), Model 4 (fees), Model 5 (wait), and Model 6 (respect) estimates the ease of use concept. The results of Model 3 are consistent with the hypothesis. The gender (female) variable has a statistically significant (at the 90% level) and positive association with the speed of service. It is predicted that women are more likely than men to find that the kiosk provides speedy service by about 8.4 percentage points. Distance has a statistically significant (at the 95% level) and positive association with the speed of service. The model predicts that people who live farther from the kiosk center find the kiosk service speedy. A one-kilometer increase in a respondent’s travel distance leads to about a 0.8 percentage point increase in perception of speed. Age and education, and minority religion seem to relate to speed negatively, but none of these relationships are statistically significant.
Model 4 depicts that the female gender positively correlates with the fees of service, but the relationship is not statistically significant. Distance has a statistically significant (at the 99% level) and positive association with fees of service. A one-kilometer increase in distance leads to about a 2.2 percentage point increase in the perception of fees. This predicts that people who live farther from the kiosk center are happier with the kiosk service fees.
Model 5 suggests that the results are consistent with the hypothesis. Gender (female) has a statistically significant (at the 90% level) and positive association with the perceptions of the wait for service. Model 5 predicts that women are more likely than men to report that they did not have to wait for longer than necessary at the kiosk by about 9.3 percentage points. Distance has a very significant (at the 0.05 level) and positive effect on the reported wait of service. A one-kilometer increase in the distance leads to a 1.2 percentage point increase in perception of wait times. This means that people who live farther from the kiosk center report that they did not have to wait for the service. However, older people are less likely than younger people to report that they did not have to wait longer than necessary at the kiosk. A one-year increase in age leads to a 0.3 percentage point decrease in the perception of wait times. However, this is substantively not important as the coefficient is too small. Education and minority religion seem to relate to wait negatively, but none of these relationships are statistically significant.
The results of Model 6 are consistent with the hypothesis. The female gender has a statistically significant (at the 90% level) and positive association with the respondent feeling that they were treated with respect. It is predicted that women are more likely than men to find that the kiosk operator was respectful by about 9.6 percentage points. Age, education, and minority religion seem to have negative associations, and distance seems to have a positive relationship with respect, but none of these relationships are statistically significant.
In summary, women are more likely than men to appreciate the ease of use and usefulness of digital government services through the kiosks. Except for fees, all the predictors of ease of use and usefulness are positive and statistically significant, which suggests broad support for the hypotheses. However, older people were less likely to relate to the ease of use and usefulness of digital government services in general than were younger people, though the results are substantively small. In addition to gender, distance is another variable that covaries with the perceptions of ease of use of eMitra. In other words, people who live farther from the kiosk center report more positive responses for speed, fee, and wait times. This means people coming from the remotest pockets of rural communities are more likely to identify with ease of use.
Table 5
OLS regression models of usefulness and ease of use of local kiosks with females only
| (7) | (8) | (9) | (10) | (11) | (12) | |
| Service | Satisfaction | Speed | Fees | Wait | Respect | |
| Age | ||||||
| (0.002) | (0.001) | (0.001) | (0.002) | (0.001) | (0.002) | |
| Above secondary | 0.001 | 0.016 | 0.059 | 0.037 | 0.037 | |
| (0.014) | (0.023) | (0.026) | (0.025) | (0.027) | (0.030) | |
| Minority religion | 0.003 | 0.110 | 0.003 | |||
| (0.052) | (0.051) | (0.051) | (0.075) | (0.039) | (0.082) | |
| Distance | 0.002 | 0.007 | 0.024 | 0.014 | 0.010 | |
| (0.005) | (0.005) | (0.002) | (0.004) | (0.004) | (0.006) | |
| Constant | 1.089 | 0.967 | 0.975 | 0.834 | 0.954 | 0.982 |
| (0.038) | (0.044) | (0.041) | (0.100) | (0.051) | (0.056) | |
| Observations | 342 | 331 | 323 | 322 | 320 | 320 |
|
| 0.039 | 0.003 | 0.010 | 0.031 | 0.028 | 0.023 |
Service and satisfaction are usefulness variables. Speed, fees, wait, and respectful are ease of use variables. Errors clustered by block are in parentheses. The sample includes females only. The base categories are below secondary for education and Hindu for religion.
In addition, Table 5 provides results of an analysis of intersectionality by subsetting the sample for females only. Model 7 (service) and Model 8 (satisfaction) predict usefulness, Model 9 (speed), Model 10 (fees), Model 11 (wait), and Model 12 (respect) predict ease of use for the female sample only. Table 5 demonstrates the results of the analysis with a female-only sample (369).
Model 7 shows that age has a statistically significant (at the 95% level) and negative effect on service use. It means that older women are less likely than younger women to use the service. A one-year increase in a female’s age is associated with a
Models 9, 10, and 11 depict that distance has a statistically significant and positive effect on speed, fees, and wait at (95, 95, and 99% levels respectively). A one-kilometer increase in a female beneficiary’s distance from the kiosk center leads to a 0.7, 2.4, and 1.4 percentage point increase in speed, fees, and wait times. In a sense, women who live farther from the kiosk centers are more likely to report ease of use than women who live nearer to the booths. However, other intersectionality coefficients such as on education and religion are not statistically significant. This could be the result of large standard errors due to the small sample size.
Figure 1.
Predicted probability of satisfaction of fees by distance to kiosk. The figure plots the predicted values of the distance variable from Model 10 with 95% confidence intervals. The x axis is the distance between the kiosk and the respondent’s home, and the y axis is the respondent’s predicted probability of being satisfied with the kiosk fees.
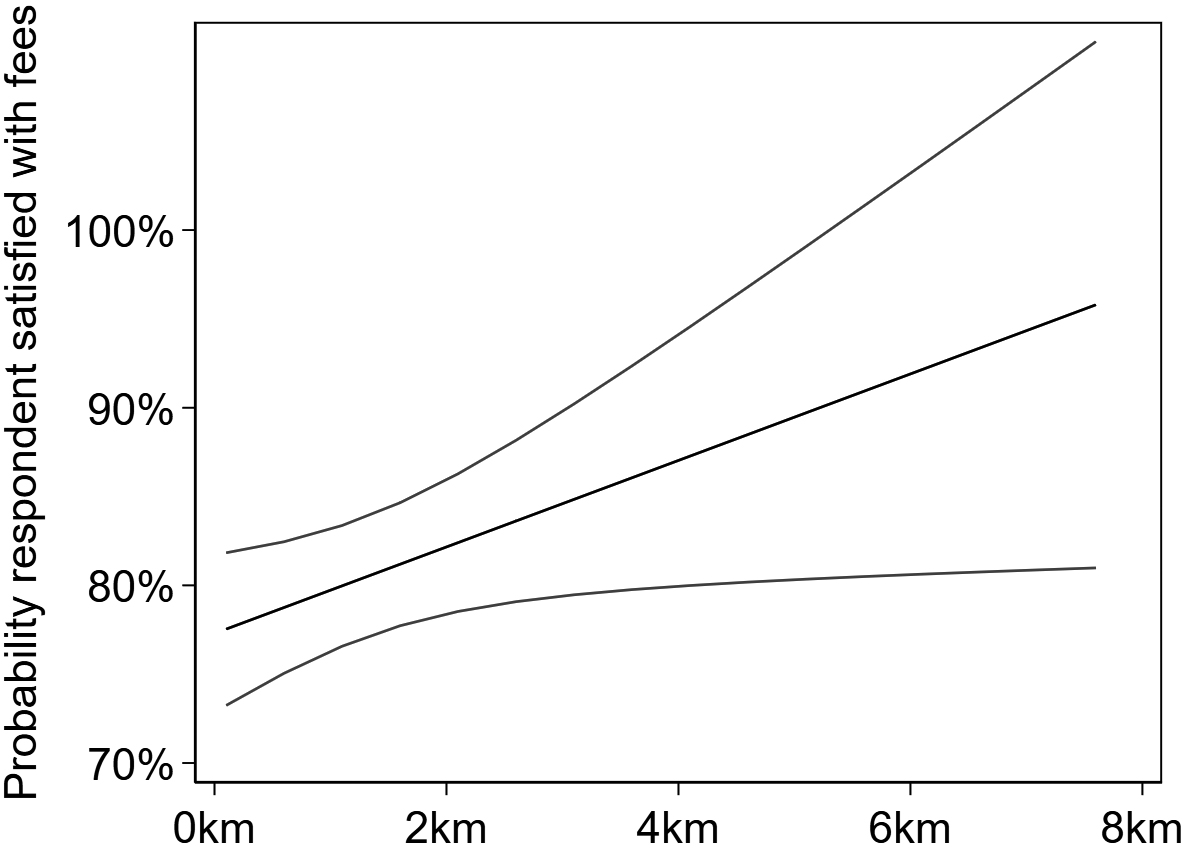
Figure 1 plots the results from Model 10 for the coefficient on the distance explanatory variable. Women who live farther from the kiosk centers are more accepting of service fees by about 2.2 percentage points per kilometer they must travel from their home to the kiosk site. As depicted in the figure, a woman who travels about 1 km has about an 80% probability of being satisfied with the user fees. A woman who travels 8 km has about a 95.4% probability of being satisfied with the user fees, which represents a 15.4 percentage point increase from 1 to 8 km. This suggests that distance from the kiosk centers positively influences women’s perceptions of ease of use at kiosk centers and the value of eMitra, a result we discuss further in the next section.
6.Discussion
Research on the gender digital divide in the past twenty years has revealed that simply providing access to technology is insufficient to reduce disparities in ICT usage between men and women. Factors that have been previously found to contribute to the divide include differences in skills, sexist cultures related to computing, and women’s lower education and income levels compared to men. Unless technology systems are designed to account for differences in gender, inequality in access and usage of information technology will perpetuate (Nesti, 2019). The findings in this study suggests user-assisted kiosks are one important means by which individual and socio-cultural differences in the gendered use of technology may be overcome to provide more equitable services for all.
The empirical analysis in this study found that females are more likely to report greater ease of use and usefulness of user-assisted kiosks compared to males. This finding is true despite controlling for other individual level factors that prior studies have found contribute to the gender digital divide. This finding can be understood within the TAM theoretical framework. In the framework, increasing ease of use and usefulness of information technology promotes an individual’s use and acceptance of a technology. User-assisted kiosks benefit women’s adoption of e-government services by overcoming their perceived burdens of utilizing such technology.
The operationalization of the concepts of ease of use and usefulness in this study are specific to the context of user-assisted kiosks, but also provide for comprehensive analysis of the factors associated with kiosk usage. While females in the survey were only about 5 percentage points more likely than men to report that they utilize the eMitra service, females were 10 percentage points more likely to state that they are satisfied with the service. Females viewed the eMitra service as more useful compared to males which suggests that eMitra is improving the digital divide through providing face-to-face interactions at kiosks. The improvement is especially on the third level of digital exclusion which impacts outcomes and life experiences (Wei et al., 2011).
Females were also more likely to report that they were satisfied with the speed of the service, that they were not made to wait extra time, and that they were treated respectfully. All of these factors improve the ease of use of e-government for women and contribute to reducing the digital divide. However, the analysis found no differences between females and males in their satisfaction with fees and charges. This is not to suggest that fees are not an important factor for women in accessing technology but rather that there are no discernable differences in females’ and males’ views of such fees. It is also an interesting null result given that the TAM framework studies typically do not focus on use fees.
The findings suggest that in the context of rural settings with lower access to ICT, lower skills, and lower incomes, user-assisted kiosks are especially beneficial to women. These findings may help to resolve some of the debates in the literature. The recent literature has applied TAM models to study the gendered differences in usage and access of technology with mixed results. Some studies have found the gender divide persists, some studies find that the gender divide narrows or disappears after controlling for other individual level factors, and other studies suggest that the divide may be a result of local contexts such as developed or urban settings compared to developing rural areas. This study finds that an e-government system that is designed to be more accessible to females in rural and low income settings improve female access to government services.
Moreover, the results suggest that the distance the respondents must travel is an importance factor for how the respondents, regardless of gender, view the ease of use of kiosks. Females specifically are more likely to rate the ease of use of eMitra higher when the distance they must travel to use the service increases. For each kilometer increase in the distance that females must travel to a kiosk, they are about 1–2 percentage points more likely to say they are satisfied with the speed of the service, the fees, or the wait times. While there is no reason to believe that the distance traveled directly impacts the fees or the efficiency of a service, it appears that women who live in more remote areas are more appreciative of the eMitra service. The implication is that user-assisted kiosks increase the ease of use for residents who live in more remote regions likely by helping them achieve access to information technology.
There is one final major implication of the findings for the literature on applying TAM to gender. The eMitra service incorporates in-person assistance with kiosks which can help women overcome their anxieties in utilizing e-government, thereby helping them utilize information technology to access government services. The in-person format of kiosks is a unique aspect of this study, and helps explain our finding that user-assisted kiosks improve the gender digital divide by increasing the ease of use and usefulness of e-government. Since women tend to have greater anxiety about using information technology, and ICT programs in rural areas may have substantial barriers to improving womens’ digital literacy, user-assisted kiosks are a practical means of making e-government accessible to rural, low-income individuals, especially women.
7.Conclusion
This study examines digital government services through local kiosks in undeveloped communities under the eMitra project. The privately-operated local kiosks are aimed to ensure easy access to digital government services in India’s remote pockets. The research questions in this paper were whether these initiatives address the gender digital divide, and how women perceive and accept digital government services through the user assisted local kiosks. This paper argued that local kiosks influence the usefulness and ease of use of digital government, specifically for women. In the analysis, there is a positive relationship between the female gender and ease of use and usefulness indicators. Thus, the study finds evidence consistent with the hypotheses of the argument. eMitra does appear to address the gender digital divide by making e-government accessible and user-friendly to women, as evidenced by the respondents’ positive perceptions of the program.
This study contributes to the body of knowledge on gender and digital government while providing unique context and data on digital government service through local kiosks. The analysis suggests that women are more likely to find the kiosks easy to use and useful, which positively impacts their acceptance and use of digital government services. Furthermore, women from the remotest pockets were more accepting of the digital government service through kiosks, which indicates the need and importance of such services for rural women. However, as the women-only sample size was relatively small, the study had limited data to analyze and account for intersectionality. A significant and positive relationship was found between distance and the indicators of ease of use (speed, fee, wait). This suggests that women who live in remote pockets are more appreciative of digital services through local kiosks. One potential explanation for this finding is that the kiosk operator may be more responsive to women coming from a farther distance. However, future research with a larger sample size will help capture how eMitra relates to gender intersectionality.
This paper also contributes to the TAM model by recognizing the importance of service in the acceptance of technology. The existing literature on the TAM model primarily attributes the notion of technology acceptance to the direct interaction with a device, and the service offered in accessing technology and the digital government generally remains unrecognized. This paper builds on our understanding of TAM by applying the model to how user-assisted kiosks improve service beneficiaries’ acceptance of new technology regardless of their technological capabilities. Thus, the user-assisted kiosks are a new means of overcoming the gendered digital divide by enabling technology acceptance for women in rural communities.
Environments specific to females’ digital acceptance and usage often remain unrecognized in government policies, and male-dominated environments often do not correspond to women’s needs (Huong, 2007). However, kiosks are very successful in bridging the gender divide. Furthermore, based on rural society’s socio-cultural context and interactions with rural women, it was found that women were given priority over men by the kiosk operator. In conducting the initial interviews before building the survey, the corresponding author recorded the following statements.
One respondent, Geeta says, “when I went to the kiosk, the operator gave me a chair to sit and asked the boys/men (who were waiting before me) to wait. He helped me quickly, and I did not have to wait longer.” Another respondent, Sumitra says, “as the operator knew that I came from a farther distance, he tried to get my work done with priority so that I could go back home before dark.”
Thus, kiosks’ external environments in rural areas encourage women to accept and use digital government services. Therefore, it is crucial to ensure that the service provided through local kiosks is gender-friendly. The kiosk operator should also be provided with gender sensitivity training to serve rural, less educated women with empathy. This is also in the interest of kiosk operators because it is potentially profitable for the center.
This study shows how a Public-Private Partnership can harness a market strategy to overcome gender differences. Additionally, the kiosk centers should have more amenities to welcome women in general and older women in particular. For example, a waiting area, chairs, and water facilities could attract more citizens, especially women. Such amenities might also improve how older respondents perceive their wait times.
This research indicates that beneficiary and kiosk operator interactions are crucial in digital services. However, this study remains limited in describing the impacts of kiosk management on the gender digital divide. Further research could be useful to examine how kiosk center management impacts gender outcomes in digital e-government services. Future research could also be useful in examining kiosk centers’ economic impacts on kiosk operators and local communities.
The research has broader relevance in policymaking in addressing the gender digital divide within and outside India. The study suggests that digital government services through local kiosks are crucial to address the gender digital divide in underserved communities. More than 70% of India’s population live in rural areas. Therefore, more eMitra kiosks in remote pockets could benefit women. More kiosks could be especially helpful for essential services since women use the internet for practical purposes (Al-Rababah & Abu-Shanab, 2010). Digital government services through local kiosks could be expanded to rural communities in other developing countries with a conducive external environment for women.
Notes
1 Aadhaar is a 12-digit unique identity number obtained voluntarily by residents or passport holders of India, based on their biometric and demographic data. A permanent account number (PAN) is a ten-character alphanumeric identifier, issued in the form of a laminated “PAN card” by the Indian Income Tax Department, India. Ration cards are an official document issued by state governments in India to households eligible to purchase subsidized food grain from the Public Distribution System under the National Food Security Act (NFSA).
2 A tehsil is an administrative division in some counties of the Indian subcontinent that is usually translated to “township,” and a tehsildar is a tax officer accompanied by revenue inspectors.
Acknowledgments
The authors are grateful to the anonymous reviewers and the editor for comment that significantly improved the manuscript. The authors would also like to thank Mr. Sanjay Kumar and the interviewers’ team, who made the data collection process possible in the remote pockets of India.
References
[1] | Acheampong, P., Zhiwen, L., Hiran, K.K., Serwaa, O.E., Boateng, F., & Bediako, I.A. ((2018) ). Examining the intervening role of age and gender on mobile payment acceptance in Ghana: UTAUT model. Canadian Journal of Applied Science and Technology, 6: (1), 141-151. |
[2] | Agarwal, R., & Prasad, J. ((1999) ). Are individual differences germane to the acceptance of new information technologies? Decision Sciences, 30: (2), 361-391. |
[3] | Al-Emran, M., Mezhuyev, V., & Kamaludin, A. ((2018) ). Technology acceptance model in m-learning context: A systematic review. Computers & Education, 125: , 389-412. |
[4] | Al-Rababah, B.A., & Abu-Shanab, E.A. ((2010) ). E-government and gender digital divide: The case of Jordan. International Journal of Electronic Business Management, 8: (1), 1-8. |
[5] | Alsabawy, A.Y., Cater-Steel, A., & Soar, J. ((2016) ). Determinants of perceived usefulness of e-learning systems. Computers in Human Behavior, 64: (C), 843-858. |
[6] | Amin, M., Rezaei, S., & Tavana, F.S. ((2015) ). Gender differences and consumer’s repurchase intention: The impact of trust propensity, usefulness, and ease of use for implication of innovative online retail. International Journal of Innovation and Learning, 17: (2), 217-233. |
[7] | Assaker, G. ((2020) ). Age and gender differences in online travel reviews and user-generated-content (UGC) adoption: extending the technology acceptance model (TAM) with credibility theory. Journal of Hospitality Marketing & Management, 29: (4), 428-449. |
[8] | Bandura, A. ((1986) ). Social foundations of thought and action. Englewood Cliffs, NJ, 1986: , 23-28. |
[9] | Brännström, I. ((2012) ). Gender and digital divide 2000–2008 in two low-income economies in Sub-Saharan Africa: Kenya and Somalia in official statistics. Government Information Quarterly, 29: (1), 60-67. |
[10] | Bekkers, V.J., & Zouridis, S. ((1999) ). Electronic service delivery in public administration: some trends and issues. International Review of Administrative Sciences, 65: (2), 183-195. |
[11] | Bhatnagar, S. ((2004) ). E-government: From Vision to Implementation-A Practical Guide with Case Studies (Vol. 21, No. 1). Sage. |
[12] | Chau, P.Y. ((2001) ). Influence of computer attitude and self-efficacy on IT usage behavior. Journal of Organizational and End User Computing (JOEUC), 13: (1), 26-33. |
[13] | Choi, Y.T., & Park, S. ((2013) ). Understanding gender inequality in central e-government: a Korean case study. Government Information Quarterly, 30: (3), 300-309. |
[14] | Davis, F.D. ((1989) ). Perceived usefulness, perceived ease of use, and user acceptance of information technology. MIS Quarterly, 13: (3), 319-340. |
[15] | Davis, F.D., Bagozzi, R.P., & Warshaw, P.R. ((1989) ). User acceptance of computer technology: a comparison of two theoretical models. Management Science, 35: (8), 982-1003. |
[16] | Dholakia, B.H., & Dholakia, R.H. ((1994) ). Total factor productivity growth in Indian manufacturing. Economic and Political Weekly, 49: (1), 3342-3344. |
[17] | Durndell, A., & Haag, Z. ((2002) ). Computer self efficacy, computer anxiety, attitudes towards the Internet and reported experience with the Internet, by gender, in an East Van European sample. Computers in Human Behavior, 18: (5), 521-535. |
[18] | Dutta, B., Peng, M.H., & Sun, S.L. ((2018) ). Modeling the adoption of personal health record (PHR) among individual: the effect of health-care technology self-efficacy and gender concern. Libyan Journal of Medicine, 13: (1), 1-12. |
[19] | Deursen, A., Van Dijk, J., & Ebbers, W. ((2006) , September). Why e-government usage lags behind: Explaining the gap between potential and actual usage of electronic public services in the Netherlands. In International Conference on Electronic Government, pp. 269-280. Springer, Berlin, Heidelberg. |
[20] | Drossel, K., Eickelmann, B., & Gerick, J. ((2017) ). Predictors of teachers’ use of ICT in school – the relevance of school characteristics, teachers’ attitudes and teacher collaboration. Education and Information Technologies, 22: (2), 551-573. |
[21] | Dzandu, M.D., Boateng, H., Agyemang, F.G., & Quansah, F. ((2016) ). Social media adoption among university students: the role of gender, perceived usefulness and perceived ease of use. International Journal of Social Media and Interactive Learning Environments, 4: (2), 124-136. |
[22] | Fishbein, M., Jaccard, J., Davidson, A.R., Ajzen, I., & Loken, B. ((1980) ). Predicting and understanding family planning behaviors. In Understanding Attitudes and Predicting Social Behavior. Prentice Hall. |
[23] | Fishbein, M., & Ajzen, I. ((1975) ). Belief. Attitude, Intention and Behavior: An Introduction to Theory and Research, 578: . Addison-Wesley. |
[24] | Gefen, D., & Straub, D.W. ((1997) ). Gender differences in the perception and use of e-mail: an extension to the technology acceptance model. MIS Quarterly, 21: (4), 389-400. |
[25] | Government of Rajasthan ((2021) ). About eMitra. http://emitra.rajasthan.gov.in/content/emitra/en/Aboutus/Aboutemitrabrochure.html accessed 3/31/2021. |
[26] | Government of India ((2021) ). GSDP & per capita state domestic product (current prices) from 2007-08 to 2013-14. https://data.gov.in/ accessed 3/31/2021. |
[27] | Heeks, R., & Bailur, S. ((2007) ). Analyzing e-government research: perspectives, philosophies, theories, methods, and practice. Government Information Quarterly, 24: (2), 243-265. |
[28] | Heron, M.J., Belford, P., & Goker, A. ((2014) ). Sexism in the circuitry: female participation in male-dominated popular computer culture. ACM SIGCAS Computers and Society, 44: (4), 18-29. |
[29] | Hilbert, M. ((2011) ). Digital gender divide or technologically empowered women in developing countries? A typical case of lies, damned lies, and statistics. In Women’s Studies International Forum, Vol. 34, No. 6, pp. 479-489. Pergamon. |
[30] | Gray, T.J., Gainous, J., & Wagner, K.M. ((2017) ). Gender and the digital divide in Latin America. Social Science Quarterly, 98: (1), 326-340. |
[31] | Gupta, P., Jain, S., & Vashishth, N. ((2017) ). e-governance in India: a case study of leveraging information & communication technology (ict) for women empowerment under MgnRegA in the state of Rajasthan. Journal of Governance & Public Policy, 7: (1), 78-87. |
[32] | Huong, H. ((2007) ). e-government in singapore: a SWOT and pest analysis. Asia-Pacific Social Science Review, 6: (2), 103-130. |
[33] | Jaeger, P.T. ((2006) ). Assessing Section 508 compliance on federal e-government Web sites: a multi-method, user-centered evaluation of accessibility for persons with disabilities. Government Information Quarterly, 23: (2), 169-190. |
[34] | Karunasena, K., & Deng, H. ((2012) ). Critical factors for evaluating the public value of e-government in Sri Lanka. Government Information Quarterly, 29: (1), 76-84. |
[35] | Kim, J.S. ((2016) ). An extended technology acceptance model in behavioral intention toward hotel tablet apps with moderating effects of gender and age. International Journal of Contemporary Hospitality Management, 28: (8), 1535-1553. |
[36] | King, E.N., & Ryan, T.P. ((2002) ). A preliminary investigation of maximum likelihood logistic regression versus exact logistic regression. The American Statistician, 56: (3), 163-170. |
[37] | Layne, K., & Lee, J. ((2001) ). Developing fully functional e-government: a four stage model. Government Information Quarterly, 18: (2), 122-136. |
[38] | Lian, J.W., & Yen, D.C. ((2014) ). Online shopping drivers and barriers for older adults: age and gender differences. Computers in Human Behavior, 37: , 133-143. |
[39] | Mandari, H.E., & Chong, Y.L. ((2018) ). Gender and age differences in rural farmers’ intention to use m-government services. Electronic Government, an International Journal, 14: (3), 217-239. |
[40] | Marangunć, N., & Granić, A. ((2015) ). Technology acceptance model: a literature review from 1986 to 2013. Universal Access in the Information Society, 14: (1), 81-95. |
[41] | Mariscal, J., Mayne, G., Aneja, U., & Sorgner, A. ((2019) ). Bridging the gender digital gap. Economics, 13: (1). |
[42] | Martin, F., & Goggin, G. ((2016) ). Digital transformations?: gendering the end user in digital government policy. Journal of Information Policy, 6: (1), 436-459. |
[43] | Martínez-Cantos, J.L. ((2017) ). Digital skills gaps: a pending subject for gender digital inclusion in the European Union. European Journal of Communication, 32: (5), 419-438. |
[44] | Mathieson, K. ((1991) ). Predicting user intentions: comparing the technology acceptance model with the theory of planned behavior. Information Systems Research, 2: (3), 173-191. |
[45] | Moreno, R.R., Molina, C.M., Figueroa, J.C.S., & Moreno, M.R. ((2013) ). Gender and e-government adoption in Spain. International Journal of Electronic Government Research (IJEGR), 9: (3), 23-42. |
[46] | Mumporeze, N., & Prieler, M. ((2017) ). Gender digital divide in Rwanda: a qualitative analysis of socioeconomic factors. Telematics and Informatics, 34: (7), 1285-1293. |
[47] | Nesti, G. ((2019) ). Mainstreaming gender equality in smart cities: theoretical, methodological and empirical challenges. Information Polity, 24: (3), 289-304. |
[48] | Okebukola, P.A., & Woda, A.B. ((1993) ). The gender factor in computer anxiety and interest among some Australian high school students. Educational Research, 35: (2), 181-189. |
[49] | Okunola, O.M., Rowley, J., & Johnson, F. ((2017) ). The multi-dimensional digital divide: perspectives from an e-government portal in Nigeria. Government Information Quarterly, 34: (2), 329-339. |
[50] | Ong, C.S., & Lai, J.Y. ((2006) ). Gender differences in perceptions and relationships among dominants of e-learning acceptance. Computers in Human Behavior, 22: (5), 816-829. |
[51] | Papadakis, S. ((2018) ). Evaluating pre-service teachers’ acceptance of mobile devices with regards to their age and gender: a case study in Greece. International Journal of Mobile Learning and Organisation, 12: (4), 336-352. |
[52] | Pohlman, J.T., & Leitner, D.W. ((2003) ). A comparison of ordinary least squares and logistic regression. Ohio Journal of Science, 103: (5), 118-125. |
[53] | Prins, J.E.J. ((2001) ). E-governance: do digital aids make a difference in policy making? In: J.E.J. Prins, ed., Designing e-government: on the Crossroads of Technological Innovation and Institutional Change, pp. 7-28. The Hague: Kluwer Law International. |
[54] | Scherer, R., Siddiq, F., & Teo, T. ((2015) ). Becoming more specific: measuring and modeling teachers’ perceived usefulness of ICT in the context of teaching and learning. Computers & Education, 88: , 202-214. |
[55] | Sharp, J.H. ((2006) ). Development, extension, and application: a review of the technology acceptance model. Information Systems Education Journal, 5: (9), 1-11. |
[56] | Singhal, R., & Rathore, M. ((2014) ). Information and communication technology for good governance: good governance: a study of e-mitra a study of e-mitra implementation in rajasthan. The IIS University Journal of Social Sciences, 3: (3), 80-97. |
[57] | Simsek, A. ((2011) ). The relationship between computer anxiety and computer self-efficacy. Contemporary Educational Technology, 2: (3), 177-187. |
[58] | Tan, G.W.H., & Ooi, K.B. ((2018) ). Gender and age: do they really moderate mobile tourism shopping behavior. Telematics and Informatics, 35: (6), 1617-1642. |
[59] | Teo, T.S., & Lim, V.K. ((1996) ). Factors influencing personal computer usage: the gender gap. Women in Management Review, 11: (8), 18-26. |
[60] | Terzis, V., & Economides, A.A. ((2011) ). Computer based assessment: gender differences in perceptions and acceptance. Computers in Human Behavior, 27: (6), 2108-2122. |
[61] | Van Deursen, A., Van Dijk, J., & Ebbers, W. ((2006) ). Why e-government usage lags behind: explaining the gap between potential and actual usage of electronic public services in the netherlands. In International Conference on Electronic Government, pp. 269-280. Springer, Berlin, Heidelberg. |
[62] | Venkatesh, V., & Davis, F.D. ((1996) ). A model of the antecedents of perceived ease of use: development and test. Decision Sciences, 27: (3), 451-481. |
[63] | Venkatesh, V., Morris, M.G., & Ackerman, P.L. ((2000) ). A longitudinal field investigation of gender differences in individual technology adoption decision-making processes. Organizational Behavior and Human Decision Processes, 83: (1), 33-60. |
[64] | Venkatesh, V. ((1999) ). Creation of favorable user perceptions: exploring the role of intrinsic motivation. MIS Quarterly, 239-260. |
[65] | Venkatesh, V. ((2000) ). Determinants of perceived ease of use: integrating control, intrinsic motivation, and emotion into the technology acceptance model. Information Systems Research, 11: (4), 342-365. |
[66] | Venkatesh, V., & Morris, M.G. ((2000) ). Why don’t men ever stop to ask for directions? Gender, social influence, and their role in technology acceptance and usage behavior. MIS Quarterly, 115-139. |
[67] | Whitley B.E., Jr. ((1997) ). Gender differences in computer-related attitudes and behavior: a meta-analysis. Computers in Human Behavior, 13: (1), 1-22. |
[68] | Wei, K.K., Teo, H.H., Chan, H.C., & Tan, B.C. ((2011) ). Conceptualizing and testing a social cognitive model of the digital divide. Information Systems Research, 22: (1), 170-187. |
[69] | Wong, K.T., Teo, T., & Russo, S. ((2012) ). Influence of gender and computer teaching efficacy on computer acceptance among Malaysian student teachers: an extended technology acceptance model. Australasian Journal of Educational Technology, 28: (7), 1190-1207. |
Appendices
Appendix I: Validity and reliability of the survey instrument
The survey is an attempt to measure respondents’ experiences with the eMitra service in order to explain how these outcomes vary according to the characteristics of the respondents. The validity of the response measures depend on how appropriate the survey is designed to capture the research question. As discussed in the main text, the survey was designed based on qualitative interviews with women in the population of interest. As is typical of studies of TAM models, the survey was conducted for the specific context of the subject of interest. This approach assures that the survey is constructed with high validity that is tailored to the subject context. The survey is designed to capture various aspects of the ease of use and usefulness of the eMitra service. The research design incorporates multiple operationalizations of the concepts, ease of use and usefulness, as a means of assuring validity of the survey instrument. Additionally, the experiences of females compared to males are robust across the different operationalizations of these concepts which suggests high survey validity.
The reliability of the survey instrument can be assessed by comparing alternative operationalizations because the survey asks similar questions in multiple ways. For instance, the variable satisfaction is measured dichotomously. This variable includes responses to the question of “Are you satisfied/happy with the service you received?” The survey captures a similar concept on a Likert scale with a question about the respondents’ views of the effectiveness of the eMitra service. This question is asked later in the survey after other substantive questions have been asked, which means that the satisfaction question contains little to no priming influence on the effectiveness question. The effectiveness question states “On a scale of 1 to 5, where 1 means strongly disagree and 5 means strongly agree, how much do you agree with the following statements?: e-Mitra is very effective.”
The reliability results from the satisfaction measure can be assessed by comparing regression results based on the effectiveness measure. Since the satisfaction variable is measured dichotomously, the research design in the main text utilizes a linear probability model. The effectiveness measure contains five categories which precludes estimation by a linear probability model. Instead, ordered probit (or ordered logit) accounts for the ordinal nature of Likert scale variables.
Table 6 below provides the results of maximum likelihood regressions using ordered probit with effectiveness as the dependent variable. The coefficient on the main independent variable, female, in model A1 is positive and statistically significant at the 95%. This result replicates the finding in Table 4 model 2, which suggests that the results based on the satisfaction measure are reliable using a similar question but measured on a different scale. Moreover, the greater degree of variation in the Likert measure, because of the five categories as opposed to a dichotomous measure, possibly allows for more nuanced statistical associations. The results for age and education in the female-only sample in Table 5 model 2 of the main text are similar in sign to those in model A2. However, coefficients in model A2 for age and education are statistically significant associations at the 95 and 99% levels, respectively.
Table 6
Ordered probit regression models of usefulness based on effectiveness of service
| (A1) | (A2) | |
| Effectiveness | Effectiveness | |
| Female | 0.208 | |
| (0.103) | ||
| Age | ||
| (0.005) | (0.006) | |
| Above secondary | 0.305 | 0.507 |
| (0.164) | (0.164) | |
| Minority religion | 0.213 | 0.307 |
| (0.141) | (0.202) | |
| Distance | 0.015 | 0.007 |
| (0.059) | (0.063) | |
| Sample | Full | Female only |
| Observations | 441 | 267 |
Errors clustered by block are in parentheses. The base categories are males for gender, below secondary for education, and Hindu for religion.
The other variables in our analysis do not contain comparable Likert scale measures. However, the survey does ask an open-ended question regarding the ease of use of the eMitra service. This question asks “What are the main challenges that you face? Please provide a list and explain.” This question is asked near the end of the survey while the dichotomously measured ease of use questions are asked near the beginning of the survey. We code the respondents’ answers to these questions into multiple dichotomous responses which we label crowded, travel, time, tech, charges, withdraws, personnel, other, and none. For instance, if a respondent listed over-crowded facilities, technological difficulties, and paying extra charges in their list of difficulties then we code their responses into three dichotomously measured variables for crowded, technology, and charges. There are a couple of these variables, time and charges, which can help to gauge the reliability of a few ease of use variables in our analysis. Note that the questions differ substantially in how they are asked, which means that the open-ended question can be a useful means of gauging the reliability of the direct questions but the distributions of each measure differ.
Tables 7–9 below provide cross-tabulations of the variables speed, fees, and wait from our main analysis. Both speed and wait are cross tabulated with the time variable since the time variable does not specify whether the respondent’s challenges with the time required for the services is due to service efficiency or respondents perceptions of being made to wait longer than necessary. The fees variable is cross tabulated with the charges variable from the respondent’s lists of challenges. The fees variable from the main analysis is based on a yes/no type question of whether the respondent is satisfied with the service fees. Similarly, the charges variable from the respondents’ lists of challenges can represent either dissatisfaction with the total amount of charges or perceptions that additional fees were charged.
The cross tabulations indicate that these different approaches to survey questions yielded consistent responses, which suggests reliability of the ease of use measures in the main text. The tables are constructed with the main analysis variables in the y axis (rows) and the alternative measures in the x axis (columns). To compare the variables, the percentages of each response are calculated down columns which enables comparisons across columns. It is important to utilize the percentage comparisons rather than simple frequency comparisons because of the distributions of each measure. Additionally, Chi
In Table 7, categories of speed correlate with time with a Chi
Table 7
Cross tabulation of speed and time
| Speed | Time | ||
|---|---|---|---|
| No | Yes | Total | |
| No | 3 | 36 | 39 |
| 27.27 | 7.09 | 7.51 | |
| Yes | 8 | 472 | 480 |
| 72.73 | 92.91 | 92.49 | |
| Total | 11 | 508 | 519 |
| 100.00% | 100.00% | 100.00% | |
First row has frequencies and second row has column percentages bolded. Chi
Table 8
Cross tabulation of fees and charges
| Fees | Charges | ||
|---|---|---|---|
| No | Yes | Total | |
| No | 97 | 8 | 105 |
| 95.10 | 1.92 | 20.23 | |
| Yes | 5 | 409 | 414 |
| 4.90 | 98.08 | 79.77 | |
| Total | 102 | 417 | 519 |
| 100.00% | 100.00% | 100.00% | |
First row has frequencies and second row has column percentages bolded. Chi
Table 9
Cross tabulation of wait and time
| Wait | Time | ||
|---|---|---|---|
| No | Yes | Total | |
| No | 6 | 82 | 88 |
| 54.55 | 16.33 | 17.15 | |
| Yes | 5 | 420 | 425 |
| 45.45 | 83.67 | 82.85 | |
| Total | 11 | 502 | 513 |
| 100.0% | 100.0% | 100.0% | |
First row has frequencies and second row has column percentages bolded. Chi
In Table 8, categories of fees correlate with charges with a Chi
In Table 9, categories of wait correlate with time with a Chi


