
Online Detection and Infographic Explanation of Spam Reviews with Data Drift Adaptation
Abstract
Spam reviews are a pervasive problem on online platforms due to its significant impact on reputation. However, research into spam detection in data streams is scarce. Another concern lies in their need for transparency. Consequently, this paper addresses those problems by proposing an online solution for identifying and explaining spam reviews, incorporating data drift adaptation. It integrates (i) incremental profiling, (ii) data drift detection & adaptation, and (iii) identification of spam reviews employing Machine Learning. The explainable mechanism displays a visual and textual prediction explanation in a dashboard. The best results obtained reached up to 87% spam F-measure.
1Introduction
Online reviews are a valuable source of information that influences public opinion and directly impacts customers’ decision to acquire a product or service (Zhang et al., 2018). However, some reviews are fabricated to promote or undervalue goods and services artificially, i.e. creating spam data (Reyes-Menendez et al., 2019; Hutama and Suhartono, 2022). Spammers can be humans or bots dedicated to creating deceptive reviews (García-Méndez et al., 2022b; Hamida et al., 2022). In this context, spam detection is a critical task in online systems. Spam negatively impacts the user experience and the performance and security of the system (Wang et al., 2021).
Consequently, a broad set of Machine Learning (ml) methods has been explored for spam detection, mainly supervised learning (Crawford et al., 2015). In recent years, Natural Language Processing (nlp) techniques (García-Méndez et al., 2022a) have been adopted to improve the accuracy of spam detection (Garg and Girdhar, 2021). Given the dynamic nature of the language and behaviour of spammers, the challenge is maintaining the effectiveness of spam detection over time, integrating the detection of model drifts in a stream-based environment as data and concept drifts (Wang et al., 2019). While data drifts are related to changes in the input data, concept drifts reflect over time in the predicted target (Duckworth et al., 2021). Specifically, concept drifts in spam detection refer to the changes in the statistical properties of the spam and non-spam entries over time, which can cause the spam detection system to misclassify reviews. In addition, in a data stream environment, the distribution of input features used to train the spam detection model can change over time, producing data drifts (Barddal et al., 2017). Notably, the latter drifts are easier to detect and deal with in a transparent model than in an opaque one (Cano and Krawczyk, 2019).
Explainability in spam detection refers to understanding and explaining how a particular text was classified as spam by an automated system (Stites et al., 2021). Therefore, in spam detection, an interpretable mechanism for nlp and concept drift techniques is required to detect spammers in real-time efficiently. According to Crawford et al. (2015), the existing data stream spam detection research is scant. Consequently, this paper contributes to an interpretable online spam detection framework that combines nlp techniques and data drift detectors. The proposed framework achieves high accuracy in spam detection and makes the detection process transparent, allowing users to understand why a review is classified as spam. The evaluation with two experimental data sets presents about 85% in the considered evaluation metrics.
The rest of this paper is organized as follows. Section 2 overviews relevant work concerning profiling, classification, data drifts, and explainability for spam detection tasks. Section 3 introduces the proposed method, detailing the data processing, stream-based classification procedures, and online explainability. Section 4 describes the experimental setup and presents the empirical evaluation results considering the online classification and explanation. Finally, Section 5 highlights the achievements and future work.
2Related Work
As previously mentioned, online reviews have become an essential source of information for consumers to make purchasing decisions (Zhang et al., 2018; Al-Otaibi and Al-Rasheed, 2022). However, spam reviews, which are fake or biased reviews, have become a significant problem, leading to distrust and confusion among consumers (Bian et al., 2021). Accordingly, detecting spam reviews is challenging due to the variety of spamming techniques used by spammers; hence, researchers have proposed various approaches for spam review detection (Wu et al., 2018). These techniques are based on ml methods (Albayati and Altamimi, 2019; Liu et al., 2019; Sun et al., 2022) and social network analysis (Liu et al., 2016; Sun et al., 2022). A representative example of the latter is the work by Rathore et al. (2021) on fake reviewer group detection. Their offline graph-based solution, where nodes and edges represent reviewers and products reviewed, respectively, combines the DeepWalk algorithm with semi-supervised clustering. The authors do not perform textual analysis of the reviews, except sentiment analysis.
Spam detection involves large volumes of data, which can be dynamic and continuously changing (Wang et al., 2019). In the case of data streams, not only are reviews continuously arriving, but their statistical properties may change over time, leading to the concept and data drifts (Karakaşlı et al., 2019). On the one hand, the volume and speed of online reviews require the adoption of online spam detection techniques (Miller et al., 2014). On the other hand, outcome explainability is crucial for humans to comprehend, trust, and manage the next generation of cyber defense mechanisms such as spam detection (Charmet et al., 2022). Therefore, this related work compares existing works in terms of (i) stream-based profile modelling for spam detection, (ii) stream-based classification mechanisms, and (iii) transparency and credibility in detection tasks.
2.1Profiling and Classification
Profiling is the process of modelling stakeholders according to their contributions and interactions (Kakar et al., 2021; García-Méndez et al., 2022b). In the case of spam detection, individual profiles are built from the content generated by each stakeholder, humans or bots alike. To overcome information sparsity, the profiles are expected to include side and content information (Faris et al., 2019; Mohawesh et al., 2021), since a richer profile impacts the quality of ml results (Rustam et al., 2021). Mainly, with stream-based modelling, profiles are incrementally updated and refined over time (Veloso et al., 2019, 2020). Concerning online spam detection, the literature considers primary profiling methodologies:
Content-based | profiling explores textual features extracted from the text to identify the meaning of the content (Song et al., 2016; Henke et al., 2021; Mohawesh et al., 2021). It can be obtained using linguistic and semantic knowledge or style analysis via nlp approaches. |
User-based | profiling focuses on both the demographic and the behavioural activity of the user (Miller et al., 2014; Eshraqi et al., 2015; Liu et al., 2016, 2019; Sun et al., 2022). It contemplates demography information, frequency, timing, and content of posts to distinguish legitimate from spammer users. In addition, exploiting the social graph can be relevant since spammers have many followers or friends who are also suspected of being spammers. |
Spam detection is a classification task (Vaitkevicius and Marcinkevicius, 2020; Mohawesh et al., 2021). The main classification techniques encompass supervised, semi-supervised, unsupervised, and deep learning approaches (Crawford et al., 2015) and can be applied offline or online. While offline or batch processing builds static models from pre-existing data sets, online or stream-based processing computes incremental models from live data streams (Leal et al., 2021). This paper focuses on stream-based environments. Regarding transparency, classification models can be divided into interpretable and opaque. Opaque mechanisms behave as black boxes (e.g. deep learning), and interpretable models are self-explainable (e.g. trees- or neighbour-based algorithms) (Carvalho et al., 2019). Interpretable classifiers explain classification outcomes, clarifying why a given content is false or misleading (Škrlj et al., 2021).
2.2Stream-Based Spam Detection Approaches
Social networking has increased spam activity (Kaur et al., 2018). In this context, spam detection approaches have been explored by social networks (e.g. Twitter,11 or Facebook22) (Miller et al., 2014; Eshraqi et al., 2015; Liu et al., 2016; Sun et al., 2022), email boxes (Henke et al., 2021), or crowdsourcing platforms (e.g. Wikipedia,33 Yelp,44 and TripAdvisor55) (Mohawesh et al., 2021). Stream mining became the most effective spam detection approach due to the speed and volume of data. It has been explored in the literature using:
• Data stream clustering approaches. Miller et al. (2014) treated spam detection as an anomaly prediction problem. The proposed solution identifies spammers on Twitter using account information and streaming tweets employing stream-based clustering algorithms. Eshraqi et al. (2015) followed the same methodology, creating clusters of tweets and considering outliers as spam. Song et al. (2016) proposed a new ensemble approach named Dynamic Clustering Forest (dcf) for the classification of textual streams, which combines decision trees and clustering algorithms.
• Data stream classification for spam detection. Sun et al. (2022) proposed a near real-time Twitter spam detection system employing multiple classification algorithms and parallel computing.
• Outlier detection for stream data. Liu et al. (2019) proposed solution identifies outlier reviews, analyses the differences between the patterns of product reviews, and employs an isolation forest algorithm.
2.2.1Drifts in Spam Detection
Model drift occurs when the performance of an ml model loses accuracy over time (Ma et al., 2023). The literature identifies two types of drifts: (i) data drifts and (ii) concept drifts. While data drift occurs when the characteristics of the incoming data change, in concept drifts, both input and output distributions present modifications over time (Desale et al., 2023). According to Gama et al. (2014), concept drift detection methods can be divided into three categories: (i) sequential analysis, (ii) statistical analysis, and (iii) sliding windows. In addition, for Lu et al. (2018), drift detection involves four stages: (i) data retrieval, (ii) data modelling, (iii) test statistics calculation, and (iv) hypothesis test.
Liu et al. (2016) proposed and applied two online drift detection techniques to improve the classification of Twitter spam reviews: (i) fuzzy-based redistribution and (ii) asymmetric sampling. While the fuzzy-based redistribution technique explores information decomposition, asymmetric sampling balances the size of classes in the training data. Song et al. (2016) analysed the distribution of textual information to identify concept drifts in a textual data classification approach. Moreover, Mohawesh et al. (2021) employed a comprehensive analysis to address concept drift in detecting fake Yelp reviews. Finally, Henke et al. (2021) monitored feature evolution based on the similarity between feature vectors to concept drifts in emails. The solution performs spam classification and concept drift detection as parallel and independent tasks.
In contrast to the previous drift detection works, the current approach adopts self-explainable models to provide explanations, increasing classification quality and user trust.
2.2.2Explainability
Explainable spam detection refers to explaining why an input was classified as spam. It promotes transparency and clarity, detailing why a particular review was flagged as spam (Stites et al., 2021). Accordingly, interpretable models, such as rule-based systems or decision trees, can explain their reasoning, enhancing trust, reducing bias, and helping to discover additional insights (Rudin, 2019). In addition, nlp enriches the explanations by adding a textual description (Upadhyay et al., 2021). Explainable spam detection has been explored in the literature using Local Interpretable Model Agnostic Explanation (lime) (Ribeiro et al., 2016) and Shapley Additive Explanations (shap) (Reis et al., 2019; Han et al., 2022; Zhang et al., 2022).
The literature shows that existing explainable detectors of fake content in online platforms adopt essentially supervised classification and implement offline processing (Crawford et al., 2015; Henke et al., 2021). Therefore, this paper intends to address this problem by proposing an online solution for identifying and explaining spam reviews, incorporating data drift detection and adaptation.
2.3Research Contribution
The literature review shows a research gap in detecting data drifts and explaining the classification of textual reviews as spam in real time. In this respect, Rao et al. (2021) identifies spam drift detection as a challenge requiring more research. Table 1 provides an overview of the above works considering the data domain, profiling (user- and content-based), spam detection, drift detection, and explainability.
Therefore, this work contributes with an online explainable classification method to recognize spam reviews and, thus, promote trust in digital media. The solution employs data stream processing, updating profiles, and classifying each incoming event. First, user profiles are built using user- and content-based features engineered through nlp. Then, the proposed system monitors the incoming streams to detect data drifts using static and sliding windows. Tree-based classifiers are exploited to obtain an interpretable stream-based classification for classification. Finally, the proposed method provides the user with a dashboard combining visual data and natural language knowledge to explain why an incoming review was classified as spam.
Table 1
Comparison of stream-based spam and drift detection approaches.
| Authorship | Domain | Profiling | Spam detection | Drift detection | Explainability |
| Liu et al. (2016) | Content User | Classification (Multiple) | Data | ✗ | |
| Song et al. (2016) | Spam | Content | Clustering (dt) | Concept | ✗ |
| Mohawesh et al. (2021) | Yelp | Content | Classification (lr, pnn, svm) | Concept | ✗ |
| Henke et al. (2021) | Content | Classification (svm) | Concept | ✗ | |
| Proposed solution | Yelp | Content User | Classification (dt, rf) | Data | ✓ |
DT – Decision Tree, LR – Logistic Regression, PNN – Perceptron Neural Network, RF – Random Forest, SVM – Support Vector Machine.
As previously explained, concept drift refers to changes in the predicted target over time (i.e. changes in the statistical properties of the spam and non-spam entries), while data drift focuses on input data variations (i.e. changes in the input features used to train the spam detection model). This work focuses on data drift detection, considering its relationship with the transparency of the model. Specifically, detecting data drifts and associated characteristics helps provide richer information to end users via the explainability dashboard. Although no other work has explored the Yelp dataset for data drift and spam detection, work on other topics, such as sentiment analysis, indicates its suitability (Chumakov et al., 2023; Madaan et al., 2023; Wu et al., 2023).
3Method
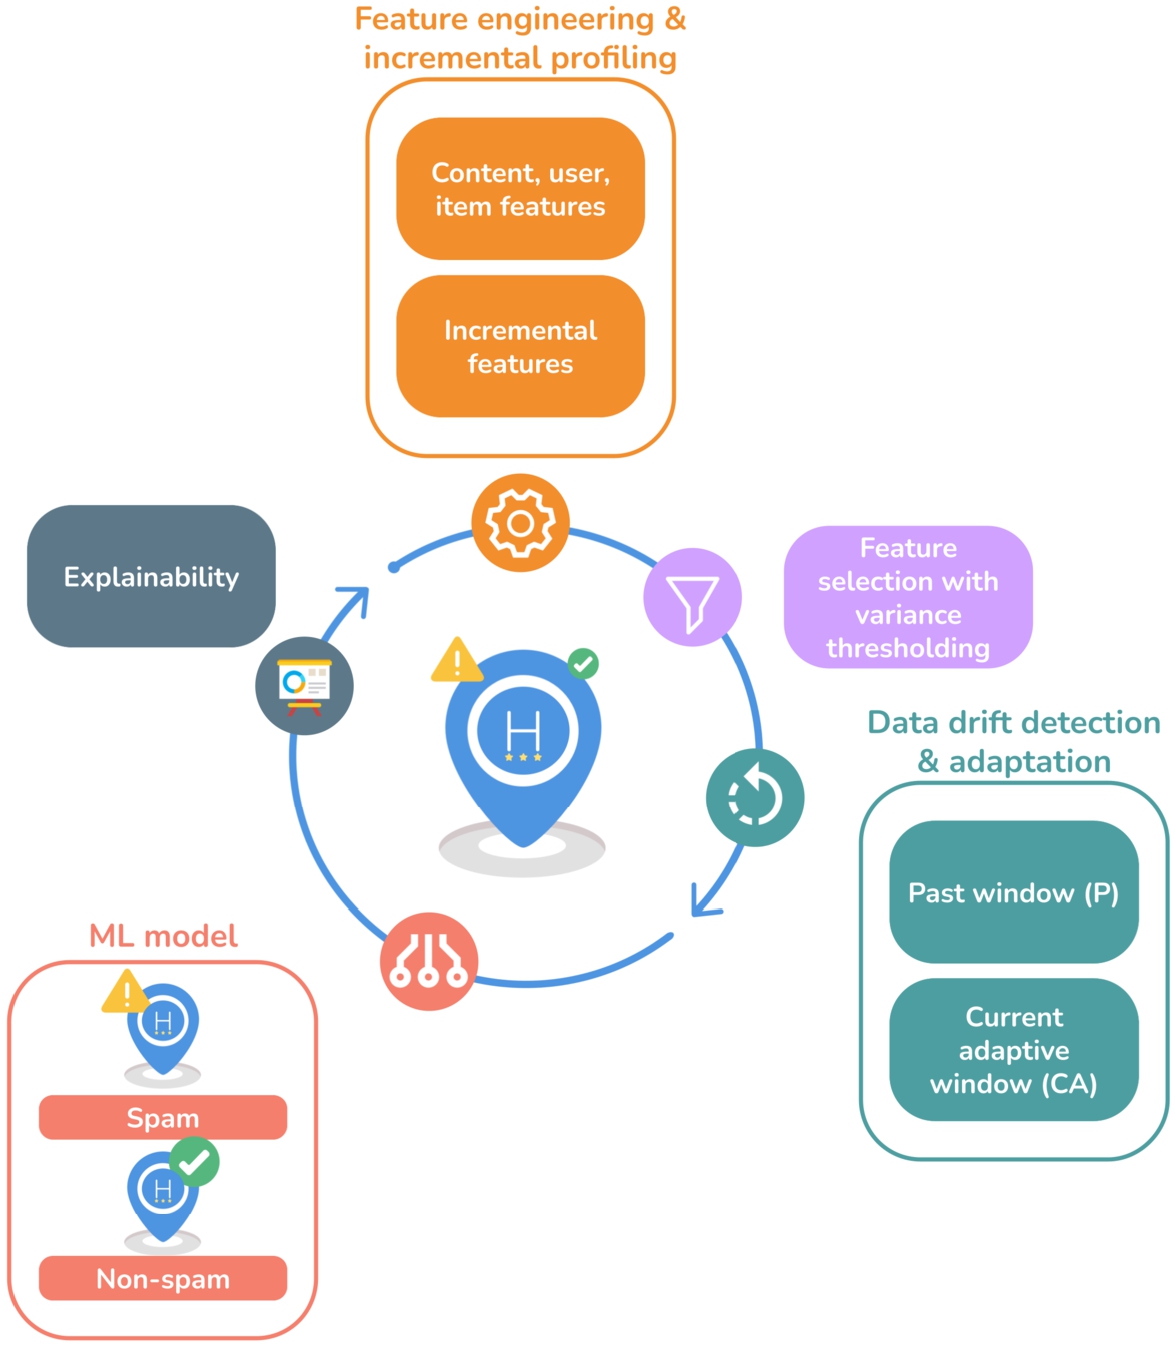
The proposed method explores online reviews for stream-based spam classification with drift detection. In addition, it explores self-explainable ml models for transparency. Hence, the data stream classification pipeline, represented in Fig. 1, comprises: (i) feature engineering & incremental profiling (Section 3.1), (ii) feature selection (Section 3.2), (iii) data drift detection & adaptation (Section 3.3), (iv) ml classification (Section 3.4), and (v) explainability (Section 3.5).
Fig. 1
Data stream classification pipeline.
3.1Feature Engineering & Incremental Profiling
The proposed solution processes the content of the reviews with the help of nlp techniques. The content-based features extracted represent relevant linguistic (morphological, syntactical, and semantic) attributes of the reviews. The engineered features are the ratio of adjectives, adverbs, interjections, nouns, pronouns, punctuation marks, verbs, characters, words, difficult words, and url counters. Moreover, the system also considers the emotional charge of the content (i.e. anger, fear, happiness, sadness, and surprise). The same applies to the polarity charge among negative, neutral, and positive sentiments. More sophisticated linguistic features include readability, using the Flesch readability score, the McAlpine eflaw score,66 and the reading time. In the end, the content itself, i.e. the words, are analysed through word-grams. The char-grams were discarded due to their low scalability in online operation. These content-based features are then used to incrementally build the corresponding user values to update the user profiles. Additionally, incremental relational item features are computed by building a graph of item and user nodes connected by edges containing the corresponding incremental engineered features of the user-reviewed items.
3.2Feature Selection
Feature selection reduces the feature space dimension by choosing the most relevant features for the classification and contributes to improving the quality of the input data. The adopted selection technique relies on feature variance to discard those with variance lower than a configurable threshold, as suggested by the literature (Engelbrecht et al., 2019; Treistman et al., 2022). In the case of online classification, where the arriving data may evolve with time, the selection of representative features must be performed continuously or periodically.
3.3Data Drift Detection and Adaptation
The variability of real data over time may affect the performance of ml models, namely the values of evaluation metrics (e.g. accuracy, precision, recovery, etc.). However, the source of the problem may be due to data drifts, concept drifts, ineffective hyper-parameter optimization, and/or class imbalance.
Thus, the proposed system continuously monitors the incoming stream for data drifts and, periodically, under-samples and optimizes the hyperparameters, using two windows: the past (p) static window and the current adaptive (ca) sliding window, holding n and w samples, respectively.
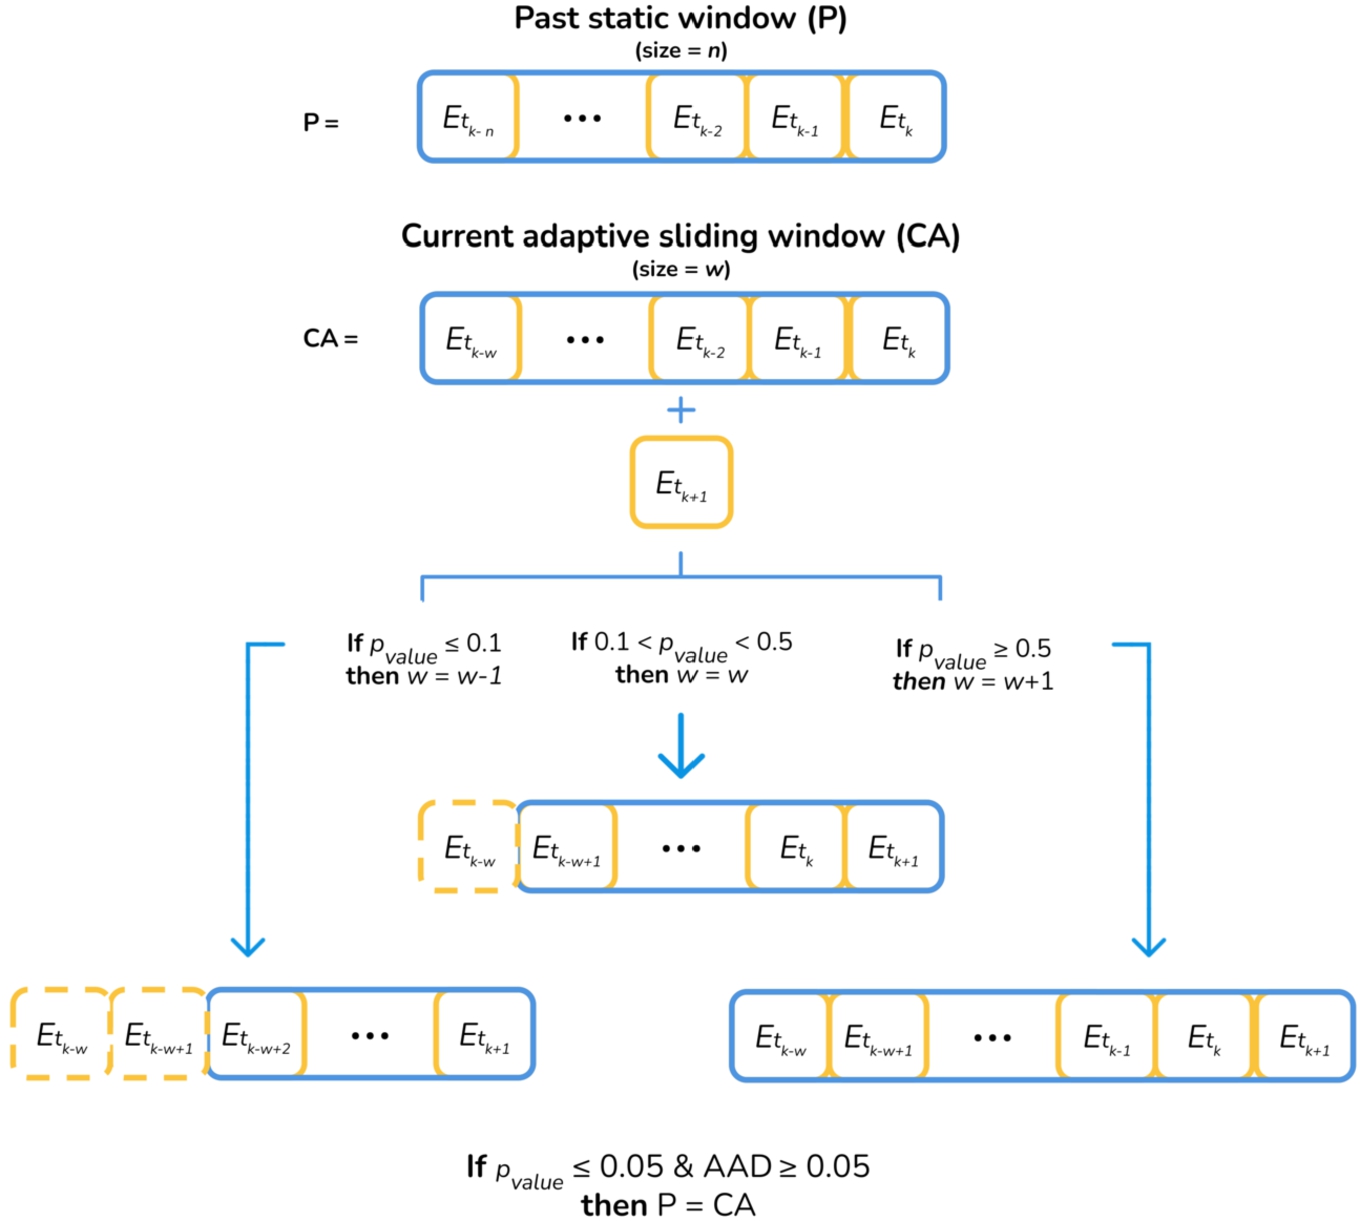
The data drift detector starts operating when the cold start ends, and the p window is initialized with the expected n samples. The detector identifies a data drift whenever: (i) the inter-window word-gram p-value is lower77 than 0.05, and (ii) the inter-window absolute accuracy difference (aad) is higher than 0.05. Algorithm 1 details the data drift detection and adaptation process. The threshold values of 0.05, 0.1, and 0.5 were inspired by the works by Solari et al. (2017), Leo and Sardanelli (2020), Ritu Aggrawal (2021), respectively. Figure 2 illustrates this process. The data drift detector works as follows:
• Calculates the word-gram frequency matrices (i.e. the columns represent the word-grams and the rows, the entries) for the p and ca windows.
• Sum_wordgrams method transforms the latter matrices into vector format (a vector for p and a vector for ca) by summing the word-gram frequency for all entries.
• Discards the columns with a frequency lower than 6 in both sum_wordgrams vectors.
• Computes the p-value between the word-grams frequency vectors of p and ca windows.
• Computes the inter-window aad.
• Updates the size of the ca:
– If the p-value ⩽ 0.1, the ca windows size decrements by one.
– If the p-value > 0.1 and p-value < 0.5, the ca windows size remains unchanged.
– If the p-value ⩾ 0.5, the ca windows size increments by one.
• Identifies a data drift when the inter-window word-gram p-value is lower (or equal) and the inter-window aad is higher (or equal) than 0.05. Then, it replaces the p with the ca window and recalculates the optimal hyperparameters. The hyperparameter_computation method applies an exhaustive search technique over the configuration parameters listed in Fig. 3. Ultimately, the ml model is trained using the ml_update function with the hyperparameters selected and the ca samples.
Algorithm 1
: Data drift detection and classification

Fig. 2
Data drift detection and adaptation.
3.4ML Classification
The following online ml algorithms were used as they exhibited good performance in similar classification problems (Liu et al., 2016; Song et al., 2016; Sun et al., 2022).
• Hoeffding Tree Classifier (htc) (Pham et al., 2017) is the basic decision tree model for online learning.
• Hoeffding Adaptive Tree Classifier (hatc) (Stirling et al., 2018) monitors branches and replaces them based on their performance.
• Adaptive Random Forest Classifier (arfc) (Gomes et al., 2017) is an ensemble of trees with diversity induction through random re-sampling and concept drift detection. The prediction results are obtained using majority voting.
The algorithmic performance assessment follows the prequential evaluation protocol (Gama et al., 2013) and considers accuracy, macro- and micro-averaging F-measure, and run-time metrics.
3.5Explainability
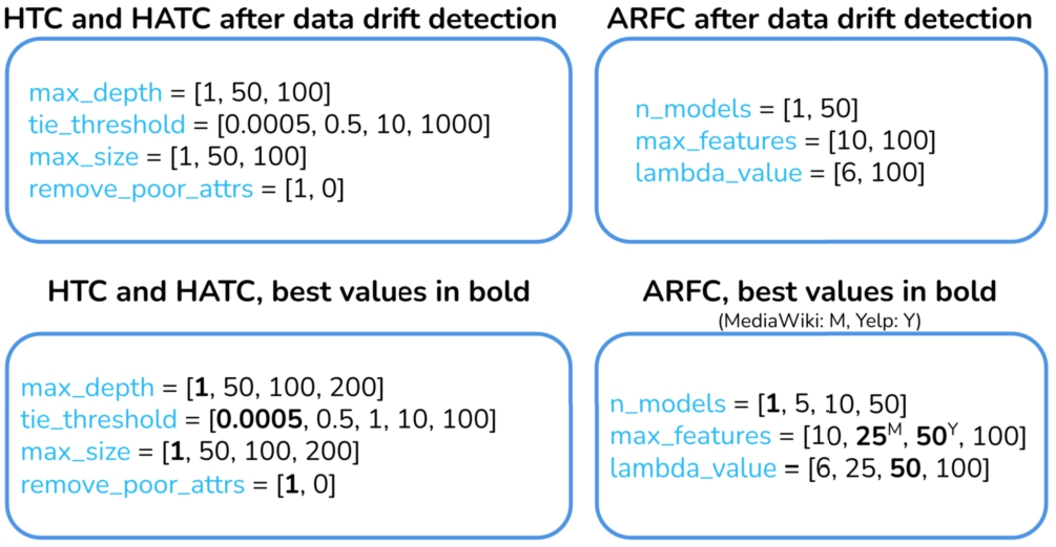
This module provides information about the most relevant features for the classification, i.e. those with a frequency of appearance greater than a configurable threshold. This information is extracted from the estimators of the tree models used (see Fig. 3): htc single-model estimator (Pham et al., 2017), hatc single-model estimator (Stirling et al., 2018) and arfc multi-model estimator (Gomes et al., 2017). The predictions regarding the most relevant features and data drift detection are described in natural language. Furthermore, the decision tree path followed is also provided, along with an automatic description obtained from a Large Language Model.
Fig. 3
Model hyperparameter configuration (best values in bold).
4Experimental Results
This section describes the experimental data set (Section 4.1) and the implementation of the different modules88: (i) feature engineering & incremental profiling (Section 4.2), (ii) feature selection (Section 4.3), and (iii) data drift detection & adaptation (Section 4.4). The classification and explainability results are detailed in Section 4.5 and Section 4.6, respectively.
The experiments contemplate four stream classification scenarios, incorporating feature selection, hyperparameter optimization99 and incremental accuracy updating.
Scenario 1. The data stream classification runs on a single processing thread. | |
Scenario 2. The data stream classification runs on a range of 10–20 parallel threads based on the workload to reduce the experimental run-time. To preserve the original data distribution, the chronologically ordered data stream was divided into consecutive sub-streams, and then, each sub-stream was processed in a dedicated thread. | |
Scenario 3. The data stream classification includes data drift detection & adaptation and runs according to scenario 2. | |
Scenario 4. The data stream classification runs on a single processing thread with data drift detection & adaptation.1010 |
All experiments were performed using a server with the following hardware specifications:
• Operating System: Ubuntu 18.04.2 LTS 64 bits
• Processor: IntelCore i9-10900K 2.80 GHz
• RAM: 96 GB DDR4
• Disk: 480 GB NVME + 500 GB SSD
4.1Experimental Data Set
The Yelp data set1111 is composed of 359 052 leisure activity entries between October 2004 and January 2015, distributed between 36 885 and 322 167 samples of spam and non-spam content, respectively (see Table 2). Moreover, the MediaWiki data set1212 contains contributions to travel wikis between August 2003 and June 2020. It is composed of 319 856 entries, distributed between 24 877 and 249 979 samples of spam and non-spam content, respectively (see Table 2).
Table 2
Distribution of classes in the experimental data sets.
| Data set | Class | Number of entries |
| Yelp | Spam | 36885 |
| Non-spam | 322167 | |
| Total | 359052 | |
| MediaWiki | Spam | 24877 |
| Non-spam | 294979 | |
| Total | 319856 |
4.2Feature Engineering & Incremental Profiling
Table 3
Content-based features explored per experimental data set.
| Data set | ID | Name | Description | Type |
| Common | 1 | Adjective ratio | Ratio of adjectives in the content | Engineerd (Eng.) |
| 2 | Adverb ratio | Ratio of adverbs in the content | ||
| 3 | Character count | Number of characters in the content | ||
| 4 | Difficult word count | Number of the difficult words in the content | ||
| 5 | Emotion (anger, fear, happiness, sadness, surprise) | Load of the different emotions in the content | ||
| 6 | Flesch readability | Readability score of the content | ||
| 7 | Interjection ratio | Ratio of interjections in the content | ||
| 8 | McAlpine eflaw readability | Readability score of the content for non-native English speakers | ||
| 9 | Noun ratio | Ratio of nouns in the content | ||
| 10 | Polarity | Sentiment of the content | ||
| 11 | Pronoun ratio | Ratio of pronouns in the content | ||
| 12 | Punctuation ratio | Ratio of punctuation marks in the content | ||
| 13 | Reading time | Content reading time | ||
| 14 | url count | Number of url in the content | ||
| 15 | Verb ratio | Ratio of verbs in the content | ||
| 16 | Word count | Number of words in the content | ||
| 17 | Word n-grams | Single and bi-words grams | ||
| Yelp | 18 | Rating-polarity deviation | Rating deviation concerning the polarity of the content | Eng. |
| 19 | Review rating | Rating of the review | Raw | |
| MediWiki | 20 | Bot flag | The user is a bot | Raw |
| 21 | Deleted flag | Part of the revision content is hidden | ||
| 22 | New flag | It is the first revision of a page | ||
| 23 | Revert flag | The revision was reverted | ||
| 24 | Size difference | Difference in the number of characters added and deleted in the revision | ||
| 25 | Edit quality | False/true damaging & good faith probability | ||
| 26 | Item quality | a, b, c, d, e probability | ||
| 27 | Article quality | ok, attack, vandalism, wp10b, wp10c, wp10fa, wp10ga, wp10start, wp10stub probability |
This section details the implementations and nlp techniques used to create the classification features. Table 3, Table 4, and Table 5 detail the content features, the incremental user features, and the incremental item features for Yelp and MediaWiki data sets, respectively.
Most ratio and counter features in Table 3 (features 1, 2, 7, 9, 11, 12, 15 in Table 3) are computed using the spaCy1313 tool to gather their grammatical category (token.pos_ feature). The character and word count (features 3 and 16, respectively) have been directly calculated with the Python len function.1414 The url count (feature 14) was computed using a regular expression.1515 The emotion (feature 5) and polarity (feature 10) are calculated using Text2emotion1616 and TextBlob,1717 respectively. The rating-polarity deviation is computed as the difference between those values after moving the polarity to a Likert scale1818 (feature 18). The system uses Textstat1919 for the readability (features 4, 6 and 8) and reading time (feature 13). Word-grams (single and bi-words, feature 17) are obtained with CountVectorizer2020 with the hatc model as the meta-transformer, and using the following parameters: max_df=0.7, min_df=0.1.2121 For the word-grams generation, the review is pre-processed, removing non-textual characters (numbers, punctuation marks, and subsequent blank spaces), stop words,2222 and url instances. Then, the review text is lemmatized with spaCy using the en_core_web_md model.2323 The drift detector exclusively uses the inter-window word-grams p-value variations.
Table 4 and Table 5 summarize the user incremental features (58 features) and item incremental features (92 features) generated from the content-based features in Table 3. The user engineered features of Table 4 and Table 5 correspond to the incremental average
(1)
(2)
Table 4
User engineered features for both experimental data sets.
| ID | Name | Description |
| User features | Incremental average and maximum per user regarding features 1 to 27 in Table 3. | |
| 82 | User post count | Cumulative number of posts per user. |
| 83 | User spam tendency | Known spamming behaviour per user. |
| 84 | User posting antiquity | Posting antiquity per user (in weeks). |
| 85 | User posting frequency | Weekly posting frequency per user. |
Table 5
Item engineered features for both experimental data sets.
| ID | Name | Description |
| Item features | Incremental average and maximum per item regarding features 1 to 27 in Table 3. | |
| Item and rating features | Incremental average and maximum per item and rating regarding features 1 to 19 in Table 3. |
4.3Feature Selection
To reduce the feature space dimension, the variance of the features in Table 3 and Table 4 is analysed with the help of the VarianceThreshold2424 from River 0.11.1.2525 The threshold is set to 0, the default value. In the case of Yelp, only feature 14 in Table 3 and its incremental versions in Table 4 and Table 5 were discarded. The discarded MediaWiki features include features 21 and 22 in Table 3 and their incremental versions in Table 4 and Table 5, along with the incremental version of feature 20 in Table 4. All remaining features passed the threshold and were, thus, considered relevant for the classification.
4.4Data Drift Detection and Adaptation
While standard online ml models can adapt to data changes over time, they are still affected by data drift, also known as covariate shift. To address this issue, scenario 3 incorporates data drift detection & adaptation. Moreover, it defines that: (i) the cold start spans over the first 500 samples, corresponding to the initial width of the p window; (ii) the maximum width of ca sliding windows is 2000 samples. The proposed data drift detector determines the inter-window word-gram p-value and the inter-window aad, using the Chi2ContingencyResult function2626 and the accuracy_score function,2727 respectively.
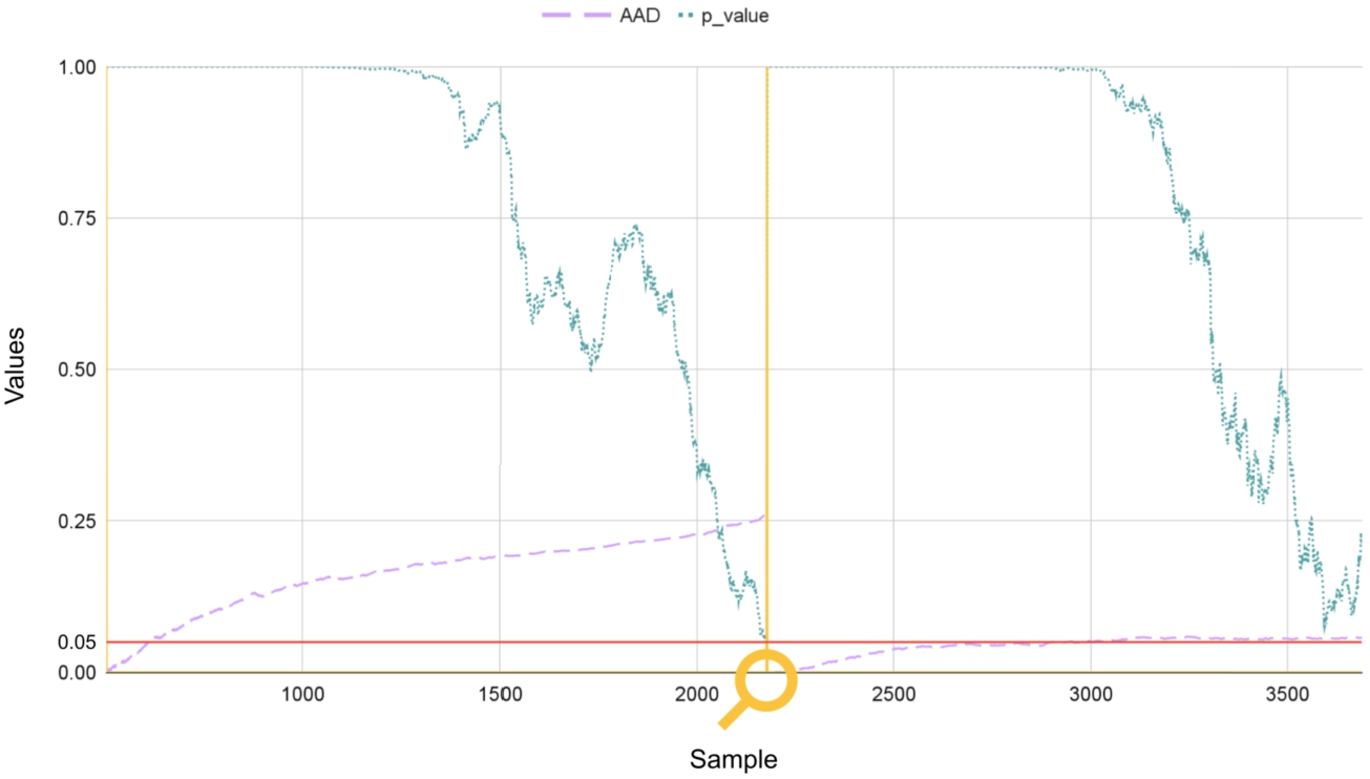
Figure 4 shows the evolution of the inter-window aad and word-gram p-value. The lens marks the detected data drift when p-value drops to 0.05, and aad is above 0.05.
Fig. 4
Data drift detection & adaptation based on inter-window aad and word-gram p-value.
Once a drift is identified, the hyperparameter optimization starts. This process, which is the most time demanding, employs GridSearch2828 with reduced configuration parameters (see Fig. 3).
4.5ML Classification
The selected classification techniques include htc,2929 hatc,3030 and arfc3131 from River 0.11.1.3232
Figure 3 details all hyperparameter optimization values. Their ranges and best values were defined experimentally. Identifying the best values relied on an ad hoc implementation of GridSearch for data streams.
As the solution operates in streaming mode, no retraining is needed. However, the model’s performance is expected to be lower during cold start (initial samples) or with tiny data streams. Consequently, this solution is intended for domains continuously producing large volumes of textual data.
Summing up, the results in Tables 6, 7 and 8 are estimated with an ad hoc implementation of the progressive_val_score3333 from River 0.11.1. Moreover, the validation scheme comprises prediction and training steps as the system operates in streaming. Consequently, the results displayed correspond to the last computation with the last incoming sample, that is, the last chronologically ordered sample.
Table 6 shows the results obtained in the spam versus non-spam review classification in the four scenarios with the Yelp data set.
Table 6
Online spam prediction results (best values in bold) for the Yelp data set.
| Scenario | Model | Accuracy | F-measure | Time (s) | ||
| Macro | Non-spam | Spam | ||||
| 1 | htc | 61.22 | 54.48 | 72.00 | 36.96 | 29.20 |
| hatc | 61.42 | 55.07 | 71.96 | 38.18 | 32.26 | |
| arfc | 65.96 | 65.96 | 66.13 | 65.78 | 205.45 | |
| 2 | htc | 62.51 | 57.99 | 71.77 | 44.21 | 5.07 |
| hatc | 62.17 | 57.70 | 71.44 | 43.97 | 6.39 | |
| arfc | 60.76 | 60.75 | 60.99 | 60.52 | 19.93 | |
| 3 | htc | 67.88 | 67.06 | 72.26 | 61.87 | 287.50 |
| hatc | 69.57 | 69.55 | 70.26 | 68.84 | 515.32 | |
| arfc | 75.82 | 75.55 | 73.00 | 78.10 | 2346.75 | |
| 4 | arfc | 78.75 | 78.44 | 75.85 | 81.03 | 9678.32 |
In scenarios 1 and 2, the values approach the 60% threshold for all models. Unfortunately, the spam F-measure in scenario 1 does not reach the 40% in htc and hatc. Scenarios 1 and 2 display the same accuracy results since they only differ on the number of running threads. Nonetheless, scenario 3 presents a remarkable improvement in the spam F-measure (+30.66 percentage points for hatc). Scenario 3, with data drift detection & adaptation, reaches a spam F-measure of 78.10% and an average run-time per sample of 32 ms with the arfc model, detecting an average of 1.75 drifts per thread (35 data drifts in total). This indicates that data drift detection & adaptation contributes to increasing the spam classification accuracy (+17.58 percentage points in F-measure) and that multi-threading with 20 threads can process an average of 31 sample/s. Finally, scenario 4 exploits arfc, the best-performing model in scenarios 1, 2, and 3, with data drift detection & adaptation on a single processing thread. It presents top values for all metrics, including an 81.03% in spam F-measure and an average run-time per sample of 130 ms. This last scenario was able to detect 14 drifts and process 8 sample/s. The difference in the number of data drifts detected in scenario 3 (35) and scenario 4 (14) is caused by thread cold start, i.e. each one of the 20 threads starts with a void model.
Table 7 shows the evaluation with the MediaWiki data set. The low results of scenario 2, caused by parallelization, improve in scenario 3 thanks to data drift detection & adaptation. The promising performance of arfc is further enhanced in scenario 4 with a notable increase in the non-spam F-measure between scenario 1 and 4 (+11.84 percentage points). All evaluation metrics are around 85%. The number of data drifts and sample processing rate are similar to those obtained with the Yelp data set. In scenario 3, the arfc model reports an average run-time per sample of 47 ms (21 sample/s) and 38 data drifts (3.8 drifts per thread). The ml model in scenario 4 has identified 10 data drifts and processed 116 ms/sample.
Table 7
Online spam prediction results (best values in bold) for the MediaWiki data set.
| Scenario | Model | Accuracy | F-measure | Time (s) | ||
| Macro | Non-spam | Spam | ||||
| 1 | htc | 80.78 | 80.05 | 76.23 | 83.87 | 18.64 |
| hatc | 80.75 | 80.02 | 76.20 | 83.84 | 21.28 | |
| arfc | 71.15 | 71.11 | 72.18 | 70.03 | 65.21 | |
| 2 | htc | 79.65 | 78.95 | 75.10 | 82.79 | 4.40 |
| hatc | 79.84 | 79.16 | 75.40 | 82.92 | 5.02 | |
| arfc | 69.75 | 69.72 | 70.68 | 68.76 | 9.91 | |
| 3 | htc | 81.78 | 81.46 | 79.03 | 83.89 | 373.73 |
| hatc | 82.23 | 82.00 | 79.97 | 84.03 | 510.45 | |
| arfc | 84.03 | 83.80 | 81.84 | 85.75 | 2333.31 | |
| 4 | arfc | 86.13 | 85.89 | 84.02 | 87.75 | 5817.78 |
The appropriateness of the proposed drift detection algorithm is supported by its comparison with the Early Drift Detection Method (eddm)3434 and ADaptive WINdowing (adwin)3535 drift detectors. Table 8 shows the results of the arfc model in scenario 4 with the three drift detectors and the selected experimental data sets. The proposed drift detector attains the best results followed by adwin (23.24 percent points lower in the F- measure for the spam class). Moreover, eddm detects many drifts (793 and 161 for the Yelp and MediaWiki data sets, respectively), which increases the number of training sessions, negatively affecting performance. adwin identifies a few drifts in the Yelp data set (i.e. 6) and a higher number in the MediaWiki data set (38).
Table 8
Online spam prediction results in scenario 4 with different drift detectors (best values in bold).
| Data set | Drift detector | Accuracy | F-measure | Time (s) | ||
| Macro | Non-spam | Spam | ||||
| Yelp | eddm | 54.58 | 54.58 | 54.53 | 54.63 | 373.37 |
| adwin | 60.56 | 60.56 | 60.70 | 60.42 | 363.12 | |
| Proposed | 78.75 | 78.44 | 75.85 | 81.03 | 9678.32 | |
| MediaWiki | eddm | 62.70 | 62.70 | 63.22 | 62.17 | 1078.25 |
| adwin | 65.09 | 65.08 | 65.65 | 64.51 | 1178.08 | |
| Proposed | 86.13 | 85.89 | 84.02 | 87.75 | 5817.78 | |
Analysis of these spam detection results against those of related works found in the literature with the Yelp data set is merely indicative, as it compares the performance of incremental online versus offline classification methods. Nevertheless, the current method outperforms the 62.35% accuracy reported by Mohawesh et al. (2021) by 16.4 percent points in the Yelp NYC data set with 322 167 reviews. Furthermore, the values obtained with the adwin concept drift detection technique by Mohawesh et al. (2021) are aligned with those reported in Table 8. This helps to validate the current method, which attains superior performance. Unfortunately, no information is provided for the specific case of the spam class (i.e. micro-averaging evaluation), in which the current incremental method surpasses the 80% barrier in F-measure. Moreover, Mohawesh et al. (2021) focused on concept rather than data drift and did not include explainability capabilities, a distinctive feature of the current method.
4.6Explainability
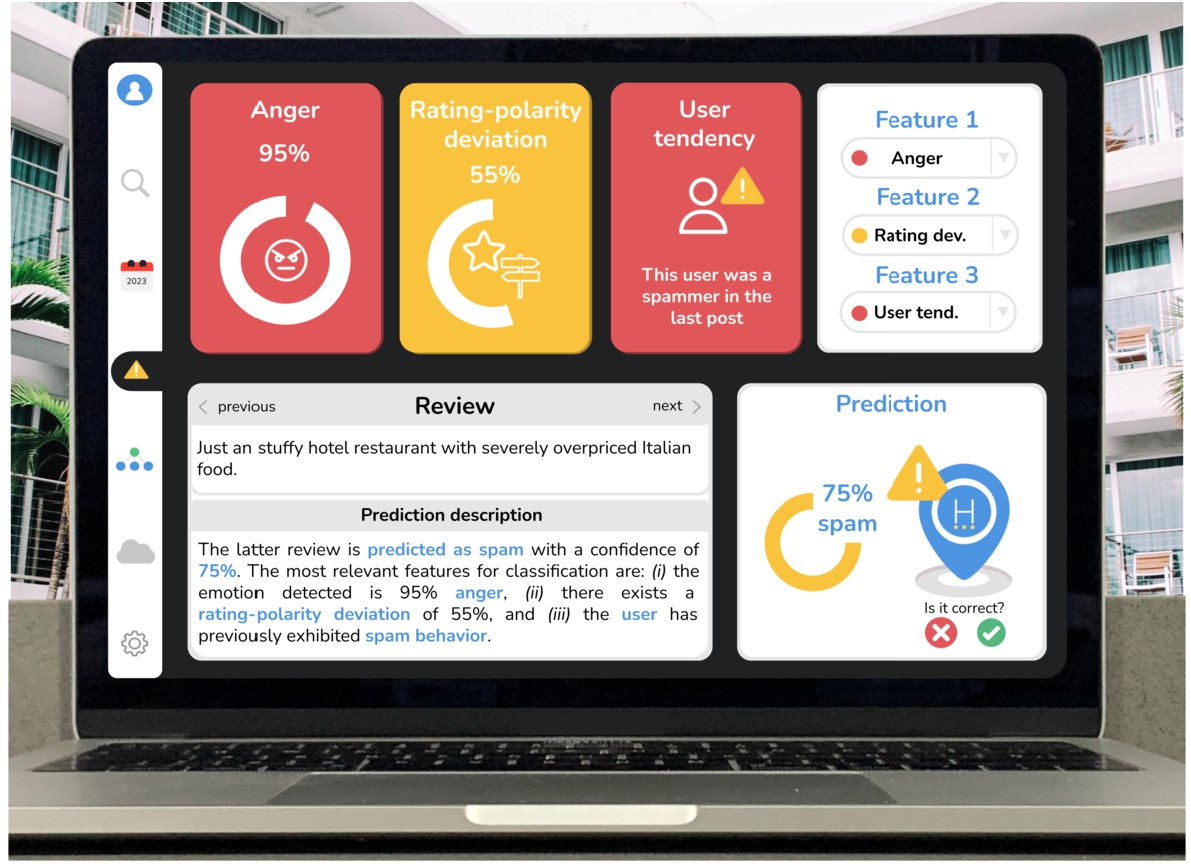
Figure 5 displays the graphical and textual explanation of the classification of an incoming review. The buttons on the left vertical bar enable: (i) administrator profile access, (ii) search reviews by textual content, (iii) search reviews by timestamp, (iv) access to alerts, (v) visualization of the decision tree and associated natural language description (see Fig. 6), (vi) saving the results in the cloud, and (vii) configuring the colour layout (i.e. dark or clear mode). The most representative features for the classification are shown in the top part. The relevance of the features corresponds to their frequency of appearance in the decision tree path, considering only positive (greater than) bifurcations (see the graph in Fig. 6). The white feature navigation panel on the top right displays the most relevant features. The coloured circle that accompanies this drop-down menu represents the level of severity (i.e. green when the value is higher than the 50th user quartile, yellow if the feature value is within the 50th–25th range, and red when it is lower than the 25th user quartile). While these selectors only apply to the coloured cards on the left, the review panel on the bottom affects the whole dashboard and enables the analysis of different reviews (i.e. using the previous and next buttons). Finally, there are two additional buttons for feedback (i.e. to indicate whether the prediction is correct or not). This allows a manager to provide feedback, acting as an expert in the loop. The displayed review exhibits a high charge of anger and a significant deviation between the user rating and the detected polarity, the editor has been associated with spam content in the past, and the sample has been classified as spam with a 75% confidence using the Predict_Proba_One function3636 from River 0.11.1.
Fig. 5
Explainability dashboard (relevant features).
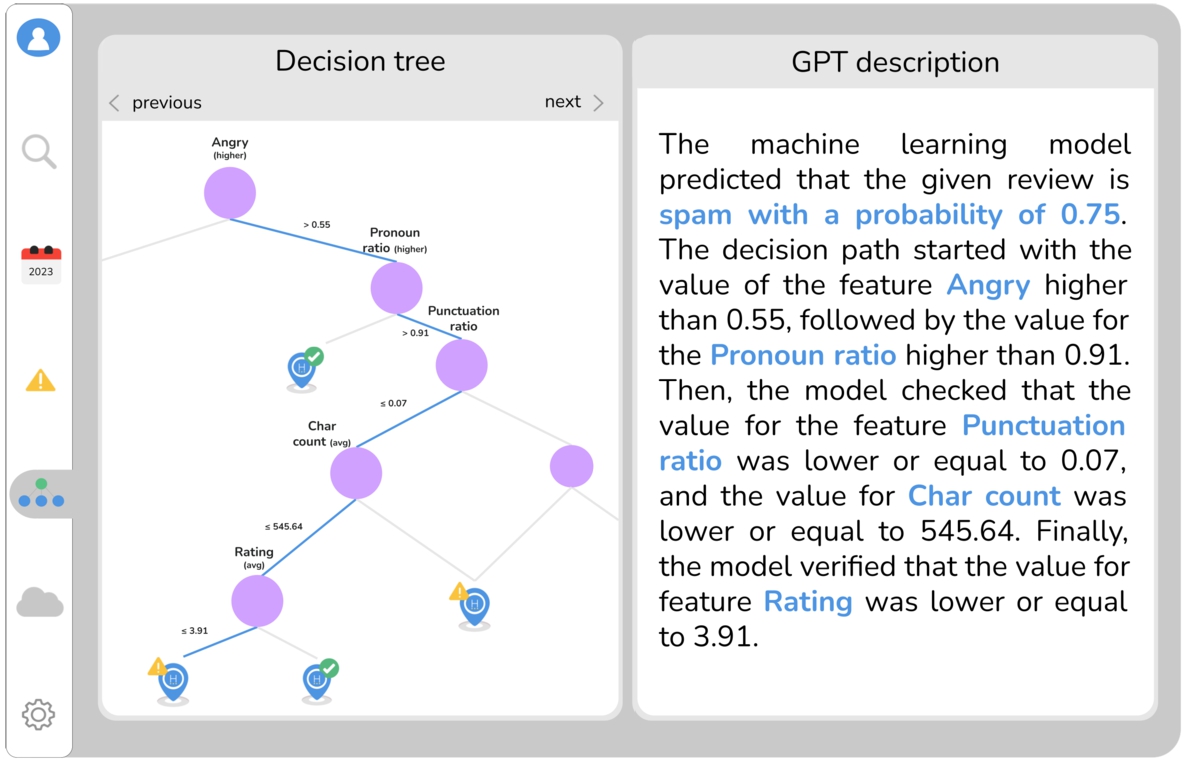
Finally, the system presents the decision tree path of the prediction and the corresponding natural language description obtained with gpt33737 (see Fig. 6). gpt3 was configured to use the text-davinci-003 model with the default parameters, except the temperature parameter, which was set to 0.7, to generate human-like natural language descriptions. At the top, the administrator can navigate the different decision trees using the previous and next buttons, with the decision path highlighted in blue.
Fig. 6
Explainability dashboard (decision path and Large Language Model description).
5Conclusion
The use of crowdsourcing platforms to get information about products and services is growing. Customers search for reviews to make the best decision. Individuals submit dishonest and misleading feedback to manipulate a product or service’s reputation or perception. These spam reviews can be created for various reasons, including financial gain, personal grudges, or competitive advantage. To address this problem, the proposed online method identifies and explains spam reviews. In addition, this research contributes with an online explainable classification engine to recognize spam reviews and, thus, to promote trust in digital media.
Specifically, the proposed method comprises (i) stream-based data processing (through feature engineering, incremental profiling, and selection), (ii) data drift detection & adaptation, (iii) stream-based classification, and (iv) explainability. The solution relies on stream-based processing, incrementally updating the profiling and classification models on each incoming event. Specifically, user profiles are computed using user- and content-based features engineered through nlp. Monitoring the incoming streams, the method detects data drifts using static and sliding windows. The classification relies on tree-based classifiers to obtain an interpretable stream-based classification. As a result, the user dashboard includes visual data and natural language knowledge to explain the classification of each incoming event. The experimental classification results of the proposed explainable and stream-based spam detection method show promising performance: 78.75% accuracy and 78.44% macro F-measure obtained with the Yelp data set, and 86.13% accuracy and 85.89% macro F-measure with the MediaWiki data set. Moreover, the proposed data drift detection & adaptation approach performs better than well-known drift detectors (23.24 percent points higher in the F-measure for spam detection). According to the related work analysis, this proposal is the first to jointly provide stream-based data processing, profiling, classification with data drift detection & adaptation, and explainability.
This solution can be extended to detect orchestrated groups of active spammers thanks to its modular design with nlp techniques and ad doc clustering methods for streaming operation. To this end, additional side and content features can be incorporated to cluster contributors by location and temporal affinity. New content-based features can be explored to represent the semantic (e.g. ontology-based like WordNet Domains) and non-semantic similarity (e.g. cosine distance) between reviews. In this regard, the current version of the system already considers sentiment and emotion analysis. The corresponding incremental features can then be designed per user and group of closely related users. The system should, therefore, be able to dynamically adapt to changes in the spamming behaviour of both individuals and groups. Moreover, in future work, the online processing throughput can be further improved by adopting parallelization algorithms, which explore the intrinsic distribution of the data together with elastic hardware solutions. Considering the online processing of reviews, the number of threads and the allocation of incoming samples to threads can be location-based, e.g. employing separate dedicated threads to process the reviews of New York, London, or Paris.
Authors’ Contributions
Francisco de Arriba-Pérez: Conceptualization, Methodology, Software, Validation, Formal Analysis, Investigation, Resources, Data Curation, Writing – Original Draft, Writing – Review & Editing, Visualization, Project Administration, Funding Acquisition. Silvia García-Méndez: Conceptualization, Methodology, Software, Validation, Formal Analysis, Investigation, Resources, Data Curation, Writing – Original Draft, Writing – Review & Editing, Visualization, Project Administration, Funding Acquisition. Fátima Leal: Conceptualization, Resources, Writing – Original Draft. Benedita Malheiro: Conceptualization, Methodology, Validation, Writing – Review & Editing, Supervision. Juan Carlos Burguillo-Rial: Conceptualization, Writing – Review & Editing.
Notes
1 Available at https://twitter.com, May 2024.
2 Available at https://www.facebook.com, May 2024.
3 Available at https://es.wikipedia.org, May 2024.
4 Available at https://yelp.com, May 2024.
5 Available at https://www.tripadvisor.com, May 2024.
6 A value higher than 25 points is unfavorable.
7 In a modern language, the most frequent words in a text are not expected to vary over time, leading to p-values greater than 0.05. However, the contents and the words within spam texts are anticipated to vary over time, resulting in p-values below 0.05.
8 Code available at https://github.com/nlpgti/data_drift
9 Hyper-parameter optimization was performed with the 0.005% of the experimental samples in Section 4.5.
10 Due to time limitations, this scenario will only be applied with the best classifier so far.
11 Available at https://www.kaggle.com/datasets/abidmeeraj/yelp-labelled-dataset?select=Labelled+Yelp+Dataset.csv, May 2024.
12 Available from the corresponding author on reasonable request.
13 Available at https://spacy.io, May 2024.
14 For feature 16, the text was first separated into word tokens.
15 Available at https://bit.ly/3N4GNM3, May 2024.
16 Values between 0 and 1. Available at https://pypi.org/project/text2emotion, May 2024.
17 Values between −1 and 1. Available at https://pypi.org/project/spacytextblob, May 2024.
18 Polarity_likert = 2.5*(polarity + 1).
19 Available at https://pypi.org/project/textstat, May 2024.
20 Available at https://scikit-learn.org/stable/modules/generated/sklearn.feature_extraction.text.CountVectorizer.html, May 2024.
21 For the MediaWiki data set, min_df=0.01 since the reviews are shorter.
22 Available at https://gist.github.com/sebleier/554280, May 2024.
23 Available at https://spacy.io/models/en, May 2024.
24 Available at https://riverml.xyz/0.11.1/api/feature-selection/VarianceThreshold, May 2024.
25 Available at https://riverml.xyz/0.11.1, May 2024.
26 Available at https://docs.scipy.org/doc/scipy/reference/generated/scipy.stats.chi2_contingency.html, May 2024.
27 Available at https://scikit-learn.org/stable/modules/generated/sklearn.metrics.accuracy_score.html, May 2024.
28 Available at https://scikit-learn.org/stable/modules/generated/sklearn.model_selection.GridSearchCV.html, May 2024.
29 Available at https://riverml.xyz/0.11.1/api/tree/HoeffdingTreeClassifier, May 2024.
30 Available at https://riverml.xyz/0.11.1/api/tree/HoeffdingAdaptiveTreeClassifier, May 2024.
31 Available at https://riverml.xyz/0.11.1/api/ensemble/AdaptiveRandomForestClassifier, May 2024.
32 Due to computational and time constraints, results were obtained with a balanced subset composed of 73 770 and 49 754 samples for the Yelp and MediaWiki data sets, respectively.
33 Available at https://riverml.xyz/0.11.1/api/evaluate/progressive-val-score, May 2024.
34 Available at https://riverml.xyz/0.11.1/api/drift/EDDM, May 2024.
35 Available at https://riverml.xyz/0.11.1/api/drift/ADWIN, May 2024.
36 Available at https://riverml.xyz/0.11.1/api/base/Classifier, May 2024.
37 Available at https://openai.com/product, May 2024.
References
1 | Al-Otaibi, S.T., Al-Rasheed, A.A. ((2022) ). A review and comparative analysis of sentiment analysis techniques. Informatica, 46: (6), 33–44. https://doi.org/10.31449/inf.v46i6.3991. |
2 | Albayati, M.B., Altamimi, A.M. ((2019) ). An empirical study for detecting fake facebook profiles using supervised mining techniques. Informatica, 43: (1), 77–86. https://doi.org/10.31449/inf.v43i1.2319. |
3 | Barddal, J.P., Gomes, H.M., Enembreck, F., Pfahringer, B. ((2017) ). A survey on feature drift adaptation: definition, benchmark, challenges and future directions. Journal of Systems and Software, 127: , 278–294. https://doi.org/10.1016/j.jss.2016.07.005. |
4 | Bian, P., Liu, L., Sweetser, P. ((2021) ). Detecting spam game reviews on steam with a semi-supervised approach. In: Proceedings of the International Conference on the Foundations of Digital Games. Association for Computing Machinery, pp. 1–10. 9781450384223. https://doi.org/10.1145/3472538.3472547. |
5 | Cano, A., Krawczyk, B. ((2019) ). Evolving rule-based classifiers with genetic programming on GPUs for drifting data streams. Pattern Recognition, 87: , 248–268. https://doi.org/10.1016/j.patcog.2018.10.024. |
6 | Carvalho, D.V., Pereira, E.M., Cardoso, J.S. ((2019) ). Machine learning interpretability: a survey on methods and metrics. Electronics, 8: (8), 832. https://doi.org/10.3390/electronics8080832. |
7 | Charmet, F., Tanuwidjaja, H.C., Ayoubi, S., Gimenez, P.F., Han, Y., Jmila, H., Blanc, G., Takahashi, T., Zhang, Z. ((2022) ). Explainable artificial intelligence for cybersecurity: a literature survey. Annals of Telecommunications, 77: , 789–812. https://doi.org/10.1007/s12243-022-00926-7. |
8 | Chumakov, S., Kovantsev, A., Surikov, A. ((2023) ). Generative approach to aspect based sentiment analysis with GPT language models. Procedia Computer Science, 229: , 284–293. https://doi.org/10.1016/j.procs.2023.12.030. |
9 | Crawford, M., Khoshgoftaar, T.M., Prusa, J.D., Richter, A.N., Al Najada, H. ((2015) ). Survey of review spam detection using machine learning techniques. Journal of Big Data, 2: (1), 1–24. https://doi.org/10.1186/s40537-015-0029-9. |
10 | Desale, K.S., Shinde, S., Magar, N., Kullolli, S., Kurhade, A. ((2023) ). Fake review detection with concept drift in the data: a survey. In: Proceedings of International Congress on Information and Communication Technology, Vol. 448: . Springer, pp. 719–726. 9789811916090. https://doi.org/10.1007/978-981-19-1610-6_63. |
11 | Duckworth, C., Chmiel, F.P., Burns, D.K., Zlatev, Z.D., White, N.M., Daniels, T.W.V., Kiuber, M., Boniface, M.J. ((2021) ). Using explainable machine learning to characterise data drift and detect emergent health risks for emergency department admissions during COVID-19. Scientific Reports, 11: , 23017–23026. https://doi.org/10.1038/s41598-021-02481-y. |
12 | Engelbrecht, A.P., Grobler, J., Langeveld, J. ((2019) ). Set based particle swarm optimization for the feature selection problem. Engineering Applications of Artificial Intelligence, 85: , 324–336. https://doi.org/10.1016/j.engappai.2019.06.008. |
13 | Eshraqi, N., Jalali, M., Moattar, M.H. ((2015) ). Detecting spam tweets in Twitter using a data stream clustering algorithm. In: Proceedings of the International Congress on Technology, Communication and Knowledge. IEEE, pp. 347–351. 978-1-4673-9762-9. https://doi.org/10.1109/ICTCK.2015.7582694. |
14 | Faris, H., Al-Zoubi, A.M., Heidari, A.A., Aljarah, I., Mafarja, M., Hassonah, M.A., Fujita, H. ((2019) ). An intelligent system for spam detection and identification of the most relevant features based on evolutionary Random Weight Networks. Information Fusion, 48: , 67–83. https://doi.org/10.1016/j.inffus.2018.08.002. |
15 | Gama, J., Sebastião, R., Rodrigues, P.P. ((2013) ). On evaluating stream learning algorithms. Machine Learning, 90: (3), 317–346. https://doi.org/10.1007/s10994-012-5320-9. |
16 | Gama, J., Žliobaitė, I., Bifet, A., Pechenizkiy, M., Bouchachia, A. ((2014) ). A survey on concept drift adaptation. ACM Computing Surveys, 46: (4), 44–80. https://doi.org/10.1145/2523813. |
17 | García-Méndez, S., de Arriba-Pérez, F., Barros-Vila, A., González-Castaño, F.J. ((2022) a). Detection of temporality at discourse level on financial news by combining Natural Language Processing and Machine Learning. Expert Systems with Applications, 197: (1), 116648–116656. https://doi.org/10.1016/j.eswa.2022.116648. |
18 | García-Méndez, S., Leal, F., Malheiro, B., Burguillo-Rial, J.C., Veloso, B., Chis, A.E., González–Vélez, H. ((2022) b). Simulation, modelling and classification of wiki contributors: Spotting the good, the bad, and the ugly. Simulation Modelling Practice and Theory, 120: , 102616–102628. https://doi.org/10.1016/j.simpat.2022.102616. |
19 | Garg, P., Girdhar, N. ((2021) ). A systematic review on spam filtering techniques based on natural language processing framework. In: Proceedings of the International Conference on Cloud Computing, Data Science & Engineering. IEEE, pp. 30–35. https://doi.org/10.1109/Confluence51648.2021.9377042. |
20 | Gomes, H.M., Bifet, A., Read, J., Barddal, J.P., Enembreck, F., Pfharinger, B., Holmes, G., Abdessalem, T. ((2017) ). Adaptive random forests for evolving data stream classification. Machine Learning, 106: (9–10), 1469–1495. https://doi.org/10.1007/s10994-017-5642-8. |
21 | Hamida, Z.F., Refouf, A., Drif, A., Giordano, S. ((2022) ). Hybrid-MELAu: a hybrid mixing engineered linguistic features based on autoencoder for social bot detection. Informatica, 46: (6), 143–158. https://doi.org/10.31449/inf.v46i6.4081. |
22 | Han, S., Wang, H., Li, W., Zhang, H., Zhuang, L. ((2022) ). Explainable knowledge integrated sequence model for detecting fake online reviews. Applied Intelligence, 53: , 6953–6965. https://doi.org/10.1007/s10489-022-03822-8. |
23 | Henke, M., Santos, E., Souto, E., Santin, A.O. ((2021) ). Spam detection based on feature evolution to deal with concept drift. Journal of Universal Computer Science, 27: , 364–386. https://doi.org/10.3897/jucs.66284. |
24 | Hutama, L.B., Suhartono, D. ((2022) ). Indonesian hoax news classification with multilingual transformer model and BERTopic. Informatica, 46: (8), 81–90. https://doi.org/10.31449/inf.v46i8.4336. |
25 | Kakar, S., Dhaka, D., Mehrotra, M. ((2021) ). Value-based retweet prediction on twitter. Informatica, 45: , 267–276. https://doi.org/10.31449/inf.v45i2.3465. |
26 | Karakaşlı, M.S., Aydin, M.A., Yarkan, S., Boyaci, A. ((2019) ). Dynamic feature selection for spam detection in twitter. In: Lecture Notes in Electrical Engineering, Vol. 504: . Springer, pp. 239–250. https://doi.org/10.1007/978-981-13-0408-8_20. |
27 | Kaur, R., Singh, S., Kumar, H. ((2018) ). Rise of spam and compromised accounts in online social networks: a state-of-the-art review of different combating approaches. Journal of Network and Computer Applications, 112: , 53–88. https://doi.org/10.1016/j.jnca.2018.03.015. |
28 | Leal, F., Veloso, B., Malheiro, B., Burguillo, J.C. ((2021) ). Crowdsourced data stream mining for tourism recommendation. In: Advances in Intelligent Systems and Computing, vol. 1365 AIST: . Springer, pp. 260–269. https://doi.org/10.1007/978-3-030-72657-7_25. |
29 | Leo, G.D., Sardanelli, F. ((2020) ). Statistical significance: p value, 0.05 threshold, and applications to radiomics—reasons for a conservative approach. Euro Radiology Experimental, 4: , 1–8. https://doi.org/10.1186/s41747-020-0145-y. |
30 | Liu, S., Zhang, J., Xiang, Y. ((2016) ). Statistical detection of online drifting twitter spam: invited paper. In: Proceedings of the Asia Conference on Computer and Communications Security. Association for Computational Linguistics, pp. 1–10. 9781450342339. https://doi.org/10.1145/2897845.2897928. |
31 | Liu, W., He, J., Han, S., Cai, F., Yang, Z., Zhu, N. ((2019) ). A method for the detection of fake reviews based on temporal features of reviews and comments. IEEE Engineering Management Review, 47: , 67–79. https://doi.org/10.1109/EMR.2019.2928964. |
32 | Lu, J., Liu, A., Dong, F., Gu, F., Gama, J., Zhang, G. ((2018) ). Learning under concept drift: a review. IEEE Transactions on Knowledge and Data Engineering, 31: (12), 2346–2363. https://doi.org/10.1109/TKDE.2018.2876857. |
33 | Ma, T., Wang, X., Zhou, F.-c., Wang, S. ((2023) ). Research on diversity and accuracy of the recommendation system based on multi-objective optimization. Neural Computing and Applications, 35: , 5155–5163. https://doi.org/10.1007/s00521-020-05438-w. |
34 | Madaan, N., Manjunatha, A., Nambiar, H., Goel, A., Kumar, H., Saha, D., Bedathur, S. ((2023) ). DetAIL: a tool to automatically detect and analyze drift in language. In: Proceedings of the AAAI Conference on Artificial Intelligence, Vol. 37: . Association for the Advancement of Artificial Intelligence, pp. 15767–15773. https://doi.org/10.1609/aaai.v37i13.26872. |
35 | Miller, Z., Dickinson, B., Deitrick, W., Hu, W., Wang, A.H. ((2014) ). Twitter spammer detection using data stream clustering. Information Sciences, 260: , 64–73. https://doi.org/10.1016/j.ins.2013.11.016. |
36 | Mohawesh, R., Tran, S., Ollington, R., Xu, S. ((2021) ). Analysis of concept drift in fake reviews detection. Expert Systems with Applications, 169: , 114318. https://doi.org/10.1016/j.eswa.2020.114318. |
37 | Pham, X.C., Dang, M.T., Dinh, S.V., Hoang, S., Nguyen, T.T., Liew, A.W.-C. ((2017) ). Learning from data stream based on random projection and hoeffding tree classifier. In: Proceedings of the International Conference on Digital Image Computing: Techniques and Applications. IEEE, pp. 1–8. 978-1-5386-2839-3. https://doi.org/10.1109/DICTA.2017.8227456. |
38 | Rao, S., Verma, A.K., Bhatia, T. ((2021) ). A review on social spam detection: challenges, open issues, and future directions. Expert Systems with Applications, 186: , 115742. https://doi.org/10.1016/j.eswa.2021.115742. |
39 | Rathore, P., Soni, J., Prabakar, N., Palaniswami, M., Santi, P. ((2021) ). Identifying groups of fake reviewers using a semisupervised approach. IEEE Transactions on Computational Social Systems, 8: (6), 1369–1378. https://doi.org/10.1109/TCSS.2021.3085406. |
40 | Reis, J.C.S., Correia, A., Murai, F., Veloso, A., Benevenuto, F. ((2019) ). Explainable machine learning for fake news detection. In: Proceedings of the ACM Conference on Web Science. Association for Computational Linguistics, pp. 17–26. 9781450362023. https://doi.org/10.1145/3292522.3326027. |
41 | Reyes-Menendez, A., Saura, J.R., Filipe, F. ((2019) ). The importance of behavioral data to identify online fake reviews for tourism businesses: a systematic review. PeerJ Computer Science, 5: , 1–21. https://doi.org/10.7717/peerj-cs.219. |
42 | Ribeiro, M.T., Singh, S., Guestrin, C. ((2016) ). “Why Should I Trust You?”: explaining the predictions of any classifier. In: Proceedings of the ACM SIGKDD International Conference on Knowledge Discovery and Data Mining. Association for Computing Machinery, pp. 1135–1144. 9781450342322. https://doi.org/10.1145/2939672.2939778. |
43 | Ritu Aggrawal, S.P. ((2021) ). Elimination and backward selection of features (P-value technique) in prediction of heart disease by using machine learning algorithms. Turkish Journal of Computer and Mathematics Education, 12: (6), 2650–2665. https://doi.org/10.17762/turcomat.v12i6.5765. |
44 | Rudin, C. ((2019) ). Stop explaining black box machine learning models for high stakes decisions and use interpretable models instead. Nature Machine Intelligence, 1: , 206–215. https://doi.org/10.1038/s42256-019-0048-x. |
45 | Rustam, F., Khalid, M., Aslam, W., Rupapara, V., Mehmood, A., Choi, G.S. ((2021) ). A performance comparison of supervised machine learning models for Covid-19 tweets sentiment analysis. PLoS One, 16: (2), 1–23. https://doi.org/10.1371/journal.pone.0245909. |
46 | Škrlj, B., Martinc, M., Lavrač, N., Pollak, S. ((2021) ). autoBOT: evolving neuro-symbolic representations for explainable low resource text classification. Machine Learning, 110: (5), 989–1028. https://doi.org/10.1007/s10994-021-05968-x. |
47 | Solari, S., Egüen, M., Polo, M.J., Losada, M.A. ((2017) ). Peaks Over Threshold (POT): a methodology for automatic threshold estimation using goodness of fit p-value. Water Resources Research, 53: (4), 2833–2849. https://doi.org/10.1002/2016WR019426. |
48 | Song, G., Ye, Y., Zhang, H., Xu, X., Lau, R.Y.K., Liu, F. ((2016) ). Dynamic clustering forest: an ensemble framework to efficiently classify textual data stream with concept drift. Information Sciences, 357: , 125–143. https://doi.org/10.1016/j.ins.2016.03.043. |
49 | Stirling, M., Koh, Y.S., Fournier-Viger, P., Ravana, S.D. ((2018) ). Concept drift detector selection for hoeffding adaptive trees. In: Proceedings of the Australasian Joint Conference on Artificial Intelligence, Vol. 11320: . Springer, pp. 730–736. https://doi.org/10.1007/978-3-030-03991-2_65. |
50 | Stites, M.C., Nyre-Yu, M., Moss, B., Smutz, C., Smith, M.R. ((2021) ). Sage advice? The impacts of explanations for machine learning models on human decision-making in spam detection. In: Lecture Notes in Computer Science (including subseries Lecture Notes in Artificial Intelligence and Lecture Notes in Bioinformatics), Vol. 12797 LNAI: . Springer, pp. 269–284. https://doi.org/10.1007/978-3-030-77772-2_18. |
51 | Sun, N., Lin, G., Qiu, J., Rimba, P. ((2022) ). Near real-time twitter spam detection with machine learning techniques. International Journal of Computers and Applications, 44: (4), 338–348. https://doi.org/10.1080/1206212X.2020.1751387. |
52 | Treistman, A., Mughaz, D., Stulman, A., Dvir, A. ((2022) ). Word embedding dimensionality reduction using dynamic variance thresholding (DyVaT). Expert Systems with Applications, 208: , 118157–118170. https://doi.org/10.1016/j.eswa.2022.118157. |
53 | Upadhyay, C., Abu-Rasheed, H., Weber, C., Fathi, M. ((2021) ). Explainable job-posting recommendations using knowledge graphs and named entity recognition. In: Proceedings of the IEEE International Conference on Systems, Man, and Cybernetics. IEEE, pp. 3291–3296. 978-1-6654-4207-7. https://doi.org/10.1109/SMC52423.2021.9658757. |
54 | Vaitkevicius, P., Marcinkevicius, V. ((2020) ). Comparison of classification algorithms for detection of phishing websites. Informatica, 31: (1), 143–160. https://doi.org/10.15388/20-INFOR404. |
55 | Veloso, B.M., Leal, F., Malheiro, B., Burguillo, J.C. ((2019) ). On-line guest profiling and hotel recommendation. Electronic Commerce Research, 34: , 100832–100841. https://doi.org/10.1016/j.elerap.2019.100832. |
56 | Veloso, B.M., Leal, F., Malheiro, B., Burguillo, J.C. ((2020) ). A 2020 perspective on “Online guest profiling and hotel recommendation”: reliability, scalability, traceability and transparency. Electronic Commerce Research and Applications, 40: , 100957–100958. https://doi.org/10.1016/j.elerap.2020.100957. |
57 | Wang, J., Han, L., Zhou, M., Qian, W., An, D. ((2021) ). Adaptive evaluation model of web spam based on link relation. Transactions on Emerging Telecommunications Technologies, 32: (5), 1–13. https://doi.org/10.1002/ett.4047. |
58 | Wang, X., Kang, Q., An, J., Zhou, M. ((2019) ). Drifted twitter spam classification using multiscale detection test on K-L divergence. IEEE Access, 7: , 108384–108394. https://doi.org/10.1109/ACCESS.2019.2932018. |
59 | Wu, T., Wen, S., Xiang, Y., Zhou, W. ((2018) ). Twitter spam detection: survey of new approaches and comparative study. Computers & Security, 76: , 265–284. https://doi.org/10.1016/j.cose.2017.11.013. |
60 | Wu, Y., Sharma, K., Seah, C., Zhang, S. ((2023) ). SentiStream: a co-training framework for adaptive online sentiment analysis in evolving data streams. In: Proceedings of the Conference on Empirical Methods in Natural Language Processing. Association for Computational Linguistics, pp. 6198–6212. https://doi.org/10.18653/v1/2023.emnlp-main.380. |
61 | Zhang, K.Z.K., Xu, H., Zhao, S., Yu, Y. ((2018) ). Online reviews and impulse buying behavior: the role of browsing and impulsiveness. Internet Research, 28: (3), 522–543. https://doi.org/10.1108/IntR-12-2016-0377. |
62 | Zhang, Z., Damiani, E., Hamadi, H.A., Yeun, C.Y., Taher, F. ((2022) ). Explainable artificial intelligence to detect image spam using convolutional neural network. In: Proceedings of the International Conference on Cyber Resilience. IEEE, pp. 1–5. 978-1-6654-6122-1. https://doi.org/10.1109/ICCR56254.2022.9995839. |


