
A Temporal Variable-Scale Clustering Method on Feature Identification for Policy Public-Opinion Management
Abstract
The development of various digital social network platforms has caused public opinion to play an increasingly important role in the policy making process. However, due to the fact that public opinion hotspots usually change rapidly (such as the phenomenon of public opinion inversion), both the behaviour feature and demand feature of netizens included in the public opinion often vary over time. Therefore, this paper focuses on the feature identification problem of public opinion simultaneously considering the multiple observation time intervals and key time points, in order to support the management of policy-focused online public opinion. According to the variable-scale data analysis theory, the temporal scale space model is established to describe candidate temporal observation scales, which are organized following the time points of relevant policy promulgation (policy time points). After proposing the multi-scale temporal data model, a temporal variable-scale clustering method (T-VSC) is put forward. Compared to the traditional numerical variable-scale clustering method, the proposed T-VSC enables to combine the subjective attention of decision-makers and objective timeliness of public opinion data together during the scale transformation process. The case study collects 48552 raw public opinion data on the double-reduction education policy from Sina Weibo platform during Jan 2023 to Nov 2023. Experimental results indicate that the proposed T-VSC method could divide netizens that participate in the dissemination of policy-focused public opinion into clusters with low behavioural granularity deviation on the satisfied observation time scales, and identify the differentiated demand feature of each netizen cluster at policy time points, which could be applied to build the timely and efficient digital public dialogue mechanism.
1Introduction
As AI technology has created more attractive application scenarios in the social network domain (Leung, 2023; August et al., 2020), not only the number of netizens but also their activity on multiple digital platforms has increased rapidly (Kuo et al., 2021). That is followed by the emergence of a large amount of online public opinion events, widely disseminated across different platforms (Akhter et al., 2021). On the one hand, online public opinion plays a significant role on the policy making process, since it contains lots of valuable netizens’ demand and attitude information (Xiao and Wong-On-Wing, 2021; Li et al., 2022b; Lili et al., 2020). On the other hand, sometimes the policy itself will also cause heated discussion of online public opinions, that is defined as the policy(-focused) public opinion (Wang et al., 2019).
Moreover, the phenomena of public opinion inversion has aroused wide attention in both academic and industrial fields (Yuan et al., 2017; Tan and Hua, 2019). The public opinion inversion refers to netizens’ attitude, emotions or points of view quickly reversed in the opposite direction over time (Zhang et al., 2023; Yang, 2023), which is proved to be the result of the synergistic evolution between multiple subjects in the dissemination of public opinion (Zhao et al., 2023; Ai et al., 2023; Zhu, 2023). It can be seen that the time attribute is an important dimension in observing the state of public opinion, while different observation time intervals (temporal scales) might lead to obtain different netizens’ features. In particular, for the policy-focused public opinion, some key observation time points, like the promulgation time of relevant policies, have a more significant impact on public opinion. Therefore, in order to manage online public opinion, it is crucial to timely and accurately identify netizens’ features following dynamic observation time.
The variable-scale data analysis theory (VSDA) (Wang and Gao, 2022) is used to study the influence of different types of observation scales on decision-making results, by simulating the scale transformation process of decision makers. The framework of VSDA could be classified into main three stages. Firstly, select a single scale data set for scale transformation from the multi-scale data model. Then (taking the clustering data analysis task as an example) perform the cluster analysis on the current single scale data model, and evaluate the satisfaction of the clustering results. Finally, iteratively adjust the observation scale of single scale data model according to the evaluation results, until all the divided clusters meet the satisfaction standard of management scenarios (Wang and Gao, 2021a).
Since different data types (such as spatial data (Radosevic et al., 2023), numerical data (Wang and Wang, 2021), categorical data (Lee and Jung, 2021), binary data (Shati et al., 2023), etc.) are suitable for different data structures, the structure representation model of different observation scales in the VSDA (i.e. the scale space model) also has different connection modes between multiple scale hierarchies (Wang and Gao, 2022). Although Wang and Gao (2021b) propose a variable-scale dynamic clustering method that is capable of describing the timeliness characteristics of time-related observation scales (like the material inventory data of aerospace project), its numerical scale space model could only reflect the single perspective that the latest period data provides more significance during the decision-making process. It is unable to meet the jointly observation requirements of multiple time intervals and key time points on the management of policy-focused public opinion.
Therefore, this paper studies the feature identification problem of public opinion considering the multiple observation time intervals and policy time points simultaneously, based on the variable-scale data analysis theory. The main contributions of our research are summarized as follows:
• In order to characterize the multi-level analysis requirements of time dimensions for the policy-focused public opinion management, the temporal scale space model is established to describe all the candidate temporal observation scales, which are organized following the time points of relevant policy promulgation (policy time points).
• According to the proposed temporal scale space model above, the multi-scale temporal data model is established to represent netizens’ different behaviours in the dissemination of public opinion under every temporal observation scale, instead of just keeping one maximum value of the original time series in the research work (Wang and Gao, 2021b).
• A temporal variable-scale clustering method (T-VSC) is put forward. Compared to the traditional variable-scale dynamic clustering method for numerical data, the proposed T-VSC enables to combine the subjective attention of decision-makers and objective timeliness of public opinion data together during the scale transformation process for netizens’ demand feature identification.
The paper is organized as follows. Section 2 introduces the previous research works, including public opinion management and variable-scale clustering methods. Section 3 presents the main part methodology of our research in detail. A case study on the real public opinion dataset of the double-reduction education policy is described in Section 4. The paper is concluded in the last Section.
2Literature Review
2.1Public Opinion Management
Online public opinion has gained wide attention not only in the policy-making process of governmental departments (Li, 2021; Awad et al., 2020), but also in optimizing strategic decisions of enterprises in various industries (Fortin and Cimon-Morin, 2023; Rogowski, 2023; Krause and Gahn, 2023). Due to the diversity of participants in public opinion discussion and the complexity of information dissemination channels, an efficient identification of netizens’ features becomes one of the key factors to manage public opinion (Ma et al., 2023). Previous research works mainly focus on two aspects: the identification of netizens’ demand and behaviour features.
As for the demand feature identification, Yang (2024) puts forward a theme clustering algorithm to obtain the theme portraits of public opinion on sudden public events. He (2023) proposes a short text mining algorithm to analyse netizens’ attitude and emotion through online public opinion. Meanwhile, for the behaviour feature identification, Lv et al. (2023) puts forth the speech behaviour classification algorithm for analysing the development tendency of public opinion. However, most of the research above observes netizens’ features only at the most recent fixed time interval (fixed temporal scale).
When making the management decisions on the policy-focused public opinion, it is necessary to consider not only the objective timeliness of public opinion data, but also the subjective attention of decision makers at special time points, like the promulgation of relevant policies (Zhang and He, 2023). Hence, this paper studies the feature identification problem of public opinion under a variable-scale observation perspective on the time dimension.
2.2Variable-Scale Clustering Methods
Decision hierarchy transformation is the most significant thinking feature of intelligent decision analysis, as well as one of the important ways to realize data granulation in the data space (Liu and Zhang, 2019; Leng et al., 2018). The variable scale data analysis theory (VSDA) establishes an automatic data analysis hierarchy (observation scale) transformation mechanism by simulating the decision analysis hierarchy transformation process of managers, so as to achieve the balance between the quality and efficiency of data analysis in the decision process (Wang et al., 2020).
As the time dimension is one of the most commonly utilized observation rulers for decision analysis process in both business and policy-making scenarios, previous studies build various scale space models with different characteristics to describe the time-related data observation scales for differentiated management demands.
Fig. 1
Numerical scale space model of dimension (observation ruler)
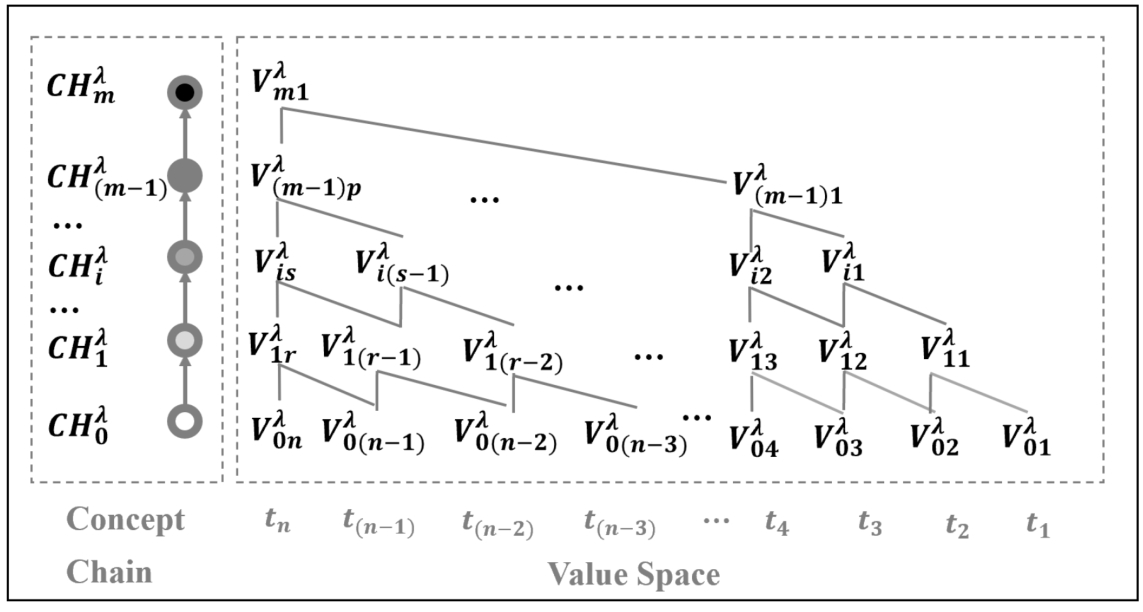
For instance, considering the versatile materials inventory management context of aerospace project, Wang and Gao (2021b) propose the numerical scale space model (see Fig. 1) to represent the data feature that the latest period data earns more significance on the decision-making process, including the purchasing cycle, demand quantity, cost of sales observation ruler, etc. Fig. 1 depicts that with the increase of the time interval observation scales in the concept chain, the number of data observation scale value decreases gradually, which causes the value space to appear as a unimodal state of aggregation towards the nearest time point
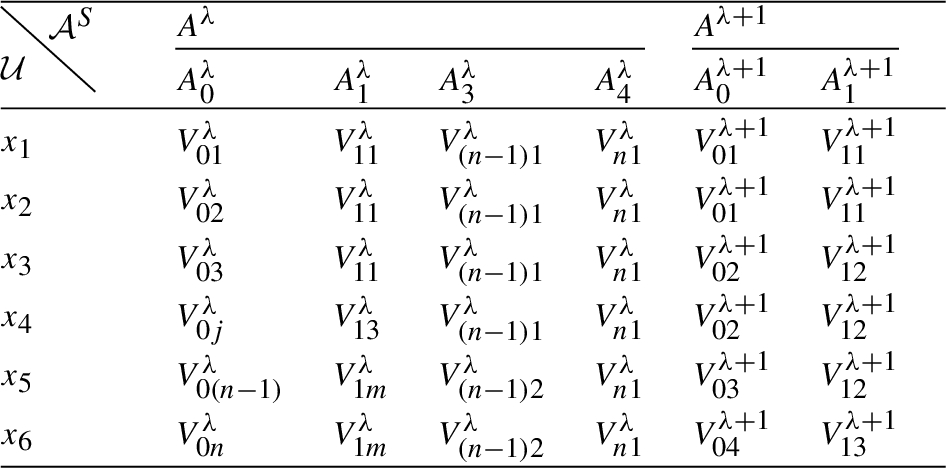
Table 1
Multi-scale numerical data model.
Furthermore, Wang et al. (2022) also study the space-time scale transformation problem on the charging and discharging behaviours of electric vehicle owners for the digital vehicle-to-grid (V2G) platform. Taking EV owners’ different short-term demand response time intervals as temporal observation scales, as well as taking the distance intervals between EV owners to the target public charging pile at the V2G demand release time point as spatial observation scales, the space-time scale space model is established, where the value space shows the number of responses EV users provide under the fixed time and space observation scale. Although the space-time scale space model has paid attention to the importance of key time point and multiple time intervals when making scheduling strategies on EV owners, only one demand release time point is taken into consideration.
Therefore, this paper studies the netizens’ feature identification problem for public opinion management based on the variable-scale data analysis, under both of the observation requirements on the data timeliness, as well as key time points.
3Research Methods
Since the variable-scale data analysis theory (VSDA) has the advantage of modelling the multi-level decision analysis needs (Wang et al., 2022), this section studies the feature identification problem of policy-focused public opinion while considering different types of data.
In order to describe the relation between multiple observation time intervals and key time points simultaneously, the temporal scale space model is established in Definition 1.
Definition 1
Definition 1(Temporal scale space model).
Given a time series  , where the concept chain
According to Definition 1, the temporal scale space model has the following properties: (1) The lower level temporal observation scale in the concept chain is partially ordered at the higher level scale; (2) The scale values in value space follow the partial order relationship between the scale hierarchies to which they belong.
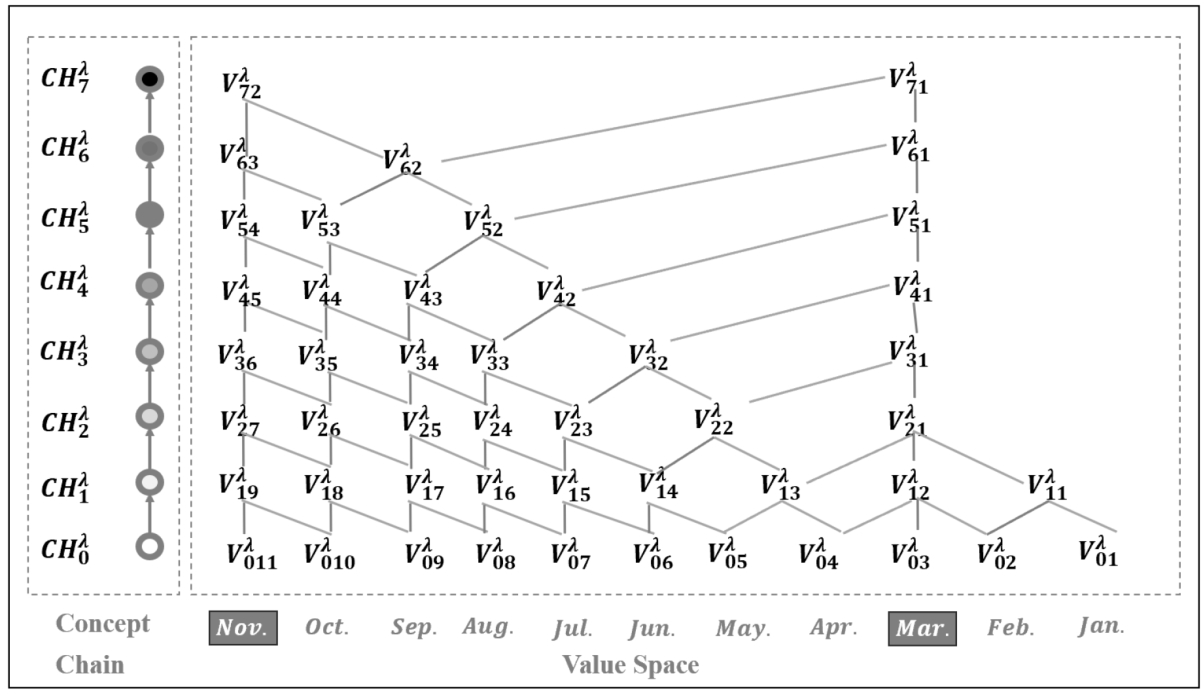
Taking the public opinion on the double-reduction education policy as an example, the data collection process is shown in Section 4.1 in detail. Since there was an influential double-reduction relevant policy promulgated in March 2023, the above policy time point gains more attention from policymakers and the public. Moreover, combining the data timeliness requirement (that the latest period data earns more significance on the decision-making process, Wang and Gao, 2021b), March and November are the two key observation time points for netizens’ feature identification. Hence, according to the Definition 1, the temporal scale space model could be built (see Fig. 2). It can be seen that with the increase of the time observation scale, the number of observation scale value in the value space becomes smaller and gathers two key points towards Mar. and Nov., showing a double-peak pattern.
Fig. 2
Example: The temporal scale space model.
According to the construction procedures of traditional scale space model (Wang and Gao, 2022), the temporal scale space model could be built mainly through three stages below.
On the first stage, determine all the candidate temporal scale hierarchies (time intervals) and clarify the key time points for the specific management scenario. For example, the basic (lowest) observation scale
On the second stage, correlate scale values according to the scale hierarchies from low to high, and follow the order of key time points within the same scale level, which could be broken down into three steps. (1) Extract the maximum value within the observation time interval at the latest time point, that is November in Fig. 2. (2) Extract the maximum value within the observation time interval at other key time points in a chronological order from far to near, that is March in Fig. 2. (3) Extract the maximum value within the observation time interval of the remaining time points in a chronological order from near to far.
At the last stage, reduce the current temporal scale space model from the high scale hierarchy to the low level, until its peak number is the same as the number of key time points.
Compared to the traditional numerical scale space model in the research of Wang and Gao (2021b), the proposed temporal scale space model keeps the scale hierarchies of the latest observation time intervals, while also emphasizes the influence of policy time points on netizens’ participation behaviour in the public opinion dissemination, which provides a kind of problem-solving space (Allen and Simon, 1972) for the subsequent variable scale data analysis process.
After establishing the temporal scale space model, the multi-scale temporal data model is proposed in Definition 2, in order to comprehensively present various netizens’ behaviour in the dissemination of public opinion under every temporal observation scale.
Definition 2
Definition 2(Multi-scale temporal data model).
Let Temporal-
Hence, compared to the traditional multi-scale numerical data model in Table 1, the multi-scale temporal data model could represent netizens’ different behaviour under every temporal observation scale (like the various behaviour features
According to the temporal scale space model (Temporal- ) and multi-scale temporal data model (Temporal-
Fig. 3
The mechanism of the temporal scale transformation (Temporal-ST).
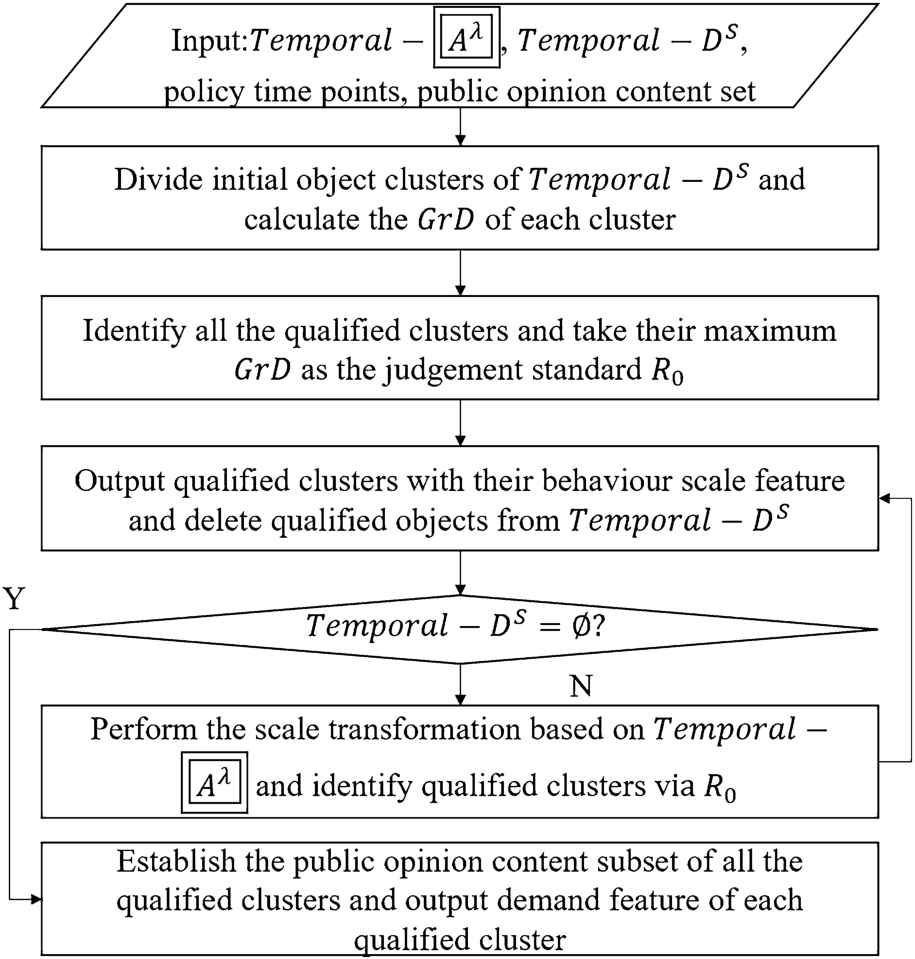
Algorithm 1
Temporal variable-scale clustering (policy time points, Temporal- , Temporal-
 (
(

In order to achieve the public opinion management for different types of netizens, the temporal scale transformation mechanism starts with the initial clustering process on the basic temporal scale of Temporal-
For the scale transformation process, such as improving the scale hierarchy from the lower level to higher level, let different observation values of qualified objects’ equivalence classes on the target level be the equivalent interval (Wang and Gao, 2022) and replace it with the intermediate value. And then iteratively perform clustering for the remaining objects based on the Temporal- .
.
According to the temporal scale transformation mechanism Temporal-ST, a temporal variable-scale clustering method (T-VSC) is put forward, and the calculation steps are shown in Algorithm 1.
The time complexity of the method T-VSC is
4Results and Discussion
4.1Experiment Design and Data Collection
The double-reduction policy, that aims to reduce students’ homework burden and off-campus training burden, has attracted wide attention since it was first put forward in July 2021 (Li et al., 2022a). Several new social phenomena caused by the implementation process of the double-reduction policy has become hot topics of online public opinion. Timely and accurately identifying the core demands of different types of netizens through online public opinion could support policymaking in the next stage.
Numerical experiments in this section aim to verify the effectiveness of the proposed temporal variable-scale clustering method (T-VSC) on the feature identification scenarios for the policy public opinion management.
Since the year 2023 is a crucial phase for the implementation of the double-reduction education policy, we collect relevant public opinion data from January 2023 to November 2023 from the Sina Weibo social network platform on the monthly basic observation scale, and obtain a total of 48552 raw data.
In order to reflect the behaviour feature of netizens, the frequency of original content publishing (
4.2Experiment Results and Discussion
According to the temporal variable-scale clustering method (T-VSC) in Algorithm 1, we identify netizens’ feature from the behaviour and demand – two aspects, through the collected raw public opinion data on the double-reduction education policy (see Section 4.1). During the data preprocessing, we track the raw data of 2292 netizen users, who have passed the identity authentication by the platform, as well as participated in the dissemination of public opinion throughout January until November 2023.
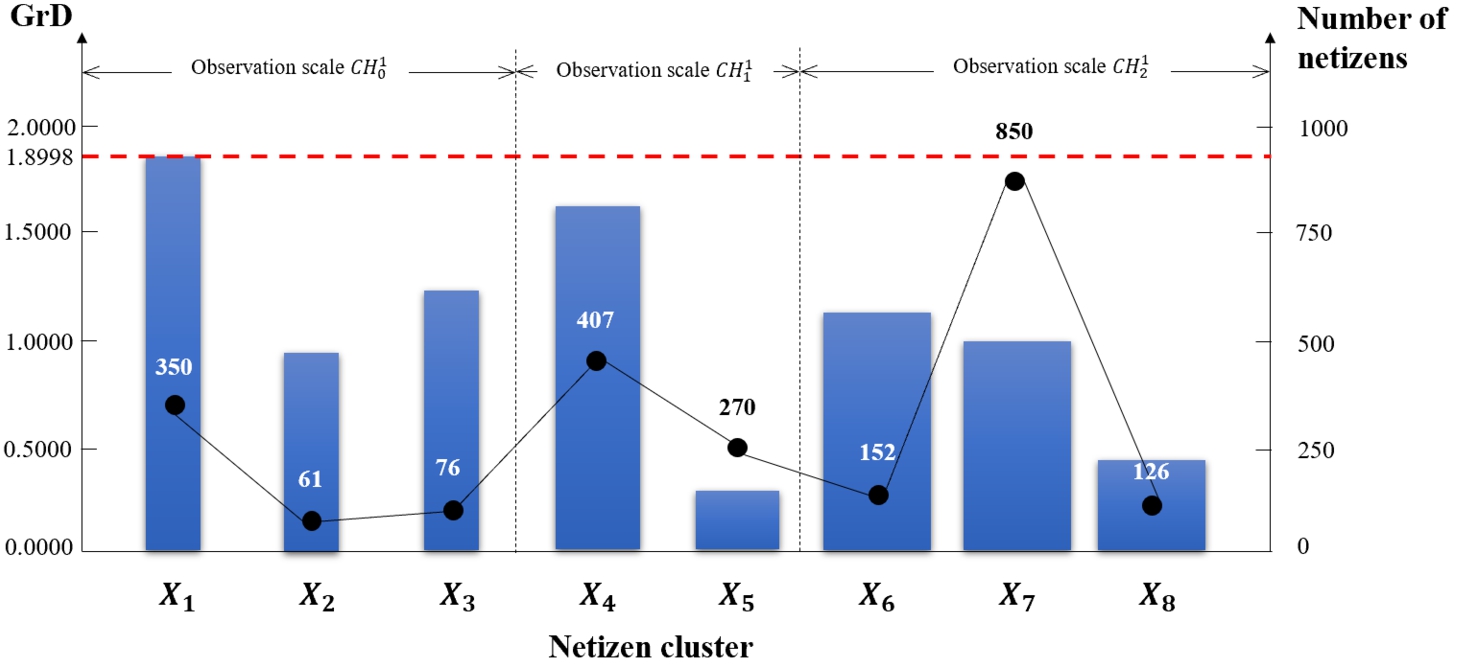
Fig. 4 shows the temporal scale transformation process by the proposed method T-VSC. In Fig. 4, the height of rectangles represents the granular deviation value (GrD) of every netizen cluster, while the width of rectangles represents the scale hierarchy of temporal observation rulers and higher observation scales have larger width; the dotted line means the satisfaction judgement standard of GrD, and the broken line is the number of netizens in every cluster. It can be seen that all netizens are divided into eight clusters with satisfied scale feature through performing the scale up transformation twice.
Fig. 4
The temporal scale transformation process on the behaviour feature identification.
Comparative experiments are conducted between the traditional single scale clustering method (SSC) (Wang and Gao, 2022) and the proposed T-VSC, and the evaluation results are shown in Table 2 in detail. It can be seen that although the granular deviation evaluation results of the SSC become smaller as the scale hierarchy increases, the average and maximum evaluation results of the SSC are still larger than the proposed T-VSC, which further verifies the efficiency of the T-VSC method.
Table 2
Comparative experimental results between the proposed T-VSC and the traditional single scale clustering method SSC.
| Evaluation results of granular deviation index | SSC | T-VSC | |||
| Observation scale | Observation scale | Observation scale | |||
| Netizen Cluster | 1.5149 | 0.0000 | 0.0000 | 1.8998 | |
| 1.5802 | 1.0943 | 1.0729 | 0.9737 | ||
| 1.7756 | 1.6132 | 1.1415 | 1.2471 | ||
| 1.7810 | 1.7899 | 1.2923 | 1.5701 | ||
| 1.9934 | 1.8002 | 1.4431 | 0.2556 | ||
| 2.0012 | 1.8898 | 1.4709 | 1.1842 | ||
| 2.2319 | 2.1090 | 1.9806 | 1.0492 | ||
| 2.2857 | 2.1864 | 2.0617 | 0.4718 | ||
| Average evaluation result | 1.8955 | 1.5604 | 1.3079 | 1.0814 | |
| Maximum evaluation result | 2.2857 | 2.1864 | 2.0617 | 1.8998 | |
Table 3
Experiment results of netizens’ behaviour feature obtained by the proposed method T-VSC.
| Netizen cluster | ||||||||||
| Scale hierarchy | Observation scale | Observation scale | Observation scale | |||||||
| Netizens’ behaviour feature under variable time intervals | max | 75 | 449 | 141 | 25 | 16 | 14 | 18 | 40 | |
| min | 0 | 0 | 0 | 3 | 1 | 1 | 0 | 0 | ||
| avg | 25.91 | 112.18 | 54.73 | 10.36 | 3.82 | 3.82 | 2.27 | 8.45 | ||
| std | 20.96 | 130.01 | 56.43 | 5.73 | 4.45 | 3.64 | 5.05 | 11.3 | ||
| max | 0 | 19 | 34 | 5 | 1 | 12 | 18 | 4 | ||
| min | 0 | 1 | 0 | 0 | 0 | 1 | 0 | 0 | ||
| avg | 0 | 3.09 | 3.82 | 0.45 | 0.09 | 2.73 | 2.18 | 0.73 | ||
| std | 0 | 5.07 | 9.59 | 1.44 | 0.29 | 3.02 | 5.08 | 1.21 | ||
| max | 43 | 120946 | 6255 | 2 | 127207 | 80445 | 1755 | 200268 | ||
| min | 23 | 110946 | 76 | 0 | 125909 | 127 | 1755 | 199743 | ||
| avg | 36.33 | 117606 | 2142 | 0.67 | 126774.33 | 53506 | 1755 | 200093 | ||
| std | 9.43 | 4709.34 | 2908 | 0.94 | 611.88 | 37745 | 0 | 247.49 | ||
Moreover, Tables 3 and 4 further describes the behaviour and demand feature of every netizen cluster under certain temporal observation scales, as well as observation time points.
There are three qualified netizen clusters (that is
Table 4
Experiment results of netizens’ demand feature obtained by the proposed method T-VSC.
| Netizen cluster | GrD | Number of netizens | Scale hierarchy | Netizens’ demand feature at policy time points | |
| Observation time point | Observation time point | ||||
| 1.8998 | 350 | Observation scale | Qualification of training institutions | After-school service design; Teachers’ competence and teaching skills | |
| 0.9737 | 61 | International school education | New regulations of Beijing high school entrance examination; Ways of physical training | ||
| Head training institutions | |||||
| 1.2471 | 76 | Qualification of training institutions; Education bureau | Transformation of learning machine market | ||
| 1.5701 | 407 | Observation scale | Homework design; Teaching effect of in-school courses | Teachers’ workload; Students’ examination scores | |
| 0.2556 | 270 | Pre-charge phenomenon of training courses | Regulation of teachers’ flexible working schedule | ||
| 1.1842 | 152 | Observation scale | Science and technology training programs; Homework design | Students’ career planning; Students’ learning interest | |
| 1.0492 | 850 | Art training programs; Teachers’ competence and teaching skills | After-school service design; Off-campus training course management | ||
| 0.4718 | 126 | Students’ sleep and eyesight protection; English training | Youth employment problem; Students’ self-confidence | ||
Taking the satisfaction judgement standard
Finally, three netizen clusters (i.e.
5Conclusions
In this paper, we address the feature identification problem for the management of policy-focused public opinion. According to the variable-scale data analysis theory, the research starts from establishing the temporal scale space model considering the influence of the data timeliness and key observation time points on netizens’ feature identification process. The multi-scale temporal data model is established with the aim to represent netizens’ different behaviours in the dissemination of public opinion on the basis of the temporal scale space model.
After proposing the temporal scale transformation mechanism, a temporal variable-scale clustering method (T-VSC) is put forward. Compared to the traditional numerical variable-scale clustering method, the proposed T-VSC enables to combine the subjective attention of decision-makers and objective timeliness of public opinion data together during the scale transformation process. The efficiency of the proposed method T-VSC is verified by 48552 real public opinion data on the double-reduction education policy from the Sina Weibo platform. Experimental results indicate that the proposed T-VSC method could divide netizens that participating in the dissemination of policy-focused public opinion into clusters with low behavioural granularity deviation on the satisfied observation time scales, and identify the differentiated demand feature of each netizen cluster at policy time points.
In the future, we will keep studying the real-time decision-making constraint in intelligent management scenarios on the mechanism of temporal scale transformation process.
Acknowledgements
The research was supported by China Postdoctoral Science Foundation (2021M700390), National Natural Science Foundation of China (71272161), China Scholarship Council (201906460087), and the Fundamental Research Funds for the Central Universities, China Grand number: FRF-TP-22-132A1.
References
1 | Ai, J., Geng, L., An, Y., Hu, Z. (2023). Research on the prediction of network public opinion reversal based on relevance vector machine. Computer Era, (05), 113–117. https://doi.org/10.16644/j.cnki.cn33-1094/tp.2023.05.025. |
2 | Akhter, M., Jiangbin, Z., Naqvi, S.I., Abdelmajeed, M., Zia, T. ((2021) ). Abusive language detection from social media comments using conventional machine learning and deep learning approaches. Multimedia Systems, 28: (6), 1925–1940. https://doi.org/10.1007/s00530-021-00784-8. |
3 | Allen, N., Simon, H.A. ((1972) ). Human Problem Solving. Prentice-Hall Inc., Englewood Cliffs, New Jersey. |
4 | August, T., Pescott, O., Joly, A., Bonnet, P. ((2020) ). AI naturalists might hold the key to unlocking biodiversity data in social media imagery. Patterns, 1: (7), 100116. https://doi.org/10.1016/j.patter.2020.100116. |
5 | Awad, E., Anderson, M., Anderson, S., Liao, B. ((2020) ). An approach for combining ethical principles with public opinion to guide public policy. Artificial Intelligence, 287: , 103349. https://doi.org/10.1016/j.artint.2020.103349. |
6 | Fortin, D., Cimon-Morin, J. ((2023) ). Public opinion on the conflict between the conservation of at-risk species and the extraction of natural resources: the case of caribou in boreal forest. The Science of the Total Environment, 897: , 165433. https://doi.org/10.1016/j.scitotenv.2023.165433. |
7 | He, H. ((2023) ). Text mining and emotion analysis of online public opinion based on short review data of film websites. Modern Information Technology, 7: (21), 126–135. https://doi.org/10.19850/j.cnki.2096-4706.2023.21.029. |
8 | Krause, W., Gahn, C. (2023). Should we include margins of error in public opinion polls? European Journal of Political Research. https://doi.org/10.1111/1475-6765.12633. |
9 | Kuo, Y.-F., Hou, J.-R., Hsieh, Y.-H. ((2021) ). The advertising communication effectiveness of using netizen language code-switching in Facebook ads. Internet Research, 31: (5), 1940–1962. https://doi.org/10.1108/INTR-04-2020-0231. |
10 | Lee, C., Jung, U. ((2021) ). Context-based geodesic dissimilarity measure for clustering categorical data. Applied Sciences, 11: (18), 8416. https://doi.org/10.3390/app11188416. |
11 | Leng, J., Chen, Q., Mao, N., Jiang, P. ((2018) ). Combining granular computing technique with deep learning for service planning under social manufacturing contexts. Knowledge-Based Systems, 143: , 295–306. https://doi.org/10.1016/j.knosys.2017.07.023. |
12 | Leung, R. ((2023) ). Using AI-ML to augment the capabilities of social media for telehealth and remote patient monitoring. Healthcare, 11: (12), 1704. https://doi.org/10.3390/healthcare11121704. |
13 | Li, J., Yan, S., Zhang, X., Li, X. ((2022) a). The media public opinion analysis on the implementation of “Double Reduction” policy in education based on big data. Wireless Communications and Mobile Computing, 2022: , 1–10. https://doi.org/10.1155/2022/1093358. |
14 | Li, X., Li, Q., Du, Y., Yongquan, F., Chen, X., Shen, F., Xu, Y. ((2022) b). A novel tripartite evolutionary game model for misinformation propagation in social networks. Security and Communication Networks, 2022: , 1–13. https://doi.org/10.1155/2022/1136144. |
15 | Li, Z. ((2021) ). Forecast and simulation of the public opinion on the public policy based on the Markov model. Complexity, 2021: , 1–11. https://doi.org/10.1155/2021/9936965. |
16 | Lili, D., Lei, S., Gang, X. ((2020) ). Public opinion analysis of complex network information of local similarity clustering based on intelligent fuzzy system. Journal of Intelligent & Fuzzy Systems, 39: (2), 1–8. https://doi.org/10.3233/JIFS-179943. |
17 | Liu, H., Zhang, L. ((2019) ). Advancing ensemble learning performance through data transformation and classifiers fusion in granular computing context. Expert Systems with Applications, 131: , 20–29. https://doi.org/10.1016/j.eswa.2019.04.051. |
18 | Lv, X., Dong, L., Teng, S., Zhang, L. ((2023) ). Dataset construction and recognition method of multimodal language public opinion. Journal of Beijing Information Science & Technology University, 38: (5), 1–9. https://doi.org/10.16508/j.cnki.11-5866/n.2023.05.001. |
19 | Ma, N., Yu, G., Jin, X., Zhu, X. ((2023) ). Quantified multidimensional public sentiment characteristics on social media for public opinion management: evidence from the COVID-19 pandemic. Frontiers in Public Health, 11: , 1097796. https://doi.org/10.3389/fpubh.2023.1097796. |
20 | Radosevic, N., Duckham, M., Rahaman, M., Ho, S., Williams, K., Hashem, T., Tao, Y. ((2023) ). Spatial data trusts: an emerging governance framework for sharing spatial data. International Journal of Digital Earth, 16: (1), 1607–1639. https://doi.org/10.1080/17538947.2023.2200042. |
21 | Rogowski, J. ((2023) ). Public opinion and presidents’ unilateral policy agendas. American Journal of Political Science, 67: (4), 1134–1150. https://doi.org/10.1111/ajps.12753. |
22 | Shati, P., Cohen, E., McIlraith, S. ((2023) ). SAT-based optimal classification trees for non-binary data. Constraints, 28: (2), 166–202. https://doi.org/10.1007/s10601-023-09348-1. |
23 | Tan, Y., Hua, C. ((2019) ). Analysis of cluster on the inversion problem of network public opinion events. Journal of Yunnan University (Natural Sciences Edition), 41: (S1), 16–20. https://doi.org/CNKI:SUN:YNDZ.0.2019-S1-003. |
24 | Wang, A., Gao, X. ((2019) ). Hybrid variable-scale clustering method for social media marketing on user generated instant music video. Tehnicki Vjesnik, 26: (3), 771–777. https://doi.org/10.17559/TV-20190314152108. |
25 | Wang, A., Gao, X. ((2021) a). A variable scale case-based reasoning method for evidence location in digital forensics. Future Generation Computer Systems, 122: , 209–219. https://doi.org/10.1016/j.future.2021.03.019. |
26 | Wang, A., Gao, X. ((2021) b). A variable-scale dynamic clustering method. Computer Communications, 171: , 163–172. https://doi.org/10.1016/j.comcom.2021.03.009. |
27 | Wang, A., Gao, X. ((2022) ). Variable-Scale Data Analysis Theory. Economic Science Press, Beijing. |
28 | Wang, A., Gao, X., Tang, M. ((2020) ). Computer supported data-driven decisions for service personalization: a variable-scale clustering method. Studies in Informatics and Control, 29: (1), 55–65. https://doi.org/10.24846/v29i1y202006. |
29 | Wang, A., Gao, X., Tang, M. ((2022) ). A space variable-scale scheduling method for digital vehicle-to-grid platform under distributed electric energy storage. Applied Soft Computing, 133: , 109911. https://doi.org/10.1016/j.asoc.2022.109911. |
30 | Wang, H., Wang, H. ((2021) ). Differentially private publication for correlated non-numerical data. The Computer Journal, 65: (7), 1726–1739. https://doi.org/10.1093/comjnl/bxab014. |
31 | Wang, Y., Ning, J., Xubu, M. ((2019) ). Forecast of public opinion on public policy based on social media. Information Studies: Theory & Application, 42: (01), 87–93. https://doi.org/CNKI:SUN:QBLL.0.2019-01-015. |
32 | Xiao, F., Wong-On-Wing, B. ((2021) ). Employee sensitivity to the risk of whistleblowing via social media: the role of social media strategy and policy. Journal of Business Ethics, 181: (2), 519–542. https://doi.org/10.1007/s10551-021-04914-0. |
33 | Yang, C. (2023). Impact of multi-source perception of emergency events on reversal of public opinion from perspective of block modal coupling. Journal of Intelligence, 1–8. http://kns.cnki.net/kcms/detail/61.1167.G3.20231225.0950.012.html. |
34 | Yang, Y. (2024). Theme portrait and attribution analysis of public appeal for sudden public events from a data-driven. Information Studies: Theory & Application, 1–10. |
35 | Yuan, Y., Lan, Y., Zhang, P., Xia, Y. ((2017) ). Research on the classification and forecast of reversal network public opinion based on cluster analysis. Information Science, 35: (9), 54–60. https://doi.org/10.13833/j.cnki.is.2017.09.009. |
36 | Zhang, G., He, H. ((2023) ). The evolutionary logic of public communication on policy in digital media: systematic investigation based on the temporal and spatial dimension. Global Journal of Media Studies, 10: (3), 138–152. |
37 | Zhang, J., Zhang, P., Lan, Y., Zhong, Y. ((2023) ). Construction and empirical study of online public opinion inversion identification model based on dynamic topic clustering. Information Studies: Theory & Application, 46: (10), 174–181. https://doi.org/10.16353/j.cnki.1000-7490.2023.10.022. |
38 | Zhao, L., Wen, G., Yang, Y. ((2023) ). PCA-LDA-LSSVM model for predicting network public opinion reversal of emergencies. Journal of Safety Science and Technology, 19: (8), 186–190. |
39 | Zhu, G. ((2023) ). Derived risks and their transmission in internet public opinion reversal: type division and relief strategy. Journal of Jishou University (Social Sciences), 44: (03), 99–111. https://doi.org/10.13438/j.cnki.jdxb.2023.03.009. |


