
Risk Prioritization in Failure Mode and Effects Analysis with Extended SWARA and MOORA Methods Based on Z-Numbers Theory
Abstract
This study introduces an approach in three phases to cover the disadvantages of the FMEA method including inability to assign different importance to risk factors and incomplete prioritization in uncertain environment. First, the values of Risk Priority Number (RPN) are set through the FMEA method. Then, the Step-wise Weight Assessment Ratio Analysis based on the Z-Number theory (Z-SWARA) method has been done to determine the weights of quintuplet factor. Finally, failures are prioritized using Multi-Objective Optimization by Ratio Analysis based on the Z-number theory (Z-MOORA). The results of implementation of the proposed approach by considering uncertainty and reliability represent a complete prioritization.
1Introduction
Today, companies use different techniques to deliver impeccable products to the market to maintain their market share. Since the level of customer expectations and the level of manufacturers’ competition has increased, and in any way, the shortage and mistake in product specifications cause the loss of market share of the product, it has made producers more committed (Ghoushchi et al., 2018; Jafarzadeh et al., 2012). Techniques that are used by companies are risk assessment techniques because they identify as much as probable possible risks through the range of risk assessment and specify the reasons and impacts associated with them (Mustaffa et al., 2018; Jafarzadeh Ghoushchi et al., 2020; Nasir et al., 2020). These factors contribute to the development of quantitative and qualitative risk assessment methods that can be used by companies and managers to control, identify, and mitigate hazardous consequences (Rezaee et al., 2018; Turskis et al., 2019). Among the various techniques, Failure Mode and Effects Analysis (FMEA) is a systematic approach based on the pre-occurrence prevention and teamwork approach; this method is also used to investigate and identify causes, failures, effects of potential failures and preventative and control measures in a system (Liu, 2016). In this way, corrective actions at the early stages of product design lead to cost and time savings and a possibility to apply corrective actions after failures, because in this way, by defining potential problems and calculating their risk, measures are taken to eliminate or reduce their occurrence (Dabbagh and Yousefi, 2019; Kassem et al., 2019). This precautionary approach, contrary to the behaviour of reactive methods, is a preventive function to what can occur in the future (Yousefi et al., 2018). Identification of risks and their ranking in many types of research have been done according to the traditional index of risk priority number (RPN) (Akbari et al., 2020; Baležentis et al., 2012). The value of determinant factors of RPN cannot be considered definitively because of the teamwork nature of FMEA (Ghoushchi et al., 2019). Also, a complete lack of ranking (creating a difference among the different failure priorities) and the obligation of equal gravity of determinants of RPN are among the other shortages of this traditional score (Dorosti et al., 2020). In recent studies, in order to reduce the deficiencies of the traditional RPN, new points have been given to cover some of the deficiencies of this index. These points are based on the FMEA developed approach based on Fuzzy Best-Worst Method (FBWM) and Multi-Objective Optimization by Ratio Analysis based on the Z-number theory (Z-MOORA) approaches (Ghoushchi et al., 2019; Attri and Grover, 2014; Zhang et al., 2020). One of the features of this method is to reduce the number of paired comparisons and relative calculations using the Analytic Hierarchy Process (AHP) method and consider the ambiguity in decision making about the conventional BWM (Rezaei, 2015; Guo and Zhao, 2017).
The purpose of this research is to provide an approach by using the FMEA, Z-MOORA, and the Step-wise Weight Assessment Ratio Analysis based on the Z-Number theory (Z-SWARA) method to distinguish the priority of failure scenarios and increase reliability. In this approach, the modes of failure are recognized with the FMEA team through the risk assessment domain, the amount of five factors are determined, and the reliability of each of the failure modes is determined. The Z-SWARA method is used for weighing the five factors. In this study, the reason for using the Z-SWARA instead of the SWARA method is that, in addition to considering fuzzy values, it can consider reliability of each of the five factors in this study. On the other hand, all multi-attribute methods are not able to validate the attribute weights because maybe the weights are lower or higher than others; thus, the SWARA method allows including lawyers’, experts’ and dispute parties’ view about the important factor of the attributes in the procedure of rational decision determination. SWARA can be applied in the practical implementation of major decision support systems and other dispute solutions in a virtual environment (Keršuliene et al., 2010). Also, the reason for using the Z-MOORA instead of the MOORA method is that in addition to considering fuzzy values, it can consider reliability of each of the alternatives (failure mode) in this study. Additionally, this method has a very low computational time, minimum mathematical calculations, high simplicity and stability in comparison with other MCDM similar methods including AHP, TOPSIS, VIKOR, ELECTRE, and PROMETHEE (Akkaya et al., 2015; Mishra et al., 2020; Giri et al., 2020). The following shows the contributions of this study:
• Consideration of crucial management indices, such as cost and time, in the process of prioritizing risks with SOD factors.
• Assignation of different weights to risk factors according to the uncertainty of decision-makers’ preferences with the aim of overcoming the deficiencies of traditional RPN score and making results more interpretable.
• Simultaneous consideration of the concepts of uncertainty (U) and reliability (R) in the processes of weighting risk factors and prioritizing failures by using Z-number theory.
• Complete prioritization of failures and distinction between failure ranks by using the SWARA–MOORA integrated method based on Z-number theory.
The remainder of this study is formed as follows: In Section 2, some studies are reviewed in three subsections: FMEA and hybrid approach, SWARA and MOORA application, and Z-number theory. In Section 3, the methodology is presented in four subsections: Fuzzy sets theory, Z-NUMBERS and the proposed Z-SWARA and Z-MOORA. In Section 4, the proposed approach of this study is provided. In Section 5, a case study is introduced and the analysis of results from the implementation of the proposed approach with a subsection, sensitivity analysis, is carried out. Finally, in Section 6, the conclusions and development suggestions of this study are expressed.
2Literature Review
In this section, the research carried out is reviewed and examined in three subsections separately. In the first one, the applications of the FMEA method and hybrid approaches based on this method are examined in different fields. In the second subsection, the application of the MOORA and SWARA is reviewed and finally, in the third subsection, the theory of Z-Number is examined.
2.1FMEA and Hybrid Approaches
The continual confirmation of risk evaluation with rules and with their development in decision making cause the expansion of theoretical base, methods, and tools that are scientific and practical (Haimes et al., 2015; Jafarzadeh Ghoushchi et al., 2019). Among the methods, in the literature FMEA is used as a general method, in which the application of this method is a tool to define, identify, eliminate probable defect and create a competitive advantage; the widespread use of this method is due to its ease of use. First, the FMEA technique was reported in 1920, but since the early 1960s the use of it has widely increased in different industries including food, energy, automotive, chemical, medical, and mechanical (Bao et al., 2017; Liu et al., 2019; Wang et al., 2019). Despite the high utilization of the FMEA method, prioritization of failures in this method relies on the common Risk Priority Number (RPN) (Multiplication of the Severity (S), Occurrence (O) and Detection (D) criteria) deficiencies that have been studied in previous studies (Rezaee et al., 2017; Spreafico et al., 2017). In this regard, the researchers have tried to cover some of the disadvantages of the common RPN index using alternative approaches, including Multidisciplinary decision making (MCDM) (Liu et al., 2015). MCDM approaches reflect natural behaviour and human thinking and are used when decision making is considered with a few options and quantitative and qualitative criteria (Liu et al., 2015). One of the applications of interchangeable approaches mixed with the FMEA method is the AHP hierarchy analysis that is used by Bevilacqua and Braglia (2000) for prioritizing the reasons of failure in a company in Italy which produce refrigerators. An analysis method of the ANP network process was also used in Zammori and Gabbrielli (2012) research, to check the relationship among risk criteria in the process of decision making. Prioritization method based on similarity to the TOPSIS ideal solution was used by Rau et al. (2007) for prioritizing risks at the packaging stage of a computer company. Garcia and Schirru (2005) used the Data Envelopment Analysis (DEA) method to determine ranking indices in failure modes. Gray Relationship Analysis method (GRA) was suggested in Sharma and Sharma (2012) study for prioritizing and evaluating issues which are expensive in the production process, and Seyed-Hosseini et al. (2006) use the DEMATEL Decision Measurement and Testing Laboratory method for re-evaluating the failure modes in the FMEA. Other methods combined with the FMEA method are the VIKOR (Liu et al., 2012), PROMETHEE (Maheswaran and Loganathan, 2013), COPRAS (Adhikary et al., 2014) methods. It needs to be explained that, despite the improvement of FMEA reliance on decision-making methods, the opinions of the members of the FMEA team can be uncertain regarding the type of experience and base; therefore, the use of existing approaches to solve uncertainty problems, containing fuzzy theories, is presented to cover some of the traditional RPN deficiencies (Wang et al., 2016). Also, in terms of developing the risk assessment methods by the matrix approach, the most pragmatic matrix (qualitative) risk assessment methods, such as a
2.2SWARA and MOORA Applications
Multi-Objective Optimization based on Ratio Analysis is a multi-criteria optimization method that can be used to solve various types of complex decision problems (Shihab et al., 2018; Abdulhasan et al., 2019; Kamaruzzaman et al., 2018; Stanujkic et al., 2019). The MOORA was first used in Brauers and Zavadskas (2006) research. This technique provides the possibility of subjective assessments due to the unwillingness to use the weighting method. This method was used to overcome weighing problems such as ELECTRE, AHP, TOPSIS, and PROMETHEE in previous optimization models (Baležentis et al., 2012). This method relies on the relative analysis theory and the method of reference point, and in the forthcoming development, a complete multiplicative formation has been added to this method, which has led to the formation of the MULTI MOORA method for multi-objective optimization as a strong method (Brauers and Zavadskas, 2012). Simplicity and ease of implementation of this method for multi-objective optimization, low mathematical computing, good stability, and very low solving time are among the most important features of the MOORA method, which has made it preferable to other methods in this paper. Yet, the MULTIMOORA and MOORA method has been used in many studies for solving wrapped problems of decision making, including the Karande and Chakraborty (2012) research on the selection of materials to reduce defects in products, in order to select personnel at the factory to prevent using customary methods in fuzzy environments by Baležentis et al. (2012). In the research of Attri and Grover (2014), the MOORA method was used to decide on product design, facility location, suppliers, type of materials and technology in a production system. Mavi (2015) used a third-party logistics provider (3PRLP) to use the MOORA method in fuzzy environments. Chand et al. (2018) have identified and analysed the issues selected in green supply chain management such as waste reduction, conservation of natural resources, and reducing the consumption of hazardous materials in industries. MOORA’s approach has also been considered in the risk assessment (Arabsheybani et al., 2018; Liu et al., 2014; Jafarzadeh Ghoushchi, 2018). Also, to precedence the failures, the FMEA approach relies on the fuzzy BWM and new approach, Z-MOORA, improved by Ghoushchi et al. (2019). The proposed approach has been implemented in an active automotive parts company, and results demonstrate a complete prioritization of the failures in comparison with other customary methods such as fuzzy MOORA and FMEA.
Among the various MADM methods, the SWARA method is a method which implies the implicit ideas and experiences of experts and is not as time consuming and complex (Zolfani and Saparauskas, 2013), as proposed by Keršuliene et al. (2010). Several factors, such as inaccessible information and incomplete information, make decision making inaccurate; therefore, fuzzy multiple attribute decision making methods were created due to the lack of ambiguity in their characteristics, because conventional MADM methods can’t solve the problem of incomplete information effectively (Mavi, 2015). Hence, the SWARA method was extended to fuzzy SWARA by Mavi et al. (2017). Fuzzy stepwise weight assessment ratio analysis (Fuzzy SWARA) was used for weighing the evaluation criteria in the research in case of combining the sustainability and risk factors for evaluation of the third-party reverse logistic provider (3PRLP), also, for ranking the sustainable third-party reverse logistic providers, the fuzzy multi-objective optimization based on ratio analysis (Fuzzy MOORA) was applied in the plastic industry (Mavi et al., 2017). In this research, in order to increase reliability of the SWARA method, this method has been converted to the Z-SWARA method. Furthermore, a new hybrid model includes a combination of the Delphi, SWARA (Step-Wise Weight Assessment Ratio Analysis), and MABAC (Multi-Attributive Border Approximation Area Comparison) methods considering railway models on the basin of Bosnia and Herzegovina. This study contains three phases: determining the criteria ranking using the Delphi Method, determining the mutual criteria impact and the relative weight values of the criteria, and evaluating the most appropriate variant using the MABAC Method (Vesković et al., 2018). Also, in Mukhametzyanov and Pamucar (2018) research, a model for result consistency evaluation of multi-criteria decision-making (MDM) methods and selection of the optimal one was presented. The results of the sensitivity of decision-making with various methods like SAW, MOORA, VIKOR, COPRAS, CODAS, TOPSIS, D’IDEAL, MABAC, PROMETHEE-I, II, ORESTE-II with changing in elements of matrix is proposed.
2.3Z-Number Theory
The Z-Number concept is used to calculate the numbers that are not completely reliable. Z-Number was first proposed by Zadeh (2011), as a general characteristic of the theory of uncertainty. The Z-Number in combination with AHP was used to identify reliable assessment criteria from the best universities in adverse environmental conditions (Sahrom and Dom, 2015), using the AHP-Fuzzy DEA and Z-Number method and integrating the concepts of reliability and fuzzy numbers, and worked on the priority assessment of 20 bridge structures. Also, Azadeh and Kokabi (2016) used a Z-DEA model to choose the IT project to deal with uncertainty, interaction between projects and trust. Yaakob and Gegov (2016) proposed a method for solving MCDM problems based on the concept of Z-Number, Z-TOPSIS for solving stock choice issues. Shen and Wang (2018) developed the VIKOR method relying on the theory of the Z-Number and used the regional circular economy development plan.
3Methodology
3.1Fuzzy Logic Theory
Zadeh (1965) introduced the first notion of fuzzy sets. A fuzzy set is generally determined as a membership function that shows the degree of membership of the elements in a certain interval, usually in the
Definition 1.
A defined fuzzy set
(1)
Fig. 1
Triangular fuzzy number.
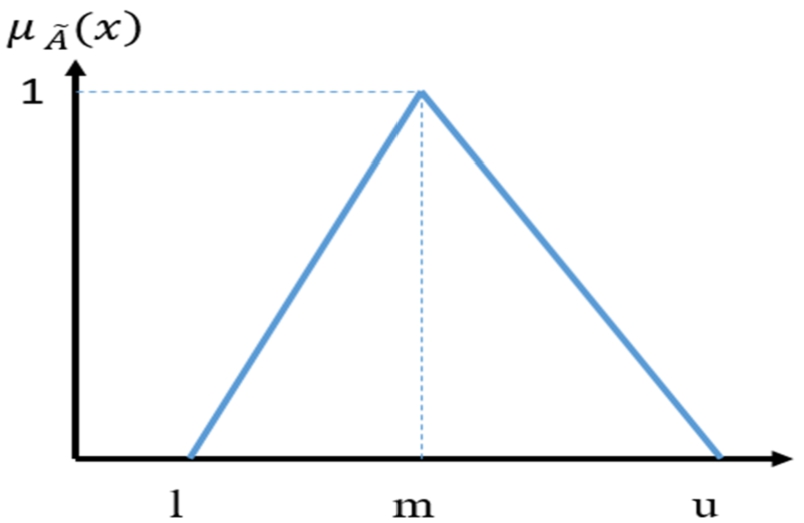
In equation (1), the membership function is from set A. The amount of membership states the degree of dependence in A.
Definition 2.
The triangular fuzzy number is defined as a triplet, and the membership function according to equation (2) and its graph are in Fig. 1.
(2)
Definition 3.
Suppose
(3)
(4)
(5)
(6)
(7)
3.2Z-Numbers
The Z-Numbers concept was first proposed by Zadeh (2011), which was proposed as a generic version of the theory of uncertainty that is used to compute non-reliable numbers. Z-Numbers is a pair of fuzzy numbers
(8)
(9)
(10)
(11)
In equation (11),
3.3Z-SWARA
The step-wise weight assessment ratio analysis (SWARA) method was proposed by Keršuliene et al. (2010). Several factors such as unquantifiable information, incomplete information, unobtainable information, and partial ignorance cause the imprecision in decision making. Since conventional MADM methods cannot effectively handle problems with such imprecise information, therefore, fuzzy multiple attribute decision-making methods have been developed owing to the imprecision in assessing the relative importance of attributes and the performance ratings of alternatives concerning attributes (Mavi, 2015). Hence, this paper aims to extend SWARA to Z-SWARA. This paper assumes that all criteria are independent. The process of determining the relative weights of criteria using the Z-SWARA method is the same as using the SWARA method, such as the following steps:
Step 1. Sort the evaluation factors in descending order of expected significance.
Step 2. Conversion rules for z-numbers linguistic variables.
In this step (Step 2), the verbal variables for factors that are in the form of Z-Numbers are converted to triangular fuzzy verbal variables. The process of this conversion is as follows:
Assume that
(12)
(13)
In the above equations, α represents the weight of reliability,
Then, by combining the Linguistics variable for evaluating the factors (Table 1) and the conversion rules of linguistics variables of reliability (Table 2), the roles of transforming verbal variables of decision-makers are obtained for the Z-SWARA method.
Table 1
Linguistics variable for evaluating the factors.
| Linguistics terms | Membership function |
| Equally Important (EI) |
|
| Moderately less important (MOL) |
|
| Less important (LI) |
|
| Very less Important (VLI) |
|
| Much less important (MUL) |
|
Table 2
Conversion rules of linguistics variables of reliability.
| Linguistic variables | Very Low (VL) | Low (L) | Medium (M) | High (H) | Very High (VH) |
| TFNs |
|
|
|
|
|
For instance, assume that
Step 3. According to Table 3, state the relative importance of the factor j about the previous
Table 3
Transformation rules for z-number linguistics variables to fuzzy numbers.
| Linguistics terms | Membership function | Linguistics terms | Membership function |
| (EI, VL) |
| (EI, L) |
|
| (EI, M) |
| (EI, H) |
|
| (EI, VH) |
| (MOL, VL) |
|
| (MOL, L) |
| (MOL, M) |
|
| (MOL, H) |
| (MOL, VH) |
|
| (LI, VL) |
| (LI, L) |
|
| (LI, M) |
| (LI, H) |
|
| (LI, VH) |
| (VLI, VL) |
|
| (VLI, L) |
| (VLI, M) |
|
| (VLI, H) |
| (VLI, VH) |
|
| (MUL, VL) |
| (MUL, L) |
|
| (MUL, M) |
| (MUL, H) |
|
| (MUL, VH) |
|
Step 4. Obtain the coefficient
(14)
Step 5. Calculate the fuzzy weight
(15)
Step 6. Calculate the relative weights of the evaluation criteria as (16):
(16)
3.4Z-MOORA
Brauers and Zavadskas (2006) presented the MOORA method. This method is a multi-objective optimization method that can be used to perform a variety of complex decision-making problems in any environment. In the following, the MOORA fuzzy method was presented by Akkaya et al. (2015) to consider the uncertainty in the decision matrix. But this method, despite the improvement of the traditional MOORA method, makes it impossible to consider the reliability of the decision. To this end, in this research, the decision making based on Z-Numbers is expressed in terms of increasing reliability in decision-making by experts. The final ranking options can be affected by considering the reliability part of the decision-making matrix. There are three different approaches for solving problems with the Z MOORA: Z ratio method, Z reference point approach, and full multiplicative form. In this paper, we use the Z ratio method.
3.4.1Z-Ratio Method
In this part, the Z-Ratio approach developed by the fuzzy ratio relying on the Z-Number theory has been studied. The executive steps of this approach are as follows:
Step 1. The decision-making matrix with Z-number components is displayed as follows. In this matrix, m and n indicate the number of alternatives and the number of criteria, respectively. Also,
(17)
Step 2. Transformation rules for z-numbers linguistic variables.
In this step, according to the decision-making matrix in the first step, the components of the matrix are converted to triangular fuzzy numbers and a decision-making matrix is obtained with triangular fuzzy numbers. The process of this conversion is as follows:
Assume that
(18)
(19)
In the above equations, α represents the weight of reliability,
In the following, by merging linguistic variables for ranking the failure modes (Table 4), the transformation rules of linguistics variables of reliability (Table 5), the roles of transforming verbal variables of decision-makers are gained for the Z-MOORA method.
Table 4
Linguistic variables for rating the failure modes.
| Linguistic variables | Very Low (VL) | Low (L) | Medium Low (ML) | Medium (M) | Medium High (MH) | High (H) | Very High (VH) |
| TFNs |
|
|
|
|
|
|
|
Table 5
Transformation rules of linguistics variables of reliability.
| Linguistic Variables | Very Low (VL) | Low (L) | Medium (M) | High (H) | Very High (VH) |
| TFNs |
|
|
|
|
|
Assume that
Step 3: According to Steps 1 and 2, the decision-making matrix is constructed of triangular fuzzy components (equation (20)) and the procedure of normalizing the matrix is done in this step. In this matrix, m and n indicate the number of options and the number of criteria, respectively. Also,
(20)
Table 6
Transformation rules for z-number linguistics variables to fuzzy numbers.
| Linguistics terms | Membership function | Linguistics terms | Membership function |
| (VH, VH) |
| (VH, H) |
|
| (VH, M) |
| (VH, L) |
|
| (VH, VL) |
| (H, VH) |
|
| (H, H) |
| (H, M) |
|
| (H, L) |
| (H, VL) |
|
| (MH, VH) |
| (MH, H) |
|
| (MH, M) |
| (MH, L) |
|
| (MH, VL) |
| (M, VH) |
|
| (M, H) |
| (M, M) |
|
| (M, L) |
| (M, VL) |
|
| (ML, VH) |
| (ML, H) |
|
| (ML, M) |
| (ML, L) |
|
| (ML, VL) |
| (L, VH) |
|
| (L, H) |
| (L, M) |
|
| (L, L) |
| (L, VL) |
|
| (VL, VH) |
| (VL, H) |
|
| (VL, M) |
| (VL, L) |
|
| (VL, VL) |
|
Step 4: A weighted normalized fuzzy decision matrix is formed by using the weight of criteria significance calculated in FBWM:
(21)
Now, according to
(22)
Step 5. In this step, normalized performance values are found by subtracting the useless criteria from the total of useful criteria specified according to the type of problem (Baležentis et al., 2012):
(23)
Step 6. Since normalized performance values are fuzzy
(24)
Now, according to the values of
4Proposed Approach
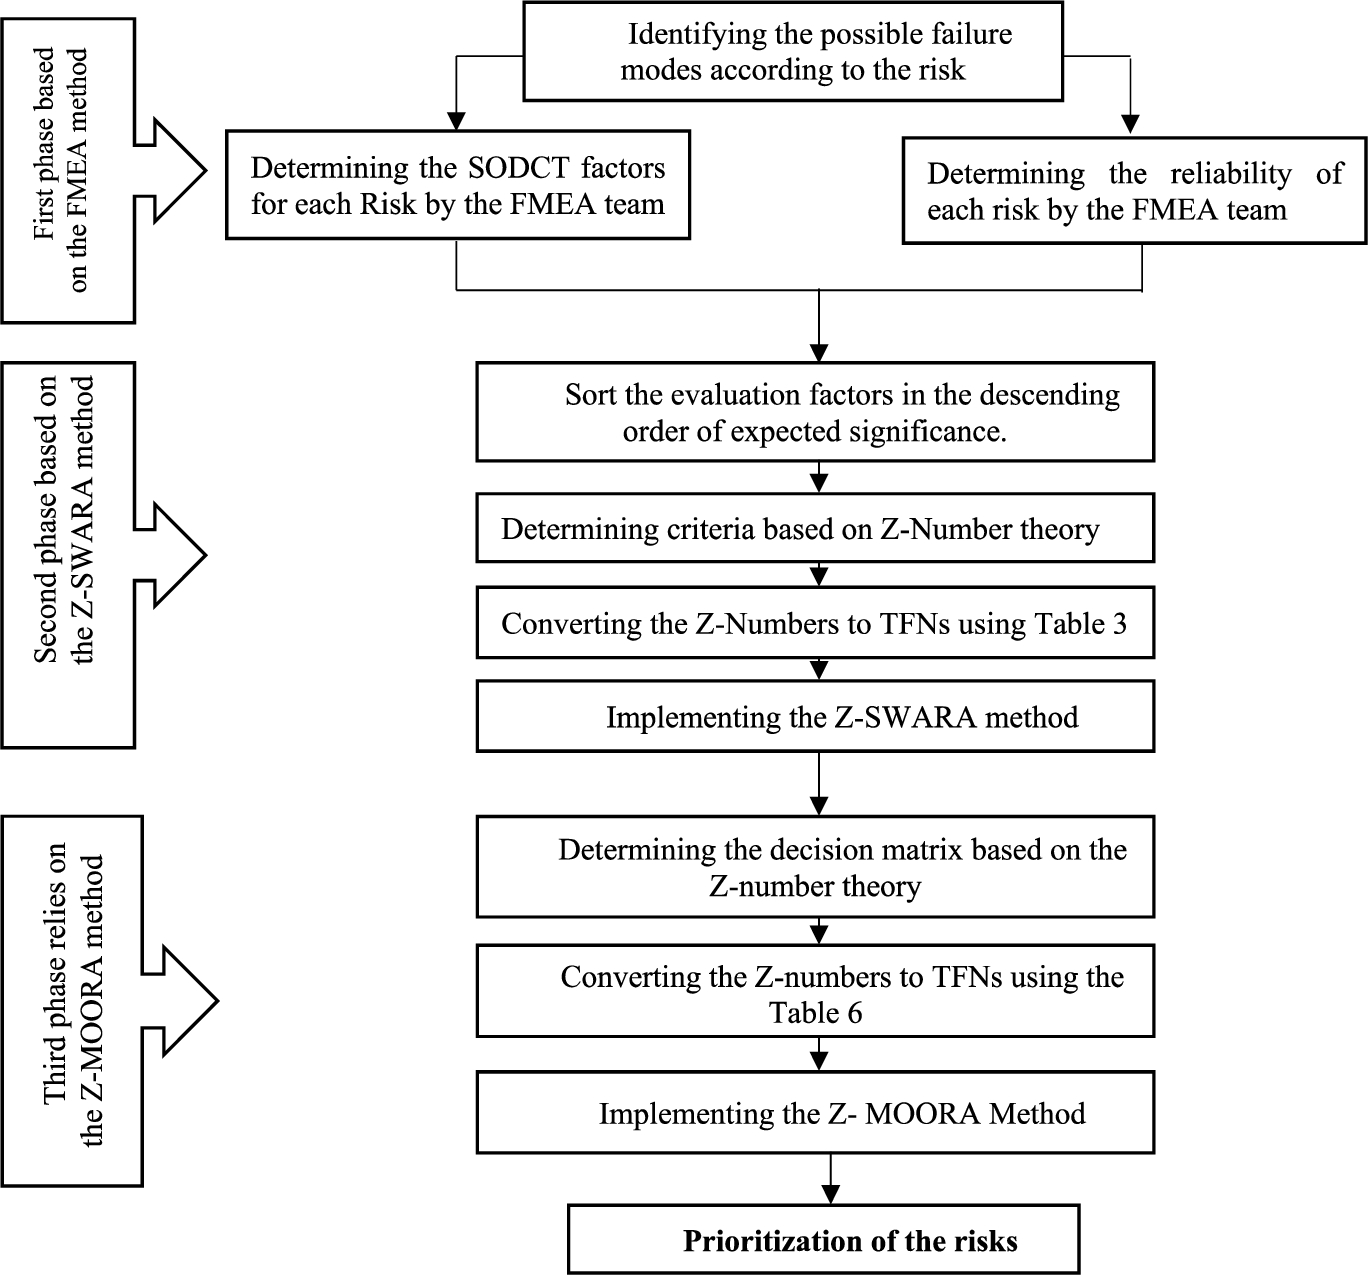
In this part, the suggested approach of this study uses FMEA, Z-MOORA and Z-SWARA methods to recognize the failure scenarios prioritization. Given the complementary description of the Z-SWARA and the Z-MOORA developed approach, introduced in the former section, the suggested approach is presented in three stages. In the first, while identifying the modes of failure by the FMEA team among the risk assessment range, the five-factor values are also set using Table 7. Also, in this phase, the reliability of each identified failure modes is determined by the team.
Table 7
Traditional ratings for SODCT factors.
| Rating | Severity (S) | Occurrence (O) | Detection (D) | Expected Cost (C) | Time (T) |
| 10 | Hazardous without warning | Very high: failure is almost inevitable | Absolute uncertainty | Product/system repair cost is close to the original price | Product/system repair time extremely high |
| 9 | Hazardous with warning | Product/system repair cost extremely high | |||
| 8 | Very high | High: repeated failures | High: repeated failures | Product/system repair cost very high | Product/system repair time very high |
| 7 | High | Product/system repair cost high | Product/system repair time high | ||
| 6 | Moderate | Moderate: occasional failures | Moderate: occasional failures | Product/system repair cost moderately high | Product/system repair time moderate |
| 5 | Low | Product/system repair cost moderate | |||
| 4 | Very low | Product/system repair cost relatively low | |||
| Product/system repair time low | |||||
| 3 | Minor | Product/system repair cost low | |||
| 2 | Very minor | Low: relatively few failures | Low: relatively few failures | Product/ system repair cost very low | Product/ system repair cost very low |
| 1 | None | Remote: failure is unlikely | Remote: failure is unlikely | Repair at nearly no cost |
In the second stage, in order to weigh the five criteria the Z-SWARA method is used. Z-SWARA, in contrast to the usual SWARA method, can consider reliability of each of the five factors in this study, in addition to considering the fuzzy values. In the third stage, based on the outputs of the first and second stages, it has been attempted to prioritize the recognized failure scenarios according to the importance of difference of the five factors, using the method of Z-MOORA. Z-MOORA, in contrast to the usual MOORA, in addition to considering fuzzy values, has the ability to consider reliability of other factors for each failure in this research. In this method, after defining the decision-making matrix, whose components consist of the number of fuzzy and values of reliability (Z-Numbers), these values are converted to fuzzy numbers using Table 6. Then the MOORA method is executed in a fuzzy environment. The output of this model is similar to the initial prioritization of the failure scenarios identified in the first stage. The implementation procedure of the suggested approach is also shown in Fig. 2.
Fig. 2
Proposed research approach to prioritize failure.
5Analysing the Results
This section provides explanations for the case study. Risks are provided in Table 8 after identification by FMEA method. Also, the values of risk factors were determined using Table 7. Then the implementation of the proposed approach was described step by step, based on the formulas introduced in the methodology section.
5.1Case Study
In order to check the suggested approach’s capacity in the current research, it tries to prioritize defeats as one of the basic production progression elements in an automotive supplier firm using this approach. The firm started work in the north of Iran in 1994, intending to design and produce industrial molds and work in the plastic sector. After a short time, it became successful in the automobile industry of Iran, due to the capabilities and modern technical knowledge of machinery it has been able to rank among the manufacturers of plastic parts of cars, including Peugeot 206, Peugeot 207, Peugeot 405, Samand and so on. The overall production procedure of the company consists of 6 stages: Mold Making, Paint Operation Assembly Line, Ultrasonic Injection Production Line, and Warehouse. In this research, intending to evaluate the abilities of the proposed approach, we examine the failures of one important step, Warehouse. This research seeks to identify and prioritize the failure of the warehouse process in producing the Axle Crossmember arm 405 pieces using the suggested approach. In this regard, with the collaboration of the expert team, the available failures, identified by the FMEA method, are identified. The list of 8 identified failures due to the FMEA method, along with the five criteria of severity, occurrence, diagnosis, cost, and time of each failure, with the help of a team of experts, is presented in Table 8.
5.2Results
In this section, the results of implementing the proposed research approach to assess the failure of the Warehouse process in the company are studied and presented. In the first stage, the fault scenarios are first recognized by the team of the FMEA and the five-factor amounts for each failure are specified by the team (Table 9). Then, given the uncertainty of these factors, Z-Number theory is used. This theory, in addition to considering the uncertainty of the factors as a fuzzy number, considers their reliability as well. The values of the Z-Number triple factors for failure scenarios are shown in Table 9, due to opinions of the FMEA team.
Table 8
Failures identified in the Warehouse process in relation to the manufacturing of Axle Cross member arm of 405.
| Failure | Failure name | Severity (S) | Occurrence (O) | Detection (D) | Cost (C) | Time (T) | ||||||||||
| TM1 | TM2 | TM3 | TM1 | TM2 | TM3 | TM1 | TM2 | TM3 | TM1 | TM2 | TM3 | TM1 | TM2 | TM3 | ||
| F1 | Falling parts when lifting them | 4 | 5 | 6 | 6 | 7 | 8 | 7 | 6 | 5 | 2 | 3 | 4 | 4 | 3 | 5 |
| F2 | Pallet falling down when load transportation | 10 | 9 | 8 | 6 | 5 | 4 | 4 | 3 | 2 | 6 | 4 | 5 | 5 | 4 | 6 |
| F3 | Collision with personnel in loading | 8 | 7 | 9 | 2 | 3 | 4 | 5 | 4 | 6 | 4 | 3 | 2 | 4 | 5 | 3 |
| F4 | Lift truck collision with shelves and falling down of shelves | 9 | 7 | 8 | 5 | 4 | 6 | 2 | 3 | 4 | 5 | 6 | 7 | 3 | 4 | 5 |
| F5 | Ergonomic problems when using the computer | 7 | 6 | 5 | 7 | 6 | 5 | 6 | 5 | 4 | 5 | 4 | 3 | 3 | 2 | 1 |
| F6 | Fire in warehouse | 7 | 6 | 8 | 6 | 5 | 4 | 5 | 3 | 4 | 4 | 5 | 6 | 3 | 5 | 4 |
| F7 | Falling parts when setting them | 8 | 10 | 9 | 4 | 2 | 3 | 6 | 5 | 4 | 6 | 5 | 4 | 5 | 3 | 4 |
| F8 | Dealing with people and equipment when driving lift trucks | 5 | 6 | 4 | 2 | 3 | 4 | 4 | 6 | 5 | 6 | 4 | 5 | 9 | 8 | 10 |
Table 9
The decision matrix in form of Z-number.
| Failure mode | S | O | D | C | T | ||||||||||
| TM1 | TM2 | TM3 | TM1 | TM2 | TM3 | TM1 | TM2 | TM3 | TM1 | TM2 | TM3 | TM1 | TM2 | TM3 | |
| F1 | ML, VH | M, H | M, H | MH, H | MH, H | H, VH | MH, M | M, H | M, M | L, VH | ML, M | M, VH | ML, M | ML, H | MH, VH |
| F2 | VH, VH | H, VH | H, VH | MH, H | MH, VH | M, VH | M, VH | ML, VH | L, M | M, H | ML, VH | M, M | M, VH | ML, VH | MH, H |
| F3 | H, H | MH, VH | VH, H | L, H | ML, VH | M, H | M, M | ML, M | MH, H | ML, M | ML, VH | L, VH | ML, H | MH, VH | ML, M |
| F4 | H, M | M, VH | MH, VH | M, VH | ML, VH | MH, VH | L, M | ML, VH | M, H | M, H | MH, VH | MH, H | M, H | ML, VH | MH, VH |
| F5 | MH, M | MH, VH | M, H | H, VH | MH, H | M, M | M, H | ML, H | ML, H | MH, VH | ML, VH | ML, H | ML, M | L, H | L, VH |
| F6 | MH, VH | H, M | H, VH | ML, H | M, M | ML, VH | M, H | ML, VH | MH, M | ML, M | ML, VH | M, H | M, VH | MH, M | ML, H |
| F7 | MH, M | H, VH | MH, M | ML, VH | L, VH | ML, M | MH, VH | MH, M | ML, H | M, H | M, M | M, VH | M, M | L, H | ML, M |
| F8 | M, VH | MH, VH | MH, M | L, VH | ML, M | M, VH | MH, H | MH, VH | M, VH | ML, H | M, H | MH, VH | H, M | H, VH | MH, H |
In the following, based on the second stage of the suggested approach, the weight of the five factors is specified by the Z-SWARA method. For this, the team of FMEA has identified the relative importance of each factor as compared to the previous factor in verbal variables, as shown in Table 10.
Table 10
The value of risk factors determined by experts in form of Z-Numbers.
| TM1 | TM2 | TM3 | |||
| Risk factor | Relative importance | Risk factor | Relative importance | Risk factor | Relative importance |
| S | C | S | |||
| C | (MOL, H) | S | (LI, VH) | C | (MOL, H) |
| D | (LI, VH) | D | (MOL, H) | D | (VLI, M) |
| O | (MUL, VH) | O | (VLI, M) | T | (VLI, H) |
| T | (VLI, M) | T | (MUL, VH) | O | (MUL, VH) |
Then, in the second phase of the research method, and also according to the SWARA method expressed, the values of coefficient k and the weight of q and w are calculated on the basis of equations (14) to (16) for each decision-maker in examining the failures in Table 12. In this step, the linguistic variables are converted into triangular fuzzy numbers, based on the equations shown in Tables 1 and 2. For example, the fuzzy numbers corresponding to the linguistic variable LI-M are
Table 11
The weights of risk factors.
| Team number | Risk factor | Comparative importance of average value
| Coefficient
| Recalculated weight
| Weight
| ||||||||
| TM1 | S | 1 | 1 | 1 | 1.000 | 1.000 | 1.000 | 0.377 | 0.434 | 0.510 | |||
| C | 0.561 | 0.837 | 1.255 | 1.561 | 1.837 | 2.255 | 0.443 | 0.544 | 0.641 | 0.167 | 0.237 | 0.327 | |
| D | 0.379 | 0.474 | 0.636 | 1.379 | 1.474 | 1.636 | 0.271 | 0.369 | 0.465 | 0.102 | 0.160 | 0.237 | |
| O | 0.209 | 0.237 | 0.275 | 1.209 | 1.237 | 1.275 | 0.213 | 0.299 | 0.384 | 0.080 | 0.130 | 0.196 | |
| T | 0.205 | 0.233 | 0.283 | 1.205 | 1.233 | 1.283 | 0.166 | 0.242 | 0.319 | 0.062 | 0.105 | 0.163 | |
| TM2 | C | 1 | 1 | 1 | 1.000 | 1.000 | 1.000 | 0.364 | 0.408 | 0.466 | |||
| S | 0.379 | 0.474 | 0.636 | 1.379 | 1.474 | 1.636 | 0.611 | 0.678 | 0.725 | 0.222 | 0.277 | 0.338 | |
| D | 0.561 | 0.837 | 1.255 | 1.561 | 1.837 | 2.255 | 0.271 | 0.369 | 0.465 | 0.099 | 0.150 | 0.217 | |
| O | 0.205 | 0.233 | 0.283 | 1.205 | 1.233 | 1.283 | 0.211 | 0.300 | 0.386 | 0.077 | 0.122 | 0.180 | |
| T | 0.209 | 0.237 | 0.275 | 1.209 | 1.237 | 1.275 | 0.166 | 0.242 | 0.319 | 0.060 | 0.099 | 0.149 | |
| TM3 | S | 1 | 1 | 1 | 1.000 | 1.000 | 1.000 | 0.367 | 0.420 | 0.489 | |||
| C | 0.561 | 0.837 | 1.255 | 1.561 | 1.837 | 2.255 | 0.443 | 0.544 | 0.641 | 0.163 | 0.230 | 0.313 | |
| D | 0.205 | 0.233 | 0.283 | 1.205 | 1.233 | 1.283 | 0.346 | 0.441 | 0.532 | 0.127 | 0.185 | 0.259 | |
| T | 0.243 | 0.276 | 0.335 | 1.243 | 1.276 | 1.335 | 0.259 | 0.346 | 0.428 | 0.095 | 0.145 | 0.209 | |
| O | 0.209 | 0.237 | 0.275 | 1.209 | 1.237 | 1.275 | 0.203 | 0.280 | 0.354 | 0.074 | 0.117 | 0.172 | |
Table 12
Final weights of risk factors.
| Risk factors | Final weight | ||
| S | 0.322 | 0.377 | 0.445 |
| C | 0.231 | 0.291 | 0.369 |
| D | 0.109 | 0.166 | 0.238 |
| O | 0.077 | 0.123 | 0.183 |
| T | 0.073 | 0.116 | 0.173 |
According to Table 12, weights of factors in the form of triangular fuzzy numbers are as follows:
In the third stage of the proposed approach, based on the results of the first and second stages, priority is given to the failure scenarios using the developed Z-MOORA. Initially, the decision-making matrix of the Z-MOORA is organized in the form of Z-number strings. The rows show the evaluated options, or the failure scenarios, and the columns show the evaluation criteria or the five factors. Subsequently, the decision-making matrix is transformed into a decision matrix in the form of triangular fuzzy numbers using the transformations presented in Table 6, which is presented in Table 13.
Table 13
Fuzzy group assessment matrix and aggregated fuzzy weights of failure factors.
| Factor | Failure | TM1 | TM2 | TM3 | ||||||
| l | m | u | l | m | u | l | M | u | ||
| S | F1 | 0.95 | 2.85 | 4.74 | 2.51 | 4.28 | 5.86 | 2.51 | 4.28 | 5.86 |
| F2 | 8.54 | 9.49 | 9.49 | 6.64 | 8.54 | 9.49 | 6.64 | 8.54 | 9.49 | |
| F3 | 5.86 | 7.53 | 8.37 | 4.74 | 6.64 | 8.54 | 7.53 | 8.37 | 8.37 | |
| F4 | 4.95 | 6.36 | 7.07 | 2.85 | 4.74 | 6.64 | 4.74 | 6.64 | 8.54 | |
| F5 | 3.54 | 4.95 | 6.36 | 4.74 | 6.64 | 8.54 | 2.51 | 4.28 | 5.86 | |
| F6 | 4.74 | 6.64 | 8.54 | 4.95 | 6.36 | 7.07 | 6.64 | 8.54 | 9.49 | |
| F7 | 3.54 | 4.95 | 6.36 | 6.64 | 8.54 | 9.49 | 3.54 | 4.95 | 6.36 | |
| F8 | 2.85 | 4.74 | 6.64 | 4.74 | 6.64 | 8.54 | 3.54 | 4.95 | 6.36 | |
| O | F1 | 4.18 | 5.86 | 7.53 | 4.18 | 5.86 | 7.53 | 6.64 | 8.54 | 9.49 |
| F2 | 4.18 | 5.86 | 7.53 | 4.74 | 6.64 | 8.54 | 2.85 | 4.74 | 6.64 | |
| F3 | 0 | 0.84 | 2.51 | 0.95 | 2.85 | 4.74 | 2.51 | 4.28 | 5.86 | |
| F4 | 2.85 | 4.74 | 6.64 | 0.95 | 2.85 | 4.74 | 4.74 | 6.64 | 8.54 | |
| F5 | 6.64 | 8.54 | 9.49 | 4.18 | 5.86 | 7.53 | 2.12 | 3.54 | 4.95 | |
| F6 | 0.84 | 2.51 | 4.18 | 2.12 | 3.54 | 4.95 | 0.95 | 2.85 | 4.74 | |
| F7 | 0.95 | 2.85 | 4.74 | 0 | 0.95 | 2.85 | 0.71 | 2.12 | 3.54 | |
| F8 | 0 | 0.95 | 2.85 | 0.71 | 2.12 | 3.54 | 2.85 | 4.74 | 6.64 | |
| D | F1 | 3.54 | 4.95 | 6.36 | 2.51 | 4.28 | 5.86 | 2.12 | 3.54 | 4.95 |
| F2 | 2.85 | 4.74 | 6.64 | 0.95 | 2.85 | 4.74 | 0 | 0.71 | 2.12 | |
| F3 | 2.12 | 3.54 | 4.95 | 0.71 | 2.12 | 3.54 | 4.18 | 5.86 | 7.53 | |
| F4 | 0 | 0.71 | 2.12 | 0.95 | 2.85 | 4.74 | 2.51 | 4.28 | 5.86 | |
| F5 | 2.51 | 4.28 | 5.86 | 0.84 | 2.51 | 4.18 | 0.84 | 2.51 | 4.18 | |
| F6 | 2.51 | 4.28 | 5.86 | 0.95 | 2.85 | 4.74 | 3.54 | 4.95 | 6.36 | |
| F7 | 4.74 | 6.64 | 8.54 | 3.54 | 4.95 | 6.36 | 0.84 | 2.51 | 4.18 | |
| F8 | 4.18 | 5.86 | 7.53 | 4.74 | 6.64 | 8.54 | 2.85 | 4.74 | 6.64 | |
| C | F1 | 0 | 0.95 | 2.85 | 0.71 | 2.12 | 3.54 | 2.85 | 4.74 | 6.64 |
| F2 | 2.51 | 4.28 | 5.86 | 0.95 | 2.85 | 4.74 | 2.12 | 3.54 | 4.95 | |
| F3 | 0.71 | 2.12 | 3.54 | 0.95 | 2.85 | 4.74 | 0 | 0.95 | 2.85 | |
| F4 | 2.51 | 4.28 | 5.86 | 4.74 | 6.64 | 8.54 | 4.18 | 5.86 | 7.53 | |
| F5 | 4.74 | 6.64 | 8.54 | 0.95 | 2.85 | 4.74 | 0.84 | 2.51 | 4.18 | |
| F6 | 0.71 | 2.12 | 3.54 | 0.95 | 2.85 | 4.74 | 2.51 | 4.28 | 5.86 | |
| F7 | 2.51 | 4.28 | 5.86 | 2.12 | 3.54 | 4.95 | 2.85 | 4.74 | 6.64 | |
| F8 | 0.84 | 2.51 | 4.18 | 2.51 | 4.28 | 5.86 | 4.74 | 6.64 | 8.54 | |
| T | F1 | 0.71 | 2.12 | 3.54 | 0.84 | 2.51 | 4.18 | 4.74 | 6.64 | 8.54 |
| F2 | 2.85 | 4.74 | 6.64 | 0.95 | 2.85 | 4.74 | 4.18 | 5.86 | 7.53 | |
| F3 | 0.84 | 2.51 | 4.18 | 4.74 | 6.64 | 8.54 | 0.71 | 2.12 | 3.54 | |
| F4 | 2.51 | 4.28 | 5.86 | 0.95 | 2.85 | 4.74 | 4.74 | 6.64 | 8.54 | |
| F5 | 0.71 | 2.12 | 3.54 | 0 | 0.84 | 2.51 | 0 | 0.95 | 2.85 | |
| F6 | 2.85 | 4.74 | 6.64 | 3.54 | 4.95 | 6.36 | 0.84 | 2.51 | 4.18 | |
| F7 | 2.12 | 3.54 | 4.95 | 0 | 0.84 | 2.51 | 0.71 | 2.12 | 3.54 | |
| F8 | 4.95 | 6.36 | 7.07 | 6.64 | 8.54 | 9.49 | 4.18 | 5.86 | 7.53 | |
Now, after normalizing the matrix shown in Table 13, the weighted normalized matrix is obtained by considering the weights of the risk factors (Table 14).
Table 14
Normalized fuzzy assessment matrix.
| S | O | D | C | T | ||||||||||
| 0.093 | 0.300 | 0.618 | 0.228 | 0.439 | 0.713 | 0.117 | 0.265 | 0.491 | 0.052 | 0.182 | 0.448 | 0.042 | 0.139 | 0.317 |
| 1.242 | 1.626 | 1.850 | 0.140 | 0.318 | 0.610 | 0.025 | 0.112 | 0.303 | 0.127 | 0.340 | 0.638 | 0.068 | 0.198 | 0.428 |
| 0.858 | 1.170 | 1.458 | 0.012 | 0.068 | 0.203 | 0.086 | 0.216 | 0.427 | 0.011 | 0.105 | 0.327 | 0.042 | 0.139 | 0.317 |
| 0.410 | 0.725 | 1.130 | 0.074 | 0.217 | 0.469 | 0.021 | 0.100 | 0.269 | 0.532 | 0.840 | 1.268 | 0.071 | 0.207 | 0.439 |
| 0.304 | 0.580 | 0.983 | 0.169 | 0.345 | 0.571 | 0.031 | 0.140 | 0.337 | 0.174 | 0.429 | 0.804 | 0.001 | 0.017 | 0.095 |
| 0.696 | 1.068 | 1.438 | 0.015 | 0.085 | 0.227 | 0.086 | 0.237 | 0.479 | 0.071 | 0.255 | 0.527 | 0.055 | 0.163 | 0.353 |
| 0.491 | 0.783 | 1.126 | 0.003 | 0.038 | 0.146 | 0.146 | 0.323 | 0.606 | 0.228 | 0.470 | 0.803 | 0.008 | 0.046 | 0.145 |
| 0.323 | 0.614 | 1.059 | 0.013 | 0.065 | 0.201 | 0.243 | 0.483 | 0.859 | 0.266 | 0.538 | 0.910 | 0.264 | 0.471 | 0.695 |
In the proposed Z-MOORA approach, according to Table 14, the results are shown with uncertainty in risk factors and reliability in failures. The results are presented in Table 15.
Table 15
Prioritization of risks rely on the Z-MOORA triple approaches.
| Failure | Z-MOORA | ||||
|
|
| Rank | |||
| l | m | u | |||
| F1 | 0.531 | 1.325 | 2.586 | 1.481 | 8 |
| F2 | 1.602 | 2.593 | 3.829 | 2.675 | 1 |
| F3 | 1.009 | 1.697 | 2.732 | 1.813 | 5 |
| F4 | 1.108 | 2.088 | 3.575 | 2.257 | 3 |
| F5 | 0.678 | 1.511 | 2.789 | 1.660 | 7 |
| F6 | 0.923 | 1.808 | 3.025 | 1.919 | 4 |
| F7 | 0.876 | 1.660 | 2.826 | 1.787 | 6 |
| F8 | 1.109 | 2.171 | 3.723 | 2.335 | 2 |
According to Table 15 and the proposed approach, F2, F8, and F4 failures are ranked from first to third with values 2.675, 2.335, and 2.257, respectively. These defeats are considered as serious failures and require planning to implement reformative/suppressive measures. In other words, these defeats are considered as vital defeats and require planning to implement reformative/suppressive measures. With this approach, it is observed that the failure of F1 is the last priority, and, given the limited resources of the organization, no corrective action is currently required. In general, by prioritizing the observed, the output of the proposed approach has made a complete difference between defeat scenarios. So, decision-makers can concentrate on the company’s corrective/preventive measures on failures with complete prioritization of downtime and resource constraints, which will result in system improvements if their negative effects are eliminated.
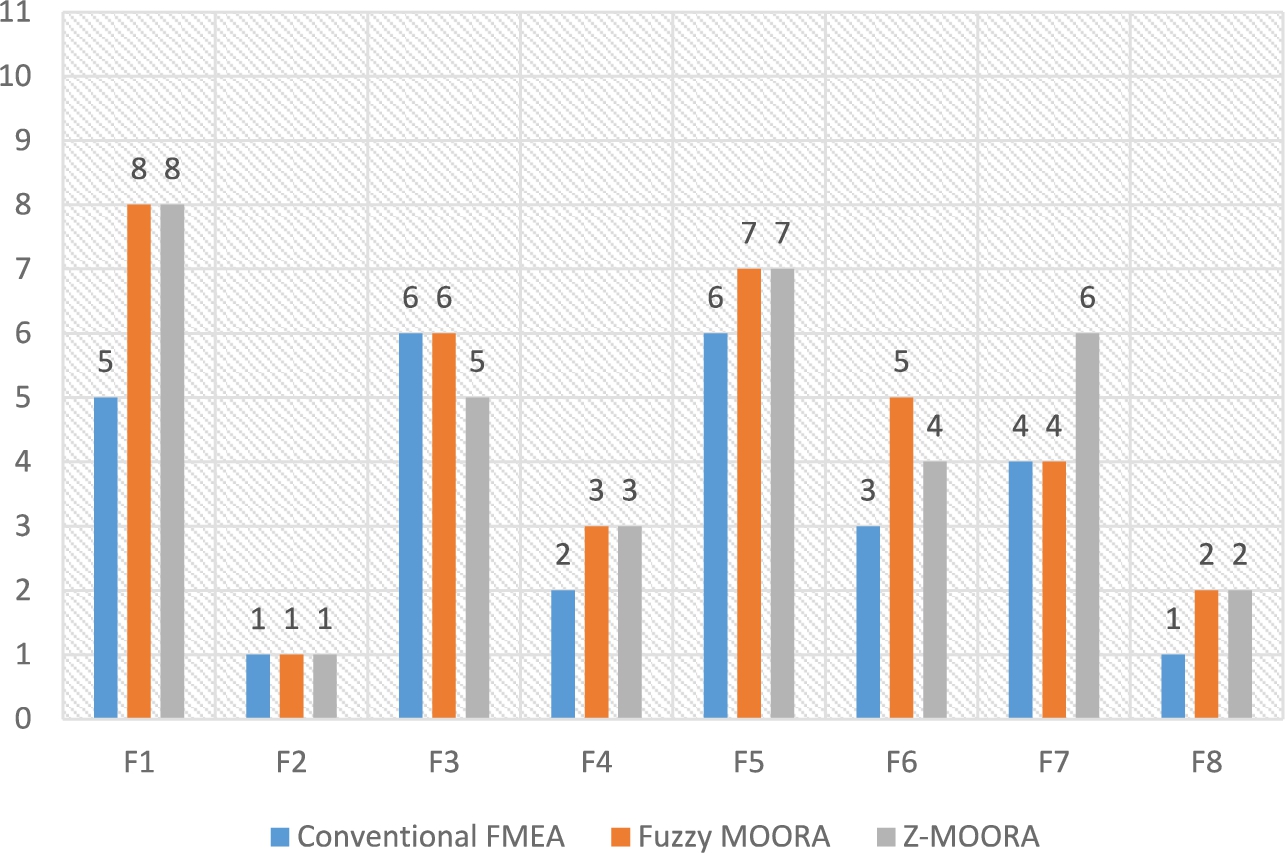
In the following, the final ranking of failures relying on the Z-MOORA approach is compared with other conventional methods consisting of fuzzy MOORA and the usual FMEA method in Table 16.
Table 16
Comparison of the prioritized results of the suggested approach and conventional methods.
| Failure | Conventional FMEA | Fuzzy MOORA | Z-MOORA | |||
| RPN | Rank |
| Rank |
| Rank | |
| F1 | 2520 | 5 | 1.596 | 8 | 1.481 | 8 |
| F2 | 3375 | 1 | 2.635 | 1 | 2.675 | 1 |
| F3 | 1440 | 6 | 2.062 | 6 | 1.813 | 5 |
| F4 | 2880 | 2 | 2.403 | 3 | 2.257 | 3 |
| F5 | 1440 | 6 | 1.837 | 7 | 1.660 | 7 |
| F6 | 2800 | 3 | 2.216 | 5 | 1.919 | 4 |
| F7 | 2700 | 4 | 2.224 | 4 | 1.787 | 6 |
| F8 | 3375 | 1 | 2.406 | 2 | 2.335 | 2 |
According to Table 16, due to traditional RPN, failures of F2, F8 with RPN = 3375 are considered jointly in the prior precedence. Also, defeats of F2 and F5 with RPN = 1440 are shared in the last precedence. With a general review of the prioritization of failures based on traditional RPNs, it can be seen that the prioritization of failures has been done in such a way that defeats are grouped into six classes. This suggests that prioritization relying on this customary index is not quite realized and confounds the decision-maker in risk management and planning of corrective/preventive measures. Regarding the comparisons in Table 16, according to expert’s opinions and organizational conditions, prioritizing inadequate failures can be attributed to five factors as a result of not allocating different weights, as well as the lack of attention to the uncertainty of the value of these five agents.
In the following, a more detailed analysis of Table 16 shows that when the fuzzy MOORA method is used, the problem of defective prioritization of failures has been improved. Given the prioritization of the fuzzy MOORA rating, F2 and F8 failures are in the first and second precedencies for analysis. Also, F1 defeats are in the last precedence. In this method, the uncertainty of the five factors and the weight of these factors are considered, using the fuzzy theory and the FBWM method, respectively, to cover some of the disadvantages of the usual RPN index. But in this method, contrary to the increased differentiation in prioritizing failures in conventional FMEA, there is a problem with decision-making reliability. For this reason, this research has developed an improved approach to dominate this deficiency, which is based on the prioritization performed based on the developed FMEA-based Z-MOORA method, which detects all recognized defeats are in distinctive priorities. In other words, the proposed method of this study by merging the meanings of uncertainty and the reliability of the defeat points by using the theory of Z-Number has tried to decrease some of the principal weaknesses of the traditional RPN, which is reliability of the decision making by the method. The customary MOORA was introduced, which makes the decision according to the actual output. By examining the results of this method, compared to the other two approaches, it can be said that the prioritization of defeats is complete and that defeats relying on the traditional RPN in the same priorities is divided into eight classes relying on the suggested approach of the research (Fig. 3). By comparing the results of the two Z-MOORA and usual FMEA approaches, F2 and F8 failures, which were ranked jointly in the priority due to the usual RPN index, were ranked first and second according to the traditional RPN index. This suggests that the Z-MOORA approach, in addition to making a distinction in priority, prioritizes failures which have more values in the most important determinants of RPN (in this study, S, C, O, D and T are the most important factors respectively), thus, these are located in higher priorities.
Fig. 3
Comparison of the risks prioritization.
5.3Sensitivity Analysis
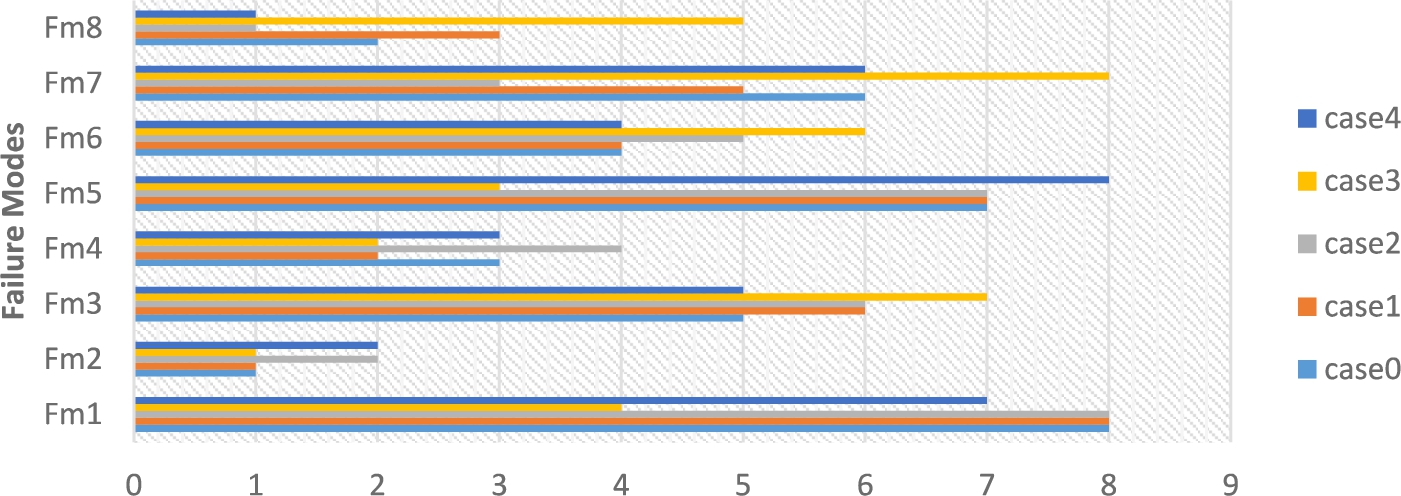
Sensitivity analysis by changing the weight of risk factors is calculated according to the information given in Table 17. For example, Case 0 shows the original weight values of the risk factors while the other cases show different weight values for possible situations. In fact, in different cases, one of the five risk factors weight increases, and in proportion to this amount, we reduce the weight of other factors so that the weight of that factor is the highest. The effects of weight changes on the five factors in the ranking of fashion fillers are presented in Table 18 and Fig. 4. In Case 1, 0.1 is added to the weight of C, and 0.025 is deducted from the weight of S, O, D, and T. Also 0.2 is added to the weight of D in Case 2, 0.24 is added to the weight of O in Case 3 and 0.28 to the weight of T in Case 4, and the same proportion is deducted from the initial weight of the others in each case. The results for ranking the Warehouse process for different cases are represented in Fig. 4 and Table 18 indicates that in three of five cases the most important failure mode is Pallet falling when loading transportation. In Cases 2 and 4, as the weights of cost and time are the highest, “Pallet falling when load transportation” failure mode is the second most important failure mode. Meanwhile, “Dealing with people and equipment when driving lift trucks” is the first most important failure mode. “Falling parts when lifting them” failure mode is also ranked the last in Cases 0, 1, and 2.
Table 17
Weights of the risk factors with respect to considered cases.
| S | O | D | C | T | |
| Case 0 | 0.379 | 0.125 | 0.168 | 0.294 | 0.119 |
| Case 1 | 0.354 | 0.100 | 0.143 | 0.394 | 0.094 |
| Case 2 | 0.329 | 0.075 | 0.368 | 0.244 | 0.069 |
| Case 3 | 0.319 | 0.365 | 0.108 | 0.234 | 0.059 |
| Case 4 | 0.309 | 0.055 | 0.098 | 0.224 | 0.399 |
Table 18
Rankingresults of failure modes with respect to the considered cases.
| Failures | Rank | ||||
| Case 0 | Case 1 | Case 2 | Case 3 | Case 4 | |
| F1 | 8 | 8 | 8 | 4 | 7 |
| F2 | 1 | 1 | 2 | 1 | 2 |
| F3 | 5 | 6 | 6 | 7 | 5 |
| F4 | 3 | 2 | 4 | 2 | 3 |
| F5 | 7 | 7 | 7 | 3 | 8 |
| F6 | 4 | 4 | 5 | 6 | 4 |
| F7 | 6 | 5 | 3 | 8 | 6 |
| F8 | 2 | 3 | 1 | 5 | 1 |
Fig. 4
Sensitivity analysis for Z-MOORA.
6Conclusion
Today, risk management and the improvement of reliability of processes are of increasing importance based on manufacture and operation management. The method of FMEA is one of the most generally used techniques of risk analysis in organizations, according to its vast implementation capability and appropriate analyticity. This method, despite its high application in various fields, has weaknesses and limitations, but researchers seek to improve these weaknesses and resolve their limitations. In this research, an extended FMEA approach with ZSWARA and ZMOORA approaches is presented, each of which has been used to overcome some of the FMEA deficiencies and traditional RPNs, so that after identifying potential malfunction scenarios based on the FMEA method, the ZSWARA method for weighting factors was used to resolve the weaknesses of similar weights in the traditional RPN, and the ZMOORA method was used to prioritize failure modes. In fact, both in the weighing stage and in the prioritization stage, this approach, in addition to considering the uncertainty in determinants, also affects reliability among the theory of the Z-NUMBER of decision making. In fact, various views of the members of the decision-making team in implementing the FMEA method are always uncertain. Therefore, the proposed approach, in addition to considering uncertainty, also uses the reliability component, which leads to the prioritization of failures in a perfect state. These results led the decision-maker to identify and prioritize critical failures and corrective and preventive measures based on resource and planning constraints. This approach was implemented in the warehousing process of a company in the field of automotive section production, and comparing the results with the traditional FMEA methods it was shown that the reliability was closer to reality and provided a complete prioritization to the decision-maker. One of the limitations of this research is the shortage of attention of the causal connections among defeats that can be considered in future research using the Z-NUMBER based cognitive mapping method.
Regarding the fact that decision making is an undeniable part of real-world, providing efficient approaches is vital. The proposed approach is a decision making system and is applicable to different sections of industry, for example, to solve supplier selection. It should be noted that failing to observe the cause and effect relationships of failure modes is the main limitation of this study. Besides, overlooking the risks in criteria and failure modes and considering importance-necessity in decision making is another issue that can be considered in future investigation using R-Number (Seiti et al., 2019) and G-number (Ghoushchi and Khazaeili, 2019).
References
1 | Abdulhasan, M., Hanafiah, M., Satchet, M., Abdulaali, H., Toriman, M., Al-Raad, A. ((2019) ). Combining GIS, fuzzy logic and AHP models for solid waste disposal site selection in Nasiriyah, Iraq. Applied Ecology and Environmental Research, 17: , 6701–6722. |
2 | Adhikary, D.D., Bose, G.K., Bose, D., Mitra, S. ((2014) ). Multi criteria FMECA for coal-fired thermal power plants using COPRAS-G. International Journal of Quality and Reliability Management, 31: (5), 601–614. |
3 | Akbari, R., Dabbagh, R., Ghoushchi, S.J. ((2020) ). HSE risk prioritization of molybdenum operation process using extended FMEA approach based on fuzzy BWM and Z-WASPAS. Journal of Intelligent and Fuzzy Systems, 38: , 5157–5173. |
4 | Akkaya, G., Turanoğlu, B., Öztaş, S. ((2015) ). An integrated fuzzy AHP and fuzzy MOORA approach to the problem of industrial engineering sector choosing. Expert Systems with Applications, 42: , 9565–9573. |
5 | Arabsheybani, A., Paydar, M.M., Safaei, A.S. ((2018) ). An integrated fuzzy MOORA method and FMEA technique for sustainable supplier selection considering quantity discounts and supplier’s risk. Journal of Cleaner Production, 190: , 577–591. |
6 | Attri, R., Grover, S. ((2014) ). Decision making over the production system life cycle: MOORA method. International Journal of System Assurance Engineering and Management, 5: , 320–328. |
7 | Azadeh, A., Kokabi, R. ((2016) ). Z-number DEA: a new possibilistic DEA in the context of Z-numbers. Advanced Engineering Informatics, 30: , 604–617. |
8 | Baležentis, A., Baležentis, T., Brauers, W.K. ((2012) ). Personnel selection based on computing with words and fuzzy MULTIMOORA. Expert Systems with Applications, 39: , 7961–7967. |
9 | Bao, J., Johansson, J., Zhang, J. ((2017) ). An occupational disease assessment of the mining industry’s occupational health and safety management system based on FMEA and an improved AHP model. Sustainability, 9: , 94. |
10 | Bevilacqua, M., Braglia, M. ((2000) ). The analytic hierarchy process applied to maintenance strategy selection. Reliability Engineering and System Safety, 70: , 71–83. |
11 | Brauers, W.K., Zavadskas, E.K. ((2006) ). The MOORA method and its application to privatization in a transition economy. Control and Cybernetics, 35: , 445–469. |
12 | Brauers, W.K.M., Zavadskas, E.K. ((2012) ). Robustness of MULTIMOORA: a method for multi-objective optimization. Informatica, 23: , 1–25. |
13 | Chand, M., Bhatia, N., Singh, R.K. ((2018) ). ANP-MOORA-based approach for the analysis of selected issues of green supply chain management. Benchmarking: An International Journal, 25: (2), 642–659. |
14 | Dabbagh, R., Yousefi, S. ((2019) ). A hybrid decision-making approach based on FCM and MOORA for occupational health and safety risk analysis. Journal of Safety Research, 71: , 111–123. |
15 | Dorosti, S., Fathi, M., Ghoushchi, S.J., Khakifirooz, M., Khazaeili, M. ((2020) ). Patient waiting time management through fuzzy based failure mode and effect analysis. Journal of Intelligent and Fuzzy Systems, 38: (2), 2069–2080. |
16 | Garcia, P.A., Schirru, R. ((2005) ). A fuzzy data envelopment analysis approach for FMEA. Progress in Nuclear Energy, 46: , 359–373. |
17 | Ghoushchi, S.J., Khazaeili, M. ((2019) ). G-Numbers: importance-necessity concept in uncertain environment. International Journal of Management and Fuzzy Systems, 5: , 27–32. |
18 | Ghoushchi, S.J., Milan, M.D., Rezaee, M.J. ((2018) ). Evaluation and selection of sustainable suppliers in supply chain using new GP-DEA model with imprecise data. Journal of Industrial Engineering International, 14: , 613–625. |
19 | Ghoushchi, S.J., Yousefi, S., Khazaeili, M. ((2019) ). An extended FMEA approach based on the Z-MOORA and fuzzy BWM for prioritization of failures. Applied Soft Computing, 81: , 105505. |
20 | Giri, B.C., Molla, M.U., Biswas, P. ((2020) ). TOPSIS method for neutrosophic hesitant fuzzy multi-attribute decision making. Informatica, 31: , 35–63. |
21 | Guo, S., Zhao, H. ((2017) ). Fuzzy best-worst multi-criteria decision-making method and its applications. Knowledge-Based Systems, 121: , 23–31. |
22 | Haimes, Y.Y., Horowitz, B.M., Guo, Z., Andrijcic, E., Bogdanor, J. ((2015) ). Assessing systemic risk to cloud-computing technology as complex interconnected systems of systems. Systems Engineering, 18: , 284–299. |
23 | Jafarzadeh Ghoushchi, S. ((2018) ). Qualitative and quantitative analysis of Green Supply Chain Management (GSCM) literature from 2000 to 2015. International Journal of Supply Chain Management, 7: , 77–86. |
24 | Jafarzadeh Ghoushchi, S., Ab Rahman, M.N., Raeisi, D., Osgooei, E., Jafarzadeh Ghoushji, M. ((2020) ). Integrated decision-making approach based on SWARA and GRA methods for the prioritization of failures in solar panel systems under Z-information. Symmetry, 12: , 310. |
25 | Jafarzadeh Ghoushchi, S., Khazaeili, M., Amini, A., Osgooei, E. ((2019) ). Multi-criteria sustainable supplier selection using piecewise linear value function and fuzzy best-worst method. Journal of Intelligent and Fuzzy Systems, 37: , 2309–2325. |
26 | Jafarzadeh, S.G., Rahman, M.N.A., Wahab, D.A. ((2012) ). Optimization of supply chain management based on response surface methodology: a case study of Iran Khodro. World Applied Sciences Journal, 20: , 620–627. |
27 | Kamaruzzaman, S.N., Lou, E.C.W., Wong, P.F., Wood, R., Che-Ani, A.I. ((2018) ). Developing weighting system for refurbishment building assessment scheme in Malaysia through Analytic Hierarchy Process (AHP) approach. Energy Policy, 112: , 280–290. |
28 | Karabasevic, D., Popovic, G., Stanujkic, D., Maksimovic, M., Sava, C. ((2019) ). An approach for hotel type selection based on the single-valued intuitionistic fuzzy numbers. International Review, 1: , 7–14. |
29 | Karande, P., Chakraborty, S. ((2012) ). Application of multi-objective optimization on the basis of ratio analysis (MOORA) method for materials selection. Materials and Design, 37: , 317–324. |
30 | Kassem, M.A., Khoiry, M.A., Hamzah, N. ((2019) ). Evaluation of risk factors affecting on oil and gas construction projects in Yemen. International Journal of Engineering and Technology, 8: , 6–14. |
31 | Keršuliene, V., Zavadskas, E.K., Turskis, Z. ((2010) ). Selection of rational dispute resolution method by applying new step-wise weight assessment ratio analysis (SWARA). Journal of Business Economics and Management, 11: , 243–258. |
32 | Kovačević, N., Stojiljković, A., Kovač, M. ((2019) ). Application of the matrix approach in risk assessment. Operational Research in Engineering Sciences: Theory and Applications, 2: , 55–64. |
33 | Liu, H.-C. ((2016) ). FMEA Using Uncertainty Theories and MCDM Methods. Springer. |
34 | Liu, H.-C., Liu, L., Liu, N., Mao, L.-X. ((2012) ). Risk evaluation in failure mode and effects analysis with extended VIKOR method under fuzzy environment. Expert Systems with Applications, 39: , 12926–12934. |
35 | Liu, H.-C., Fan, X.-J., Li, P., Chen, Y.-Z. ((2014) ). Evaluating the risk of failure modes with extended MULTIMOORA method under fuzzy environment. Engineering Applications of Artificial Intelligence, 34: , 168–177. |
36 | Liu, H.-C., You, J.-X., Ding, X.-F., Su, Q. ((2015) ). Improving risk evaluation in FMEA with a hybrid multiple criteria decision making method. International Journal of Quality and Reliability Management, 32: , 763–782. |
37 | Liu, H.-C., You, J.-X., Shan, M.-M., Su, Q. ((2019) ). Systematic failure mode and effect analysis using a hybrid multiple criteria decision-making approach. Total Quality Management and Business Excellence, 30: , 537–564. |
38 | Maheswaran, K., Loganathan, T. ((2013) ). A novel approach for prioritization of failure modes in FMEA using MCDM. International Journal of Engineering Research and Applications, 3: , 733–739. |
39 | Mavi, R.K. ((2015) ). Green supplier selection: a fuzzy AHP and fuzzy ARAS approach. International Journal of Services and Operations Management, 22: , 165–188. |
40 | Mavi, R.K., Goh, M., Zarbakhshnia, N. ((2017) ). Sustainable third-party reverse logistic provider selection with fuzzy SWARA and fuzzy MOORA in plastic industry. The International Journal of Advanced Manufacturing Technology, 91: , 2401–2418. |
41 | Mishra, A.R., Garg, A.K., Purwar, H., Rana, P., Liao, H., Mardani, A. (2020). An extended intuitionistic fuzzy multi-attributive border approximation area comparison approach for smartphone selection using discrimination measures. Informatica, 1–25. |
42 | Mukhametzyanov, I., Pamucar, D. ((2018) ). A sensitivity analysis in MCDM problems: a statistical approach. Decision Making: Applications in Management and Engineering, 1: , 51–80. |
43 | Mustaffa, N.F., Hishamuddin, H., Ropi, N., Saibani, N., Ab Rahman, M.N. ((2018) ). Assessing supply Chain risk management practices in manufacturing industries in Malaysia. Jurnal Kejuruteraan, 6: , 17–22. |
44 | Nasir, N., Abdullah, S., Singh, S., Haris, S. ((2020) ). Risk-based Life Assessment of Prediction Models on Suspension System for Various Road Profiles. Engineering Failure Analysis, 14: , 104573. |
45 | Rau, H., Liao, C.-P., Shiang, W.-J., Lin, C.-H. ((2007) ). Using fuzzy theory for packaging attribute deployment for new notebook computer introduction. International Conference on Industrial, Engineering and Other Applications of Applied Intelligent Systems, 7: , 250–259. |
46 | Rezaee, M.J., Salimi, A., Yousefi, S. ((2017) ). Identifying and managing failures in stone processing industry using cost-based FMEA. The International Journal of Advanced Manufacturing Technology, 88: , 3329–3342. |
47 | Rezaee, M.J., Yousefi, S., Valipour, M., Dehdar, M.M. ((2018) ). Risk analysis of sequential processes in food industry integrating multi-stage fuzzy cognitive map and process failure mode and effects analysis. Computers and Industrial Engineering, 123: , 325–337. |
48 | Rezaei, J. ((2015) ). Best-worst multi-criteria decision-making method. Omega, 53: , 49–57. |
49 | Sahrom, N.A., Dom, R.M.A. ((2015) ). A Z-number extension of the hybrid analytic hierarchy process – fuzzy data envelopment analysis for risk assessment. In: 2015 International Conference on Research and Education in Mathematics (ICREM7), Kuala Lumpur, 2015, pp. 19–24. https://doi.org/10.1109/ICREM.2015.7357019. |
50 | Seiti, H., Hafezalkotob, A., Martínez, L. ((2019) ). R-numbers, a new risk modeling associated with fuzzy numbers and its application to decision making. Information Sciences, 483: , 206–231. |
51 | Seyed-Hosseini, S.M., Safaei, N., Asgharpour, M. ((2006) ). Reprioritization of failures in a system failure mode and effects analysis by decision making trial and evaluation laboratory technique. Reliability Engineering and System Safety, 91: , 872–881. |
52 | Sharma, R.K., Sharma, P. ((2012) ). Integrated framework to optimize RAM and cost decisions in a process plant. Journal of Loss Prevention in the Process Industries, 25: , 883–904. |
53 | Shen, K.-W., Wang, J.-Q. ((2018) ). Z-VIKOR method based on a new comprehensive weighted distance measure of Z-number and its application. IEEE Transactions on Fuzzy Systems, 26: , 3232–3245. |
54 | Shihab, S., Khan, N., Myla, P., Upadhyay, S., Khan, Z., Siddiquee, A. ((2018) ). Application of MOORA method for multi optimization of GMAW process parameters in stain-less steel cladding. Management Science Letters, 8: , 241–246. |
55 | Spreafico, C., Russo, D., Rizzi, C. ((2017) ). A state-of-the-art review of FMEA/FMECA including patents. Computer Science Review, 25: , 19–28. |
56 | Stanujkic, D., Karabasevic, D., Zavadskas, E.K., Smarandache, F., Brauers, W.K. ((2019) ). A bipolar fuzzy extension of the MULTIMOORA method. Informatica, 30: , 135–152. |
57 | Turskis, Z., Goranin, N., Nurusheva, A., Boranbayev, S. ((2019) ). Information security risk assessment in critical infrastructure: a hybrid MCDM approach. Informatica, 30: , 187–211. |
58 | Vesković, S., Stević, Ž., Stojić, G., Vasiljević, M., Milinković, S. ((2018) ). Evaluation of the railway management model by using a new integrated model DELPHI-SWARA-MABAC. Decision Making Applications in Management and Engineering, 1: , 34–50. |
59 | Wang, L.-E., Liu, H.-C., Quan, M.-Y. ((2016) ). Evaluating the risk of failure modes with a hybrid MCDM model under interval-valued intuitionistic fuzzy environments. Computers and Industrial Engineering, 102: , 175–185. |
60 | Wang, L., Hu, Y.P., Liu, H.C., Shi, H. ((2019) ). A linguistic risk prioritization approach for failure mode and effects analysis: a case study of medical product development. Quality and Reliability Engineering International, 35: , 1735–1752. |
61 | Yaakob, A.M., Gegov, A. ((2016) ). Interactive TOPSIS based group decision making methodology using Z-numbers. International Journal of Computational Intelligence Systems, 9: , 311–324. |
62 | Yousefi, S., Alizadeh, A., Hayati, J., Baghery, M. ((2018) ). HSE risk prioritization using robust DEA-FMEA approach with undesirable outputs: a study of automotive parts industry in Iran. Safety Science, 102: , 144–158. |
63 | Zadeh, L.A. ((1965) ). Fuzzy sets. Information and Control, 8: , 338–353. |
64 | Zadeh, L.A. ((2011) ). A note on Z-numbers. Information Sciences, 181: , 2923–2932. |
65 | Zammori, F., Gabbrielli, R. ((2012) ). ANP/RPN: a multi criteria evaluation of the risk priority number. Quality and Reliability Engineering International, 28: , 85–104. |
66 | Zhang, S., Tang, J., Meng, F., Yuan, R. (2020). A group decision making method with interval-valued intuitionistic fuzzy preference relations and its application in the selection of cloud computing vendors for SMEs. Informatica, 1–31. |
67 | Zolfani, S.H., Saparauskas, J. ((2013) ). New application of SWARA method in prioritizing sustainability assessment indicators of energy system. Engineering Economics, 24: , 408–414. |


