
Mapping the evolution of topics published by Education for Information: Interdisciplinary Journal of Information Studies
Abstract
The need to map the evolution of trends in any field of activity arises when a large amount of data is available on that activity, thus making impossible a manual exploration of the data in order to understand how the field or the activity is evolving. Topic and trend mapping is a mature field with hundreds of publications on approaches, methods and tools for data collection, analysis, feature extraction and reduction, clustering and visualisation tools and algorithms. Our study aims to map the evolution of topics published by the journal Education for Information. Interdisciplinary Journal on Information Studies (EFI henceforth) which has been in existence since 1983, in order to understand how this journal has evolved and how it is positioned with regard to the field of Library and Information Science to which it belongs. Our study is part of the body of work on topic detection and text mining. Our results showed that the journal displayed a remarkable stability in its editorial policy over more than three decades. With the arrival of its third Editor in Chief in 2018, a shift towards more technologically oriented topics and to specialties from other fields are perceptible such as health information, data science and digital humanities.
1.Introduction
The need to map the evolution of trends in any field of activity arises when a large amount of data is available on that activity, thus making impossible a manual exploration of the data in order to understand how the field or the activity is evolving. As digital traces of any field of activity accumulate and grow, domain specialists have to resort more and more to computer software to help them track the evolution of their activity and therefore better plan for the future. Topic and trend mapping is a mature field with hundreds of publications on approaches, methods and tools for data collection, analysis, feature extraction and reduction, clustering and visualisation tools and algorithms. The availability of many powerful and user-friendly data analysis and visualisation packages has made topic mapping an increasingly popular endeavour not only in the original fields from whence the methods originated such as bibliometrics and scientometrics, but also in any given field and on any activity provided a significant amount of data is available in digital format (see Ibekwe-SanJuan, 2007 for a review).
Our study aims to map the evolution of topics published by the journal Education for Information. Interdisciplinary Journal on Information Studies (EFI henceforth) which has been in existence since 1983, in order to understand how this journal has evolved and how it is positioned with regard to the field of Library and Information Science to which it belongs. Our study is part of the body of work on trends analysis from the textual content of the data. This is also known as topic detection or text mining. Our study is therefore related to bibliometrics and scientometrics studies that are concerned with mapping the intellectual structure of research fields using author co-citation analysis (ACA) (White & McCain, 1998; Zhao & Strotmann, 2008b), Document Citation Analysis (DCA) (Small & Sweeney, 1985; Chen, 2004), journal citation analysis (JCA) and particularly co-word analysis (Callon & Courtial, 1991; Rip & Courtial, 1984). Some previous studies have combined ACA, DCA and text mining to map the intellectual structures of knowledge domains from multiple perspectives (Chen et al., 2010).
While many of the previous studies in these areas analysed data from several journals (Janssens et al., 2006) or authors, it is not uncommon to find studies focusing on mapping the intellectual structures of a single author or of a single journal provided the available data is sufficient for clustering and mapping schemes. For instance, Li and Xu (2019) studied the evolution of titles published in the Journal of Pragmatics between 1978–2018 based on the well known discourse analysis premise that titles can provide a glimpse into the content of a publication, Li and Xu (2019) examined how the syntactic and lexical form of titles have evolved over time in the Journal of Pragmatics. They looked at the length of titles (number of words) and the lexical density of titles in this journal (number of content bearing words in a title). They found that over time, authors tended to formulate longer titles and they attributed this “to the fundamental communicative function of titles to inform clearly and precisely”. They also observed increased lexical density in titles of this journal over time. According to them, this is explained by authors wanting to attract readers to their papers by providing more informative titles as competition for attention intensified due to the Internet and the web
Our goal is somewhat different from that of Li and Zu (2019) in that they were looking at the informativeness of titles whereas we are studying the evolution of thematic trends (i.e., topics on which the journal has been publishing and not on stylistics and informativeness of its titles). Also, more fundamentally, Li and Zu (2019) derived a typology of titles according to some semantic features and their feature extraction and analysis of the linguistic properties of constructs found in the titles was performed manually. They furnished hardly any details on how this was done practically. Was it done by one person or more? According to what rules and parameters? Previous research has shown that manual semantic analysis of contents raises huge methodological issues and biases which should be laid bare in the methodology section. The article gave no details about the difficulties encountered in deciding to which semantic category to assign a title.
By contrast to Li and Zu (2019), our study of the evolution of topics published in EFI relies on automatic processes and tools developed over several decades which reduce the biases linked to the human interpretation. This is not to say that automatic methods do not have their own biases and limitations but these are known and documented in the literature. We will return to this point in the discussion section.
2.Analysis methodology
We conducted an analysis of the titles of the articles published in the journal Education for Information (EFI) from 1983 to the first issue of 2019. We will first explain how the corpus of titles was split into sizable chunks before describing the clustering and mapping processes.
2.1Corpus splitting
Our corpus covers more than 36 years, from 1983 when this journal was created to the first quarter of 2019 when the data collection was done. Thus 2019 data is incomplete as only the first issue of the journal had been published and entered into the database at the time of corpus collection. In such diachronic studies, it is customary to split the corpus into manageable time spans in order to obtain intelligible maps and better follow the trends. We tried three approaches to corpus splitting:
i- by Editor in Chief of the journal (EIC). The journal has had three EICs to date. This yielded a very unequal partition of the corpus (see Table 1) as the first EIC ran the journal from 1983 till 2013, thus for 30 years. The second EIC ran the journal for three years (2014–2017) although 2014 was a blank year as no issues were published, hence no titles for that year. The last and current EIC had only 1 year of running the journal at the time of data collection (2018 to first quarter of 2019). Hence, the partitioning of titles by EIC is very skewed as shown in Table 1.
Table 1
Number of papers published during each Editor-in-chief’s term of office
| EIC 1 (1983–2013) | EIC 2 (2014–2017) | EIC 3 (2018–2019) | Total |
| 799 | 51 | 35 | 885 |
Bearing in mind this skewness, we believe that mapping the titles by EICs can still tell us something about the topics prevalent during the mandate of each EIC during and how the journal’s center of gravity has evolved over time.
A more traditional way of splitting a corpus spanning a long period of time is to partition it into an equal interval of years. Previous studies tended to split the corpus by periods of five or six years, as this time span was judged sufficient to perceive trends (Chen et al., 2010). In this study, we tested two intervals of 6 years and 5 years.
The distribution of titles in the two intervals is given in Table 2 above. P1
Table 2
Distribution of titles published in the journal by intervals of 5 and 6 years
| Corpus splitting intervals | P1 | P2 | P3 | P4 | P5 | P6 | P7 | Total |
|---|---|---|---|---|---|---|---|---|
| 5 year interval | 232 | 213 | 128 | 89 | 62 | 67 | 87 | 878 |
| 6 year interval | 280 | 222 | 126 | 81 | 82 | 94 | # | 885 |
As shown in Table 2, there is not a significant difference in splitting the corpus by 5 or 6 years. In the following, we will analyse the evolution of titles by EICs and by 6 year interval.
2.2Text analysis process
As the focus of our analysis is the titles published by the journal, we used the Vosviewer package (Van Eck & Waltman, 2010; 2020). VosViewer constructs bibliometric maps taking as input several types of bibliographic units such as authors, journals, keywords or text data from titles and abstracts of documents. In the latter case, significant text units have to be extracted first. For this, VosViewer uses the sentence detection algorithm provided by the Apache OpenNLP library to detect sentences and perform part-of-speech tagging (POS). It then identifies noun phrases (NPs) using surface morphological rules. VosViewer seeks to extract compound NPs, i.e., the longest possible NPs found in a sentence. This ensures that more meaningful text units are preferred over uniterms (one word terms) which tend to be more vague. The software then performs some normalisation (stemming) on the NPs in order to regroup identical terms, i.e., convert plural forms to singular, lower case all letters, remove accents and alphanumeric characters. This has the effect of increasing the occurrence of some NPs (Van Eck & Waltman, 2010; pp. 34-35).
After NP extraction, the analyst has to decide which terms should be kept for the later stages of analysis. To this end, the software allows the analyst to set an occurrence threshold below which terms will not be considered for input into the clustering scheme. Habitually, terms that occur only once (hapax) are excluded. Depending on the corpus characteristics, a higher threshold can be set empirically.
In VosViewer, term occurrences can be counted in two ways: full or binary counting. In the first case, the total occurrences of a term in all the documents is calculated (full counting). In the second case, only the number of documents in which a term occurs is recorded irrespective of how many times the term appeared in each document (binary counting). Notice that in the case of our corpus of titles, the impact of this distinction is minimised given that a term is likely to occur only once in a title, although we cannot rule out the probability that some common terms may occur twice in a title but that probability is low.
We opted for the binary counting since our objective is to identify trends in the publications across time. Hence it was more relevant to highlight topical terms that appeared in many documents which can signal recurring topics. We also set a minimum of 2 occurrences for a term to be considered for further stages of analysis.
The next step is term filtering. To do this, VosViewer calculates a relevance score for each term which is similar to the well known tf.idf score used to select index terms in information retrieval (Salton et al., 1975; Sparck et al., 1984). The rationale is to distinguish topical or domain specific terms from generic terms. The former appear frequently but in a small subset of documents while the latter tend to appear in almost all the documents without informing us about the specific topic of each document and without being domain specific. For instance, words like “analysis”, “system”, “conclusion”, “new method” which are just part of the general vocabulary of academic writing will have a low relevance score while domain specific terms such as “Library” and “Information Science” will receive a higher relevance score and are likely to appear on the maps. By setting a threshold on the relevance score, generic terms and stop words can thus be filtered out of the further steps of clustering. Usually, in clustering endeavours, roughly 40–80% of the terms are filtered out using a combination of (co-)occurrence threshold and term weighting.
Given the small size of our corpus, we decided not to apply the relevance score calculated by VosViewer in order to keep all the terms that met the minimum occurrence of 2 and avoid a massive elimination of terms from the analysis.
2.3Clustering process
The terms selected from the titles with an occurrence of
1. no normalization: this is a raw counting of the number of co-occurrences (generally not recommended),
2. association strength: this computes the strength of co-occurrence of two items in documents, divided by their lone occurrences across the entire corpus. It is formulated as follows: S
3. fractionalization: this option is used for normalising the strength of the links between items. It is considered a set-theoretic measure discussed in Van Eck and Waltman (2009:1640) and Van Eck and Waltman (2020: 21).
4. linlog/modularity: “If this option is selected, normalization is performed in the same way as in the LinLog layout technique and the modularity clustering technique. (Van Eck & Waltman, 2020: 21).
While the software recommends not to use the ‘no normalisation’ option, the visualisation of the maps using any of the other three options did not show significant differences regarding the contents (see below), so we opted for fractionalization (option 3) that normalises the forces of the connections between the nodes.
VosViewer builds non-overlapping clusters, also known as “hard clustering” in the literature, and some terms may not be included in a cluster. Clusters are labeled using cluster numbers and are chosen automatically by the program based on the number of occurrences of the term and the relevance score (Van Eck & Waltman, 2020).
With the processes described in Sections 2.1–2.3 above, we obtained the following characteristics for the three methods of corpus splitting that we tried.
Table 3
Clustering parameters for corpus split by Editor in Chief (EIC)
| Parameters of corpus analysis by Editor-in Chief | EIC 1 (1983–2013) | EIC 2 (2014–2017) | EIC 3 (2018–2019) |
|---|---|---|---|
| Nb of titles | 799 | 51 | 35 |
| Number of terms | 1658 | 177 | 119 |
| Occurrences | Binary | Binary | Binary |
| Min. occ. threshold for terms | 2 | 2 | 2 |
| Items connected | 341 | 18 | 6 |
| Nb of clusters | 17 | 5 | 3 |
| Links | 2294 | 41 | 8 |
| Min strength | 0 | 0 | 0 |
| Min. Cluster size | 1 | 1 | 1 |
When looking at the corpus characteristics by intervals of 5 or 6 years (Tables 3 and 5), the first observable trend is the sharp decline in the productivity of the journal after the first 18 years (1983–2000). The journal published 232 titles in the first five-year period (1983–87) or 280 papers in the first six years (1983–88). By 1998–02 (Table 5) and 2001–2006 (Table 5), these numbers had dropped to 89 (a 62% drop) and 81 (a 72% drop) respectively for the same intervals.
Also, applying a threshold of 2 for minimum occurrence has the effect of reducing the number of terms considered for each period by approximately 80% which is the standard observation in data analysis studies: about 80% of the initial items are filtered out in some way or the other using occurrence or co-occurrence thresholds and do not appear on the final visualisations produced. Only about 20% of the data or less end up on the maps. For instance in Table 3 (corpus analysed by EICs), we went from a total
Table 4
Clustering parameters for corpus split by interval of 5 years
Table 5
Clustering parameters for corpus split by interval of 6 years
of 1658 extracted terms for EIC 1 to 341 terms which met the 2 occurrence threshold and furthermore co-occurred with other terms in that period covered by EIC. We will return to the impact of this feature reduction in the discussion section.
2.4Building the maps
VosViewer offers different types of maps for viewing links in a co-occurrence matrix: network, overlay and density (Van Eck and Waltman 2020). The network view represents items by their label and by a circle the size of which reflects the weight of the item. As the display tries to avoid overlapping labels, the labels of some items may not be displayed. The colour of an item is determined by the cluster to which it belongs. Links are materialised as lines between items. The overlay visualization is similar to the network visualization save that items are colored differently. The density view has two variants: item density and cluster density. The item density is similar to the network and the overlay view except for the background colour and the absence of links. This view is more akin to heatmaps. The cluster density view is available only if items have been assigned to clusters. It is similar to the item density view except that the background colours enable an easier identification of items belonging to a cluster. In essence, VosViewer offers either an intuitive view of relations between items (label view) or the density view/cluster density view if the focus is on the structure of the corpus (i.e., on the importance of an item).
VosViewer offers further parameters to display the maps of which we mention attraction and repulsion since they influence the way in which items are located in a map by the VOS layout technique. We selected the values of attraction 6 and a repulsion value of 1 for a best visualization of the terms and their connections. For more details on these options, see Van Eck and Waltman (2020: 21).
3.Results
In the following sections, using the cluster density view, we will analyse the maps of titles obtained by Editor-in-chief (EICs) and by six-year interval.
3.1Evolution of topics by Editor-in-Chief (EIC)
We recall that the journal has had three EICs since its creation and that we split the corpus along these lines (see Tables 1 and 3 above for details of the corpus parameters per EIC). The first EIC’s mandate covered the period from 1983–2013 (30 years), EIC2 covered the period 2014–2017 (3 years) while EIC 3 only had 1 year at the time of corpus collection (2018–2019).
Figures 1–3 respectively display the prominent terms from the titles published by the three EICs.
EIC 1 published 799 titles yielding 1658 terms out of which only 341 (20%) met the occurrence threshold of 2 and were connected and thus went on to the mapping stage. In the map, terms belonging to the same cluster bear the same colour. Hence in the above map, terms such as “education, conflict and report” are part of the largest cluster with 52 terms. The terms such as “india, botswana, implication, lecturer, past” belong to the second biggest cluster with 39 terms.
Table 6
The top 10 terms by order of frequency in titles published by EIC 1 (1983–2013)
| id | Term | Occurrences | Relevance score |
|---|---|---|---|
| 171 | Library | 127 | 0.0726 |
| 85 | Education | 89 | 0.1277 |
| 117 | Information | 56 | 0.1478 |
| 320 | Training | 51 | 0.2101 |
| 129 | Information science | 48 | 0.0999 |
| 170 | Librarianship | 39 | 0.2432 |
| 169 | Librarian | 37 | 0.3942 |
| 133 | Information science education | 32 | 0.2336 |
| 305 | Student | 31 | 0.1982 |
| 328 | University | 31 | 0.178 |
Figure 1.
Map of terms in titles published during EIC1 (1983–2013).
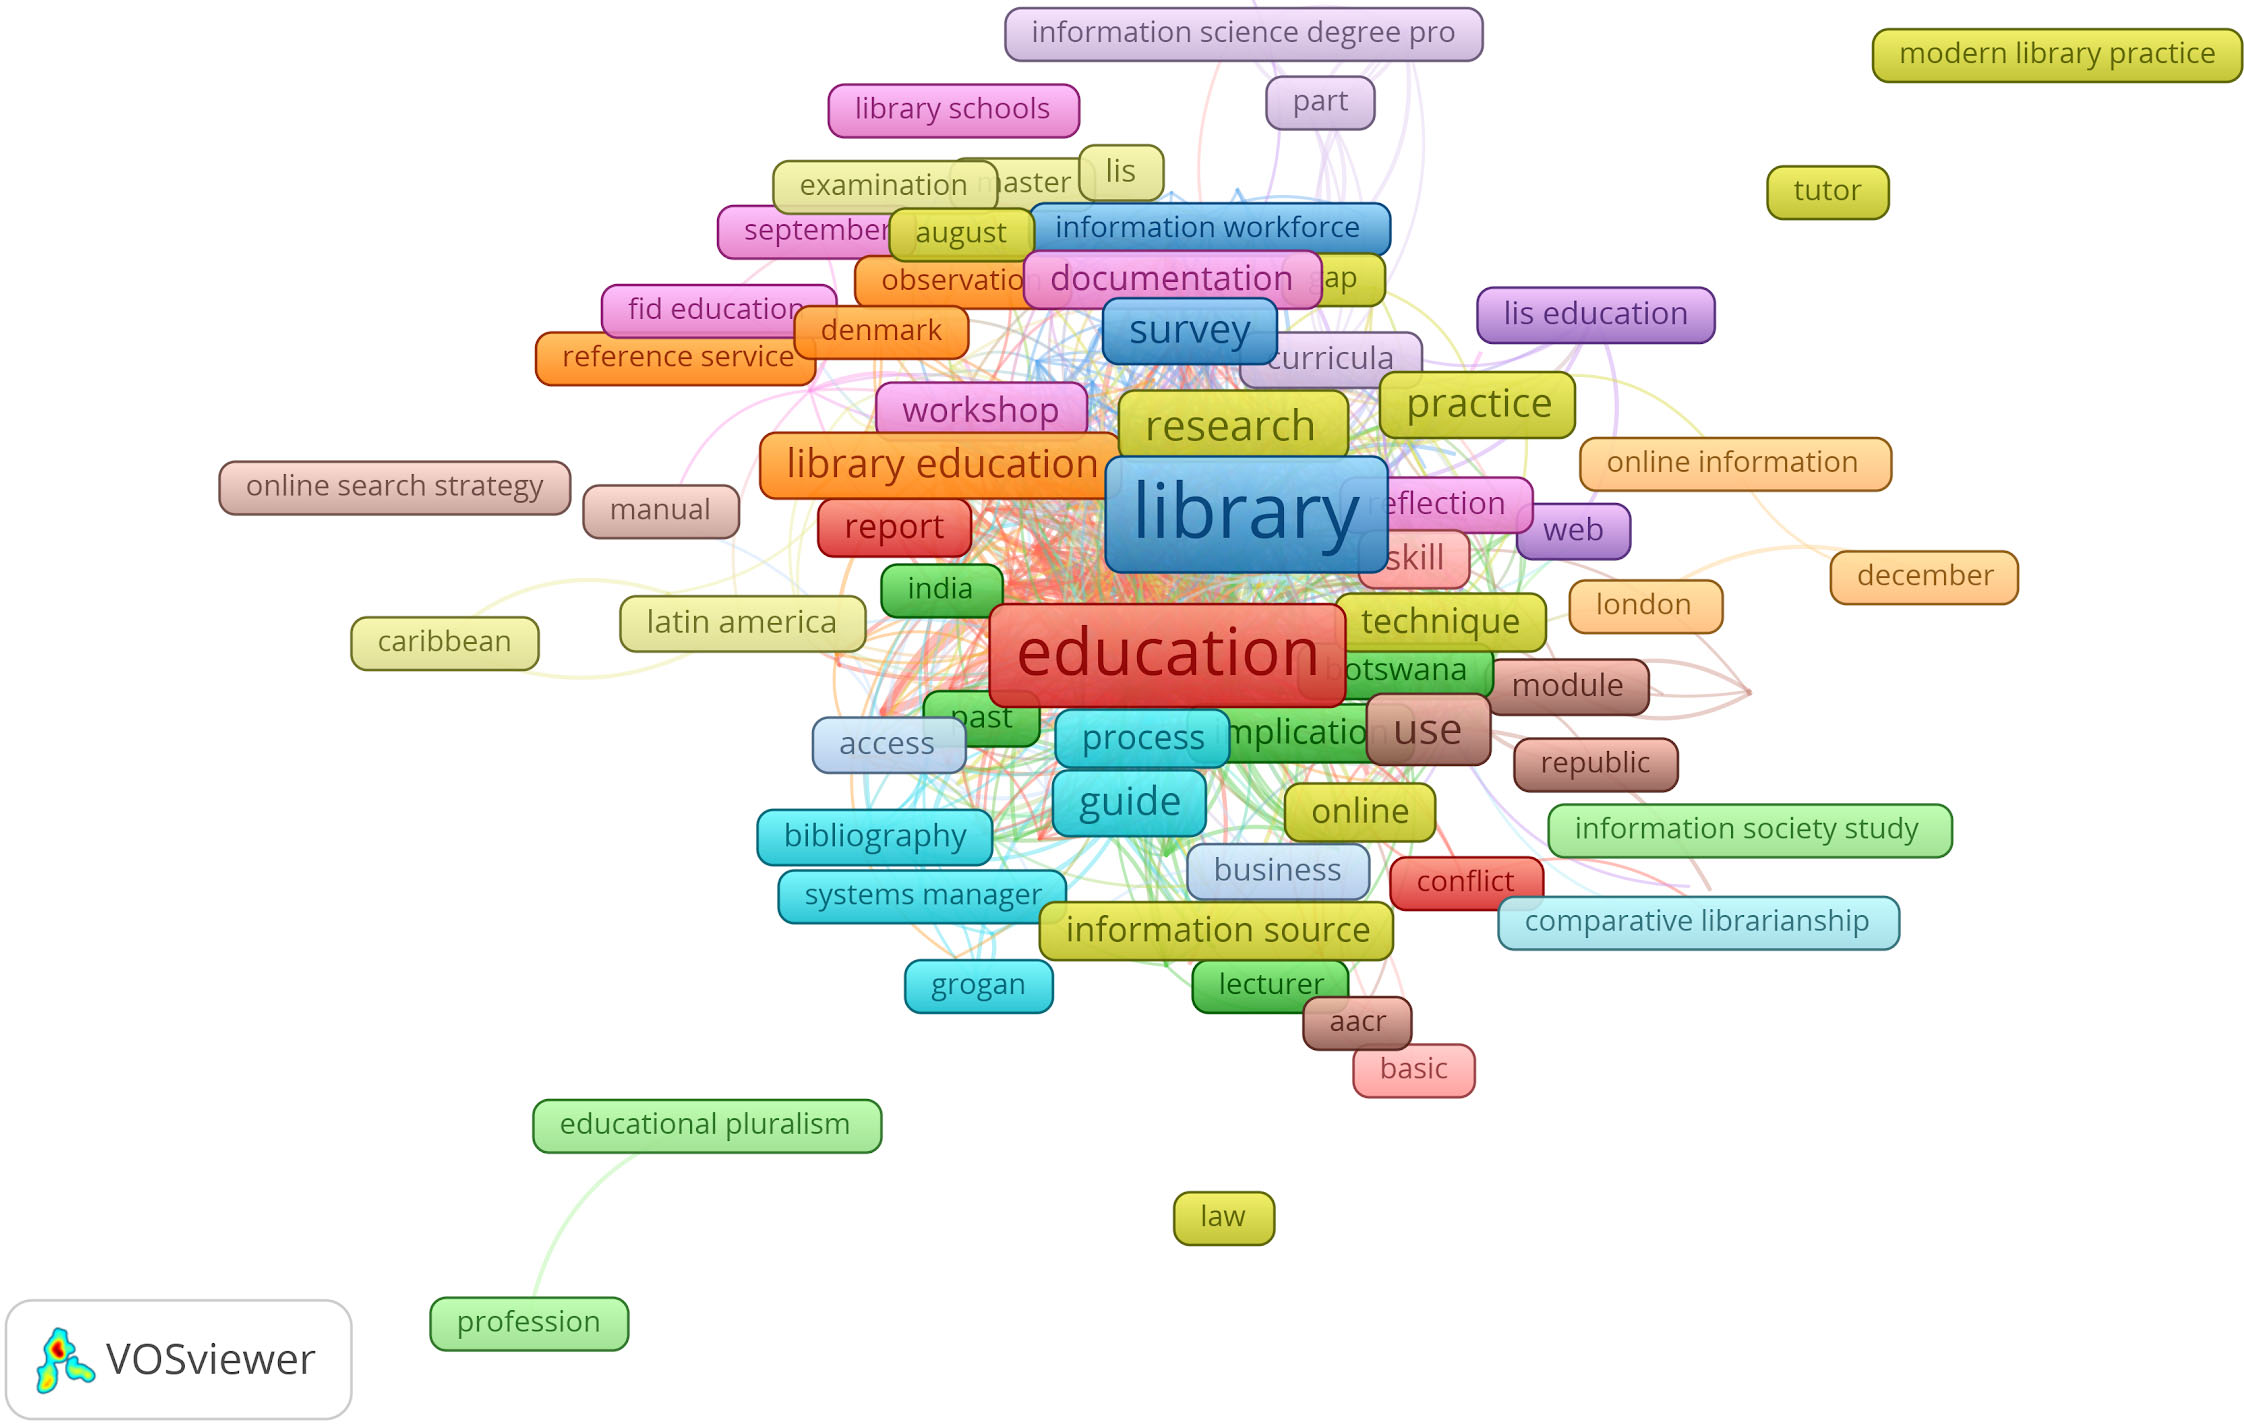
The titles published during the first 30 years of EIC 1’s mandate showed a focus on traditional core topics in LIS as evidenced by the size of the terms “education”, “library” and the recurrence of terms evoking library education and institutions such as “library education, bibliography, library schools, reference service, aacr, information source, documentation, information science degree programme, online information, lis education, fid education, research, practice, comparative librarianship”. We also observe the presence of terms such as “latin america, caribbean, botswana, india, denmark, london” which seem to point to the geographic locations concerned by some of the publications.
The maps obtained for EICs 2 and 3 are understandably much sparser as their periods of mandate were much shorter. The occurrence threshold of 2 resulted in the elimination of 90% of the terms contained in the 51 titles published by EIC 2, hence only 18 out of the 177 terms extracted from titles were used for mapping.
Figure 2.
Map of terms in titles published during EIC2’s mandate (2014–2017).
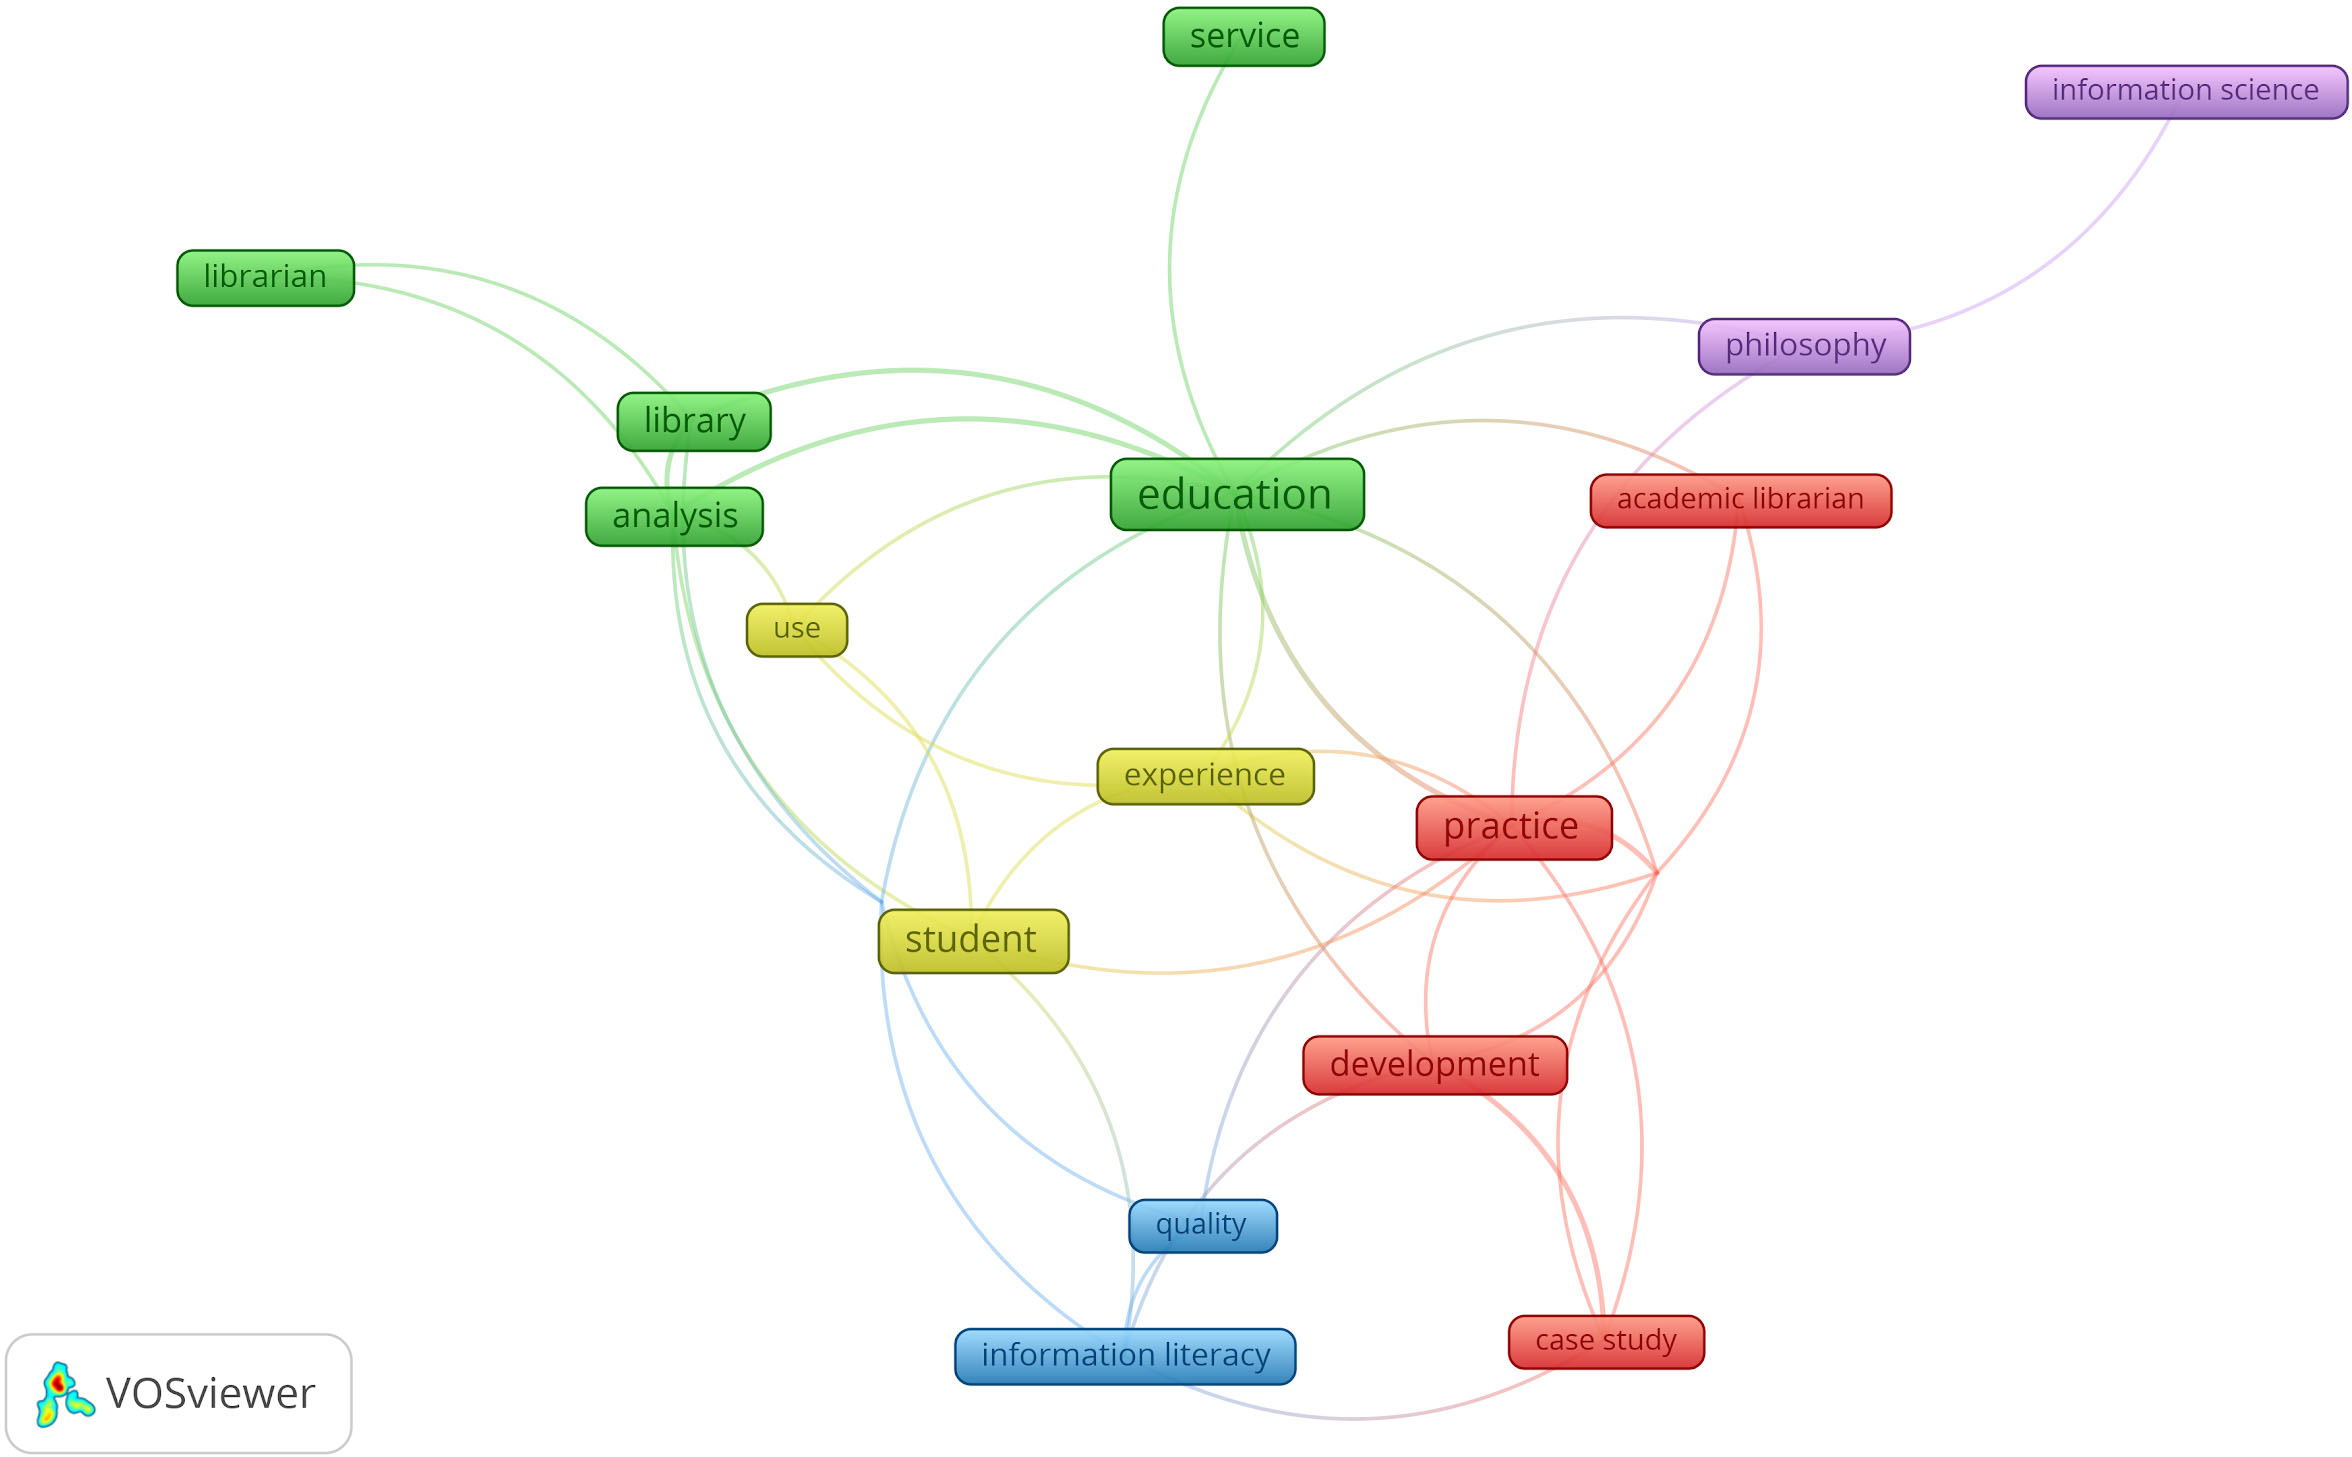
In the period covered by EIC 2, the focus of publications seems to remain on the core issues of education in LIS as evidenced by the terms “education, library, librarian, analysis, service” which belong to the same cluster and the terms “academic librarian, practice, case study, development” in a second cluster. Other terms seem focused on issues of “quality, assessment, information literacy” and student and user experience. The presence of the term “philosophy” is explained by a special issue of the journal on “philosophy of information” published in 2017 (issue 33, number 1), unfortunately, not extracted as a multiword by VoSviewer. Table 7 below shows the top 10 terms by order of frequency in this period, all of which appeared on the map.
Table 7
The top 10 terms by order of frequency in titles published by EIC 2 (2014–17)
| 100% with 2 occurrences | |||
|---|---|---|---|
| Id | Term | Occurrences | Relevance score |
| 7 | Education | 12 | 0.2963 |
| 14 | Practice | 6 | 0.4225 |
| 17 | Student | 6 | 0.5444 |
| 2 | Analysis | 5 | 0.7151 |
| 6 | Development | 4 | 0.6411 |
| 12 | Library | 4 | 0.8355 |
| 16 | Service | 4 | 1.307 |
| 5 | Community | 3 | 0.4605 |
| 8 | Experience | 3 | 0.3759 |
| 9 | Information literacy | 3 | 0.8427 |
Figure 3.
Map of terms in titles published during EIC3 (2018–2019).
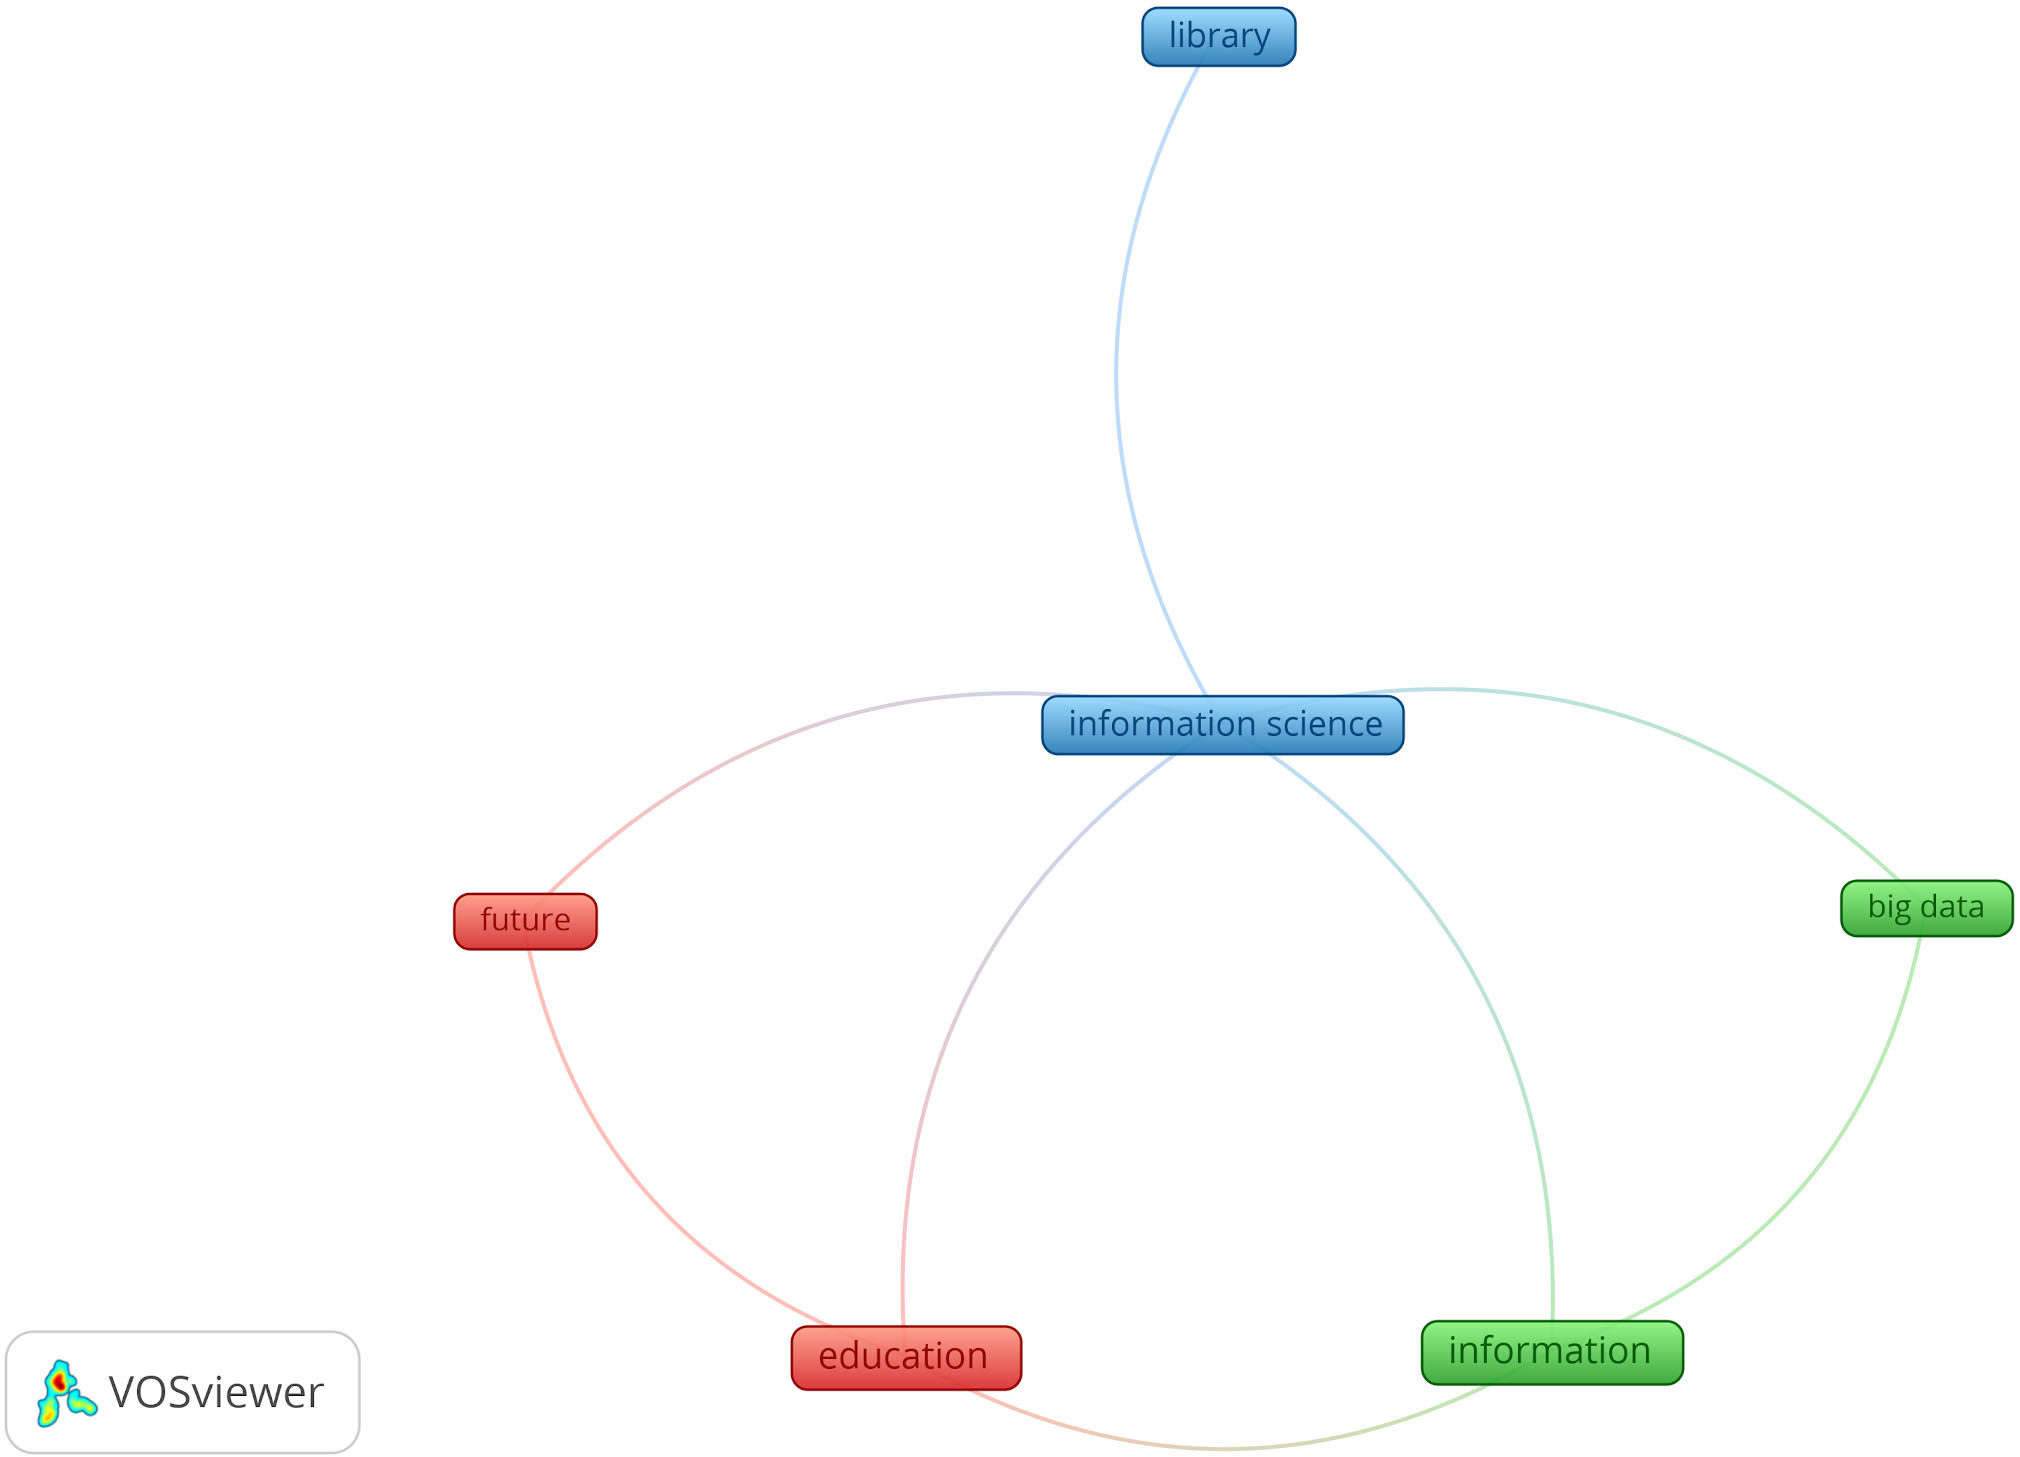
Table 8
Top 10 terms by frequency extracted from titles published by EIC 3 (2018–2019)
| 100% with 2 occurrences | |||
|---|---|---|---|
| Id | Term | Occurrences | Relevance score |
| 2 | Education | 5 | 0.6743 |
| 5 | Information | 5 | 0.6743 |
| 7 | Library | 4 | 0.952 |
| 6 | Information science | 3 | 0.7002 |
|
Table 8, continued | |||
|---|---|---|---|
| 100% with 2 occurrences | |||
| Id | Term | Occurrences | Relevance score |
| 1 | Big data | 2 | 0.6922 |
| 3 | Future | 2 | 0.6922 |
| 4 | Impact | 2 | 3.012 |
| 8 | Literature review | 2 | 3.012 |
| 9 | Mixed methods approach | 2 | 0.8636 |
| 10 | Online consumer health information | 2 | |
Like for EIC2, 95% of the terms extracted from 35 titles published by EIC 3 were eliminated by the occurrence threshold of 2, thus only 6 out of 119 terms were left for the clustering process. While this map is not relevant because of the sparse data, it is noticeable to see the terms such as “big data” appear on the map. This could signal a shift of focus to more technologically current topics.
In the next section, we will analyse the maps obtained by splitting the corpus of titles by interval of six years which should yield a less skewed distribution of terms and thus a more balanced representation of the evolution of topics published by this journal.
3.2Evolution of topics by six years interval
Table 9 below shows the top 10 terms in each period ranked by decreasing order of frequency for each period.
Table 9
The top 10 terms by frequency in the six periods
| Rank | 1983–88 | 1989–94 | 1995–2000 | 2001–06 | 2007–12 | 2013–19 |
|---|---|---|---|---|---|---|
| 1 | Library | Library | Library | Library | Library | Education |
| 2 | Education | Training | Education | Education | Education | Library |
| 3 | Information science | Information | Information | Information | Development | Practice |
| 4 | Training | Librarian | Study | Information science | Practice | Student |
| 5 | Librarian | Information science | Training | Student | Lis education | Analysis |
| 6 | Information | Librarianship | Student | Information science education | Perspective | Development |
| 7 | Management | Development | Issue | University | Study | Information |
| 8 | Research | Student | Library education | Experience | Approach | Community |
| 9 | Information work | University | Internet | School | Examination | Experience |
| 10 | Case study | Guide | Perspective | Communication technology | Information education | Impact |
The prevalence of terms such as “library, librarian, librarianship, education, library education, lis education/information science education, university, student, experience, practice” reflect the core themes of the journal. Another group of terms on “information science, information, communication technology” appear to reflect the newer strand of publications on more emergent topics which will eventually displace traditional library science in many institutions all over the world.
Below, we will analyse the six maps were produced for each period, each showing the prominent terms that co-occurred more than twice in titles published during that period.
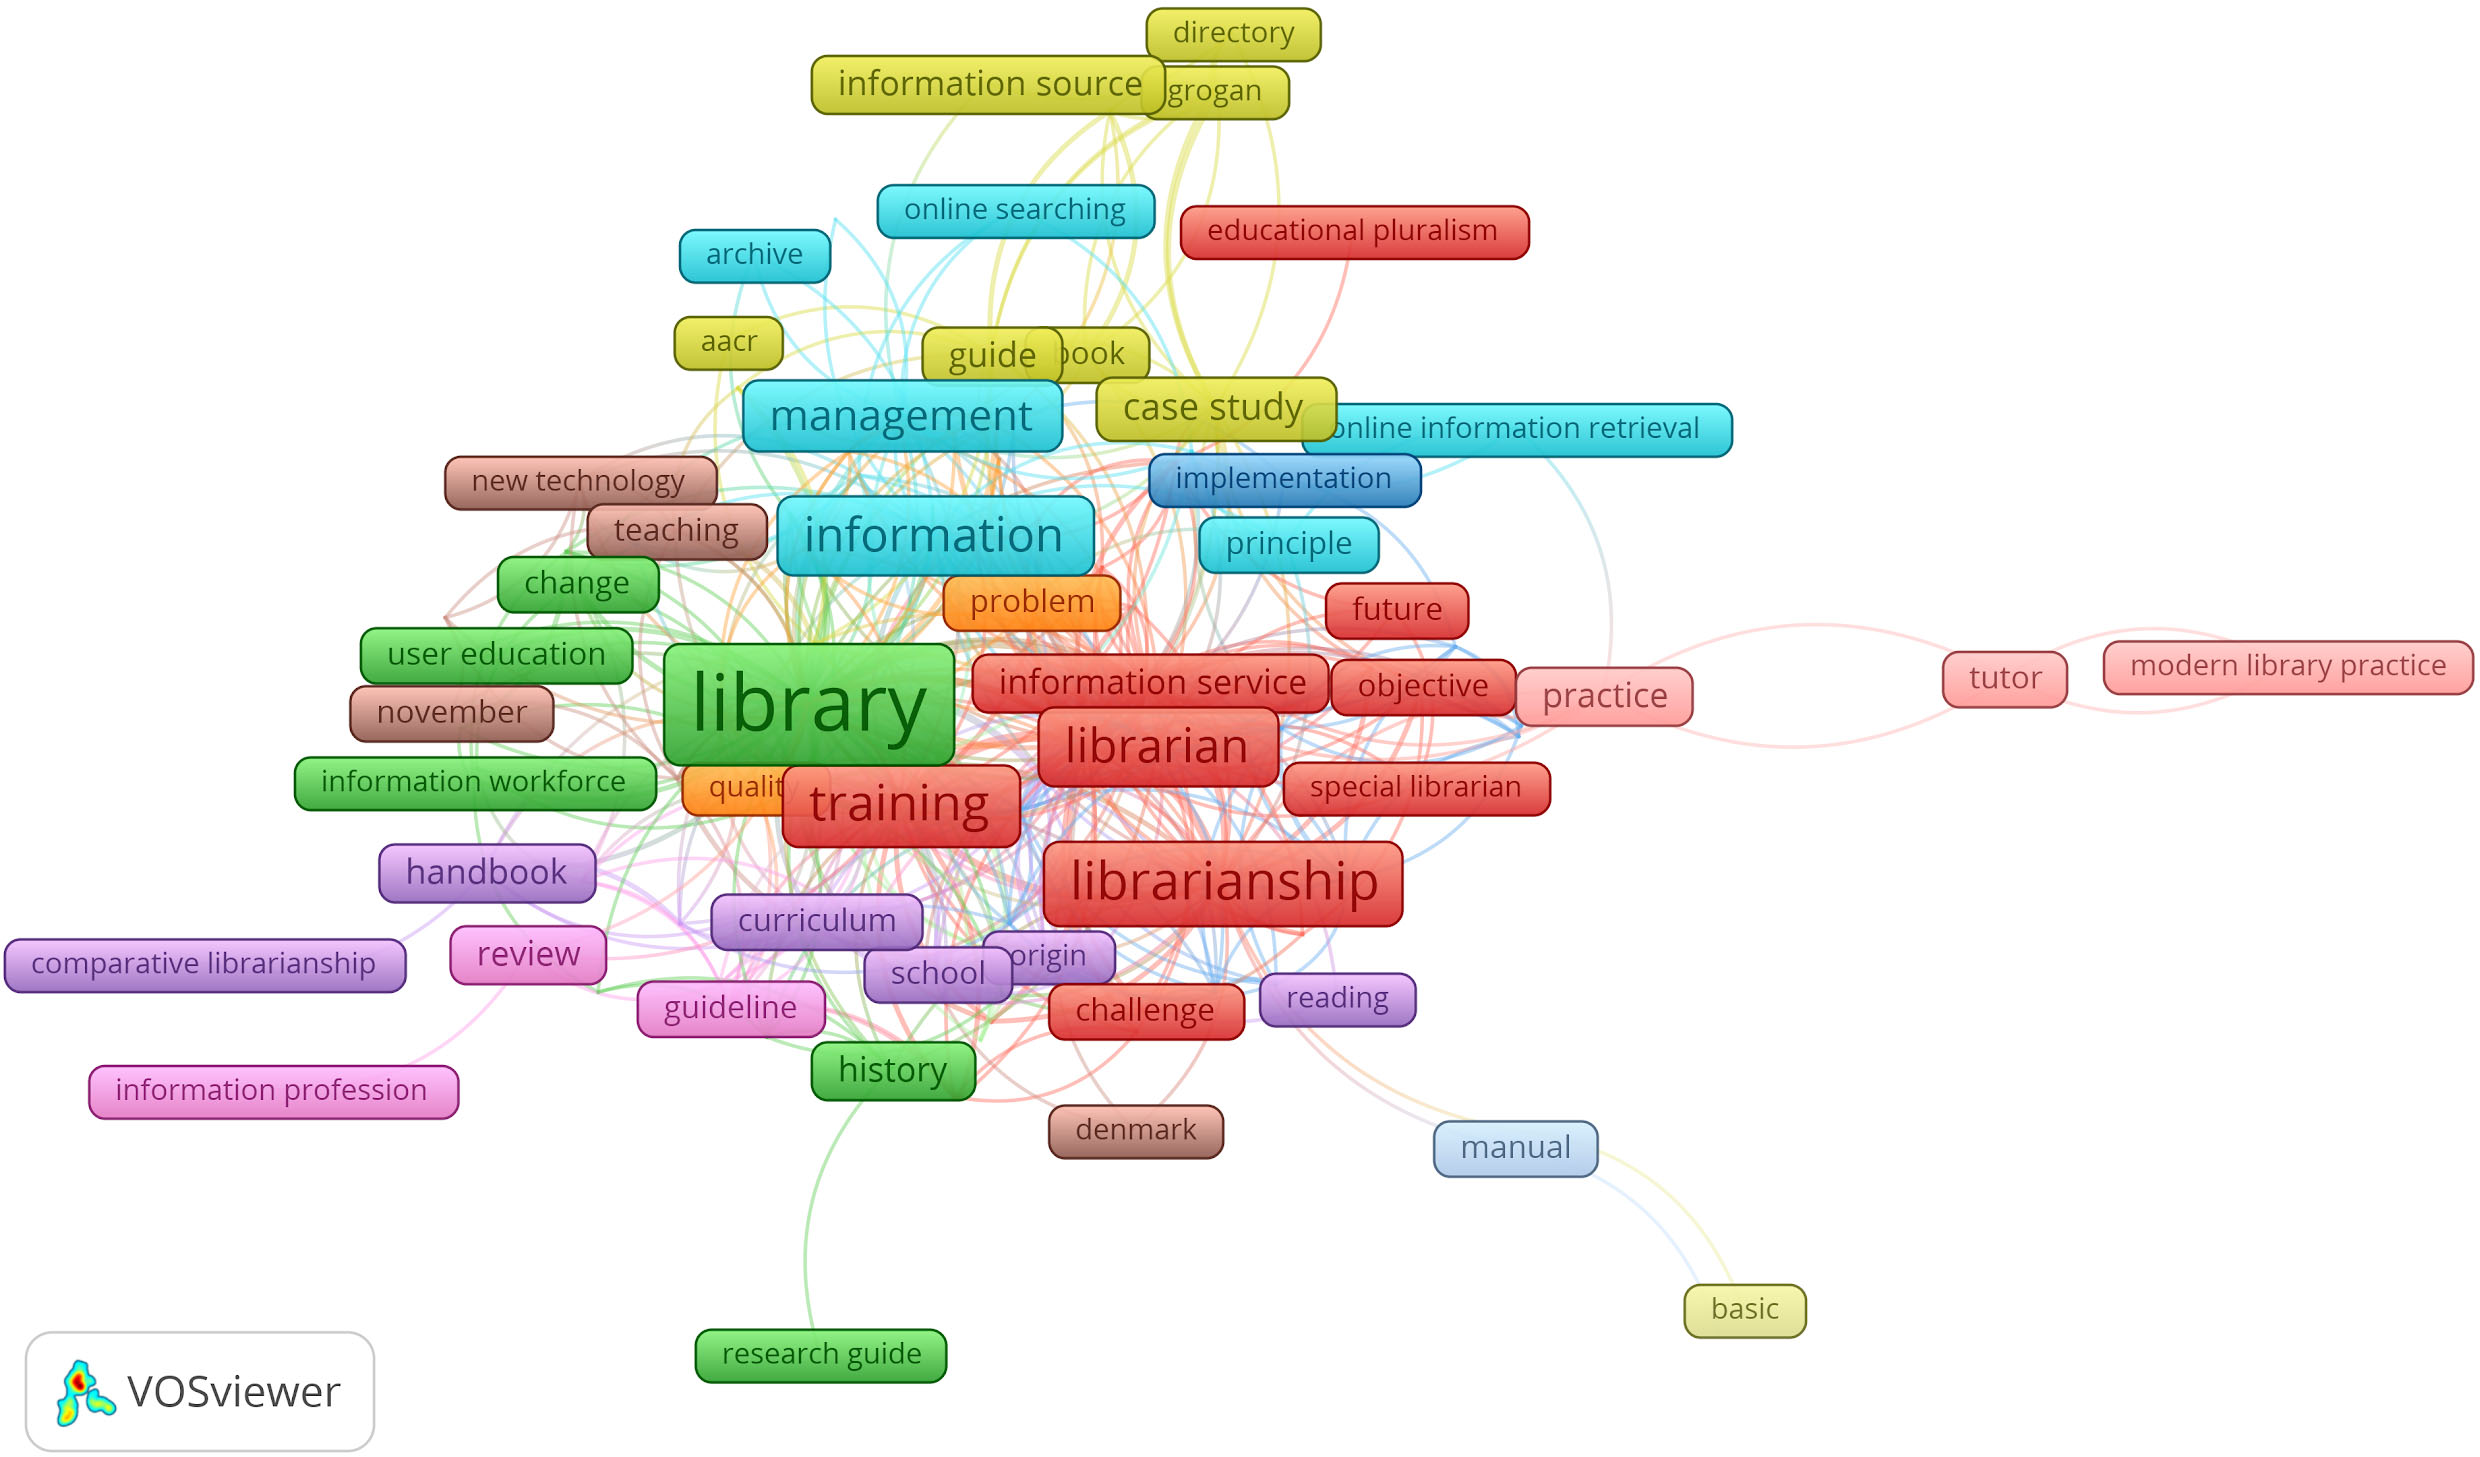
3.2.1Period 1: 1983–88
Figure 4 below displays the prominent terms in clusters. The topics in this first period are solidly centred on the core themes of the journal, i.e. library training as evidenced by the prominence of terms in the cluster “librarianship, librarian, training, information service, special librarian, educational pluralism, challenge, objective”.
Another group of clusters appear to reflect publications on library services to users as evidenced by the presence of the terms like “library, information workforce, user education, history, research guide change” while the blue cluster reflects publications on online search which was emerging at the time as evidenced by the terms “information management, principle, future, online information retrieval, online searching, archive”. The terms “curriculum, handbook, school, origin, comparative librarianship, reading” focus on the actual education materials. The term “denmark” co-occurred with “new technology, teaching, november” in a cluster, thus suggesting publications on new teaching methods deployed in that country at the time. This map of this first period retained most of the topics that appeared on the map by EIC 1 (see Fig. 1 above).
Figure 4.
Map of prominent topics in 1983–1988.
3.2.2Period 2: 1989–94
Figure 5 below displays the prominent terms appearing in clusters which show continued focus on the core topics of the journal such as “information education, information technology, information service, librarian/library, science and technology”. All these topics appeared in EIC 1’s map (Fig. 1 above).
Figure 5.
Map of prominent topics in 1989–1994.
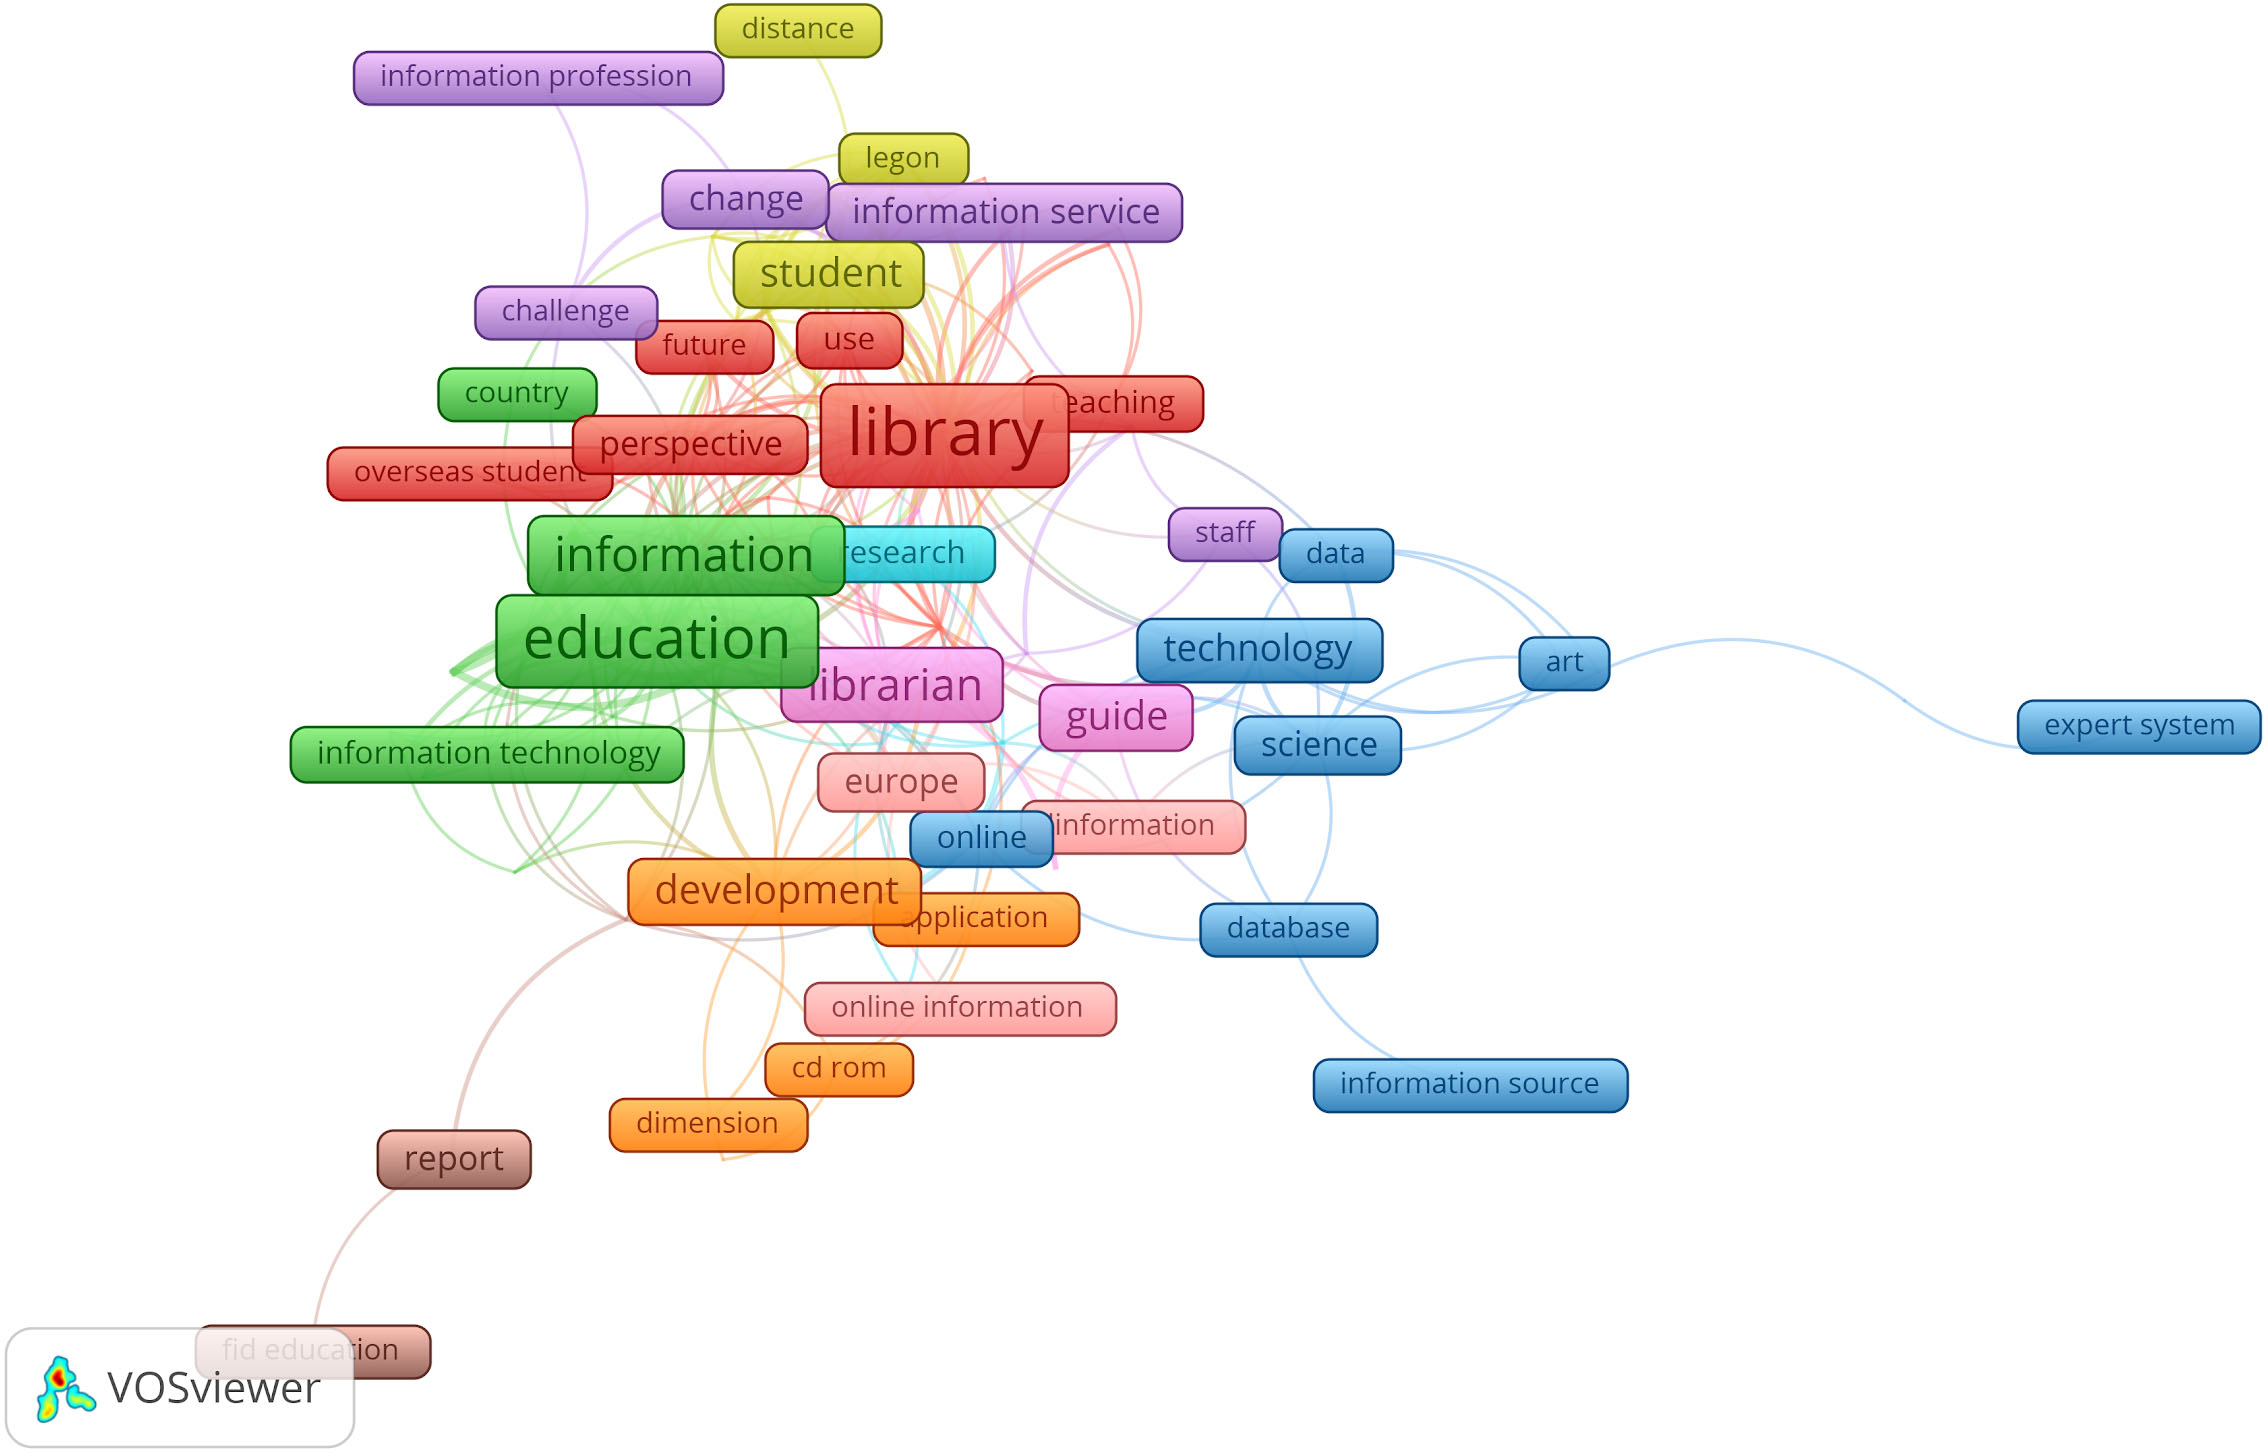
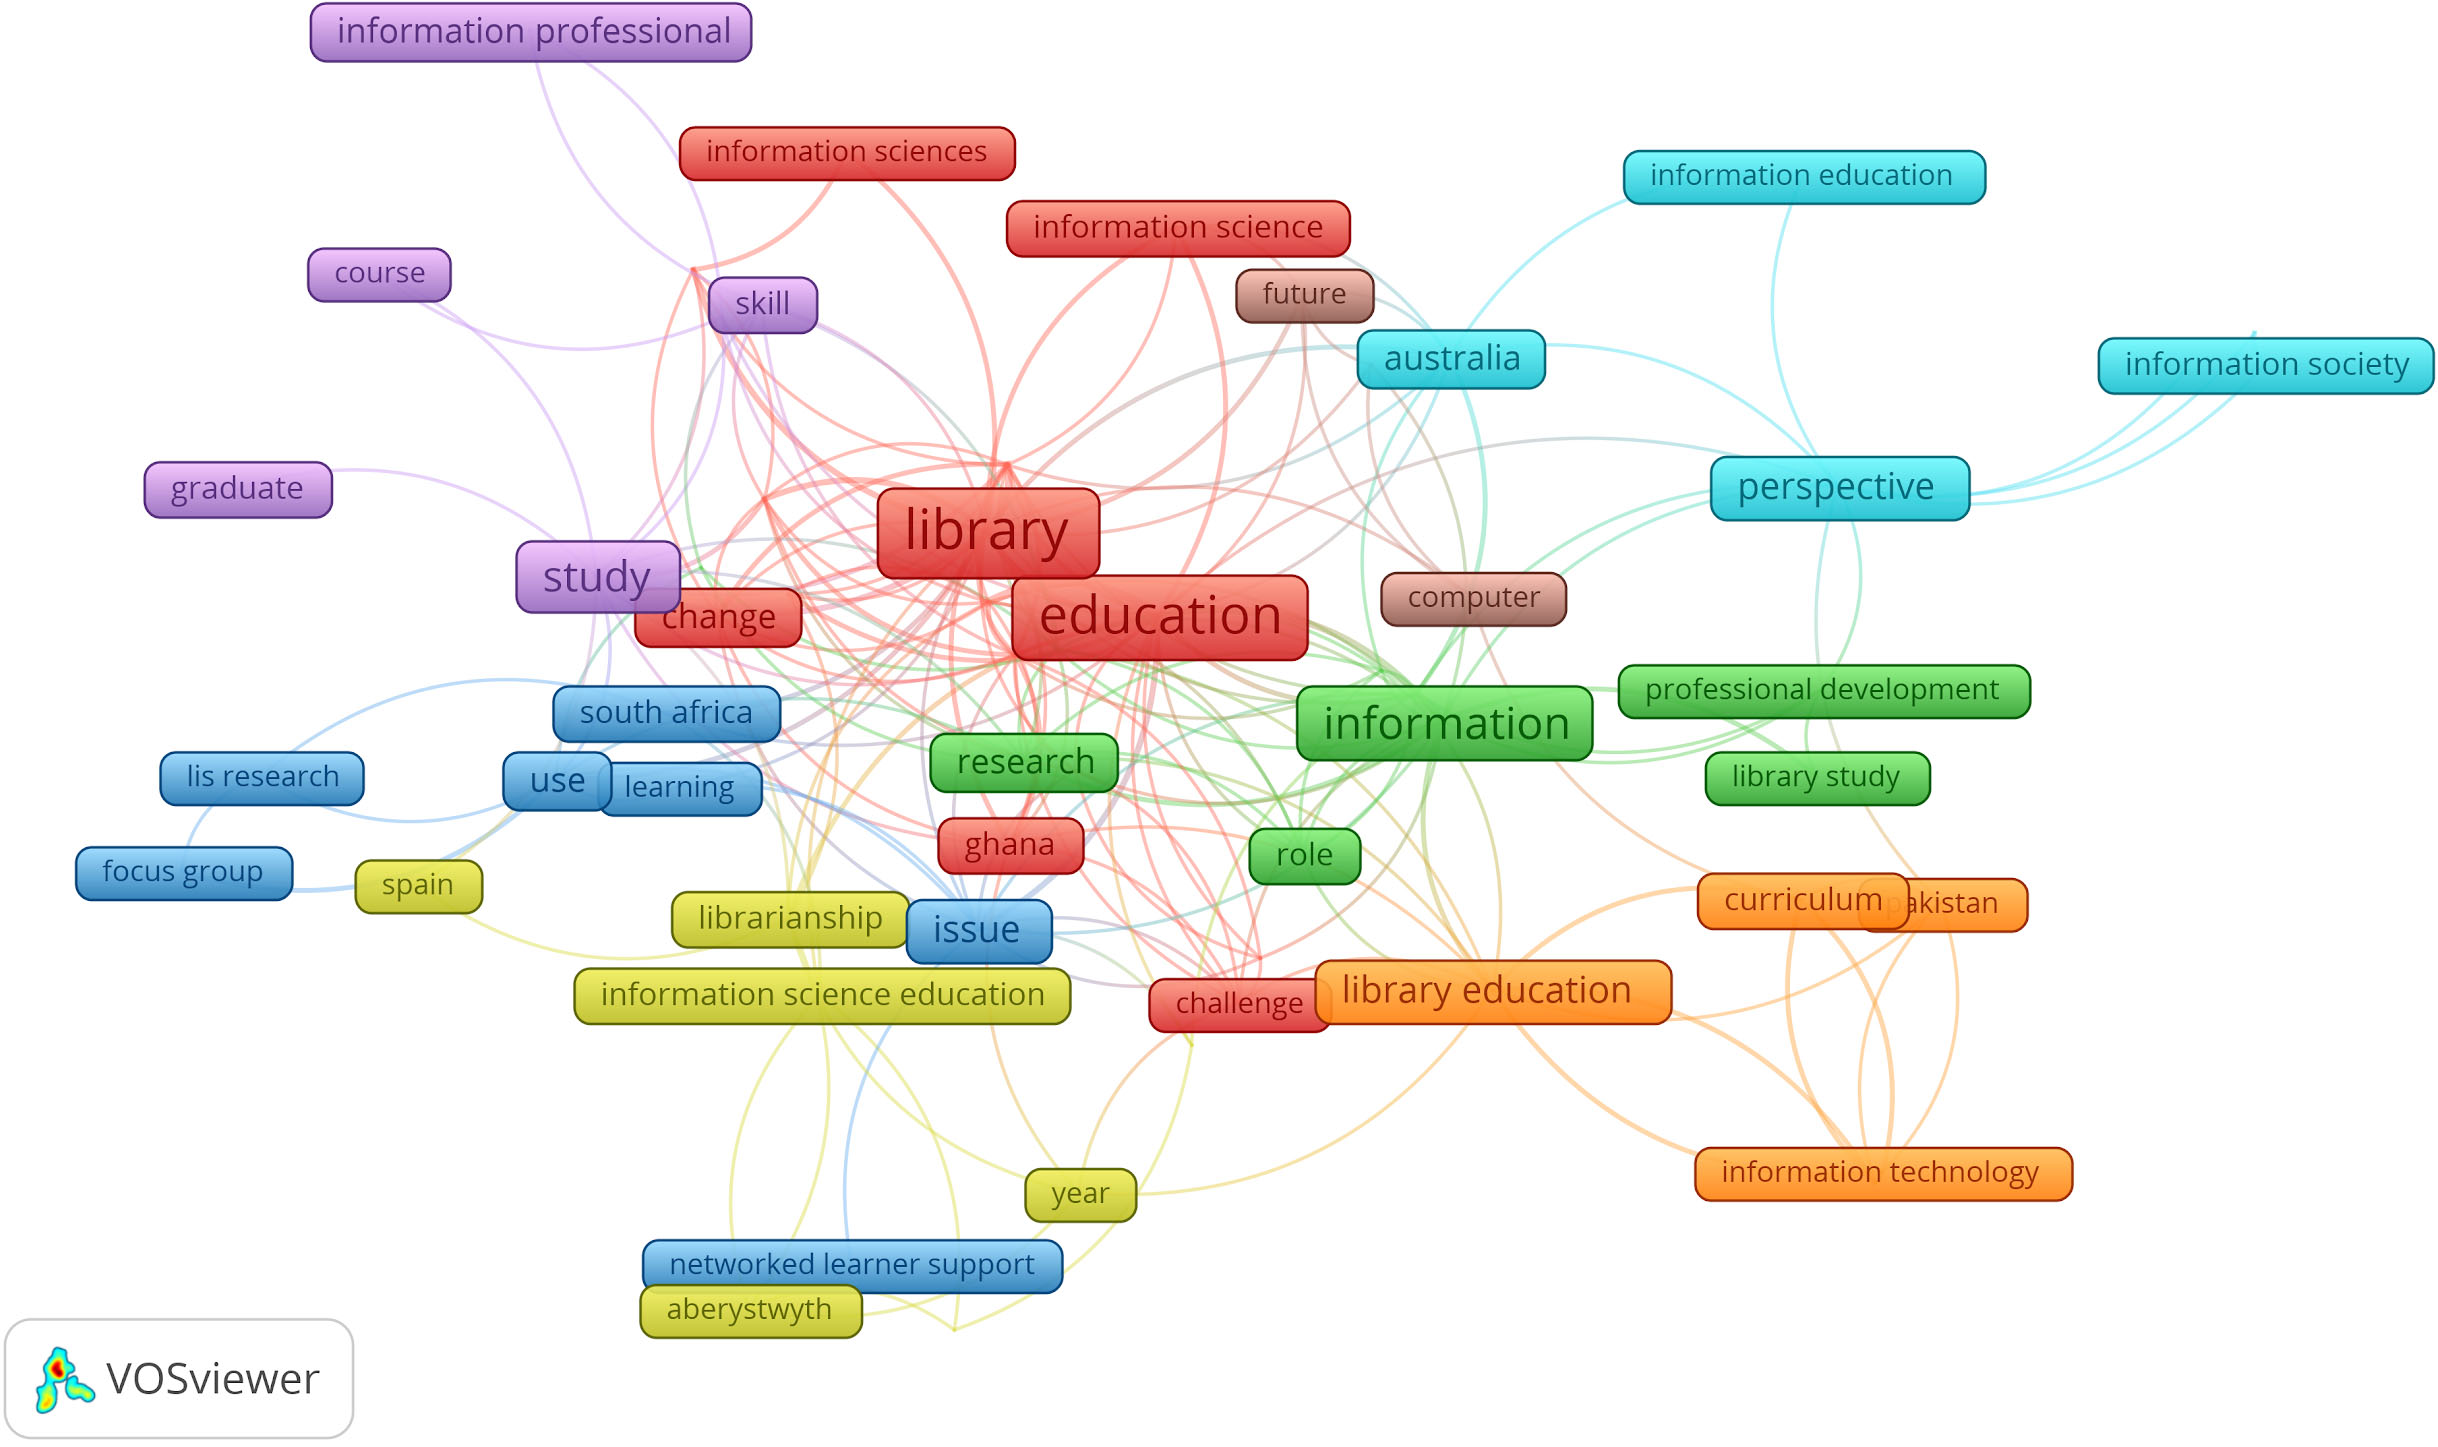
Figure 6.
Map of prominent topics in 1995–2000.
3.2.3Period 3: 1995–2000
While the traditional topics of library education identified in periods 1 and 2 continue to be prominent here, more publications appeared on “information science” and “information professional” in this period (Fig. 6). Terms reflecting the geographic locations concerned by the publications also appeared prominently as evidenced by the presence of terms such as “aberystwyth” and “spain” are linked to the “information science education” cluster, while “australia” is associated to the “information society, information education, perspective” cluster.
3.2.4Period 4: 2001–06
The first noticeable difference with maps in the previous 3 periods is the sharp drop in the number of published titles for the same interval of years. The journal went from 280 titles in period 1 to 81 titles in period 4 (thus a 72% fall). Hence it is unsurprising that from this date, the maps became more and more sparse. The topics observed for this period continue some of the trends already observed in the preceding periods (see Fig. 7 hereafter). The terms “library, education, information, information literacy, information professional” are still prevalent. Terms reflecting the geographic locations concerned by the publications also appeared prominently: “africa” is part of the “information” cluster, while “botswana” is in the “information professional, information literacy” cluster, “latin america, caribbean” are correctly placed in the same cluster. Both terms appeared in an article with the title “Management education in Latin America and the Caribbean”.
Figure 7.
Map of prominent topics in 2001–2006.
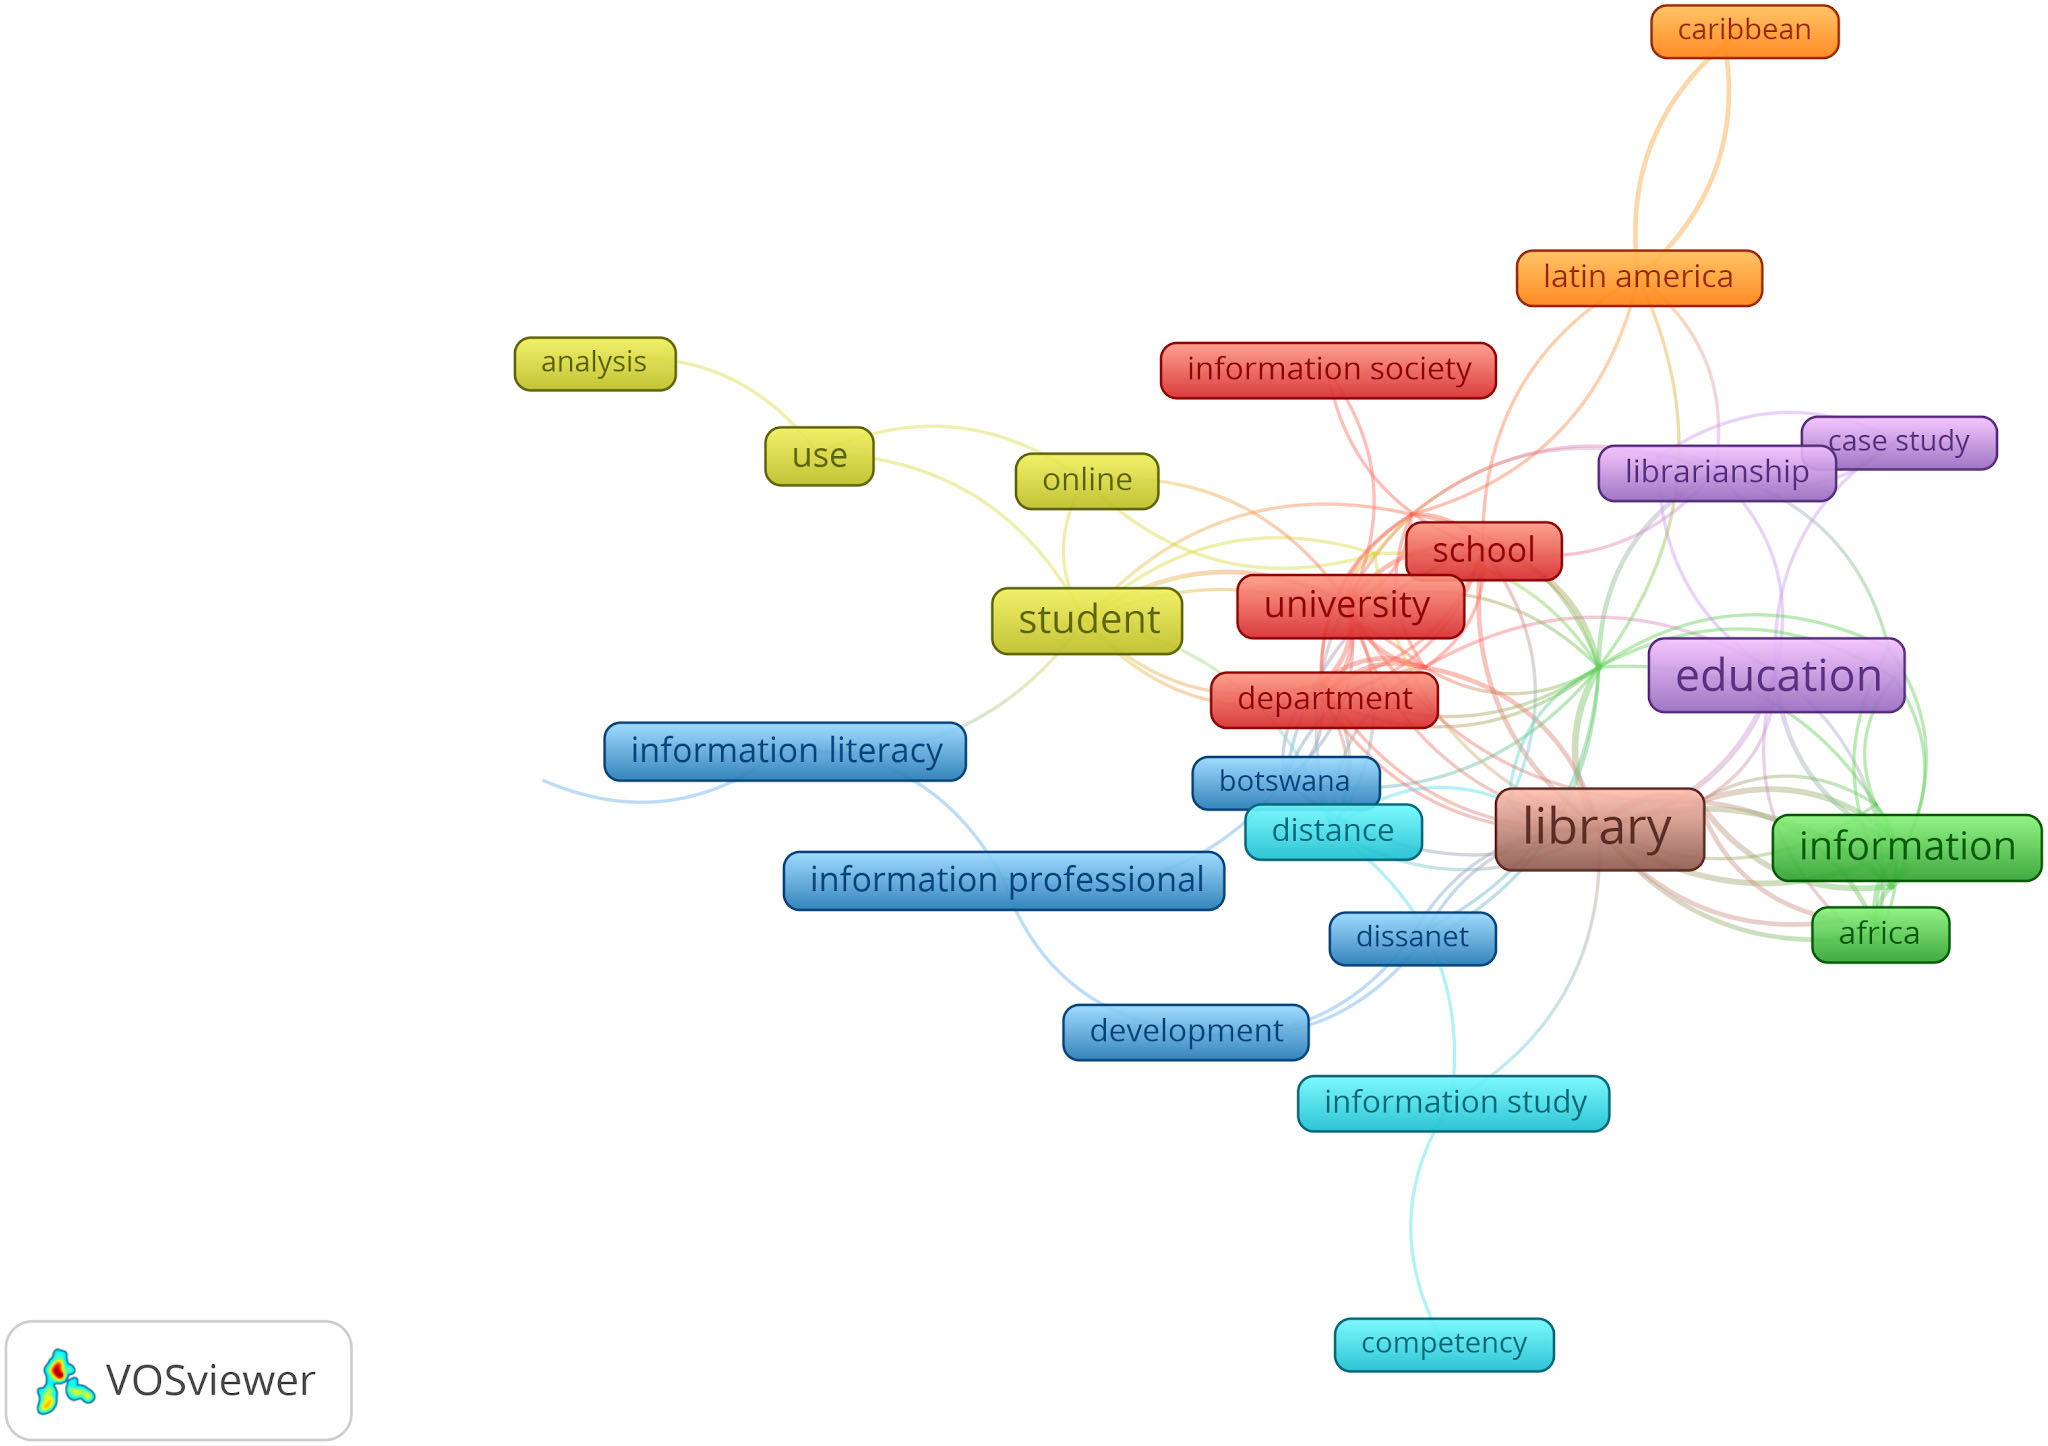
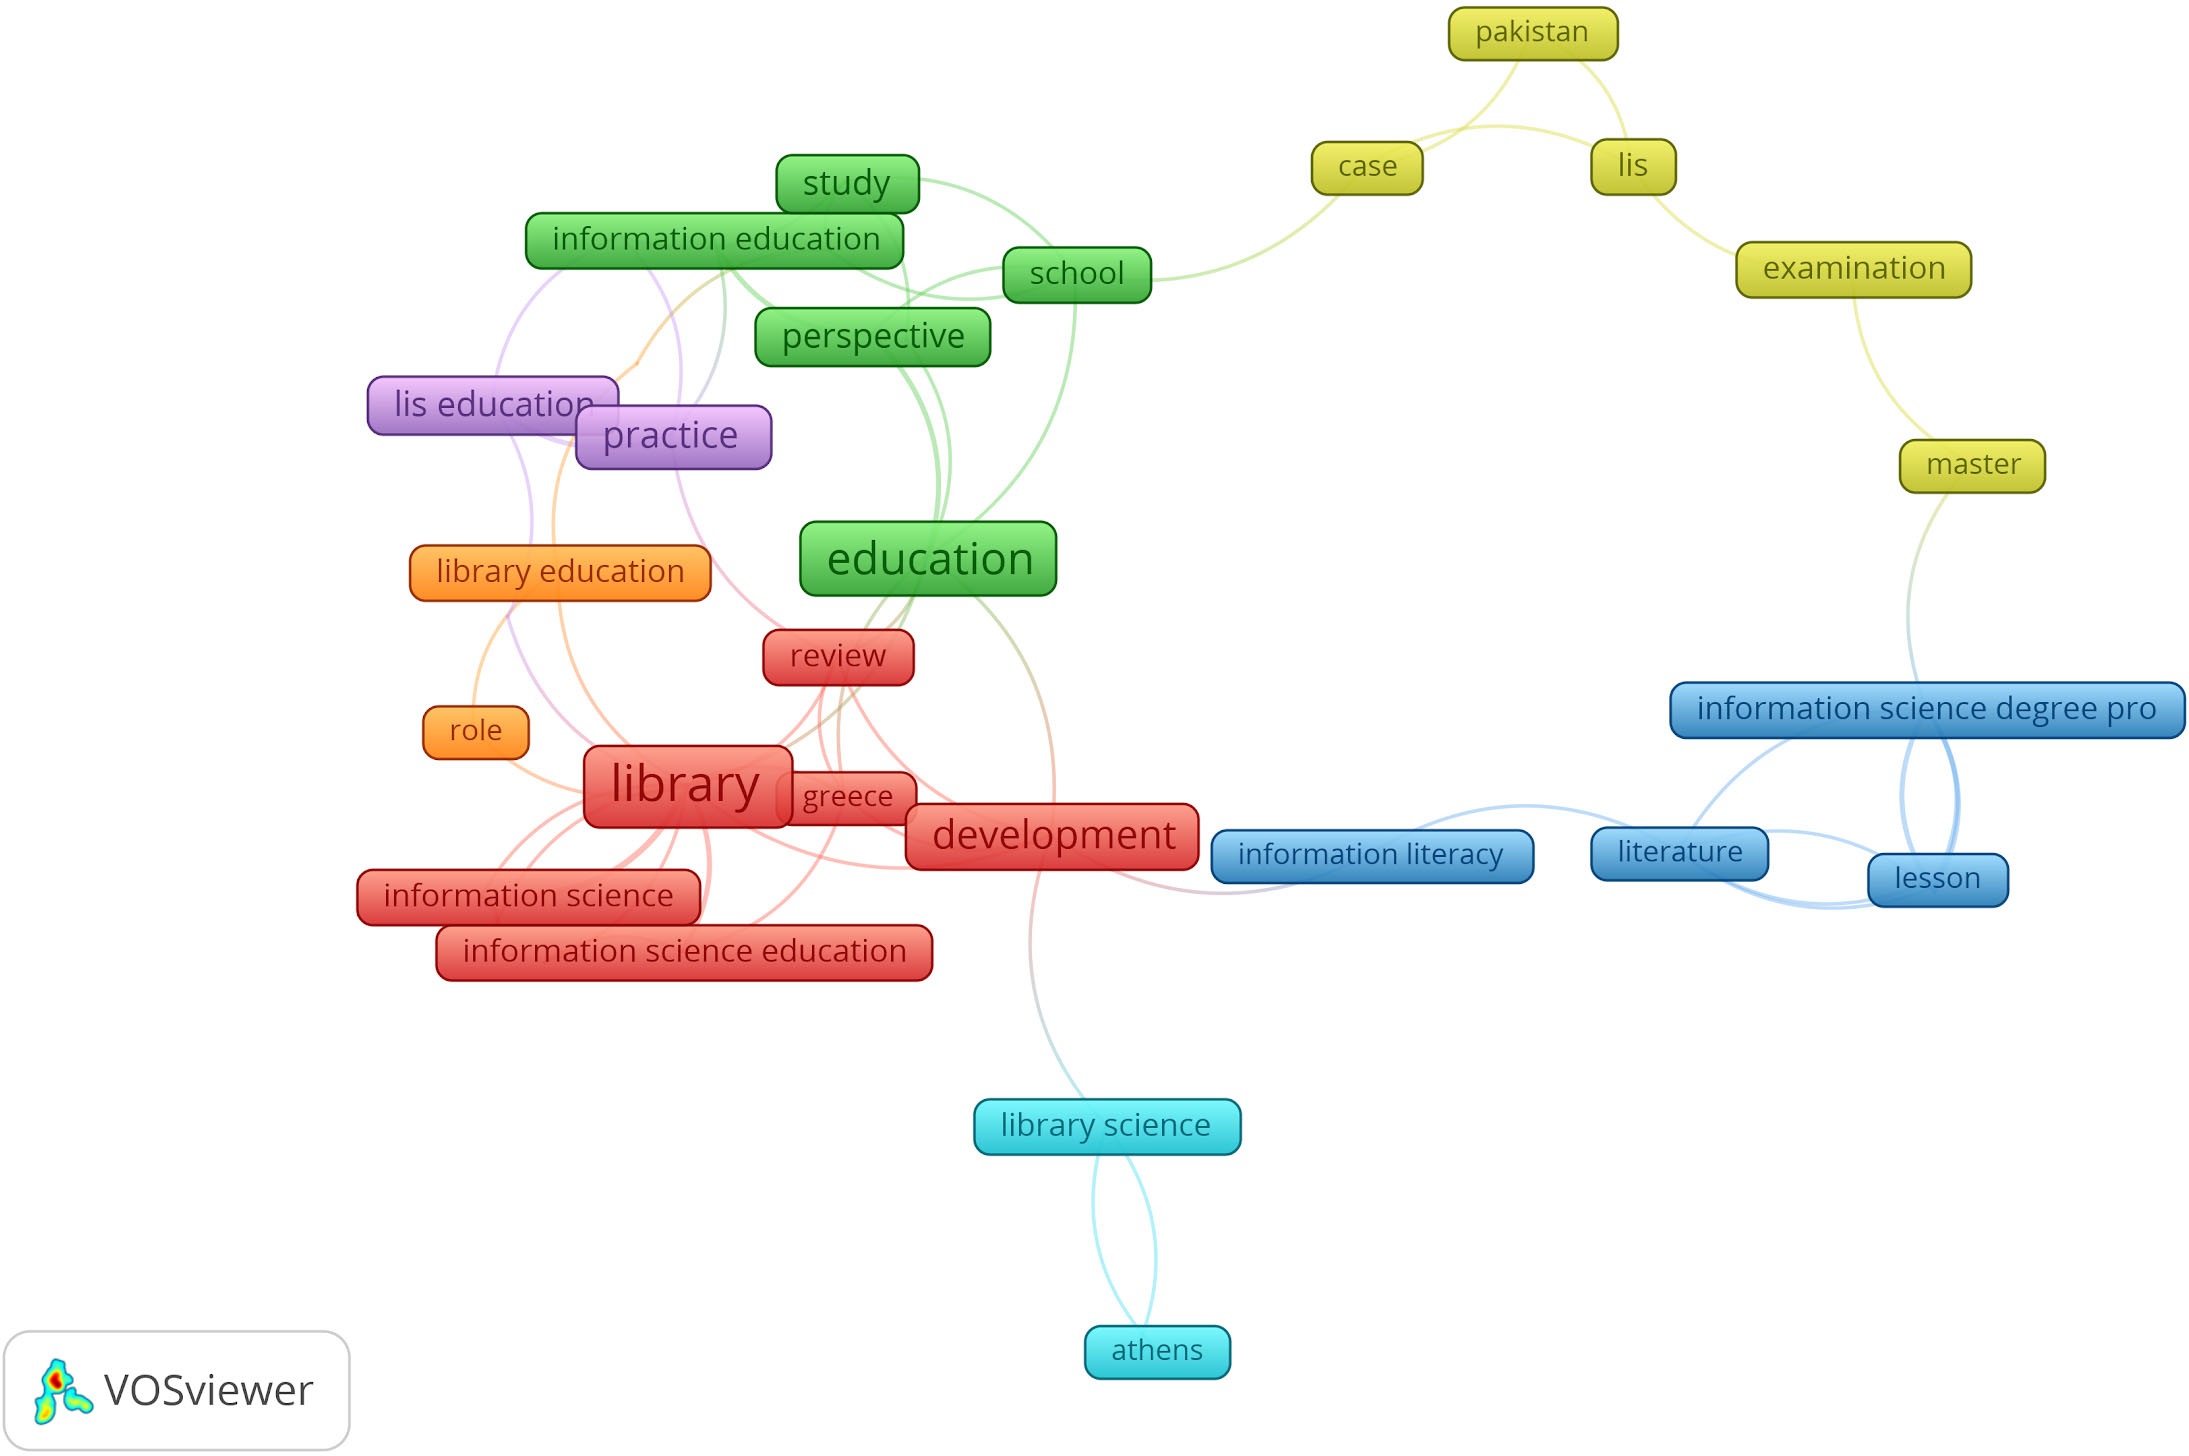
Figure 8.
Map of prominent topics in 2007–2012.
3.2.5Period 5: 2007–12
The topics in this period continue to reflect the core topics of the journal also perceptible in EIC1’s map as evidenced by the terms “library, education, information science education, lis education, information education, information literacy, library science” and some of the places where these studies were focused “greece, athens, pakistan”. The presence of Greece is explained by a special issue on LIS education in that country.
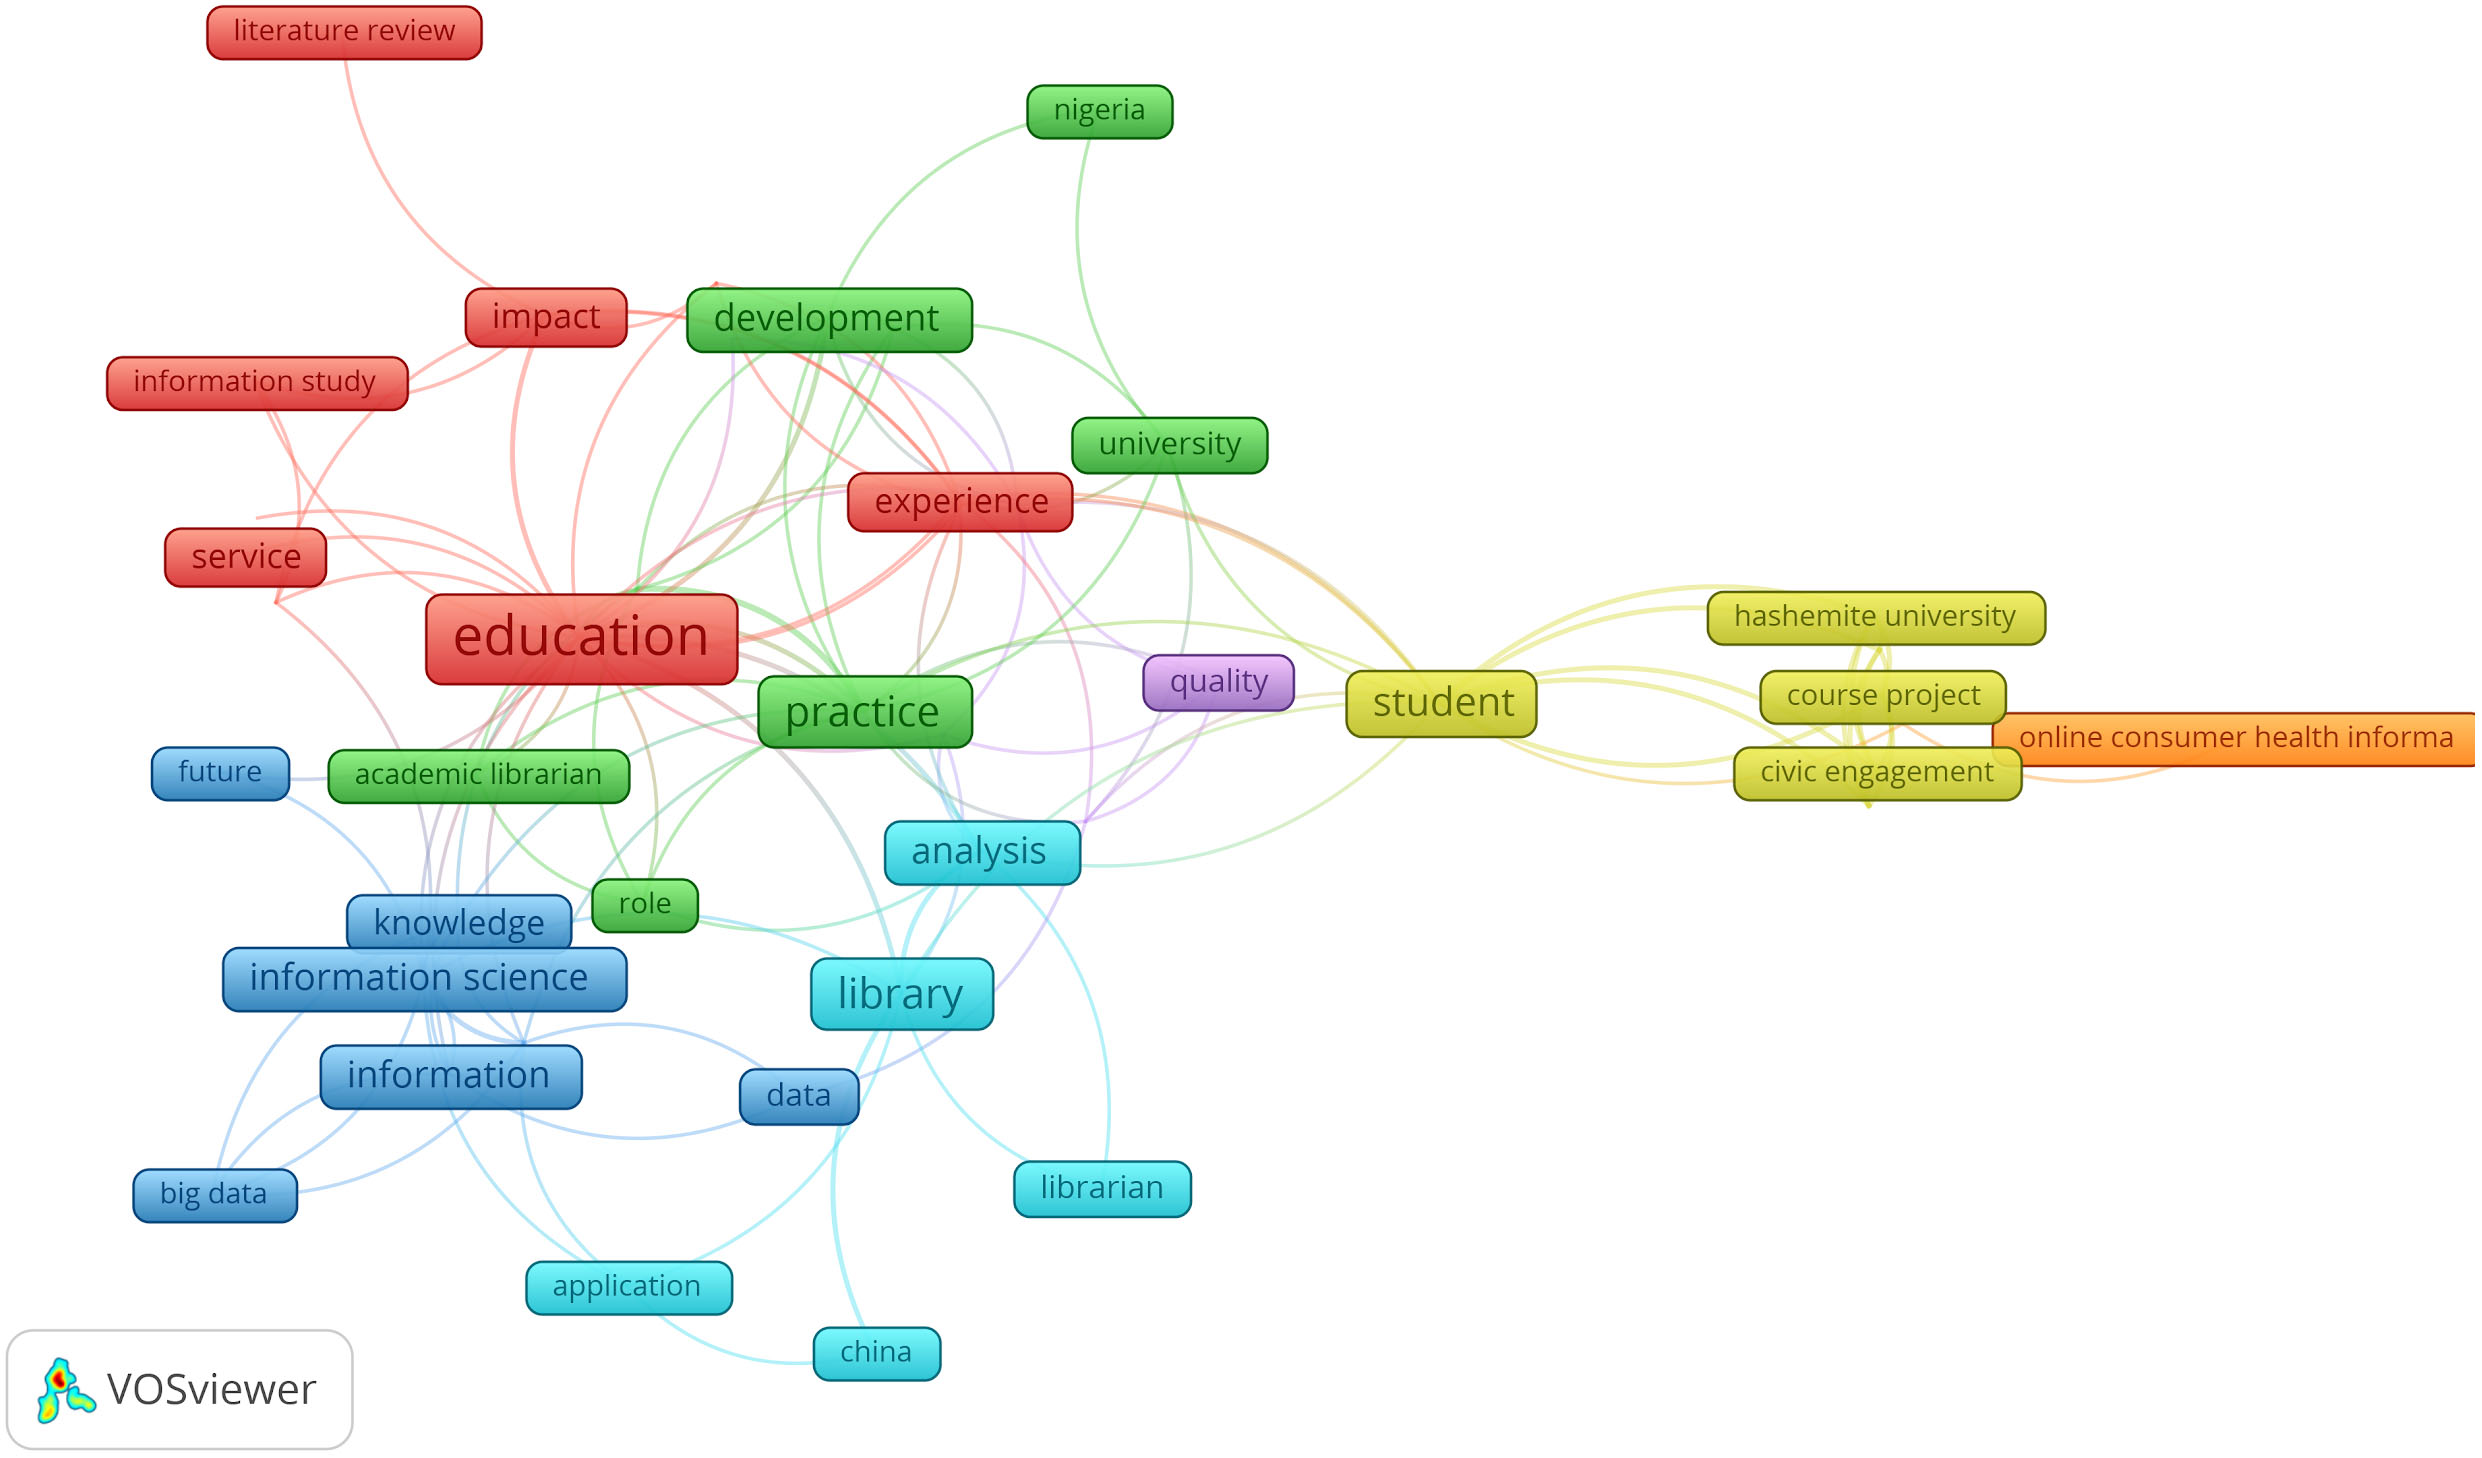
3.2.6Period 6: 2013–2019
This last period covers titles published in the last year of EIC 1’s mandate (2013), those published during EIC 2’s mandate (2014–2017) and the first year of EIC 3’s mandate (2018–2019). Hence, the map obtained continued to show a continuity in the trends observed above.
Figure 9 hereafter shows the traditional topics on Library education and services with terms such as “education, impact, experience, service, “literature review” and “librarian, library, china” “civic engagement, course project, student, hashemite university”.
The presence of the terms “information science, information, knowledge, big data, data” is explained by the publication of a special issue following a conference in Brazil on Big Data and autonomous action in 2018. The presence of the term “online health information” is explained by a series of special issues on health information services published in 2019. This last period is marked by a broadening of focus and a shift from traditional library education to information studies, to big data, digital humanities, social media and online education issues in the information fields.
Figure 9.
Map of prominent topics in 2013–19.
4.Discussion
The chronological analysis of titles published by Education for Information between 1983 and early 2019 shows that the journal displayed a remarkable stability in its editorial policy over more than three decades. With the arrival of its third Editor in Chief in 2018, a shift towards more technologically oriented topics and to specialties from other fields are perceptible (health information).
The maps we have produced show only a facet of the information contained in the corpus of publications. The feature reduction mechanism inherent in all data analysis methods often results in about 80% of the input data being eliminated from the analysis. By setting a minimum occurrence threshold at 2 which is quite low, more than 80% of the terms extracted from the titles were thus eliminated from further analysis and therefore did not appear on the maps. Previous studies in information retrieval and term weighting (Sparck Jones 1972) have demonstrated the relevance of highly or moderately frequent items because they represent the main topics in the corpus. The dilemma has always been finding the right balance between retaining these highly or moderately occurring items as well as some low frequency items which could signal novel topics. To date, no theoretical or methodological solution exists for this hard problem. Hence, the visual artifacts resulting from data analysis methods and tools should be viewed with circumspection because they are the result of multiple parameter fine tuning by the analysts and thus reflect his/her world views and assumptions on what items should be “seen”. Thus, if decision making is to be based on such machine generated visualisations, the viewer will do well not to forget the famous quote of the Polish American scientist and philosopher Alfred Korzybski that “the map is not the territory”. In effect, a “view” of a thing is not the thing itself. Maps are artifacts of the specific methods through which they were produced. This is not to say that these knowledge artifacts are not useful but decision making should not be based solely on them. The analysts should seek to complement the insights they yield via other methods, notably by a qualitative analysis involving the main actors and stakeholders concerned with the phenomenon studied.
Finally, we should also bear in mind that the maps and data do not speak in and of themselves. They need interpretation, a time-consuming and highly cognitive enterprise that requires a high level of expertise in the domain of the corpus as well as analytical skills. The interpretation stage is therefore highly hermeneutic and riddled with subjectivity (see Ibekwe-SanJuan 2006; Ekbia et al. 2015 for a discussion of the epistemological, theoretical and methodological issues inherent in data analysis processes).
In the future, we aim to extend this analysis to other journals in the information science fields in order to get a sense of how research in this interdisciplinary field is evolving.
References
[1] | Callon, M., Courtial, J-P., & Turner, W. ((1991) ). La méthode Leximappe: un outil pour l’analyse stratégique du développement scientifique et technique. In Gestion de la recherche: nouveaux problèmes, nouveaux outils (pp. 207-277). Bruxelles: VINCK, Boeck Editions. |
[2] | Chen, C. ((2004) ). Searching for intellectual turning points: Progressive Knowledge Domain Visualization. Proc. Natl. Acad. Sci. USA, 101: (suppl), 5303-5310. |
[3] | Chen, C., Ibekwe-SanJuan, F., & Hou, J. ((2010) ), The Structure and Dynamics of Co-Citation Clusters: A Multiple-Perspective Co-Citation Analysis. Journal of the American Society for Information Science and Technology, 61: (7), 1386-1409. |
[4] | Ekbia, H., Mattioli, M., Kouper, I., Arave, G., Ghazinejad, A., Bowman, T., Ratandeep Suri, R., Tsou, A., Weingart, A., & Sugimoto, C. ((2015) ). Big Data, Bigger Dilemmas: A Critical Review. Journal of the Association for Information Science and Technology, 66: (8): 1523-1545. |
[5] | Ibekwe-SanJuan, F. ((2006) ). A task-oriented framework for evaluating theme detection systems. A discussion paper. 5th International Conference on Language Resources and Evaluation Conference (LREC-06), May 2006, Genoa, Italy, pp. 2492-2497. |
[6] | Ibekwe-SanJuan, F. ((2007) ). Fouille de textes: méthodes, outils et applications, Hermès-Lavoisier, Paris-London, 352 pages. |
[7] | Janssens, F., Leta, J., Glanzel, W., & De Moor, B. ((2006) ). Towards mapping library and information science. Information Processing & Management, 42: (6), 1614-1642. |
[8] | Li, Z., & Xu, J. ((2019) ). The evolution of research article titles: the case of Journal of Pragmatics 1978–2018. Scientometrics, 121: , 1619-1634. doi: 10.1007/s11192-019-03244-3. |
[9] | Rip, A., & Courtial, J.-P. ((1984) ). Co-word maps of biotechnology: An example of cognitive scientometrics. Scientometrics, 6: (6), 381-400. |
[10] | Salton, G., Yang, C.S., & Wong, A. ((1975) ). A Vector Space Model for Information Retrieval. Communications of the ACM, 18: (11), 613-620. |
[11] | Small, H., & Sweeney, E. ((1985) ). Clustering the Science Citation Index Using Co-Citations. 1. A Comparison of Methods. Scientometrics, 7: (3-6), 391-409. |
[12] | Sparck Jones, K. ((1972) ). A statistical interpretation of term specificity and its application in retrieval. Journal of Documentation, 28: (1), 11-21. |
[13] | Sparck Jones, K., & Tait, J.I. ((1984) ). Automatic search term variant generation. Journal of Documentation, 40: (1), 50-66. |
[14] | Van Eck, N.J., & Waltman, L. ((2010) ), Software survey: VOSviewer, a computer program for bibliometric mapping, Scientometrics, 84: , 523-538. doi: 10.1007/s11192-009-0146-3. |
[15] | Van Eck, N.J., & Waltman, L. ((2009) ). How to normalize cooccurrence data? An analysis of some well-known similarity measures. Journal of the American Society for Information Science and Technology, 60: (8), 1635-1651. |
[16] | Van Eck, N.J., & Waltman, L. ((2020) ), VOSviewer Manual. CWTS, University of Leiden, 27 January 2020, 53 pages. |
[17] | White, H.D., & McCain, K.W. ((1998) ). Visualizing a discipline: An author co-citation analysis of information science, 1972–1995. Journal of the American Society for Information Science, 49: (4), 327-355. |
[18] | Zhao, D.Z., & Strotmann, A. ((2008) ). Information science during the first decade of the web: an enriched author cocitation analysis. Journal of the American Society for Information Science and Technology, 59: (6), 916-937. |


