
Secreted frizzled related-protein 2 is prognostic for human pancreatic cancer patient survival and is associated with fibrosis
Abstract
Pancreatic adenocarcinoma (PDAC) is one of the deadliest cancers, with five-year survival rates of 9%. We hypothesized that secreted frizzled-related protein 2 (SFRP2) may influence stromal growth in pancreatic cancer, since it increases fibrosis and collagen production in non-neoplastic pathologies. We assessed SFRP2 value as a biomarker and assessed its function in PDAC. SFRP2 gene expression in patients with PDAC was analyzed using TCGA data. Disease free survival (DFS) was analyzed using Kaplan Meier test. The effect of KRAS inhibition on SFRP2 expression in PDAC cells was assessed. The associations of stromal content with SFPR2 mRNA and protein with fibrosis were analyzed. The role of SFRP2 in mesenchymal transformation was assessed by western blot in fibroblasts. Of all cancers in TCGA, SFRP2 levels were highest in PDAC, and higher in PDAC than normal tissues (
1.Introduction
Pancreatic adenocarcinoma (PDAC) is the fourth leading cause of cancer deaths in the United States [1], and KRAS is mutated in 90% of patients with PDAC [2]. Even with improved chemotherapy regimens, the 9% five-year survival remains low [3]. One of the barriers to pancreatic cancer treatment is its desmoplastic stroma. Pancreatic cancer has the highest level of stroma (
Secreted frizzled-related protein 2 (SFRP2) is a glycoprotein upregulated in multiple cancer types that contributes to tumor growth, migration, anti-apoptosis [7, 8, 9, 10, 11, 12, 13, 14], and angiogenesis [7, 9, 13]. SFRP2 upregulates markers of immune dysfunction (PD-1 and CD38) in T-cells and contributes to their exhaustion [15]. We previously developed a humanized monoclonal antibody to SFRP2 (hSFRP2 mAb) that inhibits tumor growth, angiogenesis, induces tumor apoptosis [15, 16], and overcomes resistance to PD-1 inhibition [15]. We hypothesized that SFRP2 may influence stromal growth in cancer, since it increases fibrosis in non-neoplastic pathologies [17, 18]. A high correlation between SFRP2 mRNA expression and stromal mRNA expression in bladder, breast, colorectal, glioblastoma, head and neck, kidney, lung, ovarian, and endometrial cancers has also been found [19]. In correlation network analyses, genes involved in EMT process and ECM structure were associated with SFRP2 expression [19]. Because of the high stromal content in pancreatic cancer, we hypothesized that SFRP2 may play a larger role in this tumor type, not only through reducing apoptosis, increasing angiogenesis, and affecting immune cell activation, but also through activation of fibroblasts in the tumor stroma and development of a myofibroblast phenotype.
We sought to explore the relationship between SFRP2 and pancreatic cancer to determine whether SFRP2 expression is associated with survival and tumor fibrosis, and whether it is regulated by KRAS, a major driver of PDAC. Additionally, we investigated the ability of SFRP2 to promote the mesenchymal transformation of fibroblasts and stimulation of fibrinogen production.
2.Methods
2.1Cell lines, cell isolation, and tissue culture
Pancreatic cancer cell lines AsPC-1, MIA PaCa-2, and Panc02-luc were donated by Dr. Ernest Ramsay Camp (Medical University of South Carolina). Panc02-luc were originally obtained from the NCI DCTD Tumor Repository and transfected as previously described [20]; AsPC-1 and MIA PaCA-2 were from American Type Culture Collection (ATCC CRL-1420). PANC-1R15 and PSN-1R15 cells were generated as previously described [21]. Primary human skin fibroblasts [22] were donated by Dr. Carol Feghali-Bostwick (Medical University of South Carolina). The mouse angiosarcoma cell line, SVR [23], was purchased from ATCC (#CRL-2280).
A male C57/BL6NCrl mouse purchased from Charles River Laboratory (Wilmington, MA) was used to isolate pancreatic fibroblasts. The pancreas was resected after euthanasia and was washed with ice-cold modified Krebs-Hensleit buffer supplemented with 2.1 g/L sodium bicarbonate (pH 7.4). Next, 1 mL of ice-cold digestion mix (34.4 mL Hanks buffered saline solution (HBSS; #55037C-1000 mL, Sigma-Aldrich, St. Louis, MO, USA), 1 mL Liberase mix (5 mg in 2 mL of HBSS; # 541020001, Roche, Basel, Switzerland), 200 mL 0.25% Trypsin (# 25-050-CL, Corning, Corning, NY, USA), 360 mL 1M HEPES buffer (#H4034-25G, Sigma-Aldrich) was added, and tissue was macerated using a razor blade. The macerated tissue and digestion mix was placed into a 15 mL falcon tube, and an additional 3 mL of digestion mix at 37∘C was added. The mix was incubated on a tube rotator at 37∘C for 8 min. 10 mL of modified Krebs-Hensleit buffer containing 2.1 g/L sodium bicarbonate (#K3753, Sigma-Aldrich) was added to quench the digestion, and the mixture was briefly rested to allow the tissue chunks to collect at the bottom. The supernatant containing the cellular suspension was removed and placed on ice. Digestion mix (3 mL at 37∘C) was added and another round of incubation on the tube rotator was performed for 8 min. Once again, the supernatant was placed on ice, and the digestion was repeated until no visible chunks of tissue remained in the tube. The supernatants were then combined in a 50 mL falcon tube, centrifuged for 5 min at 1200 rpm, and washed with 10 mL Krebs-Hensleit buffer and centrifuged again at 1200 rpm for 5 min. Each pellet was finally resuspended in Human Cardiac Fibroblast growth media (#316-500, Cell Applications, San Diego, CA, USA) containing 1% penicillin/streptomycin (#15140122, Thermofisher, Waltham, MA, USA), placed into a 10 cm Petri dish, and grown to confluence.
SVR angiosarcoma, pancreatic cancer MIA PaCA-2 cell line, human skin fibroblasts, and mouse pancreatic fibroblasts were cultured in Dulbecco’s Modified Eagle Medium (DMEM, #10-013-CV, Corning) with 10% fetal bovine serum (FBS) (#BT 201-500-D, BioFluid, Fleming Island, FL, USA). AsPC-1 and Panc02-luc pancreatic cancer cell lines were cultured in Roswell Park Memorial Institute (RPMI) media with 10% FBS. All cell lines were cultured at 37∘C, 5% CO2, and 95% humidity.
2.2In vivo pancreatic cancer GEMM mouse model
Mice experiment protocols were in accordance with the National Institutes of Health guidelines for the care and use of laboratory animals and approved by the Animal Care and Use Committee (IACUC) at the Medical University of South Carolina. KPC male and female mice (Krastm4TyjTrp53tm1BrnTg(Pdx1-cre/Esr1*)#Dam/J) (
2.3Antibodies and proteins
Primary antibodies used included rabbit anti-actin (#A2103, Sigma-Aldrich), mouse anti-fibronectin (#610077, BD Biosciences, Franklin Lakes, NJ, USA), rabbit anti-frizzled-5 (H00007855-PW1, Abnova, Taipei, Taiwan), rabbit anti-GAPDH (glyceraldehyde-3-phosphate dehydrogenase, #ab9485, Abcam, Cambridge, MA, USA), rabbit anti-N-cadherin (#ab1221, Abcam), mouse anti-Vinculin (SC #73614, Santa Cruz Biotechnology, Dallas, TX, USA). Rabbit anti-Vinculin (E1E9V) (#13901, Cell Signaling Technologies, Danvers, Massachusetts, USA), Phospho-p44/42 MAPK (Erk1/2) (Thr202/Tyr204) Antibody (#9101, Cell Signaling Technologies, Danvers, Massachusetts, USA), p44/42 MAPK (Erk1/2) Antibody (#9102, Cell Signaling Technologies, Danvers, Massachusetts, USA). Rabbit anti-SFRP2 (#ab86379, Abcam), rabbit anti-SFRP2 (#ab137560 Abcam), and rabbit anti-SFRP2 (#LS-C61791, Lifespan Biosciences, Seattle, Washington, USA) were purchased based on manufacturers’ availability. Secondary antibodies used were biotinylated-conjugated anti-rabbit (#BA-1000, Vector Laboratories, Burlingame, CA, USA), horse-radish peroxidase (HRP)-conjugated anti-mouse (#7076, Cell Signaling, Danvers, MA, USA), HRP-conjugated anti-rabbit (#403005, Southern Biotech, Birmingham, AL, USA), and Goat Anti-Rabbit IgG-HRP (#4030-50, Southern Biotech, Birmingham, AL, USA). Recombinant human SFRP2 protein (SFRP2) was prepared as previously described [25], and provided by the Protein Expression and Purification Core facility from the University of North Carolina, Chapel Hill.
2.4SFRP2 mRNA expression
SFRP2 mRNA expression levels were determined using the Cancer Genome Atlas (TCGA) database that was accessed on cBioPortal [26, 27]. On cBioPortal, the SFRP2 gene was queried for all cancer types in the TCGA database. SFRP2 mRNA expression levels were collected for each patient and each cancer type, and descriptive statistics were performed. Gene Expression Profiling Interactive Analysis (GEPIA) [28] is an online tool that includes RNA sequencing data from several databases and can be used for interactive analysis of differential gene expression, profile plotting, survival analysis, and correlation analysis. GEPIA was used to analyze the differential RNA expression of SFRP2 in pancreatic cancer in the TCGA compared to normal pancreatic tissue. Survival analysis with the Kaplan-Meier method was also conducted through GEPIA to determine the association of disease-free survival with high or low RNA expression of SFRP2 in TCGA samples. We looked at publicly available datasets to explore percentiles at which there was a statistically significant decrement in survival. Based on these mRNA data, the cutoffs that we can use 20the percentile or less for low group and 50th percentile or greater for the high group provided a statistical separation of survival.
2.5SFRP2 mRNA expression correlation to stroma in pancreatic cancer
The level of SFRP2 mRNA expression in pancreatic cancer was obtained in units of fragments per kilobase of transcript per million (FPKM) from the Human Protein Atlas (https://www.proteinatlas.org/about/download) [29]. The level of stromal content for each of these samples was evaluated with the Estimation of Stromal and Immune cells in Malignant Tumor tissues using Expression data (ESTIMATE) provided by the MD Anderson Cancer Center [30]. This scoring uses the TCGA mRNA data to analyze the stromal cell presence in the tumor and the immune cell infiltration. The stromal score was obtained using ESTIMATE, which measures the level of stroma in tumor tissue, and a Spearman correlation between the stromal score and SFRP2 mRNA expression levels for these patient samples was conducted.
2.6Protein extraction from pancreatic tumor tissues
Human pancreatic tumor samples and their matched normal adjacent tissues from pancreatic resections were obtained from the Medical University of South Carolina Tissue Biorepository. These de-identified tissues were obtained from institutional surgical specimens under an IRB-approved protocol and were stored at
2.7Immunohistochemistry
Pancreatic tumors were resected from KPC mice, fixed in formalin, paraffin-embedded, and 8
2.8Evaluation of epithelial mesenchymal transformation in fibroblasts
Mouse pancreatic fibroblasts and human skin fibroblasts were plated at 60% confluence in DMEM with 10% FBS and treated with either TGF
2.9Effect of KRAS inhibition on SFRP2 expression in PDAC cells
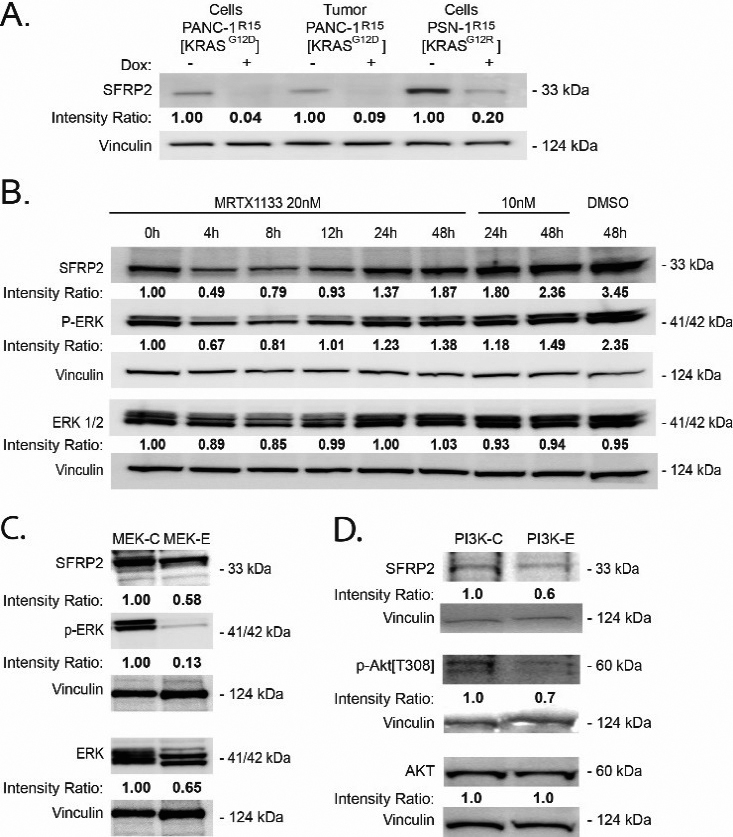
PANC-1R15 and PSN-1R15 were treated with doxycycline (DOX) to induce expression of R15 Monobody, which selectively inhibits a subset of oncogenic KRAS proteins including KRASG12D and KRASG12R [21]. Following DOX treatment (1–2
To confirm if KRAS inhibition alters SFRP2 expression, we inhibited KRAS activity by a second method using a KRASG12D inhibitor, MRTX1133 (Selleckchem, E1051, Houston, TX) [31], on PANC-1 pancreatic cancer cells and performing western blot probing for SFRP2. In this experiment, PANC-1 cells were treated with MRTX1133 (20
2.10Western blot analysis
The protein content was equalized across samples using a Bradford solution, Bio-Rad Protein Assay (#500-0205, Bio-Rad Laboratories). Samples containing equal amounts of total protein were run on 10% bis-tris SDS-PAGE gels (#NW00100BOX Invitrogen) for 1 hour at 140 V. Proteins were transferred onto a PVDF membrane (#LC2005 Life Technologies; Carlsbad, CA, USA) at 30 V for 70 min. Membranes were then incubated for 30 min at RT in blocking buffer (PBS, Twin 0.1%, 5% milk), and then at 4∘C overnight with the primary antibody resuspended in blocking buffer. The following day, membranes were incubated with a HRP-conjugated secondary antibody (1:5000) for 1 hour at RT. The ECL Prime Western Blotting System was used to visualize protein bands (#RPN2232; GE Healthcare). Protein levels from test samples were compared to the loading controls (actin, GAPDH, or vinculin). To do this, densities were calculated by multiplying the average intensity by the surface of each band, and the percentage of control was calculated using the following formula: marker of interest total density x 100/loading control total density. For each experimental sample, values were then normalized to a control which was given the value of 1.00.
2.11Statistical analysis
Paired
3.Results
3.1SFRP2 RNA levels are the highest in pancreatic cancer and are associated with poor survival
SFRP2 protein is present in multiple cancers including angiosarcoma, hepatocellular carcinoma, prostate, colon, renal, lung, ovarian, and pancreatic cancers [7]. Therefore, we first assessed which cancer had the highest SFRP2 expression levels. To evaluate SFRP2 mRNA levels, we used the RNAseq data from the TCGA. We collected RNAseq data for SFRP2 expression from all 32 cancer types in the database (Fig. 1A). The median number of samples for each cancer type was 294 (range 36-1,082). Pancreatic cancer was found to have the highest levels of SFRP2 mRNA compared to all other tumor types, with a median expression of 13,155 RNAseq by expectation maximization (RSEM) (5.11-120,416 RSEM). In the vast majority of tumor samples among the 32 types of cancer, the SFRP2 gene was not mutated. Next, we compared the mRNA expression levels between normal pancreas and pancreatic adenocarcinoma using the GEPIA online tool. Pancreatic adenocarcinoma mRNA expression data were obtained from the TCGA RNAseq database (
Figure 1.
SFRP2 mRNA expression is increased in pancreatic cancer. (A) SFRP2 mRNA levels were compared between 32 cancer types in the TCGA database. Pancreatic cancer had the highest SFRP2 median expression levels. (B) The online interactive tool GEPIA was used to compare SFRP2 mRNA levels between pancreatic cancer samples (
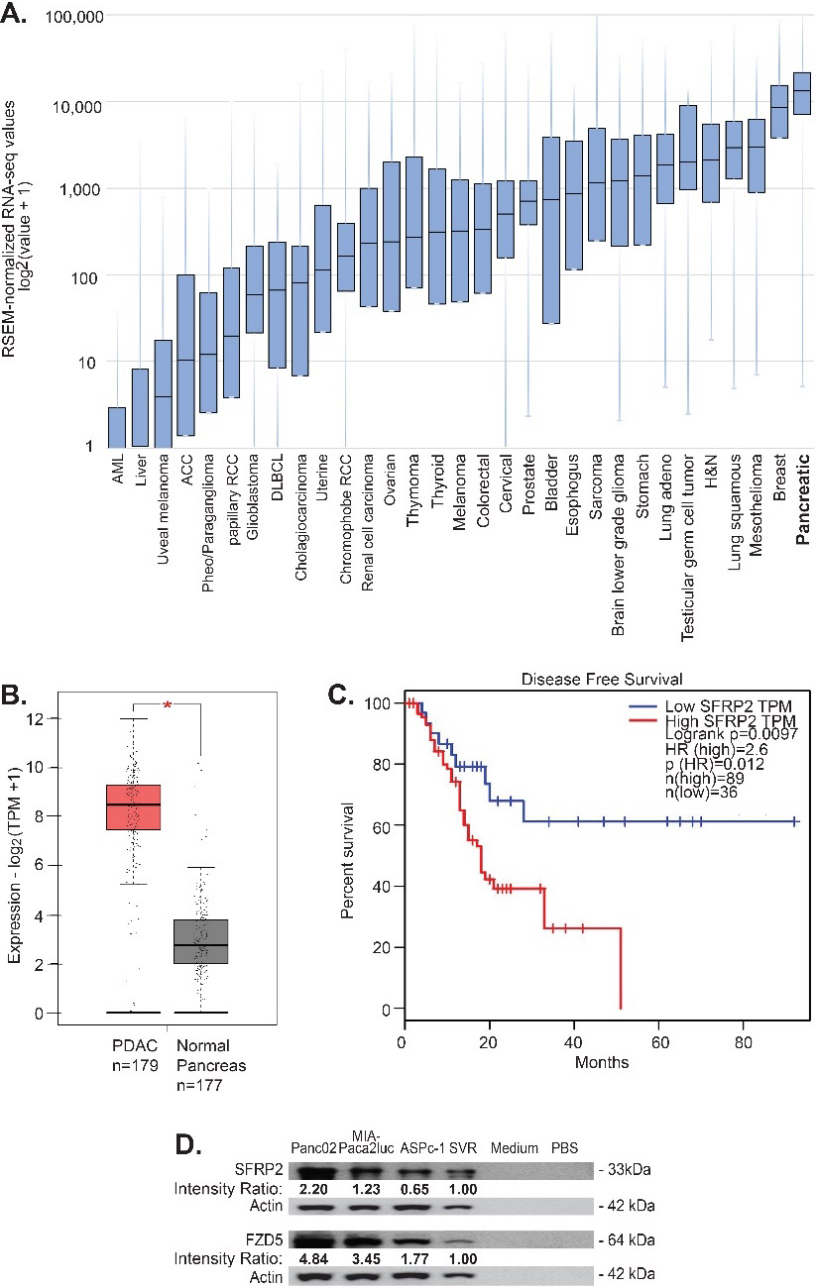
The GEPIA online tool was used to evaluate the association between SFRP2 mRNA expression and disease-free survival for pancreatic cancer patients. High SFRP2 mRNA levels were defined as SFRP2 mRNA expression in the 50th percentile or higher, and low SFRP2 mRNA levels were defined as SFRP2 mRNA expression in the 20th percentile or lower. Disease-free survival was compared between high SFRP2 mRNA levels (
Figure 2.
Inhibition of KRAS reduces SFRP2 expression in PDAC. A, B, C, D) Band densities (average intensity x band surface) were normalized to the loading control, Vinculin, to eliminate inter-sample variability, to quantitatively obtain the Intensity Ratio. For each cell type, results were normalized to the untreated control: -Dox (A), and 0 h (B). (A) Western blot analysis of PDAC expressing a doxycycline (DOX)-inducible CFP-R15 monobody. DOX-induced R15 (+) reduced SRFP2 levels in both PDAC lines and a PANC-1 tumor sample. DOX: doxycycline. (B) Western blot analysis of PANC-1 cells treated with DMSO or MRTX1133 (10 or 20 nM), a noncovalent selective KRASG12D inhibitor, for various periods of time shows a reduction of p-ERK and SFRP2 at 4 hours compared to control. (C) Treatment of MIA PaCa-2 cells with trametinib (MEK inhibitor) at 100 nm for 4 hours shows a reduction in p-ERK and SFRP2. (D) Treatment of MIA PaCa-2 cells with buparlisib (PI3Kinase inhibitor) at 1 uM for 4 hours shows a reduction in p-AKT and SFRP2 compared to control.
3.2SFRP2 protein and its receptor, FZD5, are expressed in pancreatic cancer cell lines in vitro
We previously showed that frizzled-5 (FZD5) is the receptor for SFRP2 in the non-canonical WNT-calcineurin pathway in endothelial, angiosarcoma, and breast cancer cells [25]. Therefore, we measured SFRP2 and FZD5 protein levels in pancreatic cell lines. Both KRAS and p53 mutation-bearing cell lines were selected, since they are the most common mutations in pancreatic cancer, with a rate of 90% and 75%, respectively for each marker [32]. SFRP2 and FZD5 protein levels were assessed by western blot in two human pancreatic cancer cell lines, AsPC-1 and MIA-PaCa2, and one murine cell line, Panc02-luc. SFRP2 and FZD5 protein levels were further compared to the levels in SVR angiosarcoma, used as a positive control [25]. PBS and media were used as negative controls. All three pancreatic cell lines showed high SFRP2 and FZD5 protein levels compared to the positive control, with no protein in the negative controls (Fig. 1D).
3.3KRAS regulates SFRP2 protein in PDAC cells
To determine whether mutant KRAS influences SRFP2 expression, we utilized the recently described R15 monobody to directly inhibit oncogenic RAS activity in PDAC cells (Fig. 2A) [21]. DOX-induced expression of R15 in either PANC-1R15 or PSN-1R15 led to a reduction in SRFP2 protein levels. In addition, PANC-1R15 xenograft tumors treated with the monobody contained lower SFRP2 levels than untreated tumors (Fig. 2A), further supporting regulation of SFRP2 expression by mutant KRAS signaling in PDAC. To confirm this result with a different KRAS inhibitor, PANC-1 cells were treated with MRTX1133, a non-covalent and selective inhibitor of KRASG12D, for periods of time ranging from 0 to 48 hours. As shown in Fig. 2B, MRTX1133 reversibly inhibited the activity of ERK, a known target of KRASG12D, and reduced the expression SFRP2, with a maximum effect at 4 hours. To further evaluate downstream mediators of the KRAS pathway, MIA PaCa-2 cells were treated with dabrafenib (B-Raf inhibitor) and trametinib (MEK inhibitor), which reduced phospho-ERK and SFRP2 protein levels (Fig. 2C). Likewise, the inhibition of PI3Kinase by buparlisib, another downstream target of KRAS, reduced phospho-AKT and SFRP2 protein levels (Fig. 2D). This demonstrates that in pancreatic cancer, SFRP2 is regulated by both KRAS/RAF/MEK/ERK and KRAS/ PI3Kinase pathways.
3.4SFRP2 protein expression is increased in human pancreatic cancer compared to adjacent normal pancreatic tissue
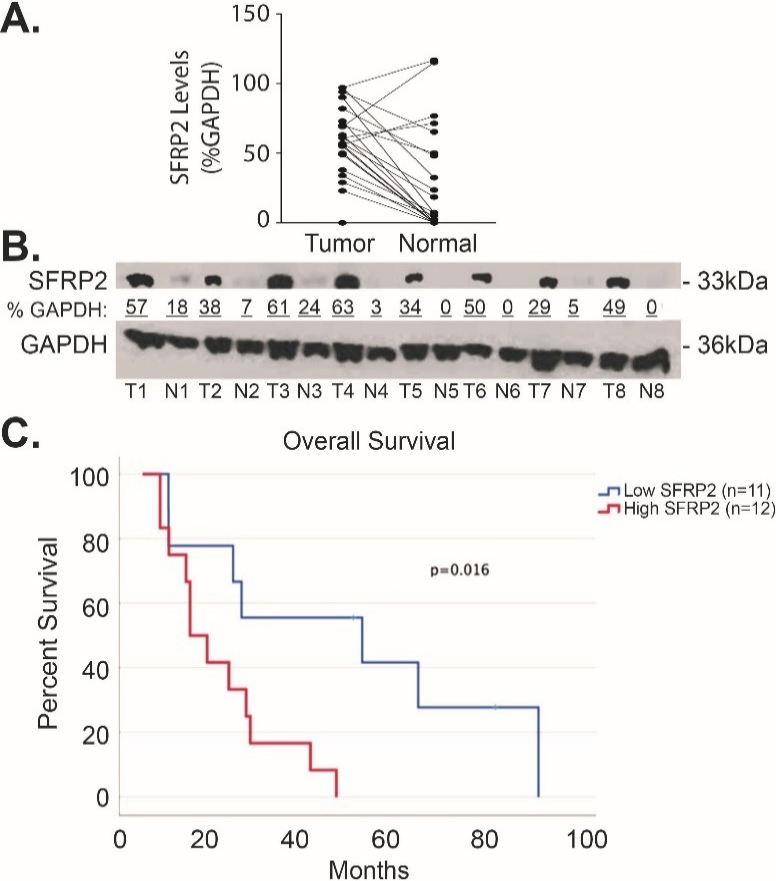
To compare SFRP2 protein expression levels in human pancreatic cancer to matched normal adjacent pancreatic tissue, we measured the levels of SFRP2 protein by western blot in 23 pairs of samples. Table 1 shows the clinical characteristics of these patients. Forty-two percent were male, and the median age was 67.5 (range 47–87). Seventy five percent of the patients were Caucasian while the remaining 25% were non-Hispanic Blacks. Seventy-five percent of patients had Stage IIB disease (ranged from IA to IIB). The densitometry of SFRP2 protein bands was measured in tumor and normal tissues and normalized to the loading control, GAPDH, for each tumor and matched normal tissue assessed. Results showed significantly higher expression of SFRP2 in tumor tissues with an average percent GAPDH of 57.0
Table 1
Clinical Characteristics of Patients Analyzed
| Clinical factors | |
|---|---|
| Age, median (range) | 65 (47–87) |
| Sex (N%) | |
| Female | 14 (58.3) |
| Male | 10 (41.7) |
| Race (N%) | |
| Black | 6 (25.0) |
| White | 18 (75.0) |
| Tumor Grade (N%) | |
| Well differentiated | 1 (4.2) |
| Moderately differentiated | 16 (66.7) |
| Poorly differentiated | 5 (20.8) |
| Missing | 2 (8.3) |
| Stage (N%) | |
| IA-IIA | 6 (25.0) |
| IIB | 18 (75.0) |
| Last Follow-up, median (range) | 21 months (4–92 months) |
Figure 3.
SFRP2 protein expression is increased in pancreatic cancer. (A) Blot plot of the densitometry values from representative western blot comparing the levels of SFRP2 between tumor tissue from patients in Table 1 and their normal adjacent pancreatic tissue. (B) Representative western blot of tumor tissues (T) and their normal adjacent tissues (N). Densitometry was calculated by measuring the total intensity of each SFRP2 band in tumor and normal samples, and comparing them to the loading control, GAPDH.
3.5SFRP2 expression is associated with fibrosis in pancreatic cancer
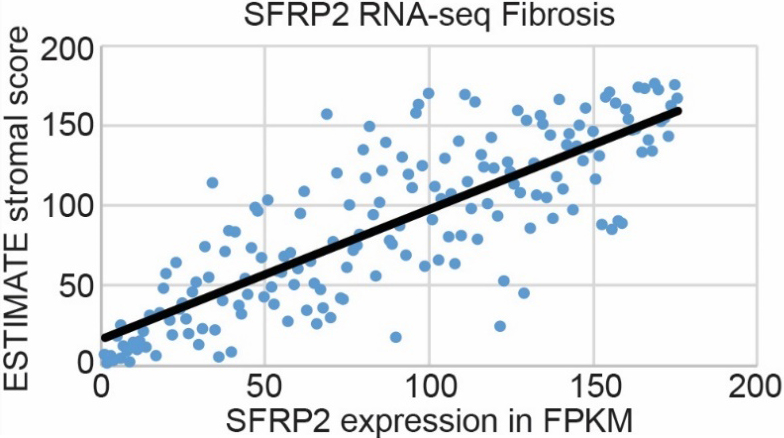
Pancreatic cancer has the highest stroma content of any solid organ tumor, which is a major barrier to chemotherapy tumor biodistribution [6]. Since SFRP2 is associated with fibrosis in other pathologies [18], including cancers [19], we hypothesized that SFRP2 expression levels would be associated with the degree of fibrosis in pancreatic cancer. SFRP2 mRNA expression from pancreatic cancer patients in the TCGA (
Figure 4.
SFRP2 RNA expression is associated with fibrosis in pancreatic cancer. mRNA expression of SFRP2 in pancreatic cancer patient samples from the TCGA (
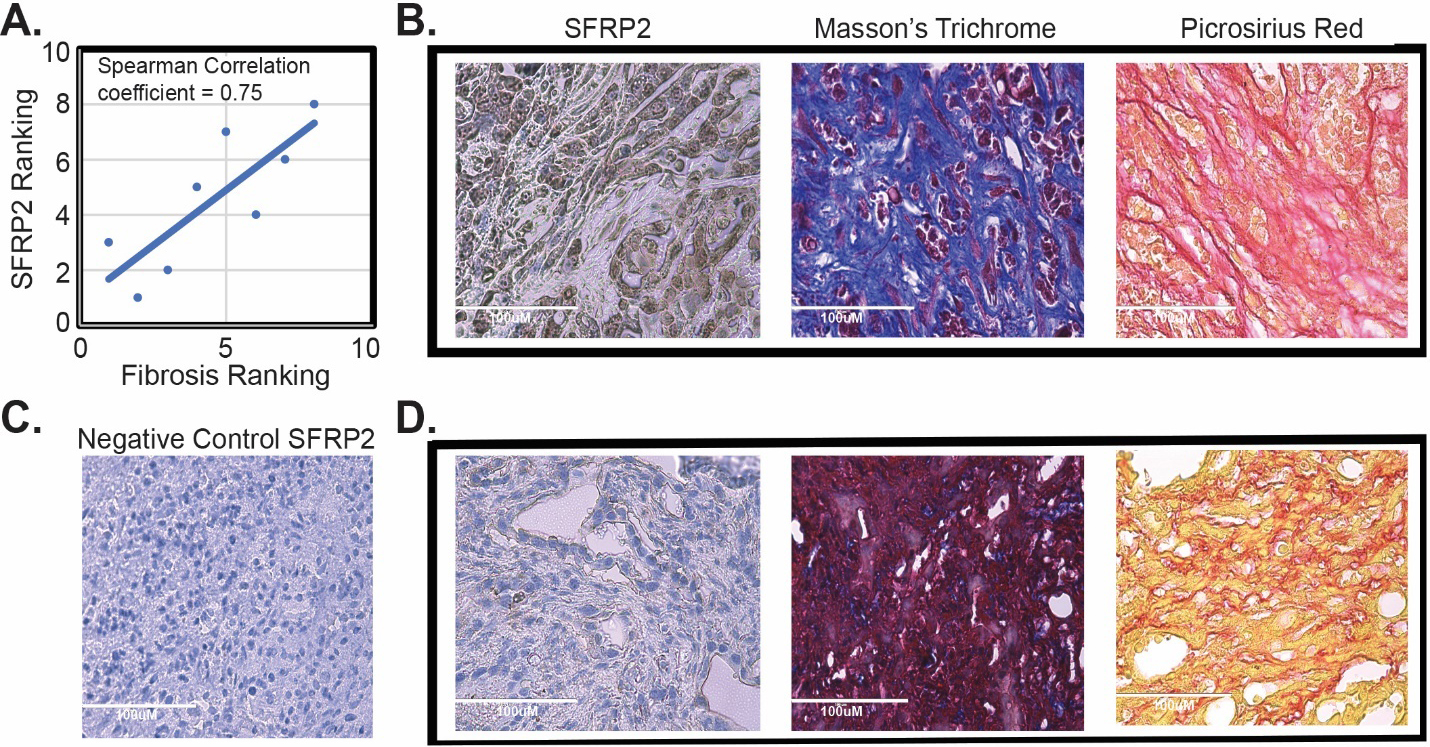
Next, we tested the correlation between fibrosis in pancreatic tumors and SFRP2 protein expression in tumors in vivo. KPC mice (
Figure 5.
SFRP2 expression is associated with fibrosis in vivo. (A) Correlation of SFRP2 staining and degree of fibrosis in tumors from KPC mice (
3.6SFRP2 promotes the mesenchymal transformation of fibroblasts
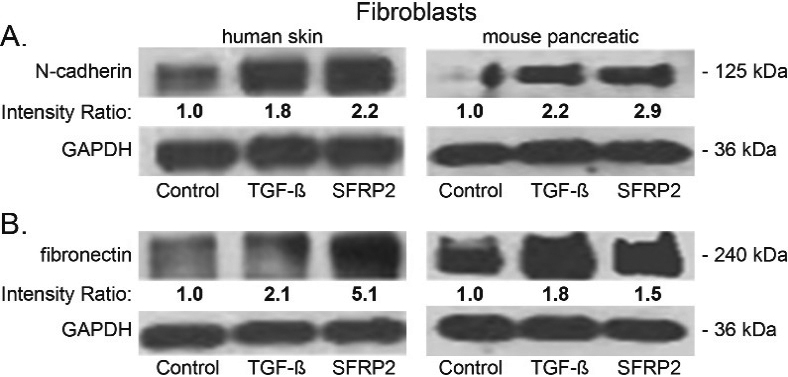
Because we consistently observed a positive correlation between SFRP2 levels and fibrosis, and since SFRP2 is connected to epithelial-mesenchymal transition (EMT) in network analysis [18], we hypothesized that SFRP2 induces a mesenchymal transformation in fibroblasts. To test this hypothesis, we used two cell types: normal human skin fibroblasts and normal mouse pancreatic fibroblasts. Cells were treated for 48 hours either with TFG
Figure 6.
SFRP2 induces epithelial mesenchymal transformation and collagen production in fibroblasts. (A) Human skin and mouse pancreatic fibroblasts were either untreated (control) or treated for 48 hours with SFRP2 (30 nM) or TGF
4.Discussion
The challenges surrounding pancreatic cancer treatment lie in its tremendous resistance to chemotherapeutics. The dense stroma of pancreatic cancer is a key contributor to this resistance, establishing an environment with low vascularity that impedes drug delivery and immune cell infiltration [4]. In this study, we found SFRP2 to be highly expressed in pancreatic cancer compared to normal adjacent pancreatic tissue, and high SFRP2 expression was predictive of worse survival using a TCGA data set. Based on these findings, a future prospective clinical study to confirm the high and low cutoffs will need to be obtained in future prospective clinical trials. SFRP2 as a reliable biomarker is warranted. SFRP2 also correlated with pancreatic cancer fibrosis, and fibroblasts treated with SFRP2 protein expressed higher levels of mesenchymal markers involved in EMT, a phenotype that correlates with cancer invasion and metastasis.
With the TCGA RNAseq data, we found that SFRP2 expression levels are the highest in pancreatic cancer. Conversely, both SFRP2 mRNA and protein levels appeared to be significantly lower in normal pancreatic tissue, compared to adjacent tumor tissue. This suggests that the neoplastic transformation of the pancreatic tissue correlates with an upregulation of SFRP2. KRAS mutation is the most frequent mutation in PDAC, occurring in more than 90% of tumors [2], and our data show that SFRP2 protein levels in PDAC are regulated by KRAS activity. SFRP2 has the potential to serve as a prognostic biomarker and is a potential therapeutic target, which both warrant further investigation.
In this study we found that fibroblasts treated with SFRP2 had increase protein levels of N-cadherin and fibronectin, similar to TGF
SFRP2 has been highly associated with fibrosis and EMT in other tumor types [19]. Sun and colleagues’ investigation into cancer resistance after chemotherapy showed that SFRP2 was upregulated in CAFs subjected to cytotoxic therapy [38]. They also showed that WNT16B signaling is also enhanced , which further contributes to drug resistance. Inhibition of SFRP2 may dually affect chemoresistance by decreasing the tumor stroma, and decreasing the signaling that confers therapeutic resistance. There has been recent interest in targeting the stromal tissue for pancreatic cancer treatment to dismantle the barricade to chemotherapy and immune response. The results of therapeutics used for these effects have been contradictory thus far. A small molecule inhibitor of the sonic hedgehog pathway showed efficacy in preclinical studies [39] but failed to demonstrate improved survival in clinical trials [40, 41]. Meanwhile, some improvements have been observed with other stromal inhibitors in phase I/II trials targeting TGF
Investigation of pancreatic CAFs has shown that this is a heterogeneous population of cells with different functions, which likely contributes to these different findings. Although Ozdemir and colleagues found that myofibroblast depletion led to more aggressive tumors and immune dysregulation, they also discovered that treating these myofibroblast-depleted mice with CTLA-4 checkpoint inhibitors led to less undifferentiated cancer cells, normalized parenchyma, and improved survival compared to non-myofibroblast depleted mice treated with anti-CTLA-4 antibody [44]. Therefore, inhibiting the stroma may need to be accompanied by immunotherapy for efficacy, and further studies will identify whether targeting the stroma overcomes resistance to immunotherapy in pancreatic cancer. We previously showed that SFRP2 affects immune dysregulation, specifically increasing transcription of CD38, which reduces resistance to the PD-1 inhibition [15]. Therefore, targeting SFRP2 may have the added benefit of providing immunotherapy, in conjunction with stromal regulation, inducing tumor apoptosis and inhibiting angiogenesis. Since SFRP2 is highly expressed in pancreatic cancer; its expression is significantly associated with worse survival, and it is regulated by KRAS; SFRP2 may serve as a novel therapeutic target for pancreatic cancer.
5.Conclusion
We demonstrated that SFRP2 is highly expressed in pancreatic cancer and its expression is significantly associated with worse disease-free survival and is regulated by KRAS. We confirmed that, like other cancer types, SFRP2 is associated with fibrosis in pancreatic cancer. Investigation of SFRP2’s impact on fibroblasts showed that SFRP2 stimulates EMT, which identifies an additional role for SFRP2 as a regulator for cancer invasion, angiogenesis, metastasis, and ECM construction. Targeting the stroma is a promising avenue for pancreatic cancer treatment, but the current literature demonstrates that further research on the communication of all heterogeneous cell populations, cytokines, and proteins in the tumor microenvironment is needed to understand how best to manipulate it to improve survival. SFRP2 is one such protein that plays a part in this crosstalk and merits additional study to determine its potential as a regulator for both stroma production and immune dysregulation.
Author contributions
Conception: NKD, JBS, PN, JPO; Interpretation or analysis of data: JBS, PN, KLH, LS, RM, JPO, JEM, IK; LH, MG, BR, Preparation of the manuscript: JBS, PN, NKD, RM, IK, JPO, NGD, EH, LH; Revision for important intellectual content: NKD; Supervision: NKD, JBS, PN.
Supplementary data
The supplementary files are available to download from http://dx.doi.org/10.3233/CBM-220044.
Acknowledgments
NKD was supported by grants from the Hirshberg Foundation for Pancreatic Cancer Research Seed Grant Award, and a donation from Dr. Robert and Mrs. Laura Ryan. Dr. Ryan is CEO of Innova Therapeutics, Inc. JPO was supported by grants from the Department of Veterans Affairs Biomedical Laboratory Research and Development Service MERIT Award (1I01BX002095) and the NCI (R01CA212608 and P30CA138313). NKD, JPO, and NGD were supported by grants from Hollings Cancer Center Team Science Award, and Tissue collection for this study was supported by the Biorepository & Tissue Analysis Shared Resource, Hollings Cancer Center, Medical University of South Carolina. The study sponsors were not involved in the study design or the collection, analysis, and interpretation of data.
References
[1] | R.L. Siegel, K.D. Miller, H.E. Fuchs and A. Jemal, Cancer Statistics, 2021, CA Cancer J Clin 71: ((2021) ), 7–33. |
[2] | B. Giri, V. Sethi, V. Dudeja and S. Banerjee, A. Livingstone and A. Saluja, Genetics of pancreatic cyst-cancer progression: standing on the shoulders of giants, Curr Opin Gastroenterol 33: ((2017) ), 404–410. |
[3] | E. Oneda and A. Zaniboni, Are We Sure that Adjuvant Chemotherapy is the Best Approach for Resectable Pancreatic Cancer? Are We in the Era of Neoadjuvant Treatment? A Review of Current Literature, J Clin Med 8: ((2019) ). |
[4] | D. Thomas and P. Radhakrishnan, Pancreatic Stellate Cells: The Key Orchestrator of The Pancreatic Tumor Microenvironment, Adv Exp Med Biol 1234: ((2020) ), 57–70. |
[5] | F. Polani, P.M. Grierson and K.H. Lim, Stroma-targeting strategies in pancreatic cancer: Past lessons, challenges and prospects, World J Gastroenterol 27: ((2021) ), 2105–2121. |
[6] | D. Thomas and P. Radhakrishnan, Tumor-stromal crosstalk in pancreatic cancer and tissue fibrosis, Mol Cancer 18: ((2019) ), 14. |
[7] | A. Courtwright, S. Siamakpour-Reihani, J.L. Arbiser, N. Banet, E. Hilliard, L. Fried, C. Livasy, D. Ketelsen, D.B. Nepal, C.M. Perou, C. Patterson and N. Klauber-DeMore, Secreted Frizzle-Related Protein 2 Stimulates Angiogenesis via a Calcineurin/NFAT Signaling Pathway, Cancer Res ((2009) ). |
[8] | M.E. Fane, B.L. Ecker, A. Kaur, G.E. Marino, G.M. Alicea, S.M. Douglass, Y. Chhabra, M.R. Webster, A. Marshall, R. Colling, O. Espinosa, N. Coupe, N. Maroo, L. Campo, M.R. Middleton, P. Corrie, X. Xu, G.C. Karakousis and A.T. Weeraratna, sFRP2 Supersedes VEGF as an Age-related Driver of Angiogenesis in Melanoma, Affecting Response to Anti-VEGF Therapy in Older Patients, Clin Cancer Res 26: ((2020) ), 5709–5719. |
[9] | A. Kaur, M.R. Webster, K. Marchbank, R. Behera, A. Ndoye, C.H. Kugel, 3rd, V.M. Dang, J. Appleton, M.P. O’Connell, P. Cheng, A.A. Valiga, R. Morissette, N.B. McDonnell, L. Ferrucci, A.V. Kossenkov, K. Meeth, H.Y. Tang, X. Yin, W.H. Wood, 3rd, E. Lehrmann, K.G. Becker, K.T. Flaherty, D.T. Frederick, J.A. Wargo, Z.A. Cooper, M.T. Tetzlaff, C. Hudgens, K.M. Aird, R. Zhang, X. Xu, Q. Liu, E. Bartlett, G. Karakousis, Z. Eroglu, R.S. Lo, M. Chan, A.M. Menzies, G.V. Long, D.B. Johnson, J. Sosman, B. Schilling, D. Schadendorf, D.W. Speicher, M. Bosenberg, A. Ribas and A.T. Weeraratna, sFRP2 in the aged microenvironment drives melanoma metastasis and therapy resistance, Nature 532: ((2016) ), 250–4. |
[10] | J.L. Lee, C.J. Chang, L.L. Chueh and C.T. Lin, Secreted Frizzled Related Protein 2 (sFRP2) Decreases Susceptibility to UV-Induced Apoptosis in Primary Culture of Canine Mammary Gland Tumors by NF-kappaB Activation or JNK Suppression, Breast Cancer Res Treat 100: ((2006) ), 49–58. |
[11] | M. Montagner, R. Bhome, S. Hooper, P. Chakravarty, X. Qin, J. Sufi, A. Bhargava, C.D.H. Ratcliffe, Y. Naito, A. Pocaterra, C.J. Tape and E. Sahai, Crosstalk with lung epithelial cells regulates Sfrp2-mediated latency in breast cancer dissemination, Nat Cell Biol 22: ((2020) ), 289–296. |
[12] | W. Roth, C. Wild-Bode, M. Platten, C. Grimmel, H.S. Melkonyan, J. Dichgans and M. Weller, Secreted Frizzled-related proteins inhibit motility and promote growth of human malignant glioma cells, Oncogene 19: ((2000) ), 4210–4220. |
[13] | P. Techavichit, Y. Gao, L. Kurenbekova, R. Shuck, L.A. Donehower and J.T. Yustein, Secreted Frizzled-Related Protein 2 (sFRP2) promotes osteosarcoma invasion and metastatic potential, BMC Cancer 16: ((2016) ), 869. |
[14] | S. Yamamura, K. Kawakami, H. Hirata, K. Ueno, S. Saini, S. Majid and R. Dahiya, Oncogenic functions of secreted Frizzled-related protein 2 in human renal cancer, Mol.Cancer Ther.9 (2010), 1680–1687. |
[15] | P. Nasarre, D.I. Garcia, J.B. Siegel, I.V. Bonilla, R. Mukherjee, E. Hilliard, P. Chakraborty, C. Nasarre, J.T. Yustein, M. Lang, A.A. Jaffa, S. Mehrotra and N. Klauber-DeMore, Overcoming PD-1 Inhibitor Resistance with a Monoclonal Antibody to Secreted Frizzled-Related Protein 2 in Metastatic Osteosarcoma, Cancers (Basel) 13: ((2021) ). |
[16] | D. Garcia, P. Nasarre, I.V. Bonilla, E. Hilliard, Y.K. Peterson, L. Spruill, A.M. Broome, E.G. Hill, J.T. Yustein, S. Mehrotra and N. Klauber-DeMore, Development of a Novel Humanized Monoclonal Antibody to Secreted Frizzled-Related Protein-2 That Inhibits Triple-Negative Breast Cancer and Angiosarcoma Growth In Vivo, Ann Surg Oncol 26: ((2019) ), 4782–4790. |
[17] | K. Kobayashi, M. Luo, Y. Zhang, D.C. Wilkes, G. Ge, T. Grieskamp, C. Yamada, T.C. Liu, G. Huang, C.T. Basson, A. Kispert, D.S. Greenspan and T.N. Sato, Secreted Frizzled-related protein 2 is a procollagen C proteinase enhancer with a role in fibrosis associated with myocardial infarction, Nat Cell Biol 11: ((2009) ), 46–55. |
[18] | M. Mastri, Z. Shah, K. Hsieh, X. Wang, B. Wooldridge, S. Martin, G. Suzuki and T. Lee, Secreted Frizzled-related protein 2 as a target in antifibrotic therapeutic intervention, Am J Physiol Cell Physiol 306: ((2014) ), C531–9. |
[19] | K.M. Vincent and L.M. Postovit, A pan-cancer analysis of secreted Frizzled-related proteins: re-examining their proposed tumour suppressive function, Sci Rep 7: ((2017) ), 42719. |
[20] | E.C. Little, C. Wang, P.M. Watson, D.K. Watson, D.J. Cole and E.R. Camp, Novel immunocompetent murine models representing advanced local and metastatic pancreatic cancer, J Surg Res 176: ((2012) ), 359–66. |
[21] | I. Khan, Koide, A., Zuberi, M., Ketavarapu, G., Denbaum, E., Teng, K.W., Rhett, M., Spencer-Smith, R., Hobbs, A.G., Camp, E.R., Koide, S., O’Bryan, J.P., Identification of the nucleotide-free state as a therapeutic vulnerability for inhibition of selected oncogenic RAS mutants, Cell Reports ((2022) ). |
[22] | C.A. Feghali and T.M. Wright, Identification of multiple, differentially expressed messenger RNAs in dermal fibroblasts from patients with systemic sclerosis, Arthritis Rheum 42: ((1999) ), 1451–7. |
[23] | J.L. Arbiser, M.A. Moses, C.A. Fernandez, N. Ghiso, Y. Cao, N. Klauber, D. Frank, M. Brownlee, E. Flynn, S. Parangi, H.R. Byers and J. Folkman, Oncogenic H-ras stimulates tumor angiogenesis by two distinct pathways., Proc Natl Acad Sci USA 94: ((1997) ), 861–866. |
[24] | A. Gopinathan, J.P. Morton, D.I. Jodrell and O.J. Sansom, GEMMs as preclinical models for testing pancreatic cancer therapies, Dis Model Mech 8: ((2015) ), 1185–200. |
[25] | Y.K. Peterson, P. Nasarre, I.V. Bonilla, E. Hilliard, J. Samples, T.A. Morinelli, E.G. Hill and N. Klauber-DeMore, Frizzled-5: a high affinity receptor for secreted frizzled-related protein-2 activation of nuclear factor of activated T-cells c3 signaling to promote angiogenesis, Angiogenesis 20: ((2017) ), 615–628. |
[26] | E. Cerami, J. Gao, U. Dogrusoz, B.E. Gross, S.O. Sumer, B.A. Aksoy, A. Jacobsen, C.J. Byrne, M.L. Heuer, E. Larsson, Y. Antipin, B. Reva, A.P. Goldberg, C. Sander and N. Schultz, The cBio cancer genomics portal: an open platform for exploring multidimensional cancer genomics data, Cancer Discov 2: ((2012) ), 401–4. |
[27] | J. Gao, B.A. Aksoy, U. Dogrusoz, G. Dresdner, B. Gross, S.O. Sumer, Y. Sun, A. Jacobsen, R. Sinha, E. Larsson, E. Cerami, C. Sander and N. Schultz, Integrative analysis of complex cancer genomics and clinical profiles using the cBioPortal, Sci Signal 6: ((2013) ), pl1. |
[28] | Z. Tang, C. Li, B. Kang, G. Gao, C. Li and Z. Zhang, GEPIA: a web server for cancer and normal gene expression profiling and interactive analyses, Nucleic Acids Res 45: ((2017) ), W98–W102. |
[29] | M. Uhlen, C. Zhang, S. Lee, E. Sjostedt, L. Fagerberg, G. Bidkhori, R. Benfeitas, M. Arif, Z. Liu, F. Edfors, K. Sanli, K. von Feilitzen, P. Oksvold, E. Lundberg, S. Hober, P. Nilsson, J. Mattsson, J.M. Schwenk, H. Brunnstrom, B. Glimelius, T. Sjoblom, P.H. Edqvist, D. Djureinovic, P. Micke, C. Lindskog, A. Mardinoglu and F. Ponten, A pathology atlas of the human cancer transcriptome, Science 357: ((2017) ). |
[30] | in: ESTIMATE: Estimation of STromal and Immune cells in MAlignant Tumor tissues using Expression data. |
[31] | X. Wang, S. Allen, J.F. Blake, V. Bowcut, D.M. Briere, A. Calinisan, J.R. Dahlke, J.B. Fell, J.P. Fischer, R.J. Gunn, J. Hallin, J. Laguer, J.D. Lawson, J. Medwid, B. Newhouse, P. Nguyen, J.M. O’Leary, P. Olson, S. Pajk, L. Rahbaek, M. Rodriguez, C.R. Smith, T.P. Tang, N.C. Thomas, D. Vanderpool, G.P. Vigers, J.G. Christensen and M.A. Marx, Identification of MRTX1133, a Noncovalent, Potent, and Selective KRAS(G12D) Inhibitor, J Med Chem 65: ((2022) ), 3123–3133. |
[32] | S.A. Sastra and K.P. Olive, Quantification of murine pancreatic tumors by high-resolution ultrasound, Methods Mol Biol 980: ((2013) ), 249–66. |
[33] | Y. Ma, H. Zhang, C. Xiong, Z. Liu, Q. Xu, J. Feng, J. Zhang, Z. Wang and X. Yan, CD146 mediates an E-cadherin-to-N-cadherin switch during TGF-beta signaling-induced epithelial-mesenchymal transition, Cancer Lett 430: ((2018) ), 201–214. |
[34] | S. Islam, T.E. Carey, G.T. Wolf, M.J. Wheelock and K.R. Johnson, Expression of N-cadherin by human squamous carcinoma cells induces a scattered fibroblastic phenotype with disrupted cell-cell adhesion, J Cell Biol 135: ((1996) ), 1643–54. |
[35] | S. Nakajima, R. Doi, E. Toyoda, S. Tsuji, M. Wada, M. Koizumi, S.S. Tulachan, D. Ito, K. Kami, T. Mori, Y. Kawaguchi, K. Fujimoto, R. Hosotani and M. Imamura, N-cadherin expression and epithelial-mesenchymal transition in pancreatic carcinoma, Clin Cancer Res 10: ((2004) ), 4125–33. |
[36] | F.Z. Gharbia, A.S. Abouhashem, Y.A. Moqidem, A.A. Elbaz, A. Abdellatif, K. Singh, C.K. Sen and H.M.E. Azzazy, Adult skin fibroblast state change in murine wound healing, Sci Rep 13: ((2023) ), 886. |
[37] | M. Guo, K.M. Goudarzi, S. Abedi, M. Pieber, E. Sjoberg, J. Behnan, X.M. Zhang, R.A. Harris, J. Bartek, M.S. Lindstrom, M. Nister and D. Hagerstrand, SFRP2 induces a mesenchymal subtype transition by suppression of SOX2 in glioblastoma, Oncogene 40: ((2021) ), 5066–5080. |
[38] | Y. Sun, D. Zhu, F. Chen, M. Qian, H. Wei, W. Chen and J. Xu, SFRP2 augments WNT16B signaling to promote therapeutic resistance in the damaged tumor microenvironment, Oncogene 35: ((2016) ), 4321–34. |
[39] | K.P. Olive, M.A. Jacobetz, C.J. Davidson, A. Gopinathan, D. McIntyre, D. Honess, B. Madhu, M.A. Goldgraben, M.E. Caldwell, D. Allard, K.K. Frese, G. Denicola, C. Feig, C. Combs, S.P. Winter, H. Ireland-Zecchini, S. Reichelt, W.J. Howat, A. Chang, M. Dhara, L. Wang, F. Ruckert, R. Grutzmann, C. Pilarsky, K. Izeradjene, S.R. Hingorani, P. Huang, S.E. Davies, W. Plunkett, M. Egorin, R.H. Hruban, N. Whitebread, K. McGovern, J. Adams, C. Iacobuzio-Donahue, J. Griffiths and D.A. Tuveson, Inhibition of Hedgehog signaling enhances delivery of chemotherapy in a mouse model of pancreatic cancer, Science 324: ((2009) ), 1457–61. |
[40] | A. De Jesus-Acosta, E.A. Sugar, P.J. O’Dwyer, R.K. Ramanathan, D.D. Von Hoff, Z. Rasheed, L. Zheng, A. Begum, R. Anders, A. Maitra, F. McAllister, N.V. Rajeshkumar, S. Yabuuchi, R.F. de Wilde, B. Batukbhai, I. Sahin and D.A. Laheru, Phase 2 study of vismodegib, a hedgehog inhibitor, combined with gemcitabine and nab-paclitaxel in patients with untreated metastatic pancreatic adenocarcinoma, Br J Cancer 122: ((2020) ), 498–505. |
[41] | A.H. Ko, N. LoConte, M.A. Tempero, E.J. Walker, R. Kate Kelley, S. Lewis, W.C. Chang, E. Kantoff, M.W. Vannier, D.V. Catenacci, A.P. Venook and H.L. Kindler, A Phase I Study of FOLFIRINOX Plus IPI-926, a Hedgehog Pathway Inhibitor, for Advanced Pancreatic Adenocarcinoma, Pancreas 45: ((2016) ), 370–5. |
[42] | D. Melisi, R. Garcia-Carbonero, T. Macarulla, D. Pezet, G. Deplanque, M. Fuchs, J. Trojan, H. Oettle, M. Kozloff, A. Cleverly, C. Smith, S.T. Estrem, I. Gueorguieva, M.M.F. Lahn, A. Blunt, K.A. Benhadji and J. Tabernero, Galunisertib plus gemcitabine vs. gemcitabine for first-line treatment of patients with unresectable pancreatic cancer, Br J Cancer 119: ((2018) ), 1208–1214. |
[43] | J.E. Murphy, J.Y. Wo, D.P. Ryan, J.W. Clark, W. Jiang, B.Y. Yeap, L.C. Drapek, L. Ly, C.V. Baglini, L.S. Blaszkowsky, C.R. Ferrone, A.R. Parikh, C.D. Weekes, R.D. Nipp, E.L. Kwak, J.N. Allen, R.B. Corcoran, D.T. Ting, J.E. Faris, A.X. Zhu, L. Goyal, D.L. Berger, M. Qadan, K.D. Lillemoe, N. Talele, R.K. Jain, T.F. DeLaney, D.G. Duda, Y. Boucher, C. Fernandez-Del Castillo and T.S. Hong, Total Neoadjuvant Therapy With FOLFIRINOX in Combination With Losartan Followed by Chemoradiotherapy for Locally Advanced Pancreatic Cancer: A Phase 2 Clinical Trial, JAMA Oncol 5: ((2019) ), 1020–1027. |
[44] | B.C. Ozdemir, T. Pentcheva-Hoang, J.L. Carstens, X. Zheng, C.C. Wu, T.R. Simpson, H. Laklai, H. Sugimoto, C. Kahlert, S.V. Novitskiy, A. De Jesus-Acosta, P. Sharma, P. Heidari, U. Mahmood, L. Chin, H.L. Moses, V.M. Weaver, A. Maitra, J.P. Allison, V.S. LeBleu and R. Kalluri, Depletion of carcinoma-associated fibroblasts and fibrosis induces immunosuppression and accelerates pancreas cancer with reduced survival, Cancer Cell 25: ((2014) ), 719–34. |


