
Predicting pancreatic ductal adenocarcinoma using artificial intelligence analysis of pre-diagnostic computed tomography images
Abstract
BACKGROUND:
Early stage diagnosis of Pancreatic Ductal Adenocarcinoma (PDAC) is challenging due to the lack of specific diagnostic biomarkers. However, stratifying individuals at high risk of PDAC, followed by monitoring their health conditions on regular basis, has the potential to allow diagnosis at early stages.
OBJECTIVE:
To stratify high risk individuals for PDAC by identifying predictive features in pre-diagnostic abdominal Computed Tomography (CT) scans.
METHODS:
A set of CT features, potentially predictive of PDAC, was identified in the analysis of 4000 raw radiomic parameters extracted from pancreases in pre-diagnostic scans. The naïve Bayes classifier was then developed for automatic classification of CT scans of the pancreas with high risk for PDAC. A set of 108 retrospective CT scans (36 scans from each healthy control, pre-diagnostic, and diagnostic group) from 72 subjects was used for the study. Model development was performed on 66 multiphase CT scans, whereas external validation was performed on 42 venous-phase CT scans.
RESULTS:
The system achieved an average classification accuracy of 86% on the external dataset.
CONCLUSIONS:
Radiomic analysis of abdominal CT scans can unveil, quantify, and interpret micro-level changes in the pre-diagnostic pancreas and can efficiently assist in the stratification of high risk individuals for PDAC.
1.Introduction
Pancreatic Ductal Adenocarcinoma (PDAC) is lethal cancer accounting for over 90% of pancreatic cancer (PC) cases [1, 2, 3]. Although having a relatively low incidence rate, it is currently the 4
Identifying individuals at high risk of developing PDAC in the future has the potential to allow early stage diagnosis through follow-up monitoring of their health conditions on a regular basis using specialized surveillance systems [15, 16, 17]. However, it is a challenging task because of the lack of specific symptoms and biomarkers during development of PDAC. Patients usually experience abdominal pain, unexplained weight loss, or jaundice at an early stage or during the development of PDAC but do not usually undergo PDAC screening as these conditions are also associated with a broad range of other diseases [2, 15, 16, 17, 18]. According to the Centers for Disease Control and Prevention (CDC), abdominal pain is the single most common reason that American patients visit the emergency room (ER), accounting for 7 million visits per year. Most patients with abdominal disorders undergo abdominal CT imaging where these patients are deemed negative as evaluated by a radiologist-though some of these patients eventually develop PDAC. Although several empirical studies link PDAC incidence with many preconditioning abnormalities that cause alterations to pancreatic morphology that is visible on CT scans. For example, several complications that are linked to PDAC including distal parenchymal atrophy [19], intraductal papillary mucinous neoplasms of the pancreas [20], intraductal calculi, or Pancreatolithiasis [21] progressively increase tissue heterogeneity of the pancreas on a CT scan. Furthermore, pancreatic inflammation [22] and ductal dilation [23] cause shape and size deformation of the pancreas. However, such micro-level variations are difficult to comprehend by visual assessment.
AI is the primary choice to perform prediction modeling for several cancers [4, 24, 25]. AI-based systems almost always surpass traditional manual approaches. The tremendous advancements in AI in recent years, particularly in the realm of medical image processing and analysis, offer an enormous range of automated tools for extracting precise measurements of biomarkers and organs, unveiling complex features, and quantifying tissue characteristics. Radiomic analysis [26], machine learning [27], and deep learning [24, 25] are considered the most reliable and frequently utilized AI approaches for prediction modeling. Although imaging has not been explicitly used for PDAC prediction, however, due to the recent advancement in image acquisition devices, image processing techniques, and image analysis tools, imaging can be the foundation for a sophisticated prediction system for PDAC.
In this study, we identified unique features in pre-diagnostic CT scans that are not appreciated by human eyes but are potentially predictive of PDAC and developed a classifier that performed PDAC prediction by automatically identifying pre-diagnostic scans when mixed with healthy control scans. The proposed model is highly stable, and results are satisfactory, encoring researchers to replicate the model for further validation on large dataset.
2.Study material
Using a highly specific inclusion/exclusion criterion, three types of contrast-enhanced abdominal CT scans were included in the study:
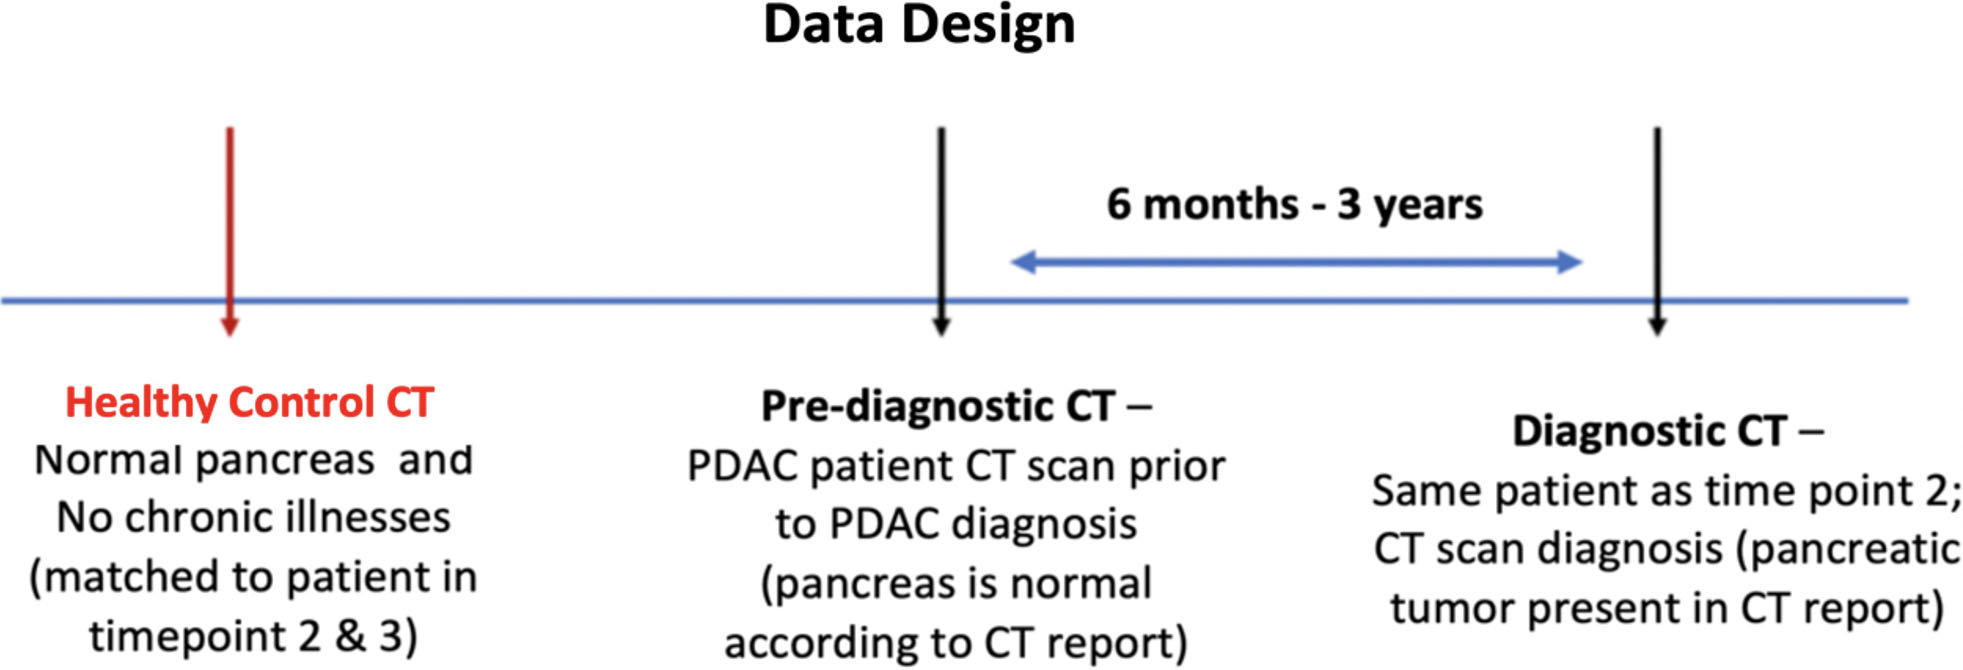
• Diagnostic: A CT scan of a patient with histopathologically confirmed PDAC and visible tumor on a CT scan. Patients with any type of pancreatectomy were excluded from this group.
• Pre-diagnostic: A CT scan from the same patient (as in the Diagnostic group), acquired between 6 months to 3 years prior to PDAC diagnosis, when no sign of PDAC or tumor was present.
• Healthy control: A contrast-enhanced abdominal CT scan of a different subject whose pancreas was healthy. The age and gender of each subject in the healthy control group and the year of their scan were matched to those of exactly one unique patient in the pre-diagnostic group to limit morphological and instrumentation variabilities, respectively. Healthy controls were not matched to patients by gender as studies show no proof of morphological differences between genders. All scans in pre-diagnostic and healthy control group were originally acquired for non-gastrointestinal disorders, fall, slip, or vehicle accident. However, the healthy control group did not develop PDAC in the next 3 years. A pictorial description of the data structure is given in Fig. 1.
Figure 1.
Proposed design of the data for the study. Each case in the dataset consists of three types of abdominal CT scans: Healthy control, Pre-diagnostic, and Diagnostic. The Pre-diagnostic and Diagnostic scans were obtained from the same patient.
Two centers in Los Angeles, California including Cedars-Sinai Medical Center (CSMC) and Southern California Kaiser Permanente Medical Center (KPMC) provided eligible data for this study in accordance with the IRB as well as a material transfer agreement. Informed consent was waived as the study design is retrospective. All data was anonymized and securely transferred to the host department (CSMC) using SFTP (Secure File Transfer Protocol). A total of 108 CT scans of 72 subjects were obtained at two centers with the following split:
• Internal dataset: consists of 66 contrast-enhanced abdominal CT scans (22 healthy control, 22 pre-diagnostic, 22 diagnostic) from 44 subjects, obtained at CSMC. Of 66 scans, 58 (22 healthy control, 17 pre-diagnostic, 19 diagnostic) belong to the portal venous phase, whereas the other 8 scans belong to multiple CT phases including arterial, excretory, and interleaved phase. For PDAC diagnosis and early symptoms, portal venous phase is considered the most valuable phase as PDAC tumors consume contrast slowly and the portal venous phase optimizes viewing the margins of the tumor. Also, all vessels running through or adjacent to the pancreas as well as the pancreatic duct can be seen in this phase. During PDAC development, morphological changes to the pancreas may be observed in these vessels and thus can be regarded as PDAC predictors.
Nevertheless, the non-venous phases cannot be completely ignored as these offer unique value at times. For instance, the arterial phase efficiently evaluates arterial encasement and distortion of the arteries by the pancreatic tumor and is used for resection planning. Also, arterial enhancing lesions such as PNET (a potential PDAC predictor) are more commonly seen during the arterial phase. Thus, considering scans with non-venous phases provided the opportunity to identify highly generalizable predictors and to make the model robust.
• External dataset: consists of 42 contrast-enhanced abdominal CT scans (14 healthy control, 14 pre-diagnostic, 14 diagnostic) from 28 different subjects obtained at KPMC. All scans belong to the portal venous phase. This set was used to perform an external validation of the developed prediction model.
All scans obtained were of sufficiently high quality with a slice resolution of 512 by 512 in the x- and y-axis. The CT signal intensities in all scans were normalized to unity. Smoothing or interpolation of the original Hounsfield unit values or any other preprocessing was not performed on scans. A trained CSMC radiologist and a gastroenterologist, with extensive experience of examining abdominal scans, manually outlined the pancreas in each slice of all 108 CT scans with consensus. Any information derived from the radiology report was removed from the scans to avoid labeling biases. To minimize potential inter-reader variability, both readers first independently outlined the pancreas in all scans, then shared the labels with each other and re-assessed their initial labels. Any outlining disagreements were discussed and resolved. The labeling process does not include outlining the pancreatic tumor or other lesions in diagnostic scans. Labeling was performed using a commercially available software ITK-Snap [28] and exported as a DICOM dataset.
3.Methods
A model was developed to stratify individuals at high risk for PDAC by automatically identifying pre-diagnostic CT scans. A large number of features, potentially predictive of PDAC, were identified through radiomic analysis of scans of the internal dataset. The Naïve Bayes classifier was then trained using the identified predictors to perform automatic classification of CT scans into either healthy control or pre-diagnostic group. External validation was performed using the external dataset. The identified predictors were observed to be highly stable when examined against scans of the external dataset. Method details are given in the following sections.
3.1Extraction of radiomic features
Several thousand radiomic features were extracted from the outlined whole pancreas in all 66 scans of the discovery set, i.e., three sets of features were obtained – one for each of the healthy control, pre-diagnostic, and diagnostic scan groups. Each radiomic feature represented a unique CT image characteristic of the pancreas and was expressed as a single numerical value calculated using a standard pre-defined mathematical formula. For example, to extract the intensity of the pancreas, the mean grey level values of all voxels in the outlined boundary of the pancreas in all slices of a three-dimensional (volumetric) pancreatic CT scan were considered. Using different combinations of three parameters (Bin size, Kernel size, Angle), we extracted 4000 radiomic features from each of the 66 scans. For each feature, the whole pancreas was considered as a single region of interest.
Common types of features extracted included FOS (First Order Statistics), e.g., energy, entropy, and skewness, GLCM (Grey-level Co-occurrence Matrix statistics), e.g., second-order statistics such as contrast, heterogeneity, cluster prominence, cluster tendency, and gaussian polar, and GLRLM (Grey Level Run Length Matrix statistics), e.g., long and short-run grey level emphasis, normalized grey level non-uniformity. Prior to extracting any feature, three significantly important radiomic parameters including Bin size (to discretize the CT image into equal bins), Kernel size (to specify the neighborhood around a voxel before calculating spatial relationships of voxel
3.2Identification of potential PDAC predictors
A two-step statistical analysis was performed on the obtained three feature sets to identify potentially predictive feature as follows:
1. The statistical Student’s
2. During progression towards PDAC development, any feature that shows incremental or decremental trends can be highly predictive. For example, it is observed that texture heterogeneity of the pancreas on CT increases as we go from healthy control to pre-diagnostic and diagnostic. Therefore, the identified significant features were further filtered to those having mean values either kept increasing or decreasing in the order of heathy control, pre-diagnostic and diagnostic group.
3.3Stratification of high-risk individuals for PDAC
The PDAC prediction modeling was expressed as a binary classification problem where a pancreas, based on its CT features, can be categorized into either healthy control or pre-diagnostic group. Given that the purpose of the prediction model is to distinguish between healthy control and pre-diagnostic scans, the reason for including diagnostic scans into the predictors’ selection phase was to help identify highly stable features. Training the classifier with such features will assist in avoiding situations when a scan with developed PDAC is misclassified as healthy control or when the duration between a pre-diagnostic and a diagnostic scan is different than those obtained for the current study.
To train the classifier, the Recursive Feature Elimination (RFE) [29, 30] method was used in conjunction with Naïve Bayes (NB) classifier to eliminate the weak features (predictors) from all the features, identified in the two-step analysis, during the classifier training and compared with the overall training accuracies achieved by the classifier using different combinations of features. We fixed the number of features selected by the classifier up to a maximum of 5 to avoid overfitting of the model while maximizing the classification accuracy. The RFE-NB identified five radiomic features (Long-run low grey-level emphasis, Inverse cluster shade, Inverse cluster prominence, Inverse cluster tendency, Short-run low grey-level emphasis) which the classifier used to produce the highest classification accuracy on the training set. All five features show an incremental trend.
4.Results and discussion
4.1Model evaluation
The identification of PDAC predictors through radiomic analysis validated our primary hypothesis about the presence of precursor indicators in CT scans prior to PDAC development.
The developed classifier was validated on all the scans of the external set in two steps. In the first step, all 42 scans of the external set were examined if these demonstrate incremental trends for all five selected features. All five features were observed to be increasing in the order of healthy control, pre-diagnostic and diagnostic group, justifying that the selected features for PDAC prediction are highly stable.
Secondly, the classifier was tested using 28 scans (14 healthy control, 14 pre-diagnostic) of the external set. Using the selected predictors, the classifier automatically classified 28 scans into their respective groups with the mean classification accuracy of achieved are 86% (24/28), whereas the classification accuracy is the number of successfully classified scans to the total number of scans used for testing. The confusion matrix for validation is given in Table 1. Despite the limited amount of data for training, the performance of the system remained consistent during validation and produced highly satisfactory results. The study findings and the results of the proposed classifier are promising and justify proof of concept-encouraging researchers to replicate and validate the proposed model on larger datasets.
Table 1
Confusion matrix for classification of 28 CT scans of the external set consisting of 14 from each of healthy control and pre-diagnostic group. Numbers in the green blocks show true positives
| True healthy | True pre-diagnostic | |
|---|---|---|
| Predicted healthy | 13 | 3 |
| Predicted pre-diagnostic | 1 | 11 |
4.2Data structure for study
The foundation of this project lies in the unique data structure, which allows us to retrospectively examine the imaging features in pre-diagnostic images. With the certainty that at least 50% of the enrolled subjects developed PDAC after pre-diagnostic imaging, a relatively small number of cases was sufficient to develop the prediction model. The lack of specific and well-established pre-cancerous indicators for PDAC leads to the unavailability of scans, explicitly performed for pancreas-related issues before PDAC developed. Thus, we proposed to obtain pre-diagnostic scans by searching through patients’ records with established PDAC, followed by finding scans of the same patients, originally obtained for non-pancreatic issues at least 3–6 months prior to PDAC development and consider them as pre-diagnostic scans. To our knowledge, the proposed data structure has not been used previously for any PDAC prediction model.
4.3Study contribution
According to the Centers for Disease Control and Prevention (CDC), abdominal pain is the single most common reason that American patients visit the emergency room (ER), accounting for 7 million visits per year. The current standard of care protocol indicates that patients experiencing abdominal pain undergo a CT scan. Even though most scans don’t show any signs of cancer was diagnosed by the radiologists, some subjects eventually develop PDAC in the next few years. These pre-diagnostic CT images provide critical morphological information associated with precancerous or early cancer biological changes which can be extracted using AI to predict PDAC risk. The main challenge of exploring AI-based methods for the advancement of pancreatic cancer research is the scarcity of data due to cancer’s low prevalence. This retrospective study allowed us to examine the quantitative image feature differences between pre-diagnostic and healthy control CT scans to overcome the low prevalence and low cancer yield limitation in prospective studies as half of the subjects have cancer.
Supported by all this evidence, the current study design guarantees the correct choice and right combination of imaging modality, feature extraction, analysis methods, and modeling algorithm for the best possible approach to address the prediction issues and ultimately increases the ratio of PDAC diagnosis at early stages. To the best of our knowledge, it is the first time CT-based predictors of PDAC were discovered that express irregularities at the tissue microlevel of the pancreas and used in an automated system to efficiently predict PDAC.
4.4Limitations and future work
Although the data repositories of both CSMC and KPMC were explored exhaustively, the amount of eligible data found was low as the pre-diagnostic scans are rarely available. Analysis on a limited dataset might suffer an overfitting problem. However, the purpose of the current study was to have proof of the concept and to encourage researchers to establish a large dataset with a collaboration for extensive training and validation of the model. A large dataset will also allow performing a biological interpretation of predictors and forming their correlation with genetic heterogeneity. A rigorous model can be a supporting tool in prospective studies and will help to increase the rate of diagnosis at an early stage.
Author contributions
Conception: TA Qureshi, SJ Pandol, D Li
Interpretation or analysis of data: TA Qureshi, S Gaddam, AM Wachsman, L Wang, L Azab, V Asadpour, W Chen, Y Xie, B Wu, SJ Pandol, D Li
Preparation of the manuscript: TA Qureshi, S Gaddam, AM Wachsman, L Wang, L Azab, V Asadpour, W Chen, Y Xie, B Wu, SJ Pandol, D Li
Revision for important intellectual content: TA Qureshi, S Gaddam, L Wang, W Chen, Y Xie, B Wu, SJ Pandol, D Li
Supervision: SJ Pandol, D Li
References
[1] | A. Adamska, A. Domenichini and M. Falasca, Pancreatic ductal adenocarcinoma: Current and evolving therapies, International Journal of Molecular Sciences 18: (7) ((2017) ), 1338. |
[2] | B.M. Nolen, R.E. Brand, D. Prosser et al., Prediagnostic serum biomarkers as early detection tools for pancreatic cancer in a large prospective cohort study, PLoS One 9: (4) ((2014) ). |
[3] | P.P. Almeida, C.P. Cardoso and L.M. de Freitas, PDAC-ANN: An artificial neural network to predict pancreatic ductal adenocarcinoma based on gene expression, BMC Cancer 20: (1) ((2020) ), 1–11. |
[4] | W. Muhammad, G.R. Hart, B. Nartowt et al., Pancreatic cancer prediction through an artificial neural network, Frontiers in Artificial Intelligence, (2019) , 2. |
[5] | R. Pannala, A. Basu, G.M. Petersen and S.T. Chari, New-onset diabetes: A potential clue to the early diagnosis of pancreatic cancer, Lancet Oncology 10: (1) ((2009) ), 88–95. |
[6] | A.P. Klein, S. Lindström, J.B. Mendelsohn et al., An absolute risk model to identify individuals at elevated risk for pancreatic cancer in the general population, PLOS ONE 8: (9) ((2013) ), e72311. |
[7] | B. Boursi, B. Finkelman, B.J. Giantonio et al., A clinical prediction model to assess risk for pancreatic cancer among patients with new-onset diabetes, Gastroenterology 152: (4) ((2017) ), 840–850. |
[8] | Key Statistics for Pancreatic Cancer. https://www.cancer.org/cancer/pancreatic-cancer/about/key-statistics.html. |
[9] | J. Kleeff, M. Korc, M. Apte et al., Pancreatic cancer, Nature Reviews Disease Primers 2: (1) ((2016) ), 1–22. |
[10] | M. Orth, P. Metzger, S. Gerum et al., Pancreatic ductal adenocarcinoma: Biological hallmarks, current status, and future perspectives of combined modality treatment approaches, Radiation Oncology 14: (1) ((2019) ), 1–20. |
[11] | A. Stark and G. Eibl, Pancreatic Ductal Adenocarcinoma, Pancreapedia: The Exocrine Pancreas Knowledge Base, (2015) May 19. |
[12] | S. Kaur, M.J. Baine, M. Jain, A.R. Sasson et al., Early diagnosis of pancreatic cancer: Challenges and new developments, Biomarkers in Medicine 6: (5) ((2012) ), 597–612. |
[13] | D. Ansari, L. Aronsson, A. Sasor et al., The role of quantitative mass spectrometry in the discovery of pancreatic cancer biomarkers for translational science, Journal of Translational Medicine 12: (1) ((2014) ), 1–15. |
[14] | S. Egawa, K. Takeda, S. Fukuyama et al., Clinicopathological aspects of small pancreatic cancer, Pancreas 28: (3) ((2004) ), 235–240. |
[15] | A.D. Singhi, E.J. Koay, S.T. Chari and A. Maitra, Early detection of pancreatic cancer: Opportunities and challenges, Gastroenterology 156: (7) ((2019) ), 2024–2040. |
[16] | A. Sharma, H. Kandlakunta, S.J.S. Nagpal et al., Model to determine risk of pancreatic cancer in patients with new-onset diabetes, Gastroenterology 155: (3) ((2018) ), 730–739. |
[17] | P.A. Hart, Early detection of pancreatic cancer in high-risk individuals: Where do we go from here, American Journal of Gastroenterology 114: (4) ((2019) ), 560–561. |
[18] | A.F. Hezel, A.C. Kimmelman, B.Z. Stanger et al., Genetics and biology of pancreatic ductal adenocarcinoma, Genes and Development 20: (10) ((2006) ), 1218–1249. |
[19] | S.S. Ahn, M-J. Kim, J.Y. Choi et al., Indicative findings of pancreatic cancer in prediagnostic CT, European Radiology 19: (10) ((2009) ), 2448–2455. |
[20] | N.O. Machado, H. al Qadhi and K. al Wahibi, Intraductal papillary mucinous neoplasm of pancreas, North American Journal of Medicine Sciences 7: (5) ((2015) ), 160–175. |
[21] | K. Konishi, R. Izumi and O. Kato, Experimental pancreatolithiasis in the dog, Surgery 89: (6) ((1981) ), 687–691. |
[22] | B. Farrow and B.M. Evers, Inflammation and the development of pancreatic cancer, Surgical Oncology 10: (4) ((2002) ), 153–169. |
[23] | S. Tanaka, A. Nakaizumi, T. Ioka et al., Main pancreatic duct dilatation: A sign of high risk for pancreatic cancer, Japanese Journal of Clinical Oncology 32: (10) ((2002) ), 407–411. |
[24] | M. Payandeh, M. Aeinfar, V. Aeinfar and M. Hayati, A New Method for Diagnosis and Predicting Blood Disorder and Cancer Using Artificial Intelligence (Artificial Neural Networks), International Journal of Hematology-Oncology and Stem Cell Research, (2009) , 25–33. |
[25] | D. Roffman, G. Hart, M. Girardi et al., Predicting non-melanoma skin cancer via a multi-parameterized artificial neural network, Scientific Reports 8: (1) ((2018) ), 1–7. |
[26] | R.J. Gillies, P.E. Kinahan and H. Hricak, Radiomics: Images are more than pictures, they are data, Radiology 278: (2) ((2016) ), 563–577. |
[27] | F. Commandeur, P.J. Slomka, M. Goeller et al., Machine learning to predict the long-term risk of myocardial infarction and cardiac death based on clinical risk, coronary calcium, and epicardial adipose tissue: A prospective study, Cardiovasc Research 116: (14) ((2020) ), 2216–2225. |
[28] | P.A. Yushkevich, J. Piven, H.C. Hazlett et al., User-guided 3D active contour segmentation of anatomical structures: Significantly improved efficiency and reliability, Neuroimage 31: (3) ((2006) ), 1116–1128. |
[29] | P.M. Granitto, C. Furlanaello, F. Biasioli et al., Recursive feature elimination with random forest for PTR-MS analysis of agroindustrial products, Chemometrics Intelligent Laboratory System 83: (2) ((2006) ), 83–90. |
[30] | K. Yan and D. Zhang, Feature selection and analysis on correlated gas sensor data with recursive feature elimination, Sensors and Actuators B Chemical 212: ((2015) ), 353–363. |

