GR silencing impedes the progression of castration-resistant prostate cancer through the JAG1/NOTCH2 pathway via up-regulation of microRNA-143-3p
Abstract
BACKGROUND:
Despite notable progression from a therapeutic point of view, castration resistant prostate cancer (CRPC) remains a clinical significant stumbling block. The current study aimed to elucidate the functional role of the gene glucocorticoid receptor (GR) in CRPC, and identify the contributions of the GR gene in CRPC in connection with microRNA-143-3p (miR-143-3p)/Jagged1 (JAG1)/NOTCH2.
METHODS:
The expression of GR and miR-143-3p in CRPC tissues and cells as well as JAG1/NOTCH2 expression in CRPC tissues was initially determined by quantitative polymerase chain reaction and Western blot analyses. The relationship among GR, JAG1, NOTCH2 and miR-143-3p was subsequently verified using the dual-luciferase reporter gene assay. ChIP assay confirmed the binding of GR to miR-143-3p promoter. Gain- and loss-function approaches were applied to ascertain the role of GR and miR-143-3p in progression of CRPC. Additionally, xenograft tumor models in nude mice were established to further confirm our results.
RESULTS:
GR was found to be highly expressed while miR-143-3p was lowly expressed in the CRPC tissues and cells. Silencing GR reduced migration, invasion, proliferation and increased apoptosis of CRPC cells. GR was enriched in the miR-143-3p promoter region and could down-regulate miR-143-3p expression. The overexpression of miR-143-3p led to a reduction in the migration, invasion, proliferation and increased apoptosis of CRPC cells. JAG1 and NOTCH2 were the target genes of miR-143-3p, and GR up-regulated the JAG1/NOTCH2 expression by down-regulating miR-143-3p. Silencing JAG1/NOTCH2 inhibited epithelial-mesenchymal transition and CRPC progression in vitro. Furthermore, the in vitro findings were reproduced in the in vivo experiments.
CONCLUSION:
The key findings of the current study demonstrated that silencing GR suppressed the progression of CRPC through the JAG1/NOTCH2 pathway via up-regulation of miR-143-3p.
1.Introduction
Prostate cancer is widely regarded as the foremost malignancy afflicting males worldwide, with studies indicating nearly 1.3 million new cases and 359,000 related deaths worldwide in 2018 [1, 2]. Androgen deprivation therapy (ADT) is a commonly used treatment method for symptomatic prostate cancer, often resulting in reduced levels of prostate-specific antigen [3]. Although most patients suffering from metastatic prostate cancer can benefit from ADT, almost all patients will develop castration-resistant prostate cancer (CRPC) approximately 18 to 24 months on average [4]. CRPC, formerly known as hormone-resistant prostate cancer, is now regarded as a form of progressive disease in spite of medical or surgical castration [5]. Commendable achievements have been made in relation to the drug treatment of CRPC, including sipuleucel-T, abiraterone acetate, and cabazitaxel, but the poor prognosis of patients with CRPC is still a major treatment challenge [6, 7].
Glucocorticoid receptor (GR) represents a member of the superfamily of nuclear receptor transcription factors and has anti-proliferative and anti-apoptotic functions [8]. Previous research has highlighted increased expression and activity of GR in the progression of CRPC following androgen blockade [9]. Interestingly, investigation of dysregulated microRNAs (miRNAs) in CRPC has provided the possibility of new prognostic models for improving treatment success [10]. The crucial roles of miRNAs in cell proliferation and differentiation through modulation of the expression of specific genes have been demonstrated [11]. Recent literature has demonstrated that miR-143 suppresses prostate cancer cell proliferation, and migration, yielding a potential novel candidate for the treatment of prostate cancer [12]. Moreover, miR-143-3p has also been confirmed to exert anti-tumor effects in a variety of cancers, such as breast cancer and ovarian cancer [13, 14]. Although miR-143-3p has been identified as a down-regulated miRNA in metastatic prostate cancer [15], the role and mechanism by which miR-143-3p acted to affect cancer progression in this malignancy remains to be defined.
The application of a dual-luciferase reporter gene assay in our study suggested that Jagged1 (JAG1) and NOTCH2 were the targets of miR-143-3p. Notch signaling pathway plays an indispensable role in tissue development, and its ability to modulate cell growth and development has been elucidated to be correlated with the development of certain cancers, including prostate cancer [16]. JAG1, a ligand of the Notch signaling pathway, has also been reported to be associated with prostate cancer in a positive manner [17]. Following the aforementioned exploration of literature, the current study aimed to further elucidate the functional role of the gene GR in CRPC in connection with miR-143-3p/JAG1/NOTCH2.
2.Materials and methods
2.1Ethics statement
All samples were donated with the informed consent of patients, and the present study was conducted in accordance with the Declaration of Helsinki. The study protocol was approved by the Ethics Committee of the First People’s Hospital of Yunnan Province. Animal use and experimental procedures were performed with the approval of the Experimental Animal Ethics Committee of the First People’s Hospital of Yunnan Province. All efforts were made to reduce the suffering of animals.
2.2Sample collection
A total of 63 patients with prostate cancer hospitalized at the First People’s Hospital of Yunnan Province between 2016 and 2018 were recruited for sample collection. There were 32 patients with CRPC and 31 patients with androgen dependent prostate cancer (ADPC). Each specimen was histologically identified by prostate specific antigen staining [18].
Table 1
Primer sequences for RT-qPCR
| Gene | Sequences |
|---|---|
| GR (human) | F: 5’-CTGTCGCTTCTCAATCAGACTC-3’ |
| R: 5’-CCCAGGTCATTTCCCATCACTT-3’ | |
| miR-143-3p (human) | RT: 5’-GTCGTATCCAGTGCGTGTCGTGGAGTCGGCAATTGCACTGGATACGACTGAGCTA-3’ |
| F: 5’-AGTGCGTGTCGTGGAGTC-3’ | |
| R: 5’-GCCTGAGATGAAGCACTGT-3’ | |
| JAG1 (human) | F: 5’-TCGGGTCAGTTCGAGTTGGA-3’ |
| R: 5’-CGTTCACGTTCTGCATGGAC-3’ | |
| NOTCH2 (human) | F: 5’-AATCCCTGACTCCAGAACG-3’ |
| R: 5’-TGGTAGACCAAGTCTGTGATGAT-3’ | |
| U6 (human) | F: 5’-CTCGCTTCGGCAGCACA-3’ |
| R: 5’-AACGCTTCACGAATTTGCGT-3’ | |
| GAPDH (human) | F: 5’-ACCCAGAAGACTGTGGATGG-3’ |
| R: 5’-TCTAGACGGCAGGTCAGGTC-3’ | |
| miR-143-3p (mouse) | RT: 5’-CTCAACTGGTGTCGTGGAGTCGGCAATTCAGTTGAGACCAGAGA-3’ |
| F: 5’-ACACTCCAGCTGGGGGTGCAGTGCTGCATC-3’ | |
| R: 5’-TGGTGTCGTGGAGCCG-3’ | |
| U6 (mouse) | F: 5’-CTCGCTTCGGCAGCACA-3’ |
| R: 5’-GTCGTATCCAGTGCAGGTCCGAGGTATTCGCACTGGATACGACTCATCT-3’ |
Note: RT-qPCR, reverse transcription-quantitative polymerase chain reaction; F, forward; R, reverse; RT, reverse transcription; miR, microRNA; JAG1, Jagged 1; GAPDH, glyceraldehyde-3-phosphate dehydrogenase.
2.3CRPC cell culture and transfection
Human prostate cancer cell line LNCaP purchased from BNCC cell bank was cultured in Eagle’s Mem Ebss Minimum Essential Medium containing 10% fetal bovine serum (FBS) and 1% penicillin/streptomycin at 37
Based on the sequences of GR, miR-143-3p, JAG1 and NOTCH2 known in National Center for Biotechnology Information, plasmids needed for the experiment were synthesized by Shanghai Sangon Biotech Co., Ltd., (Shanghai, China). Enz-LNCaP cells were transfected with the plasmids as follows: siRNA against GR (si-GR), GR overexpression plasmid (oe-GR), miR-143-3p mimic, miR-143-3p-inhibitor, siRNA against JAG1 (si-JAG1), and siRNA against NOTCH2 (si-NOTCH2) as well as their corresponding negative controls (NCs). One day prior to transfection, the cells at passage 3 exhibiting logarithmic growth were seeded into a 6-well plate and transfected 12 h later based on the instructions of the Lipofectamine 2000 (Invitrogen Inc., Carlsbad, CA, USA).
2.4RNA isolation and quantification
Total RNA was extracted from tissues or cells collected 24 h after transfection by TRIZOL (Invitrogen). GR, miR-143-3p, JAG1 and NOTCH2 primers were designed and further synthesized by Invitrogen. Different reverse transcription (RT) kits, TaqMan
2.5Protein isolation and quantification
The total protein of tissues or cells was extracted using a Radio immunoprecipitation assay kit (R0010, Beijing Solarbio Science & Technology Co., Ltd., Beijing, China), with protein concentration measured using the bicinchoninic acid method protein assay kit (GBCBIO Technologies Inc., Guangdong, China). A total of 40
2.6Verification of relationship between JAG1/NOTCH2 and miR-143-3p
The biological prediction website microRNA.org was used for analysis of the target gene of miR-143-3p and dual-luciferase reporter gene assay was conducted to verify whether JAG1/NOTCH2 was a direct target gene of miR-143-3p. The constructed JAG1/NOTCH2-wild type (WT) and JAG1/NOTCH2-mutant (MUT) were co-transfected with miR-143-3p mimic or mimic NC to HEK-293T cells (Shanghai BeiNuo Biotechnology Co., Ltd., Shanghai, China). After 48-h transfection, the cells were collected and lysed, and luciferase activity was determined by means of luciferase assay kit (K801-200, Biovision, Milpitas, CA, USA) using the glomax20/20 luminometer (Promega WI, USA).
The miR-143-3p promoter region was cloned into the Luciferase vector of pmirGLO (Promega) to construct the miR-143-3p Promoter WT (wild-type miR-143-3p Promoter plasmid), miR-143-3p Promoter mut1 (miR-143-3p Promoter plasmid at mutation site 1) and miR-143-3p Promoter mut2 (miR-143-3p Promoter plasmid at mutation site 2). The HEK-293T cells were seeded into a 24-well plate. After 24 h, 100 ng oe-NC or 100 ng oe-GR were co-transfected with 50 nmol/L miR-143-3p Promoter plasmid according to Lipofectamine 2000 kit (Invitrogen), and the luciferase activity was measured 48 h after transfection.
2.7Determination of GR enrichment in the miR-143-3p promoter
Chromatin immunoprecipitation (ChIP) assay was applied for determination of GR enrichment in the miR-143-3p promoter. After the cells had been fixed with 4% formaldehyde (the final concentration of formaldehyde was 1%), the cells were sonicated, followed by the addition of rabbit anti human interference GR antibody (#12041, 1: 50, Rabbit, CST), and Protein A Agarose/SaLmon Sperm DNA to precipitate GR antibody-GR-miR-143-3p promoter complex. The complex was eluted to remove some nonspecific combination. The enriched GR-miR-143-3p promoter complex was obtained after elution, and then de-crosslinked. The enriched miR-143-3p promoter fragment was purified for PCR analysis.
2.8Measurement of drug-resistant 50% inhibitory concentration (IC50)
The drug-resistant cells and parental LNCaP cells at logarithmic growth stage were seeded into 96-well plates (7
2.9Cell proliferation assessment
The cell culture plate was supplemented with 5-ethynyl-2’-deoxyuridine (EdU) solution for 2-h incubation, added with 4% paraformaldehyde (100
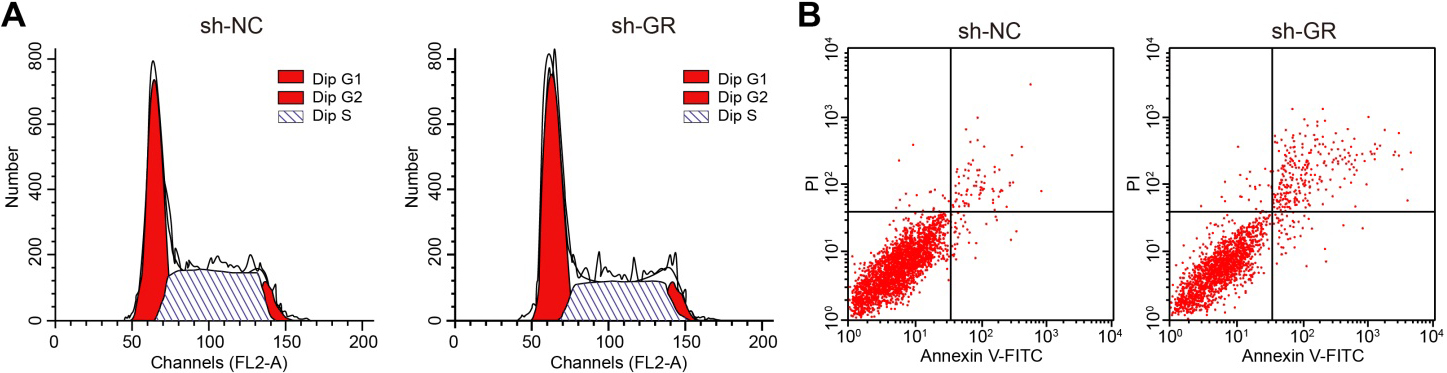
Cell cycle distribution was analyzed by flow cytometric analysis using PI single staining 48 h post-transfection. The cells were fixed with 70% cold absolute alcohol at 4
2.10Cell apoptosis assessment
Cell apoptosis was evaluated by terminal-deoxynu- cleoitidyl transferase mediated nick end labeling (TUNEL) assay followed by flow cytometric analysis.
The cells were placed on the cover slides at 37
Flow cytometric analysis was further performed using an Annexin V-fluoresceine isothiocyanate (FITC)/PI dual staining kit at 48 h after transfection. Briefly, 10
2.11Cell migration assessment
The cells were seeded into a 6-well plate at a density of 2.5
2.12Cell invasion assessment
After transfection for 24 h, the cells were starved in serum-free medium for 24 h, detached, rinsed twice with PBS and re-suspended with serum-free medium Opti-MEM (31985008, Nanjing SenBeiJia Biological Technology Co., Ltd., Nanjing, Jiangsu, China) containing 10 g/L BSA with the cell density adjusted to 3
2.13Xenograft tumor in nude mice
Ten BALB/c nude mice (purchased from Shanghai Lingchang company, Shanghai, China) aged between 5 and 7 weeks, weighing about (18 to 22) g were selected and raised under a specific pathogen-free environment at the animal experiment center of the First People’s Hospital of Yunnan Province. The mice were fed with sterile food and drinking water in a comfortable temperature environment under a 12-h day/night cycle. The mice were acclimatized for 7 days. The shRNA sequence was inserted into the shRNA fluorescence expression vector pSIH1-H1-copGFP for gene silencing, and sh-NC and shRNA against GR (sh-GR) were all constructed by GenePharma Co., Ltd. (Shanghai, China). The 293T cells were introduced for lentivirus packaging and cultured in a complete RPMI-1640 culture medium supplemented with 10% FBS and passaged every other day. The virus was collected after which the lentivirus (1
2.14Statistical analysis
All data were processed by SPSS 21.0 statistical software (IBM Inc., Armonk, NY, USA). Measurement data were expressed as mean
3.Results
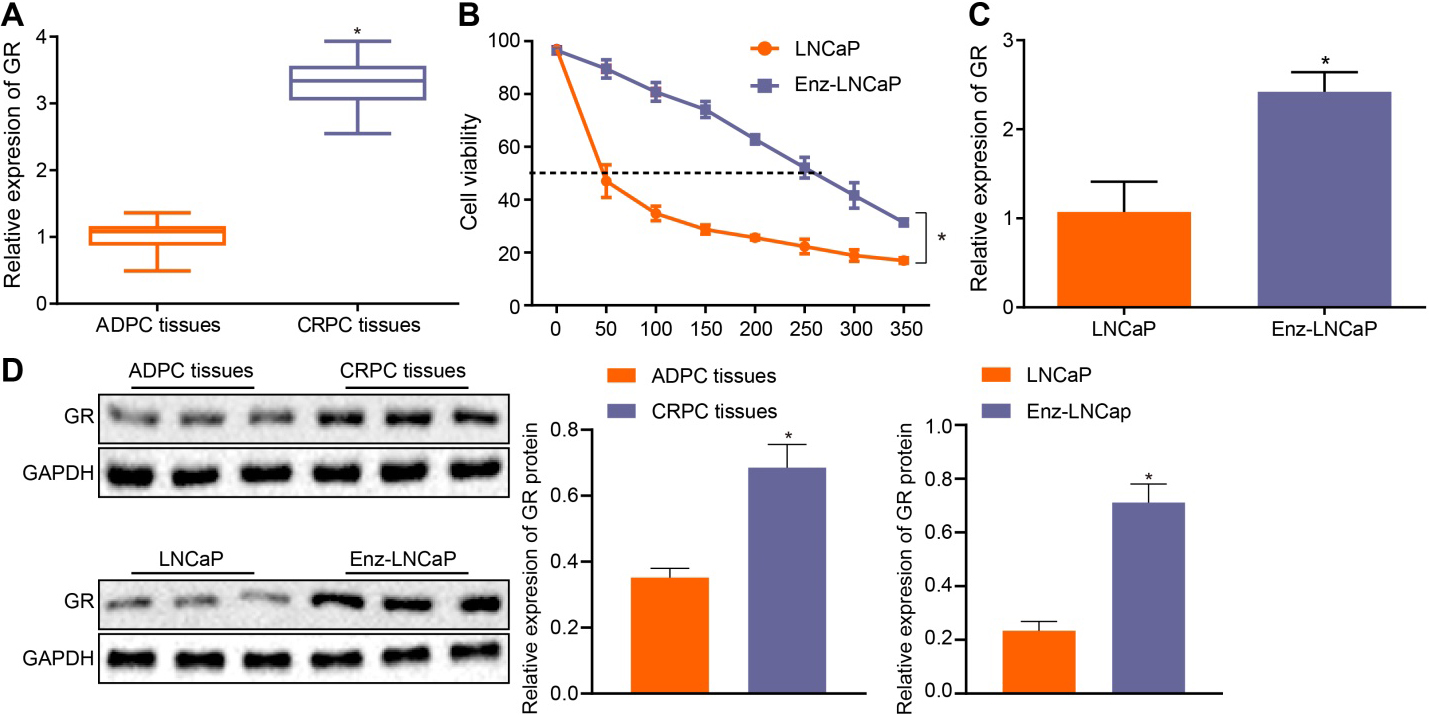
3.1High expression of GR in CRPC
Changes of GR in CRPC were initially detected by RT-qPCR. The results obtained illustrated that the GR expression in CRPC tissues was significantly elevated than that in ADPC tissues (
Figure 1.
GR exhibits a high expression in CRPC. A, The expression of GR in CRPC and ADPC tissues determined by RT-qPCR,
3.2Down-regulation of GR curbed the proliferation, migration and invasion of CRPC cells
The underlying mechanism by which the expression of GR influences the biological characteristics of CRPC cells was investigated. In order to further explore the function of GR in CRPC, the proliferation, cycle distribution, migration, invasion and apoptosis abilities of Enz-LNCaP cells were detected by EdU assay, PI single staining, wound healing assay, Transwell assay, TUNEL staining and Annexin V-FITC/PI double staining, respectively. The results revealed that in Enz-LNCaP cells, GR silencing resulted in decreased proliferation, migration, diminished invasive abilities and restrained cell cycle progression while increasing the apoptosis of cells (
Figure 2.
Down-regulation of GR inhibits the malignant biological characteristics of CRPC cells. A, EdU assay was used to detect the proliferation of cells (200
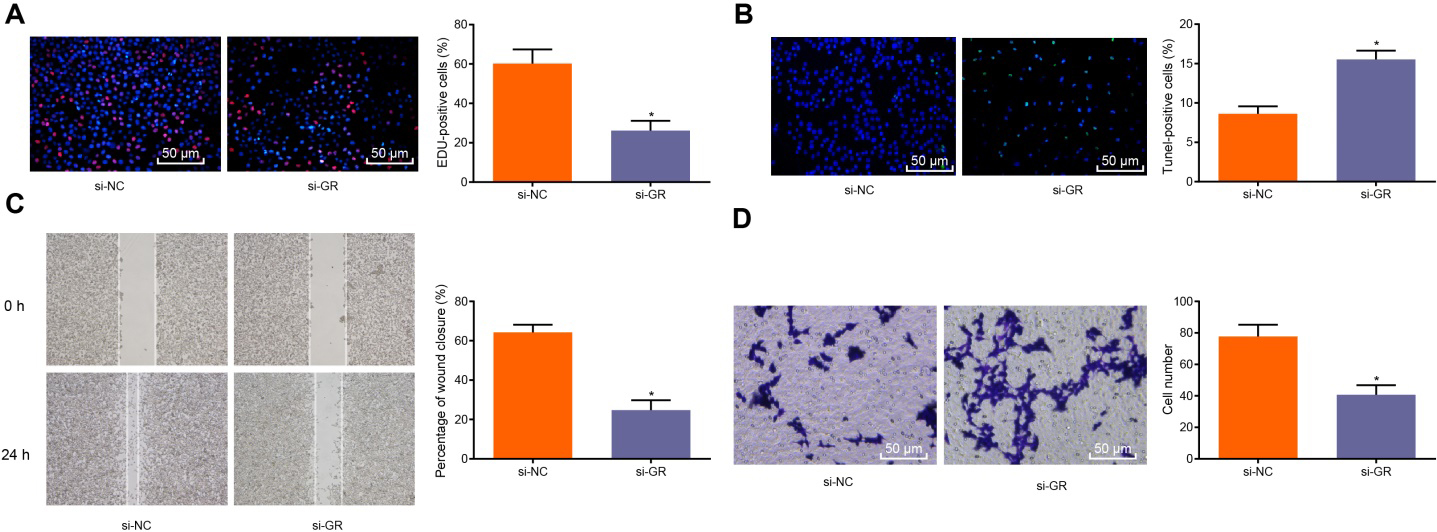
Figure 3.
GR promotes the progression of CRPC in vitrovia suppression of miR-143-3p. A, The prediction of GR binding sites in miR-143-3p promoter and the mutation sequence produced by site mutations. B, The binding relationship between miR-143-3p and GR analyzed by dual-luciferase reporter assay,
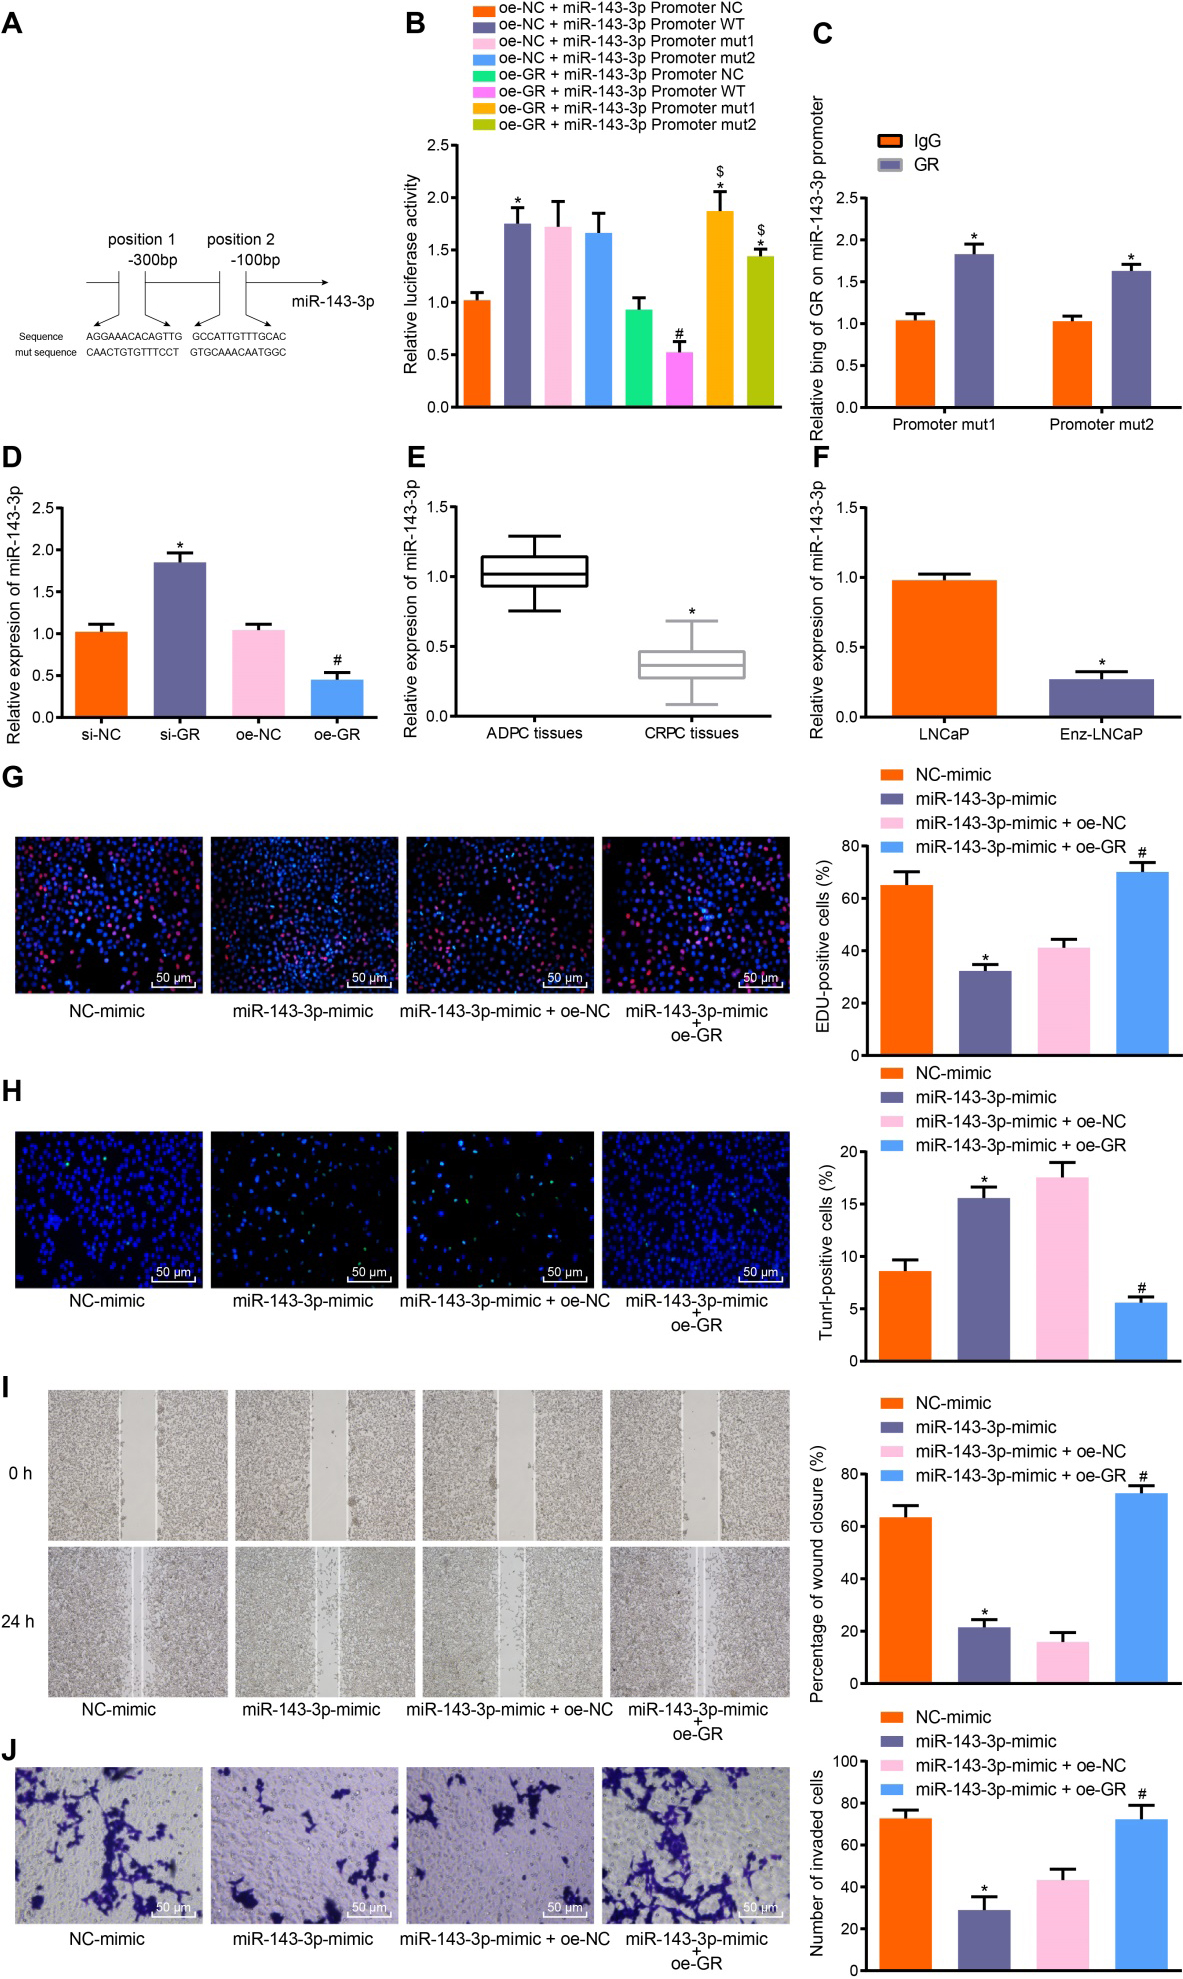
Figure 4.
GR modulates the expression of the target gene JAG1/NOTCH2 of miR-143-3p. A, The binding sites of miR-143-3p and JAG1/NOTCH2 predicted by websites. B, Identification of binding relationship between miR-143-3p and JAG1/NOTCH2 by dual-luciferase reporter assay,
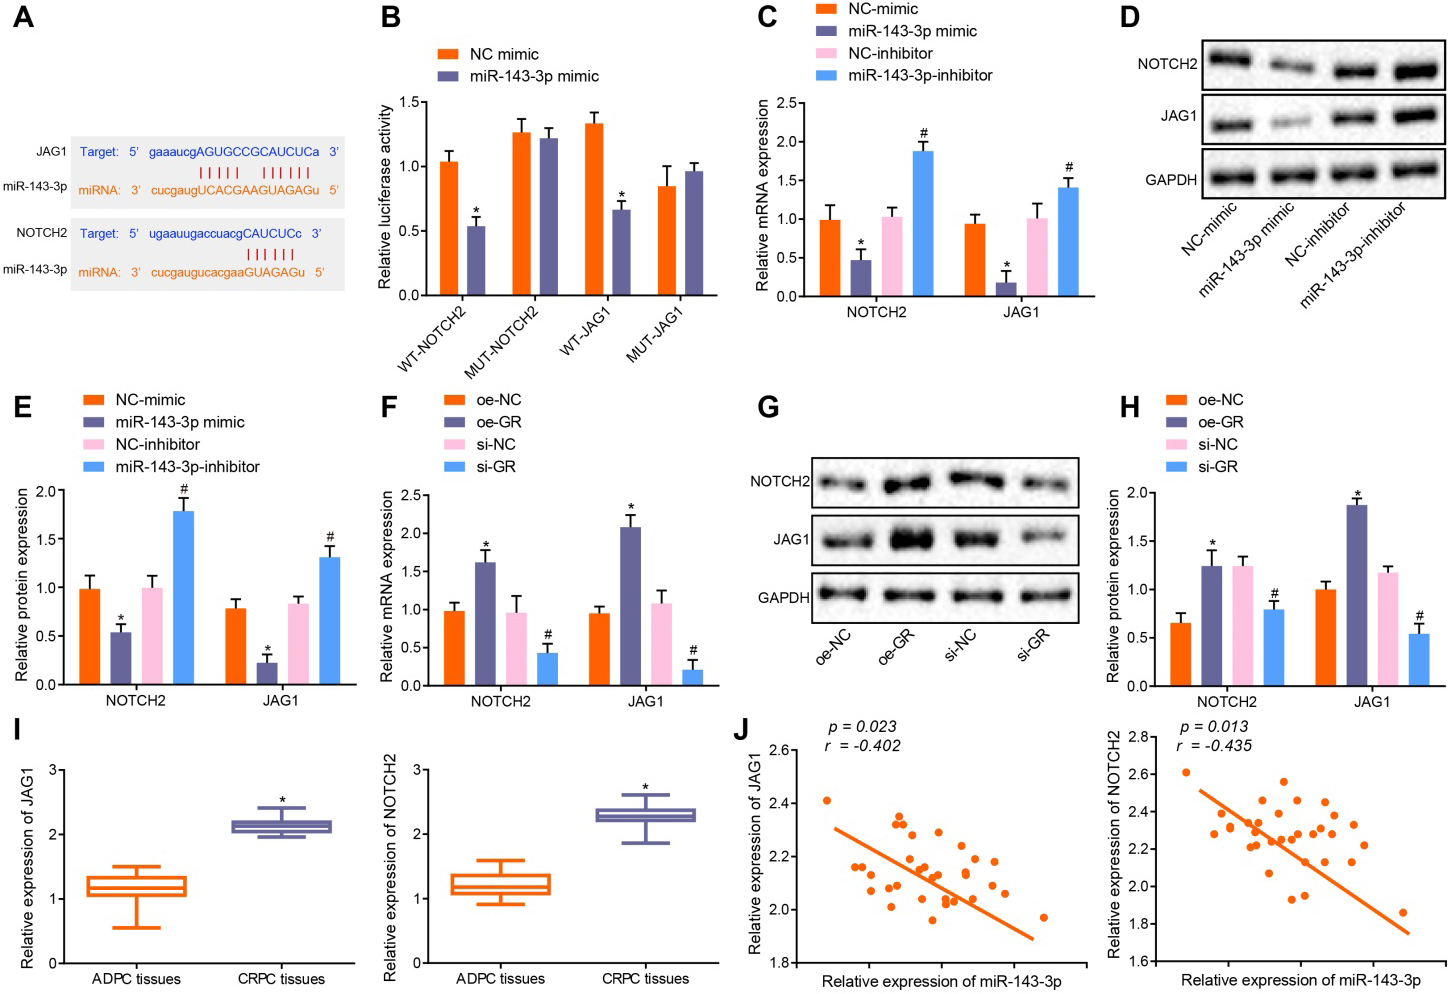
3.3GR promoted progression of CRPC via suppression of miR-143-3p
Next, the relationship between GR and miR-143-3p was assessed, in addition to exploring their effects on CRPC progression. The binding sites of GR and miR-143-3p promoter were predicted by the website (https://www.ncbi.nlm.nih.gov/genome/gdv/browser/? context=GEO&acc=GSE91365). A specific binding site between the GR gene sequence and the miR-143-3p promoter sequence was identified, suggesting that GR might be related to the miR-143-3p promoter (Fig. 3A). The binding of GR to miR-143-3p promoter was further verified by the findings of the dual-luciferase reporter assay (Fig. 3B), with the results showing that in comparison with the oe-GR
3.4GR regulated the expression of the target gene JAG1/NOTCH2 of miR-143-3p
Next, the relationship between GR, miR-143-3p and JAG1/NOTCH2 was evaluated. The binding site of miR-143-3p and JAG1/NOTCH2 was predicted on the biological prediction website (Fig. 4A), after which dual-luciferase reporter gene assay was employed to verify whether JAG1/NOTCH2 was the target of miR-143-3p (Fig. 4B), with the experimental results indicating that when compared with the NC mimic group, the luciferase signal of the miR-143-3p/WT-JAG1 or miR-143-3p/WT-NOTCH2 co-transfection group decreased (
3.5GR/miR-143-3p/JAG1/NOTCH2 axis was involved in progression of CRPC
It is speculated that GR may affect CRPC growth and metastasis through JAG1/NOTCH2 by mediating the expression of miR-143-3p. The RT-qPCR and Western blot analysis results revealed that the expression of JAG1/NOTCH2 was markedly elevated in Enz-LNCaP cells than in parental LNCaP cells (
Figure 5.
GR/miR-143-3p/JAG1/NOTCH2 axis involves in the progression of CRPC. A, The expression of JAG1/NOTCH2 in LNCaP and Enz-LNCaP cells determined by RT-qPCR,
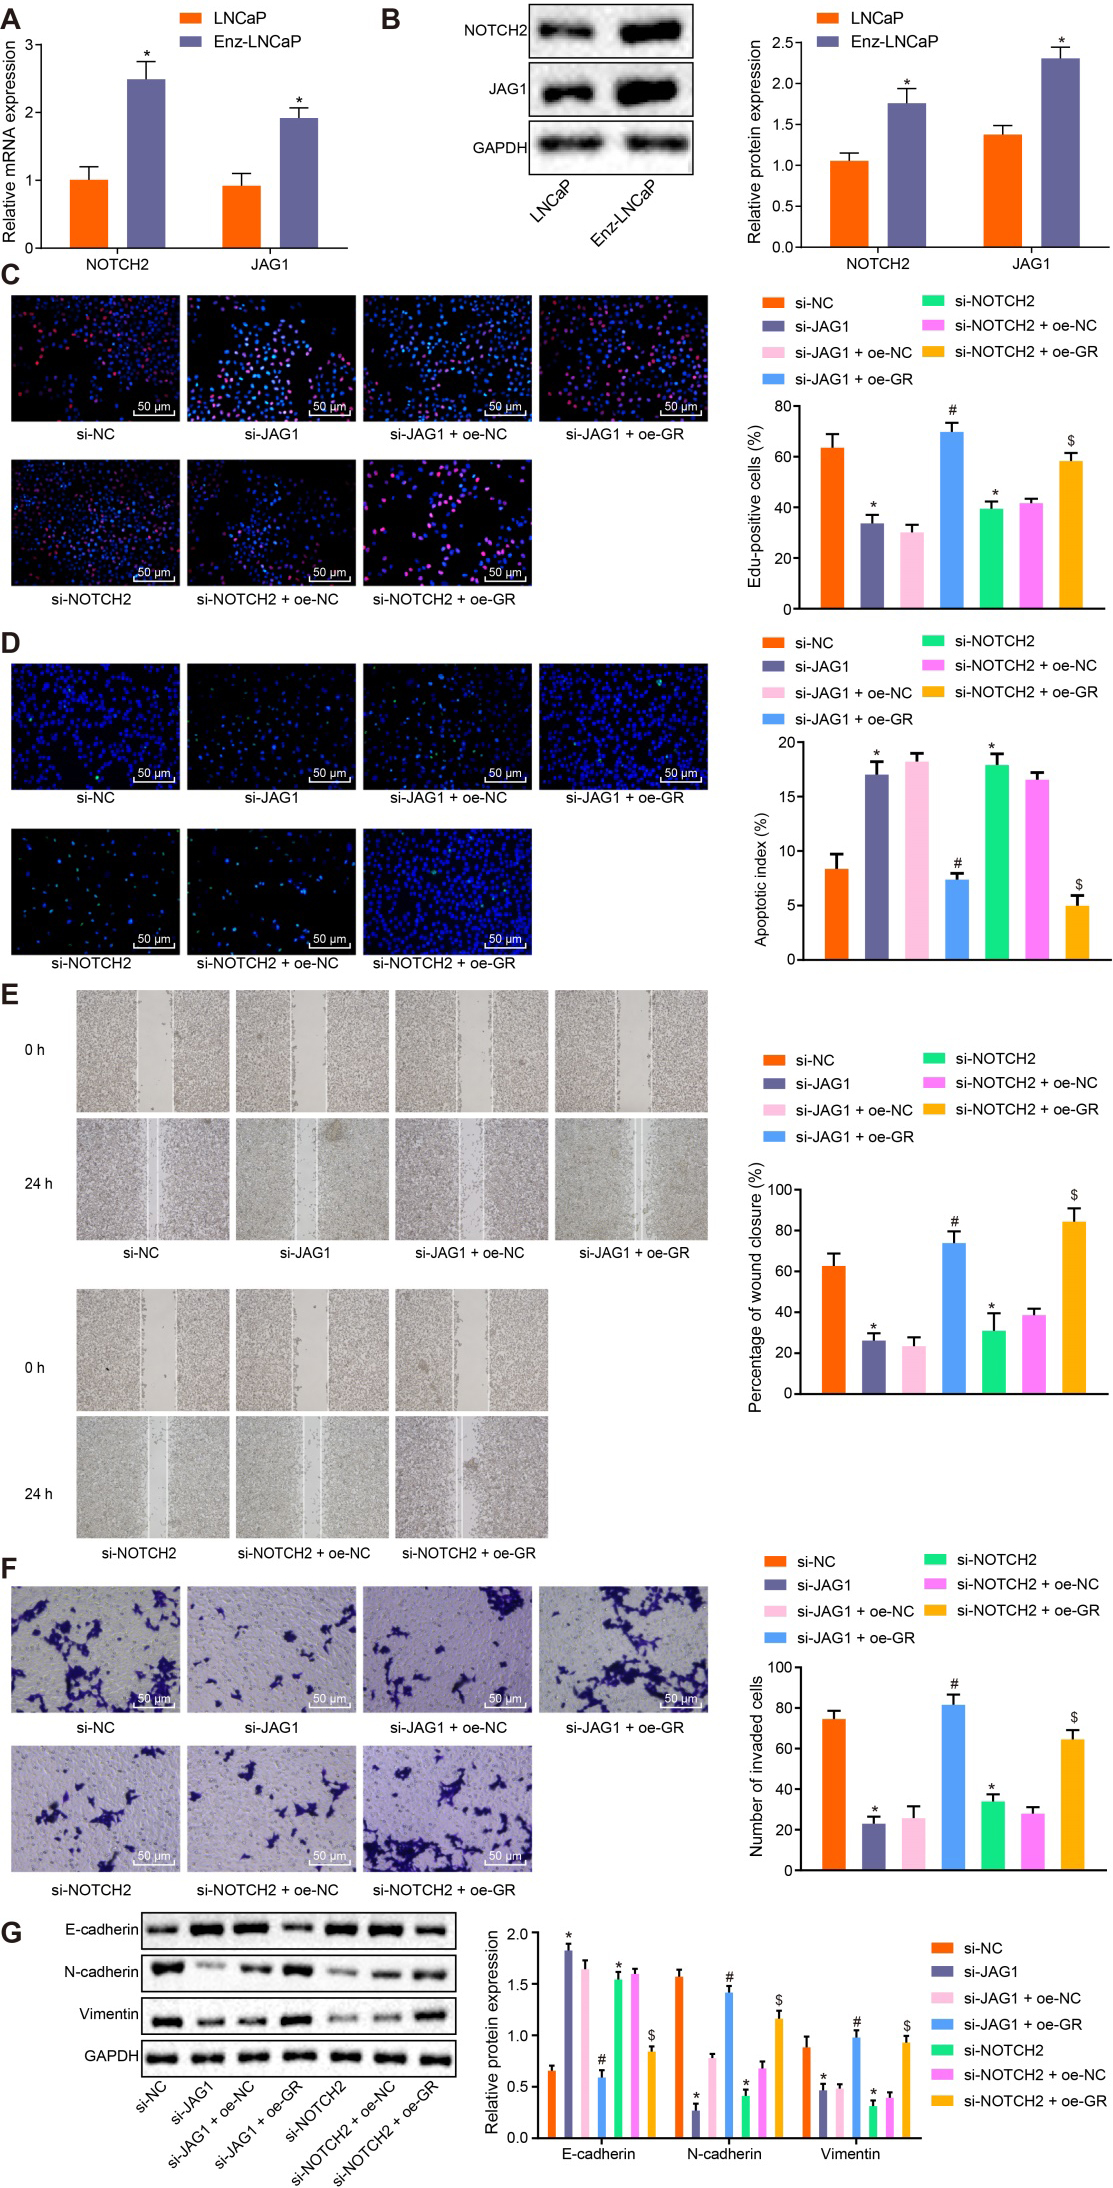
Figure 6.
GR/miR-143-3p/JAG1/NOTCH2 regulates tumorigenesis of CRPC cells in vivo. A, Representative images of tumors formed in nude mice 40 days after injection with CRPC cells. B, The tumor growth curve. C. The final tumor size in nude mice. D, The expression of miR-143-3p in tumor tissues was determined by RT-qPCR. E, The expression of GR, Bcl-2, Cyclin D1, Cleaved-PARP, Cleaved-Caspase 3, JAG1, NOTCH2, E-cadherin and Vimentin normalized to GAPDH in tumor tissues was measured by Western blot analysis. In panel C, D, and E,
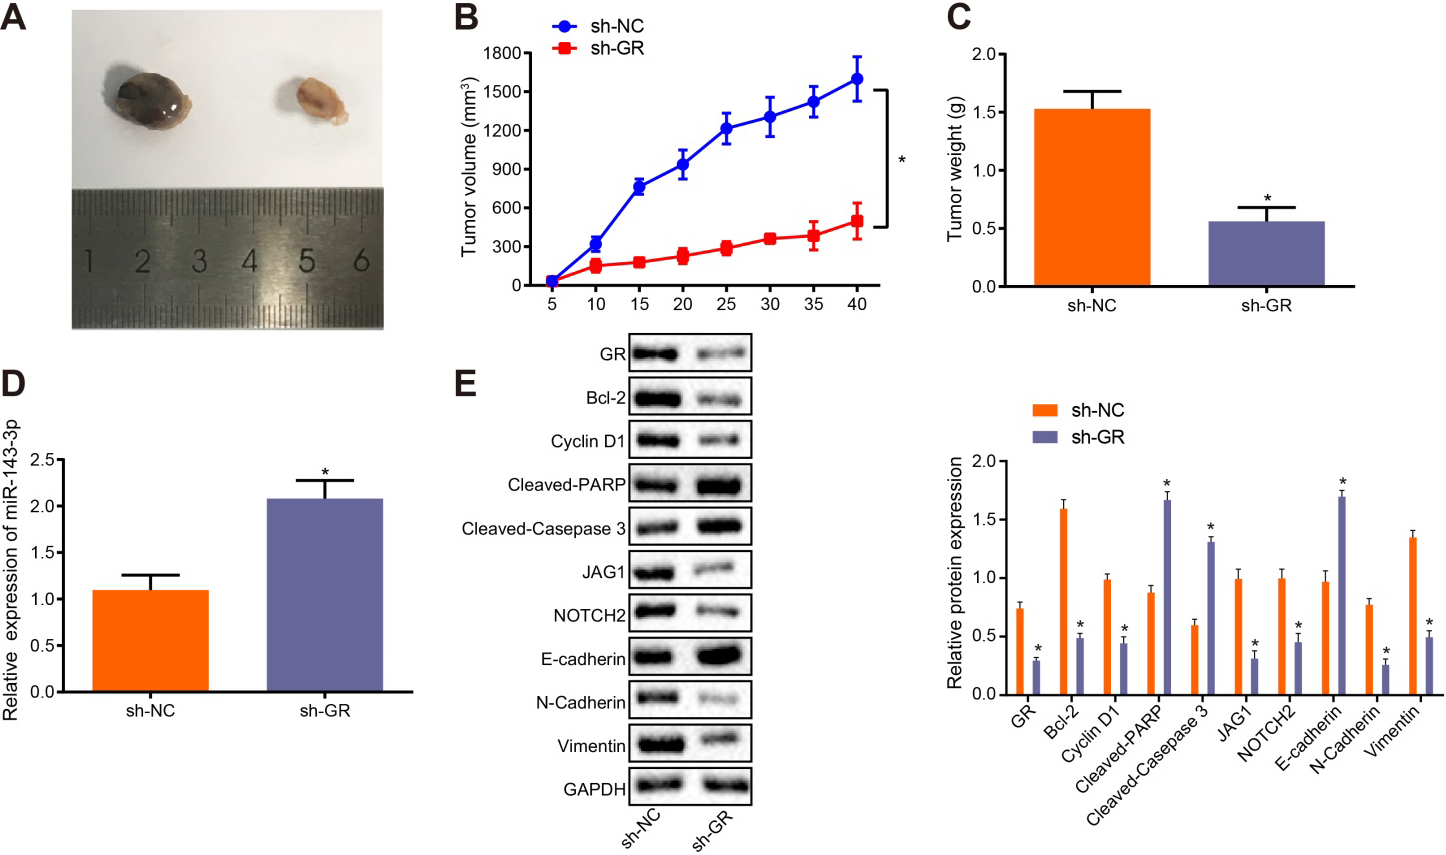
3.6GR/miR-143-3p/JAG1/NOTCH2 axis regulated tumorigenesis of CRPC cells in vivo
The xenograft tumor model in nude mice was established in order to further explore the role of GR/miR-143-3p/JAG1/NOTCH2 in CRPC in vivo. The results collected revealed that following injection of cells infected with lentivirus expressing sh-GR, the subcutaneous tumor volume (Fig. 6A), tumor growth rate (Fig. 6B), and the final tumor weight (Fig. 6C) were notably decreased (
4.Discussion
As a heterogeneous disease, CRPC has been widely documented as a prostate cancer that no longer responds to ADT, characterized by a series of genetic and epigenetic disorders at a genome level [20]. GR has been identified in literature as being resistant to ADT, which has various effects on CRPC [21]. During the current study, we set out to investigate the effects mediated by the GR gene on CRPC in relation to the involvement of miR-143-3p/JAG1/NOTCH2. Finally, gain- and loss-of-function approaches and xenograft tumor model in nude mice were employed in our study, and our results highlighted the significant role of the GR/miR-143-3p/JAG1/NOTCH2 axis in CRPC.
Our results demonstrated that GR was highly expressed in CRPC, while miR-143-3p was poorly expressed in CRPC. Previous research has indicated that elevated expression and activity of GR may lead to the development of CRPC following androgen blockade [9]. Furthermore, it has been previously reported that activation of GR may potentially inhibit tumor growth in preclinical models of prostate cancer with complete androgen receptor signaling, and high expression of GR is related to patients with prostate cancer exposed to ADT [22]. Poorly expressed miR-143-3p has been implicated in multiple types of cancers, including bladder cancer, non-small cell lung cancer, and endometrial carcinoma [23]. Moreover, the down-regulation of miR-143 has been detected in prostate cancer, while the overexpression of miR-143 has been shown to inhibit the proliferation and migration of prostate cancer cells in addition to enhancing their sensitivity to docetaxel [12, 24].
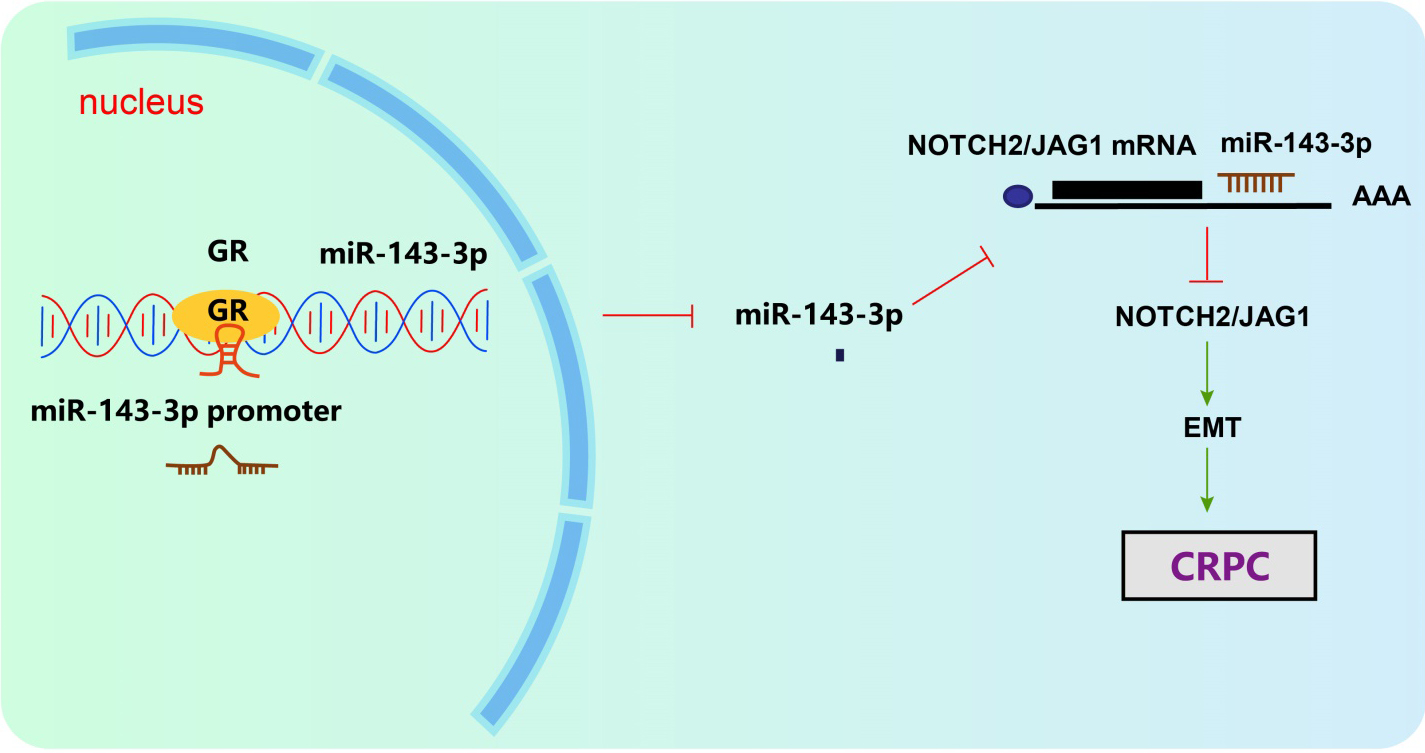
Figure 7.
GR was highly expressed in CRPC, while miR-143-3p was poorly expressed in CRPC. JAG1 and NOTCH2 were the target genes of miR-143-3p. GR could potentially elevate the expression of JAG1/NOTCH2 via inhibition of miR-143-3p. Silencing GR inhibited cell proliferation, migration and invasion through up-regulation of miR-143-3p, thereby suppressing EMT and progression of CRPC.
Additionally, we obtained evidence illustrating the capacity of GR to down-regulate the expression of miR-143-3p, while the down-regulation of GR could curb proliferation, migration and invasion of CRPC cells by up-regulating the expression of miR-143-3p. Glucocorticoid exerts essential functions in metabolism, development and immune response through GR [25]. Accumulating evidence has noted that glucocorticoid-activated GR can lead to failure of chemotherapy and tumor progression [26]. Moreover, the biology of GR represents a particularly complexity, including ligand-dependent receptor activation and subtype-specific transcription activities, and GR has been reported to modulate not only protein-encoded genes, but also activate non-coding RNA, including miRNA [27]. Previous data have revealed that GR activation stimulates cell proliferation in bladder cancer [28]. Moreover, one previous study has revealed that up-regulated miR-15b and miR-16 in CCRF-CEM T-ALL cells can increase glucocorticoid-induced cell death, highlighting that these miRNAs may be crucial regulators of glucocorticoid-induced apoptosis [29].
Furthermore, we presented evidence implicating that JAG1 and NOTCH2 were highly expressed in CRPC, and JAG1 and NOTCH2 were the target genes of miR-143-3p. Additionally, the GR/miR-143-3p/JAG1/NOTCH2 axis has been shown to influence the biological characteristics of CRPC cells by regulating EMT. Previous researchers have verified the role of JAG1/NOTCH2 in EMT that overexpressed JAG1 can promote EMT, while silencing NOTCH2 can reverse the EMT process [30]. Furthermore, miR-143 has been shown to be independently activated by JAG1/NOTCH and SRF in parallel pathways [32]. Decreased miR-143 is observed in the inflammation region of colon, which can also regulate the expression of NOTCH2 and E-cadherin [32]. Partly in line with our results, a previous report concluded effectively suppressed expression of miR-143-3p in metastatic prostate cancer via reverse phase proteome arrays, and it was also reported that re-expression of miR-143-3p can inhibit cell proliferation and target key carcinogenic pathways including cell cycle and apoptosis in prostate cancer [15]. Based on the aforementioned, it is reasonable to believe that GR regulates the expression of JAG1/NOTCH2, the target genes of miR-143-3p, and further regulates the biological characteristics of CRPC cells. Kach et al. have asserted that the activation of GR reduces the anti-tumor effect of AR blockade, and compared with inhibition of AR alone, both the inhibition of GR and AR have been reported to suppress the tumorigenicity of prostate cancer cells in vitro and in vivo [9]. Finally, the in vivo results of our study also demonstrated that the silencing of GR inhibited the proliferation of prostate cancer cells and tumor-forming rate in vivo by up-regulating the expression of miR-143-3p.
In conclusion, GR could inhibit the expression of miR-143-3p, and JAG1 and NOTCH2 were the target genes of miR-143-3p. The central observations of the current study shed light on the mechanism by which GR promoted the progression of CRPC through the JAG1/NOTCH2 pathway by down-regulating miR-143-3p (Fig. 7). Our study proposes a notable role for the GR/miR-143-3p/JAG1/NOTCH2 axis in CRPC. However, we failed to reach a general conclusion since that most experiments were conducted at a cellular level and the data of animal-level experiments were relatively scarce. Hence, further investigations into the current topic are required with a larger sample size in vivo for validation.
Acknowledgments
We acknowledge and appreciate our colleagues for their valuable efforts and comments on this paper. This study was supported by the Yunnan Provincial Health and Family Planning Commission Medical Discipline Leaders Training Program (Grant No. D-201670).
Conflict of interest
The authors declare no potential conflicts of interest.
References
[1] | G. Attard, C. Parker, R.A. Eeles, F. Schroder, S.A. Tomlins, I. Tannock, C.G. Drake and J.S. de Bono, Prostate cancer, Lancet 387: ((2016) ), 70–82. |
[2] | F. Bray, J. Ferlay, I. Soerjomataram, R.L. Siegel, L.A. Torre and A. Jemal, Global cancer statistics 2018: GLOBOCAN estimates of incidence and mortality worldwide for 36 cancers in 185 countries, CA Cancer J Clin 68: ((2018) ), 394–424. |
[3] | Y. Huang, X. Jiang, X. Liang and G. Jiang, Molecular and cellular mechanisms of castration resistant prostate cancer, Oncol Lett 15: ((2018) ), 6063–6076. |
[4] | S.J. Kim and S.I. Kim, Current treatment strategies for castration-resistant prostate cancer, Korean J Urol 52: ((2011) ), 157–165. |
[5] | T. Chandrasekar, J.C. Yang, A.C. Gao and C.P. Evans, Mechanisms of resistance in castration-resistant prostate cancer (CRPC), Transl Androl Urol 4: ((2015) ), 365–380. |
[6] | K. Simondsen and J. Kolesar, New treatment options for castration-resistant prostate cancer, Am J Health Syst Pharm 70: ((2013) ), 856–865. |
[7] | T.A. Yap, A. Zivi, A. Omlin and J.S. de Bono, The changing therapeutic landscape of castration-resistant prostate cancer, Nat Rev Clin Oncol 8: ((2011) ), 597–610. |
[8] | R. Abduljabbar, O.H. Negm, C.F. Lai, D.A. Jerjees, M. Al-Kaabi, M.R. Hamed, P.J. Tighe, L. Buluwela, A. Mukherjee, A.R. Green, S. Ali, E.A. Rakha and I.O. Ellis, Clinical and biological significance of glucocorticoid receptor (GR) expression in breast cancer, Breast Cancer Res Treat 150: ((2015) ), 335–346. |
[9] | J. Kach, T.M. Long, P. Selman, E.Y. Tonsing-Carter, M.A. Bacalao, R.R. Lastra, L. de Wet, S. Comiskey, M. Gillard, C. VanOpstall, D.C. West, W.C. Chan, D.V. Griend, S.D. Conzen and R.Z. Szmulewitz, Selective glucocorticoid receptor modulators (SGRMs) delay castrate-resistant prostate cancer growth, Mol Cancer Ther 16: ((2017) ), 1680–1692. |
[10] | W. Thieu, D. Tilki, R. de Vere White and C.P. Evans, The role of microRNA in castration-resistant prostate cancer, Urol Oncol 32: ((2014) ), 517–523. |
[11] | C. Xia, Y. Yang, F. Kong, Q. Kong and C. Shan, MiR-143-3p inhibits the proliferation, cell migration and invasion of human breast cancer cells by modulating the expression of MAPK7, Biochimie 147: ((2018) ), 98–104. |
[12] | B. Xu, X. Niu, X. Zhang, J. Tao, D. Wu, Z. Wang, P. Li, W. Zhang, H. Wu, N. Feng, Z. Wang, L. Hua and X. Wang, miR-143 decreases prostate cancer cells proliferation and migration and enhances their sensitivity to docetaxel through suppression of KRAS, Mol Cell Biochem 350: ((2011) ), 207–213. |
[13] | F. Xie, C. Li, X. Zhang, W. Peng and T. Wen, MiR-143-3p suppresses tumorigenesis in pancreatic ductal adenocarcinoma by targeting KRAS, Biomed Pharmacother 119: ((2019) ), 109424. |
[14] | H. Shi, H. Shen, J. Xu, S. Zhao, S. Yao and N. Jiang, MiR-143-3p suppresses the progression of ovarian cancer, Am J Transl Res 10: ((2018) ), 866–874. |
[15] | C. Coarfa, W. Fiskus, V.K. Eedunuri, K. Rajapakshe, C. Foley, S.A. Chew, S.S. Shah, C. Geng, J. Shou, J.S. Mohamed, B.W. O’Malley and N. Mitsiades, Comprehensive proteomic profiling identifies the androgen receptor axis and other signaling pathways as targets of microRNAs suppressed in metastatic prostate cancer, Oncogene 35: ((2016) ), 2345–2356. |
[16] | R. O’Brien and L. Marignol, The Notch-1 receptor in prostate tumorigenesis, Cancer Treat Rev 56: ((2017) ), 36–46. |
[17] | Y. Yu, Y. Zhang, W. Guan, T. Huang, J. Kang, X. Sheng and J. Qi, Androgen receptor promotes the oncogenic function of overexpressed Jagged1 in prostate cancer by enhancing cyclin B1 expression via Akt phosphorylation, Mol Cancer Res 12: ((2014) ), 830–842. |
[18] | B. You and K.C. Zhang, MicroRNA-144-3p inhibits cell proliferation and promotes apoptosis in castration-resistant prostate cancer by targeting CEP55, Eur Rev Med Pharmacol Sci 22: ((2018) ), 7660–7670. |
[19] | J. Sun, X. Tian, J. Zhang, Y. Huang, X. Lin, L. Chen and S. Zhang, Regulation of human glioma cell apoptosis and invasion by miR-152-3p through targeting DNMT1 and regulating NF2: MiR-152-3p regulate glioma cell apoptosis and invasion, J Exp Clin Cancer Res 36: ((2017) ), 100. |
[20] | T. Zhang and A.J. Armstrong, Clinical phenotypes of castration-resistant prostate cancer, Clin Adv Hematol Oncol 11: ((2013) ), 707–718. |
[21] | J. Hu and Q. Chen, The role of glucocorticoid receptor in prostate cancer progression: from bench to bedside, Int Urol Nephrol 49: ((2017) ), 369–380. |
[22] | M. Isikbay, K. Otto, S. Kregel, J. Kach, Y. Cai, D.J. Vander Griend, S.D. Conzen and R.Z. Szmulewitz, Glucocorticoid receptor activity contributes to resistance to androgen-targeted therapy in prostate cancer, Horm Cancer 5: ((2014) ), 72–89. |
[23] | L. Guo, J. Fu, S. Sun, M. Zhu, L. Zhang, H. Niu, Z. Chen, Y. Zhang, L. Guo and S. Wang, MicroRNA-143-3p inhibits colorectal cancer metastases by targeting ITGA6 and ASAP3, Cancer Sci 110: ((2019) ), 805–816. |
[24] | P. Zhou, W.G. Chen and X.W. Li, MicroRNA-143 acts as a tumor suppressor by targeting hexokinase 2 in human prostate cancer, Am J Cancer Res 5: ((2015) ), 2056–2063. |
[25] | Z. Chen, X. Lan, D. Wu, B. Sunkel, Z. Ye, J. Huang, Z. Liu, S.K. Clinton, V.X. Jin and Q. Wang, Ligand-dependent genomic function of glucocorticoid receptor in triple-negative breast cancer, Nat Commun 6: ((2015) ), 8323. |
[26] | D. Pan, M. Kocherginsky and S.D. Conzen, Activation of the glucocorticoid receptor is associated with poor prognosis in estrogen receptor-negative breast cancer, Cancer Res 71: ((2011) ), 6360–6370. |
[27] | D. Buschmann, R. Gonzalez, B. Kirchner, C. Mazzone, M.W. Pfaffl, G. Schelling, O. Steinlein and M. Reithmair, Glucocorticoid receptor overexpression slightly shifts microRNA expression patterns in triple-negative breast cancer, Int J Oncol 52: ((2018) ), 1765–1776. |
[28] | Y. Zheng, K. Izumi, Y. Li, H. Ishiguro and H. Miyamoto, Contrary regulation of bladder cancer cell proliferation and invasion by dexamethasone-mediated glucocorticoid receptor signals, Mol Cancer Ther 11: ((2012) ), 2621–2632. |
[29] | J. Rainer, C. Ploner, S. Jesacher, A. Ploner, M. Eduardoff, M. Mansha, M. Wasim, R. Panzer-Grumayer, Z. Trajanoski, H. Niederegger and R. Kofler, Glucocorticoid-regulated microRNAs and mirtrons in acute lymphoblastic leukemia, Leukemia 23: ((2009) ), 746–752. |
[30] | J. Chen, H. Zhang, Y. Chen, G. Qiao, W. Jiang, P. Ni, X. Liu and L. Ma, miR-598 inhibits metastasis in colorectal cancer by suppressing JAG1/Notch2 pathway stimulating EMT, Exp Cell Res 352: ((2017) ), 104–112. |
[31] | J.M. Boucher, S.M. Peterson, S. Urs, C. Zhang and L. Liaw, The miR-143/145 cluster is a novel transcriptional target of Jagged-1/Notch signaling in vascular smooth muscle cells, J Biol Chem 286: ((2011) ), 28312–28321. |
[32] | E. Boros, M. Csatari, C. Varga, B. Balint and I. Nagy, Specific gene- and MicroRNA-expression pattern contributes to the epithelial to mesenchymal transition in a rat model of experimental colitis, Mediators Inflamm 2017: ((2017) ), 5257378. |
Appendices
Supplementary data
Supplementary Fig. 1.
The down-regulation of GR inhibits cell cycle progression and promotes CRPC cell apoptosis. A, Cell cycle distribution analyzed by PI signal staining of flow cytometry. B, Cell apoptosis assessed by Annexin V-FITC/PI dual staining of flow cytometry.