
Biomarkers Apo10 and TKTL1: Epitope-detection in monocytes (EDIM) as a new diagnostic approach for cholangiocellular, pancreatic and colorectal carcinoma
Abstract
OBJECTIVE:
The EDIM (Epitope detection in monocytes) blood test is based on two biomarkers Apo10 and TKTL1. Apo10 is responsible for cell proliferation and resistance to apoptosis. TKTL1 plays a major role in anaerobic glycolysis of tumor cells, leading to destruction of the basal membrane and metastasis as well as in controlling cell cycle. For the first time we analyzed Apo10 and TKLT1 in patients with cholangiocellular (CCC), pancreatic (PC), and colorectal carcinoma (CRC).
METHODS:
Blood samples of 62 patients with CCC, PC, and CRC were measured and compared to 29 control patients. We also investigated 13 patients with inflammatory conditions, because elevated TKTL1 and Apo10 have been previously described in affected individuals. Flow cytometry was used to detect surface antigens CD14
RESULTS:
Patients with CCC had 100% positive EDIM-CS but CEA and CA19-9 were positive in only 22.2% and 70%, respectively. Patients with PC had 100% positive EDIM-CS but positive tumor markers in only 37.5% (CEA) and 72.7% (CA19-9). Patients with CRC had 100% positive EDIM-CS but only 50% positive CEA. EDIM-CS was positive in 100% (62/62) of all cancer patients and in 0% of healthy individuals. Of the individuals with inflammation, 7.7% had a positive EDIM-CS.
CONCLUSION:
The sensitivity of the EDIM blood test and the comparison with traditional tumor markers indicate that this new test might improve the detection of carcinomas (CCC, PC and, CRC) and might be relevant for the diagnosis of all tumor entities.
1.Introduction
Tumor staging is based on histological and serological findings as well as endoscopy and imaging [1, 2]. Cholangiocellular (CCC), pancreatic (PC), and colorectal carcinomas (CRC) often show elevated serum levels of carbohydrate antigen 19-9 (CA 19-9) and/or carcinoembryonic antigen (CEA) [3, 4, 5]. However, sensitivity and specificity are different and not all patients have positive tumor markers available [6, 7].
The EDIM-technology utilizes the published epitope detection in monocytes (EDIM) technology [8, 9, 10]. The EDIM blood test is based on the fact that activated monocytes phagocytose tumor cells and store tumor proteins intracellularly. After they migrate back to the blood, specific antibodies can be used to detect activated monocytes (macrophages) with intracellular tumor particles. Therefore flow cytometry is used to analyze the peripheral blood of the patients. Particularly the EDIM blood test focuses on the detection of the two biomarkers Apo10 and TKTL1 in CD14
Transketolase-like protein 1 (TKTL1) is a crucial enzyme in the non-oxidative arm of the pentose phosphate pathway (PPP) leading to preferential lactate production, acidification of the tumor microenvironment, metastasis, and cell migration [11]. Besides this TKTL1 enables the production of Acetyl-CoA, a central metabolic building block for lipids. Recently, it has been demonstrated that TKTL1 controls cell cycle [12]. Upregulation of TKTL1 is associated with poor prognosis in colon and urothelial cancer as well as rectum and lung carcinoma [10, 13, 14, 15]. Feyen et al. showed that EDIM-TKTL1 blood test is a reliable method to detect upregulation of glucose metabolism in tumor cells correlating with FDG-PET/CT results [16].
TKTL1 not only leads to an increased aerobic glycolysis contributing to carcinogenesis but is also needed for rapid cell growth and full viability of human tumor cells [17, 18]. This was especially observed in CRC cells, where inhibition of TKTL1 gene expression leads to a reduced proliferation rate and decreased glucose metabolization [19]. Therefore high TKTL1 expression was visible as a marker for uncontrolled cell-proliferation and carcinogenesis [19, 20].
Another protein which is overexpressed in many tumors is DNaseX (Desoxyribonuclease X). In normal cells DNaseX leads to DNA breaks and apoptosis. In tumor cells the enzyme activity of DNaseX is blocked by inhibitors, resulting in accumulation of DNaseX in the nucleus, apoptosis resistance, and uncontrolled cell proliferation [20, 21, 22, 23]. The monoclonal antibody Apo10 is used to identify the Apo10-epitope on DNaseX. Elevated Apo10-epitope can be found in tumor cells, for example in oral squamous cell carcinoma (OSCC) as well as in A549 – lung carcinoma, KYM – rhabdomyosarcoma, MCF7 – breast carcinoma and in HepG2 – hepatoblastoma cell lines. In contrast, absent or only weak expression has been observed in hematopoietic cells [21, 23].
Since inflammation plays a role in certain situations of cancer treatment, we also evaluated patients with such conditions (not suffering from malignant diseases) in order to better determine the value of the EDIM blood test for cancer patients.
Here, we analyze for the first time the role of the EDIM blood test for detection of Apo10 and TKTL1 in CCC, PC, and CRC. Special focus was on detection characterization, progress, and response to chemotherapy in patients.
2.Material and methods
2.1Patients
In total, 62 patients with tumor diseases (CCC (
In the follow-up groups, depending on the chemoth-erapy protocols, the following application of treatment was either after one or two weeks. If there was a deterioration of general condition, chemotherapy was postponed. Tumor etiologies had been confirmed by histopathology in all patients.
In addition, 16 age-matched healthy patients were included into the investigation as the control group to determine the EDIM-Apo10 and EDIM-TKLT1 scores in healthy individuals. To analyze if inflammation possibly has an effect on the EDIM scores, 13 patients with inflammatory diseases (cholangitis (
Follow-up evaluation (
The study was approved by the Ethics Committee of the University Hospital Tuebingen (190/2017B01 and 615/2015B02).
2.2Blood samples
Blood samples (2.7 ml) were collected in EDTA tubes, anonymized, processed within 24 h, and blinded to the clinical data. After counting the cells via ADVIA 120 Hematology System (Siemens, Erlangen, Germany), flow cytometry analysis of whole blood samples was performed.
2.3Flow cytometry measurements
Samples were analyzed by flow cytometry using a CantoII (BD Biosciences, Heidelberg, Germany). Whole blood was added to the surface marker mix (CD14 (PerCP), CD16 (allophycocyanin- APC) and CD45 (APC-H7), BD Bioscience, Heidelberg, Germany) in FACS tubes, mixed and incubated for 20 min. IntraPrep (Beckman Coulter, Krefeld, Germany) was used for intracellular staining as indicated in the manufacturers protocol. After permeabilization, the two intracellular antibodies TKTL1 (Phycoerythrin (PE)-conjugated, provided by Zyagnum AG, Pfungstadt, Germany) and Apo10 (Fluorescein isothiocyanate(FITC), provided by Zyagnum AG, Pfungstadt, Germany) were added. The entire tube was measured using CantoII (BD Biosciences, Heidelberg, Germany). One thousand macrophages (CD14
3.Statistics
The data is provided as mean
4.Results
4.1The EDIM blood test is highly sensitive in detecting PC, CCC and CRC
The EDIM blood test and the measurement of CEA and CA19-9 were conducted in patients with cholangiocellular, pancreatic, and colorectal carcinoma (Table 1).
Table 1
Characteristics of patients with pancreatic (A), colorectal (B) and, cholangiocellular (C) carcinoma
Table 1A
Characteristics of patients with cholangio-cellular carcinoma
Table 1B
Characteristics of patients with pancreatic cancer
Table 1C
Characteristics of patients with colorectalcancer
Figure 1.
EDIM Scores of patients with cancer or inflammation and healthy individuals. The scatter plots show the Apo10 EDIM score (cut-off score
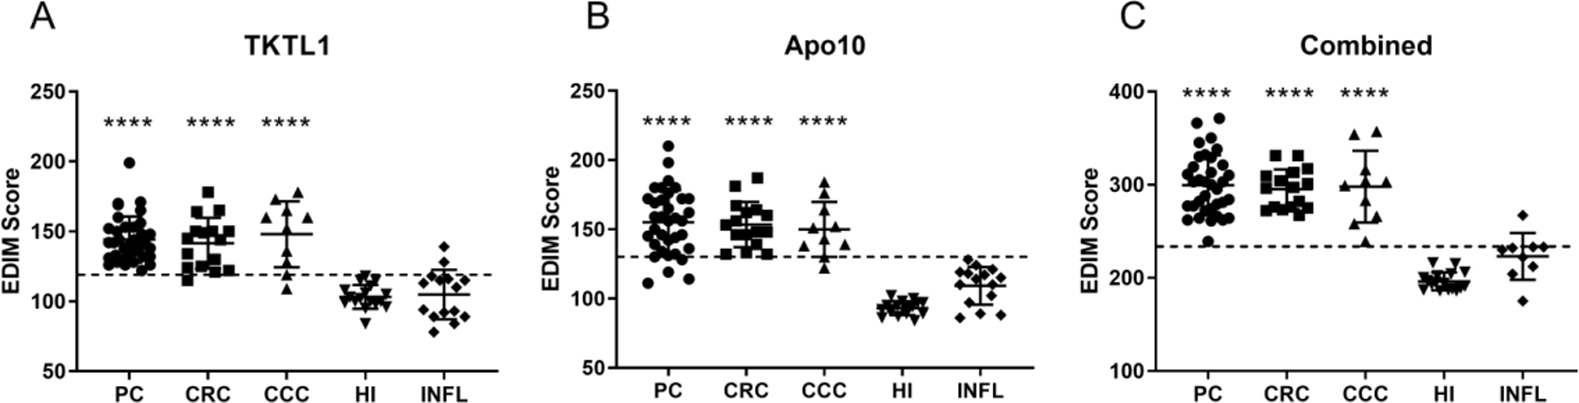
There were 9 of 10 patients (90%) with histopathologically proven CCC who showed positive EDIM-Apo10 scores and 8 of 10 (80%) patients showed positive EDIM-TKTL1 scores. The median of Apo10 and TKTL1 scores were 147 (range 122–184) and 156 (109–178), respectively. The EDIM-TKTL1/Apo10 combined score (EDIM-CS) was positive in all patients with CCC (Table 2).
Regarding the conventional tumor markers CEA and CA19-9, 7 of 10 (70%) patients with CCC had positive results for CA19-9 and 2 of 9 (22.2%) patients had positive results for CEA (in one patient CEA was not measured) (Table 2).
Interestingly, 30 of 34 (88.2%) with histopathologically proven PC patients had a positive EDIM-Apo10 score and 34 of 34 (100%) had a positive EDIM-TKTL1-score. The median Apo10 and TKTL1 score was 141 (range 111–210) and 157 (122–199), respectively. The EDIM-CS was positive in all (100%) pancreatic cancer patients.
In the case of the conventional tumor markers, 12 of 32 (37.5%) PC patients had positive results for CEA and 24 of 33 (72.7%) had positive results for CA19-9 (in two of the patients there was no CEA and for one no CA19-9 determined).
Only blood samples from histopathologically confirmed CRC were enrolled in the study. Sixteen of eighteen (88.9%) patients with CRC had a positive EDIM-Apo10-score while 17 of 18 (94.4%) had a positive EDIM-TKTL1-score. The median Apo10 and TKTL1 scores was 148 (range 121–187) and 139 (115–178), respectively.
Table 2
Results of the EDIM blood test and tumor markers (CEA and CA19-9) in cholangiocellular carcinoma (
| Patient group | EDIM-Apo10 | EDIM-TKTL1 | EDIM-Apo10/TKTL1 | CEA | CA 19-9 | |||||
|---|---|---|---|---|---|---|---|---|---|---|
| Negative | Positive | Negative | Positive | Negative | Positive | Negative | Positive | Negative | Positive | |
| CCC | 1 (10%) | 9 (90%) | 2 (20%) | 8 (80%) | 0 (0%) | 10 (100%) | 7 (77.8%) | 2 (22.2%) | 3 (30%) | 7 (70%) |
| PC | 4 (11.8%) | 30 (88.2%) | 0 (0%) | 34 (100%) | 0 (0%) | 34 (100%) | 20 (63%) 2.5 | 12 (37.5%) | 9 (27.3%) | 24 (72.7%) |
| CRC | 2 (11.1%) | 16 (88.9%) | 1 (5.6%) | 17 (94.4%) | 0 (0%) | 17 (100%) | 9 (50%) | 9 (50%) | 7 (43.8%) | 9 (56.3%) |
| HI | 16 (100%) | 0 (0%) | 16 (100%) | 0 (0%) | 16 (100%) | 0 (0%) | – | – | – | – |
| INFL | 13 (100%) | 0 (0%) | 11 (85.6%) | 2 (15.4%) | 12 (92.3%) | 1 (7.7%) | – | – | – | – |
Abbreviations: CCC, cholangiocellular carcinoma; PAN, pancreas carcinoma; CRC, colorectal carinoma; HI, healthy individuals; INFL, inflammation.
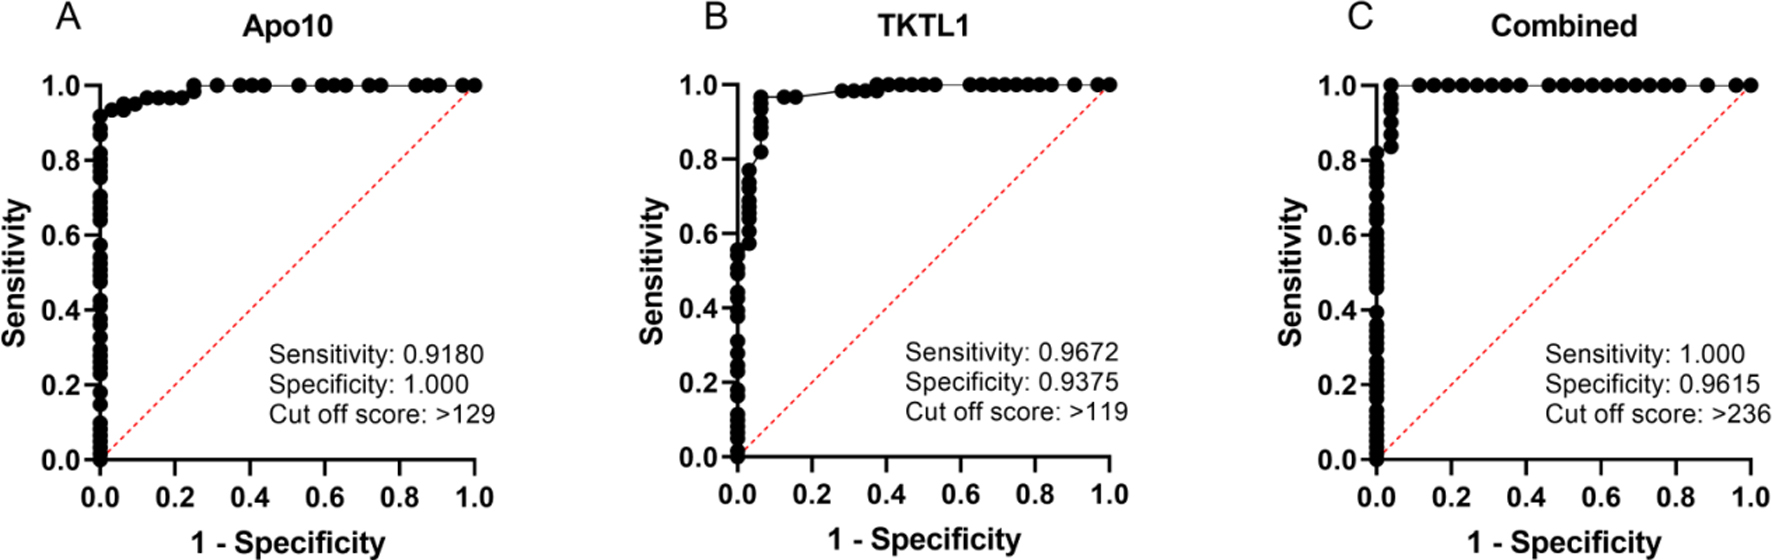
Figure 2.
Receiver Operating Characteristics (ROC) analysis of EDIM-Apo10, EDIM-TKTL1, and combined EDIM score in pancreatic carcinoma, colorectal carcinoma, and cholangiocellular carcinoma (
The EDIM-CS was positive in all (100%) colorectal cancer patients. Nine of eighteen (50%) of these patients showed a positive result for CEA and 9 of 16 (56.3%) of the patients showed positive results for CA 19-9 (in 2 patients CA19-9 was not measured).
The receiver operating characteristic (ROC) analysis (Fig. 2) was performed, including all 62 cancer patients (CCC, PC, and CRC) compared with healthy individuals and patients with inflammation (
Table 3
EDIM blood test results of the follow-ups in pancreatic (PC;
| Pat. ID | Before therapy | 1. Follow-up | 2. Follow-up | 3. Follow-up | Tumor entity | Follow-up intervall and correlation to imaging | ||||||||
|---|---|---|---|---|---|---|---|---|---|---|---|---|---|---|
| EDIM-TKTL1 | EDIM-Apo10 | EDIM-CS | EDIM-TKTL1 | EDIM-Apo10 | EDIM-CS | EDIM-TKTL1 | EDIM-Apo10 | EDIM-CS | EDIM-TKTL1 | EDIM-Apo10 | EDIM-CS | |||
| 1 | 152 | 152 | 304 | 125 | 160 | 285 | CCC | Follow-up after 56 weeks: Slight progress | ||||||
| 2 | 153 | 119 | 272 | 152 | 125 | 277 | PC | Follow-up after 36 weeks: Status idem | ||||||
| 3 | 170 | 180 | 350 | 106 | 163 | 269 | PC | Follow-up after 16 weeks: Mixed response | ||||||
| 4 | 169 | 144 | 313 | 129 | 168 | 297 | PC | Follow-up after 16 weeks: Response | ||||||
| 5 | 132 | 171 | 303 | 156 | 128 | 284 | PC | Follow-up after 13 weeks: slight response | ||||||
| 6 | 138 | 165 | 303 | 121 | 161 | 282 | PC | Follow-up after 15 weeks: Response | ||||||
| 7 | 148 | 131 | 279 | 96 | 176 | 272 | 136 | 133 | 269 | PC | 1. Follow-up After 14 weeks: Slight response; 2. follow-up After 7 weeks: status Idem compared to 8 weeks before | |||
| 8 | 156 | 210 | 366 | 135 | 171 | 306 | 123 | 160 | 283 | 164 | 180 | 344 | PC | 1. Follow-up: response of the tumor; 2. follow-up: Massive progress; 3. Follow-up: progress |
| 9 | 122 | 187 | 309 | 99 | 142 | 241 | CRC | Follow-up after 10 weeks: good response of the tumor | ||||||
| 10 | 150 | 181 | 331 | 134 | 129 | 263 | CRC | Follow-up after 12 weeks: good response to chemotherapy | ||||||
Abbreviations: MRI: magnetic resonance imaging; PET-CT: positron-emission-tomography; CT: computer tomography, PAN: Pancreatic carcinoma, CRC: colorectal carcinoma; CCC: cholanngiocellular carcinoma.
4.2The EDIM blood test is more sensitive for detecting CCC, CRC, and PC than the conventional tumor markers CEA and CA19-9
In the EDIM blood test, 59 of 62 (95.2%) tumor patients had a positive TKTL1-score and 55 of 62 (88.7%) tumor patients had a positive Apo10-score. The EDIM-CS revealed a positive result in all tumor patients. In contrast, 23 of 59 (38.9%) patients showed a positive result for CEA and 40 of 59 (67.8%) patients had a positive CA 19-9 result (Table 2).
4.3Healthy individuals and patients with inflammation
All healthy individuals were EDIM-TKTL1 and EDIM-Apo10 negative (100%). However, 2 of 13 (15.4%) patients with inflammation (pancreatitis)showed a positive EDIM-TKTL1 score, whereas all of these patients showed a negative EDIM-Apo10 score (Table 2). The EDIM-CS was negative in 12 of 13 (92.3%) patients with inflammation. The median of Apo10 and TKTL1 score was 114 (range 86–128) and 110 (84–139), respectively (Table 2).
4.4Follow-up cares
After chemotherapy treatment, patients underwent standard follow-up measurements according to recommended guidelines. Post-chemotherapy surveillance consisted of medical history, physical examination, CT or PET-CT scans and laboratory studies including CEA and CA 19-9 levels every three months. Furthermore, an EDIM blood test was performed every three months.
By now, 10 patients (7 patients with PC, 2 patients with CRC and 1 patient with CCC) have completed a relevant follow up period and are presented below (Table 3). One patient (No. 7) with pancreatic cancer had two follow-up tests (after 3, and 5 month) and one PC patient (No. 8) had three follow-up tests (after 3, 5 and 7 months).
The results of the CT (patients 1–9) or PET-CT (patient number 10) scans show that all 10 patients in the aftercare still suffer from pancreatic, colorectal and cholangiocellular carcinoma (Table 3). This is in line with the EDIM-TKTL1/Apo10 combined score (EDIM-CS) in 10 of 10 patients. However, the EDIM blood test was unable to show a clear association between tumor response to chemotherapy treatment and EDIM-CS values.; Interestingly, the CEA values showed 7 times false negative values and CA 19-9 showed 5 times false negative values.
5.Discussion
Our study demonstrates the diagnostic efficacy of the EDIM blood test in gastrointestinal tumors (pancreatic, colorectal and cholangiocellular carcinoma). Prior studies showed promising results for the EDIM blood test in patients with oral squamous cell cancer (OSCC), bladder, kidney, prostate, breast, ovarian, and bronchial cancer [10, 13, 24, 25, 26, 27]. To our knowledge no other studies using the EDIM blood test in large cohorts of gastro-intestinal cancer patients have been published up to now.
Schwab et al. showed that high expression ofTKTL1-mRNA in patients with advanced rectal carcinoma treated with neoadjuvant chemotherapy predicted a poor survival prognosis [13]. Besides that, Langbein et al. observed an overexpression of TKTL1-mRNA and TKTL1-protein in different types of carcinoma cells [10]. In a case report on colon carcinoma, the EDIM-Apo10 and EDIM-TKTL1 score was used to monitor tumor recurrence. In this report, EDIM blood test marker values were positive nine months before metastatic relapses were detected [28].
Increased TKTL1 scores are not only observed in tumor patients but also in acute or chronic infectious diseases, following tooth extraction, wound remodeling processes, and after operations [29]. In our study, 11 of 13 (84.6%) patients with inflammation showed no significant increase of TKTL1 and 13 of 13 showed no increase of Apo10 expression. However, the combined EDIM-score of these patients was higher than those of healthy individuals, suggesting that inflammation might influence results of the EDIM blood test (Fig. 1). This observation should be taken into account when interpreting EDIM blood test result, for example with regard to the time point of analysis following a surgical procedure or in patients with other inflammatory conditions.
Conflicting statements about the role of TKTL1 exist with respect to clinical aggressiveness, hypoxia, and metabolism in cancer cells including CRC and prostate cancer [30]. One study reevaluated the expression of TKTL1 in six different cancer cell lines (HeLa, MCF-7, A549, HT-1080, M21 and TF-1) and doubted a significant role of TKTL1 in tumor metabolism [30]. This conclusion has been disproved by several studies, where TKTL1 has been identified as a candidate oncogene that is activated by epigenetic processes and plays a key role in carcinogenesis [17, 31, 32].
Accordingly, we observed elevated TKTL1 and Apo10 scores in about 95% and 89% of cancer patients, respectively indicating a high sensitivity of the EDIM blood test.
It might be more rational to use the combined EDIM blood test with the established tumor markers such as CEA, CA19-9, NSE (neuron specific enolase), PSA (prostate specific antigen) to optimize the detection of neoplasia.
Comparing the results to the expression of the conventional unspecific tumor markers CEA and CA 19-9, which were also measured in our tumor patients, the EDIM blood test was more sensitive in detecting the primary tumor. Due to the limited numbers of samples/patients, a larger study population is needed. Only 40 of 59 (67.8%) tumor patients had a positive result for CA 19-9 and only 34 of 59 (57.6%) patients showed an increased CEA expression. Thus, the EDIM score and especially the combined EDIM score seem to be reliable new tools to identify patients with gastrointestinal tumors.
The results of CT or PET-CT scans showed, that all 10 patients in the aftercare were still suffering from PC, CRC, and CCC. This was in line with the EDIM-TKTL1/Apo10 combined score (EDIM-CS) in all patients. The EDIM blood test and the CEA and CA 19-9 tumor markers were unable to show a clear association between tumor response after chemotherapy treatment and EDIM-CS values. An explanation could be that the EDIM blood test is based on the fact that activated macrophages phagocytose tumor cells and store tumor proteins intracellularly. The amount of tumor mass does not mater, since the test shows only if there is a tumor present. Another explanation might be that the tumor growth leads to an increased fermentation of glucose to lactate even in the presence of oxygen (Warburg effect) [33], acidifying the environment and preventing the macrophages to phagocytose the tumor cells and internalize Apo10 and TKTL1 [22, 34]. The EDIM blood test might be a reliable test for detecting neoplasia. This observation could be of importance when thinking of a broader application, such as in patients’ screening, treatment monitoring, or relapse detection. However, so far no conclusion in terms of tumor response after chemotherapy can be made.
Having a universal tumor marker would be highly desirable for the detection of malignant tumors and their early surgical therapy. This would be beneficial to the survival and curing of tumor patients concerning neoadjuvant and adjuvant therapy, since early detection and timely therapy are the most decisive factors for a positive clinical outcome. We recognize that further studies with a larger study population are needed. Imaging technologies such as MRI or PET/CT examinations are still important to obtain detailed information about localization and distribution of malignancies in the body.
In accordance with our results, it has been previously suggested that the test reliably detects tumors of various origins so that it might be considered as a universal cancer test in the future. Further investigations in this context must be done.
Acknowledgments
This work was supported by the Madeleine Schick-edanz-KinderKrebs-Stiftung; BD Bioscience, Heidelberg, Germany; and Zyagnum AG, Pfungstadt, Germany.
Conflict of interest
All authors declare that they have no conflicts of interest.
References
[1] | K.S. Goonetilleke and A.K. Siriwardena, Systematic review of carbohydrate antigen (CA 19-9) as a biochemical marker in the diagnosis of pancreatic cancer, Eur J Surg Oncol 33: ((2007) ), 266–270. |
[2] | H.R. Mertz, P. Sechopoulos, D. Delbeke and S.D. Leach, EUS, PET, and CT scanning for evaluation of pancreatic adenocarcinoma, Gastrointest Endosc 52: ((2000) ), 367–371. |
[3] | C.A. McIntyre and J.M. Winter, Diagnostic evaluation and staging of pancreatic ductal adenocarcinoma, Semin Oncol 42: ((2015) ), 19–27. |
[4] | M. Stojkovic Lalosevic, S. Stankovic, M. Stojkovic, V. Markovic, I. Dimitrijevic, J. Lalosevic, J. Petrovic, M. Brankovic, A. Pavlovic Markovic and Z. Krivokapic, Can preoperative CEA and CA19-9 serum concentrations suggest metastatic disease in colorectal cancer patients? Hell J Nucl Med 20: ((2017) ), 41–45. |
[5] | R. Coelho, M. Silva, E. Rodrigues-Pinto, H. Cardoso, S. Lopes, P. Pereira, F. Vilas-Boas, J. Santos-Antunes, J. Costa-Maia and G. Macedo, CA 19-9 as a marker of survival and a predictor of metastization in cholangiocarcinoma, GE Port J Gastroenterol 24: ((2017) ), 114–121. |
[6] | R. Tomasevic, T. Milosavljevic, D. Stojanovic, Z. Gluvic, P. Dugalic, I. Ilic and R. Vidakovic, Predictive value of carcinoembryonic and carbohydrate antigen 19-9 related to some clinical, endoscopic and histological colorectal cancer characteristics, J Med Biochem 35: ((2016) ), 324–332. |
[7] | R.C. Dolscheid-Pommerich, S. Manekeller, G. Walgenbach-Brunagel, J.C. Kalff, G. Hartmann, B.S. Wagner and S. Holdenrieder, Clinical performance of CEA, CA19-9, CA15-3, CA125 and AFP in gastrointestinal cancer using LOCI-based assays, Anticancer Res 37: ((2017) ), 353–359. |
[8] | R. Herwig, A. Pelzer, W. Horninger, P. Rehder, H. Klocker, R. Ramoner, G.M. Pinggera, C. Gozzi, G. Konwalinka and G. Bartsch, Measurement of intracellular versus extracellular prostate-specific antigen levels in peripheral macrophages: a new approach to noninvasive diagnosis of prostate cancer, Clin Prostate Cancer 3: ((2004) ), 184–188. |
[9] | M.P. Leers, M. Nap, R. Herwig, K. Delaere and F. Nauwelaers, Circulating PSA-containing macrophages as a possible target for the detection of prostate cancer: a three-color/five-parameter flow cytometric study on peripheral blood samples, Am J Clin Pathol 129: ((2008) ), 649–656. |
[10] | S. Langbein, M. Zerilli, A. Zur Hausen, W. Staiger, K. Rensch-Boschert, N. Lukan, J. Popa, M.P. Ternullo, A. Steidler, C. Weiss, R. Grobholz, F. Willeke, P. Alken, G. Stassi, P. Schubert and J.F. Coy, Expression of transketolase TKTL1 predicts colon and urothelial cancer patient survival: Warburg effect reinterpreted, Br J Cancer 94: ((2006) ), 578–585. |
[11] | M.V. Liberti and J.W. Locasale, The warburg effect: How does it benefit cancer cells? Trends Biochem Sci 41: ((2016) ), 211–218. |
[12] | Y. Li, C.F. Yao, F.J. Xu, Y.Y. Qu, J.T. Li, Y. Lin, Z.L. Cao, P.C. Lin, W. Xu, S.M. Zhao and J.Y. Zhao, APC/C(CDH1) synchronizes ribose-5-phosphate levels and DNA synthesis to cell cycle progression, Nat Commun 10: ((2019) ), 2502. |
[13] | J. Schwaab, K. Horisberger, P. Strobel, B. Bohn, D. Gencer, G. Kahler, P. Kienle, S. Post, F. Wenz, W.K. Hofmann, R.D. Hofheinz and P. Erben, Expression of Transketolase like gene 1 (TKTL1) predicts disease-free survival in patients with locally advanced rectal cancer receiving neoadjuvant chemoradiotherapy, BMC Cancer 11: ((2011) ), 363. |
[14] | M. Foldi, E. Stickeler, L. Bau, O. Kretz, D. Watermann, G. Gitsch, G. Kayser, A. Zur Hausen and J.F. Coy, Transketolase protein TKTL1 overexpression: A potential biomarker and therapeutic target in breast cancer, Oncol Rep 17: ((2007) ), 841–845. |
[15] | H.U. Volker, M. Scheich, B. Schmausser, U. Kammerer and M. Eck, Overexpression of transketolase TKTL1 is associated with shorter survival in laryngeal squamous cell carcinomas, Eur Arch Otorhinolaryngol 264: ((2007) ), 1431–1436. |
[16] | O. Feyen, J.F. Coy, V. Prasad, R. Schierl, J. Saenger and R.P. Baum, EDIM-TKTL1 blood test: A noninvasive method to detect upregulated glucose metabolism in patients with malignancies, Future Oncol 8: ((2012) ), 1349–1359. |
[17] | W. Sun, Y. Liu, C.A. Glazer, C. Shao, S. Bhan, S. Demokan, M. Zhao, M.A. Rudek, P.K. Ha and J.A. Califano, TKTL1 is activated by promoter hypomethylation and contributes to head and neck squamous cell carcinoma carcinogenesis through increased aerobic glycolysis and HIF1alpha stabilization, Clin Cancer Res 16: ((2010) ), 857–866. |
[18] | X. Xu, A. Zur Hausen, J.F. Coy and M. Lochelt, Transketolase-like protein 1 (TKTL1) is required for rapid cell growth and full viability of human tumor cells, Int J Cancer 124: ((2009) ), 1330–1337. |
[19] | L.H. Hu, J.H. Yang, D.T. Zhang, S. Zhang, L. Wang, P.C. Cai, J.F. Zheng and J.S. Huang, The TKTL1 gene influences total transketolase activity and cell proliferation in human colon cancer LoVo cells, Anticancer Drugs 18: ((2007) ), 427–433. |
[20] | J.F. Coy, EDIM-TKTL1/Apo10 blood test: An innate immune system based liquid biopsy for the early detection, characterization and targeted treatment of cancer, Int J Mol Sci 18: ((2017) ). |
[21] | M. Grimm, M. Cetindis, M. Lehmann, T. Biegner, A. Munz, P. Teriete and S. Reinert, Apoptosis resistance-related ABCB5 and DNaseX (Apo10) expression in oral carcinogenesis, Acta Odontol Scand 73: ((2015) ), 336–342. |
[22] | M. Grimm, S. Schmitt, P. Teriete, T. Biegner, A. Stenzl, J. Hennenlotter, H.J. Muhs, A. Munz, T. Nadtotschi, K. Konig, J. Sanger, O. Feyen, H. Hofmann, S. Reinert and J.F. Coy, A biomarker based detection and characterization of carcinomas exploiting two fundamental biophysical mechanisms in mammalian cells, BMC Cancer 13: ((2013) ), 569. |
[23] | M. Los, D. Neubuser, J.F. Coy, M. Mozoluk, A. Poustka and K. Schulze-Osthoff, Functional characterization of DNase X, a novel endonuclease expressed in muscle cells, Biochemistry 39: ((2000) ), 7365–7373. |
[24] | G. Kayser, W. Sienel, B. Kubitz, D. Mattern, E. Stickeler, B. Passlick, M. Werner and A. Zur Hausen, Poor outcome in primary non-small cell lung cancers is predicted by transketolase TKTL1 expression, Pathology 43: ((2011) ), 719–724. |
[25] | M. Semilia, J. Hennenlotter, C. Pavone, T. Bischoff, U. Kuhs, G. Gakis, J. Bedke, A. Stenzl, C. Schwentner and T. Todenhofer, Expression patterns and prognostic role of transketolase-like 1 in muscle-invasive bladder cancer, World J Urol 33: ((2015) ), 1403–1409. |
[26] | M. Krockenberger, A. Honig, L. Rieger, J.F. Coy, M. Sutterlin, M. Kapp, E. Horn, J. Dietl and U. Kammerer, Transketolase-like 1 expression correlates with subtypes of ovarian cancer and the presence of distant metastases, Int J Gynecol Cancer 17: ((2007) ), 101–106. |
[27] | I. Tsaur, K. Thurn, E. Juengel, E. Oppermann, K. Nelson, C. Thomas, G. Bartsch, G.M. Oremek, A. Haferkamp, P. Rubenwolf and R.A. Blaheta, Evaluation of TKTL1 as a biomarker in serum of prostate cancer patients, Cent European J Urol 69: ((2016) ), 247–251. |
[28] | N. Jansen and J.F. Coy, Diagnostic use of epitope detection in monocytes blood test for early detection of colon cancer metastasis, Future Oncol 9: ((2013) ), 605–609. |
[29] | M. Grimm, W. Kraut, S. Hoefert, M. Krimmel, T. Biegner, P. Teriete, M. Cetindis, J. Polligkeit, S. Kluba, A. Munz and S. Reinert, Evaluation of a biomarker based blood test for monitoring surgical resection of oral squamous cell carcinomas, Clin Oral Investig 20: ((2016) ), 329–338. |
[30] | A. Mayer, A. von Wallbrunn and P. Vaupel, Evidence against a major role for TKTL-1 in hypoxic and normoxic cancer cells, Adv Exp Med Biol 701: ((2011) ), 123–128. |
[31] | X. Jia, C. Shan, O. Xu and J. Wang, Expression and clinical significance of MTDH, HIF-1alpha and TKTL1 in laryngeal carcinoma, Lin Chung Er Bi Yan Hou Tou Jing Wai Ke Za Zhi 29: ((2015) ), 2133–2138. |
[32] | S. Diaz-Moralli, E. Aguilar, S. Marin, J.F. Coy, M. Dewerchin, M.R. Antoniewicz, O. Meca-Cortes, L. Notebaert, B. Ghesquiere, G. Eelen, T.M. Thomson, P. Carmeliet and M. Cascante, A key role for transketolase-like 1 in tumor metabolic reprogramming, Oncotarget 7: ((2016) ), 51875–51897. |
[33] | O. Warburg, F. Wind and E. Negelein, The metabolism of tumors in the body, J Gen Physiol 8: ((1927) ), 519–530. |
[34] | M.A. Caligiuri, Human natural killer cells, Blood 112: ((2008) ), 461–469. |


