
High expression of TACC2 in hepatocellular carcinoma is associated with poor prognosis
Abstract
BACKGROUND:
Transforming acidic coiled-coil protein 2 (TACC2) is a member of TACC family proteins which is mainly involved in the stabilization of spindles and regulation of microtubule dynamics through interactions with molecules involved in centrosomes/microtubules. TACC2 is involved in tumorigenesis of variety of cancers but the clinical significance of TACC2 protein in hepatocellular carcinoma (HCC) is still unclear.
OBJECTIVE:
This study aims to investigate the expression of TACC2 in HCC and determine if clinical significance and prognostic relevance exists.
METHODS:
We performed quantitative PCR (qPCR) and western blot to examine TACC2 mRNA and protein expression in paired HCC tissues and matched adjacent non-cancerous tissues. Immunohistochemistry was performed in 106 postoperative HCC samples.
RESULTS:
There was higher expression of TACC2 protein and mRNA in HCC tissue. Immunohistochemistry analysis showed high expression of TACC2 in HCC tissue and was significantly associated with the capsular extension, tumor recurrence and shortened overall and disease free survival. The Cox regression analysis suggested that a high expression of TACC2 was an independent prognostic factor for HCC patients.
CONCLUSION:
This finding suggests that TACC2 may be a useful tool as a candidate biomarker to predict the recurrence and prognosis of HCC.
1.Background
Hepatocellular carcinoma (HCC) is the fifth most common cancer and the third most common cause of cancer-related mortality in the world [1]. Despite of advancement in the diagnosis and treatment of HCC, the incidence of HCC has been increasing in recent decades. Despite resection with the curative intent, the clinical course is variable and recurrence occurs in a high proportion of cases [2, 3]. HCC being aggressive disease, only 30–40% of patient are diagnosed early to receive curative therapy. While rest of the patient with advanced stage disease just receives palliative therapy [4, 5]. The long-term prognosis of patients undergoing potentially curative hepatic resection is still poor, with reported 5-year survival rates ranging from 17% to 53%. So, a new biomarker is desperately required for the early diagnosis and to determine recurrence of HCC.
Table 1
Correlation between TACC2 and clinicopathological variables of HCC
| Variables | Cases ( | TACC2 expression | ||
|---|---|---|---|---|
| Low ( | High ( |
| ||
| Age (years) | 0.102 | |||
| | 59 | 37 (62.7%) | 22 (37.3%) | |
| | 47 | 22 (46.8%) | 25 (53.2%) | |
| Gender | 0.925 | |||
| Male | 83 | 46 (55.4%) | 37 (44.6%) | |
| Female | 23 | 13 (56.5%) | 10 (43.5%) | |
| AFP | 0.342 | |||
| | 64 | 38 (59.4%) | 26 (40.6%) | |
| | 42 | 21 (50%) | 21 (50%) | |
| Differentiation | 0.361 | |||
| GI/G2 | 66 | 39 (59.1%) | 27 (40.9%) | |
| G3/G4 | 40 | 20 (50%) | 20 (50%) | |
| Tumor status (T) | 0.071 | |||
| T1/T2 | 83 | 50 (60.2%) | 33 (39.8%) | |
| T3/T4 | 23 | 19 (39.1%) | 14 (60.9%) | |
| Tumor size | 0.105 | |||
| | 43 | 28 (65.1%) | 15 (34.9%) | |
| | 63 | 31 (49.2%) | 32 (50.8%) | |
| Clinical stage | 0.042 | |||
| I/II | 80 | 49 (61.3%) | 31 (38.8%) | |
| III/IV | 26 | 10 (38.5%) | 16 (61.5%) | |
| Tumor nodules | 0.065 | |||
| Single | 73 | 45 (61.6%) | 28 (38.4%) | |
| Multiple | 33 | 14 (42.4%) | 19 (57.6%) | |
| Capsule | 0.023 | |||
| No | 37 | 18 (48.6%) | 19 (51.4%) | |
| Incomplete | 39 | 18 (46.2%) | 21 (53.8%) | |
| Complete | 30 | 23 (76.7%) | 7 (23.3%) | |
| Tumor location | 0.400 | |||
| Left lobe | 36 | 18 (50%) | 18 (50%) | |
| Right lobe | 70 | 41 (58.6%) | 29 (41.4%) | |
| Recurrence |
| |||
| No | 34 | 28 (82.4%) | 6 (17.6%) | |
| Yes | 72 | 31 (43.1%) | 41 (56.9%) | |
| Cirrhosis | 0.342 | |||
| Absent | 42 | 21 (50%) | 21 (50%) | |
| Present | 64 | 38 (59.4%) | 26 (40.6%) | |
| Overall survival |
| |||
| Dead | 66 | 25 (37%) | 41 (62.1%) | |
| Alive | 40 | 34 (85%) | 6 (15%) | |
Note:
Transforming acid coiled-coil (TACC) protein is regarded as centrosome and microtubule binding protein which are known to play a vital role in the stabilization of spindles and regulation of microtubule dynamics during cell division [6]. Mammalian TACC protein family namely TACC1, TACC2 and TACC3, which localizes at the centrosome and interacts with microtubules, have been implicated in the control of cell growth and differentiation during cell division [7]. But aberrant expression of one or more TACC proteins may affect gene regulation through their interaction with components of chromatin remodeling complexes, thus contributing to tumorigenesis [8]. Several studies demonstrated overexpression of TACC2 in different types of cancer. TACC2 promotes androgen mediated growth in the prostate cancer [9]. Overexpression of TACC2 leads to proliferation of breast cancer cell and associates with poor prognosis [10, 11]. High levels of TACC2 have been shown to be significantly associated with a poor event-free survival in the infant acute lymphoblastic leukemia [12]. To the contrary TACC2 also acts as a putative tumor suppressor in breast cancer [13]. So, it’s still controversial whether TACC2 is upregulated or downregulated in different type of cancer.
Furthermore, studies regarding TACC2 in HCC are lacking. So, we analyzed HCC data from the Oncomine database and identified TACC2 as a potential gene for the determination of new prognostic marker in HCC. The aim of the current study is to identify the role and expression pattern of TACC2 in HCC and to determine if the clinical significance and prognostic relevance exist.
2.Materials and methods
2.1Human liver tissue specimen
This study included 106 HCC patients who underwent surgical resection in Sun Yat-sen cancer center, Guangzhou china, from 2006 to 2007. Written informed consent was obtained from all the patients and was approved by the Ethics Committee of Sun Yat-sen University, Guangzhou, China. Normal background and cancer specimens were verified by pathologist, and confirmed that the background samples were free of cancer cells. None of the patient received neoadjuvant therapy but received adjuvant therapy including Transcatheter arterial chemoembolization (TACE) and Radiofrequency ablation (RFA) in selected patient. Patient with metastatic disease and unclear resection margin were excluded from the study. Patient age, sex, tumor size, location, tumor number, cirrhosis, lymph node status, pathological differentiation, TNM staging, capsulation was recorded by reviewing the patient medical records. The clinical data for these samples are described in detail in Table 1. Follow-up assessments were performed every 3 months postoperatively for the first years, followed by every 6 months later. The follow-up for the cohort was 8 years.
2.2Western blot
We performed western blot in eight pairs of HCC tissues and matched adjacent non-cancerous tissues. BCA protein assay kit (Pierce, Rockford, IL, USA) was used to quantify the protein level. Then, 40
2.3Real-time quantitative PCR
RNA was extracted from frozen tissue specimens using TRIZOL reagent (Invitrogen) according to the manufacturer’s instructions. Complementary DNA (cDNA) was synthesized using a reverse transcriptase kit (Invitrogen). TACC2 and
2.4Immunohistochemistry (IHC)
Total 106 HCC specimens were selected for im- munohistochemical (IHC) staining to determine TACC2 expression. The paraffin-embedded HCC specimens were sliced into 4-
Figure 1.
The cutoff value was calculated by ROC curve analysis (AUC
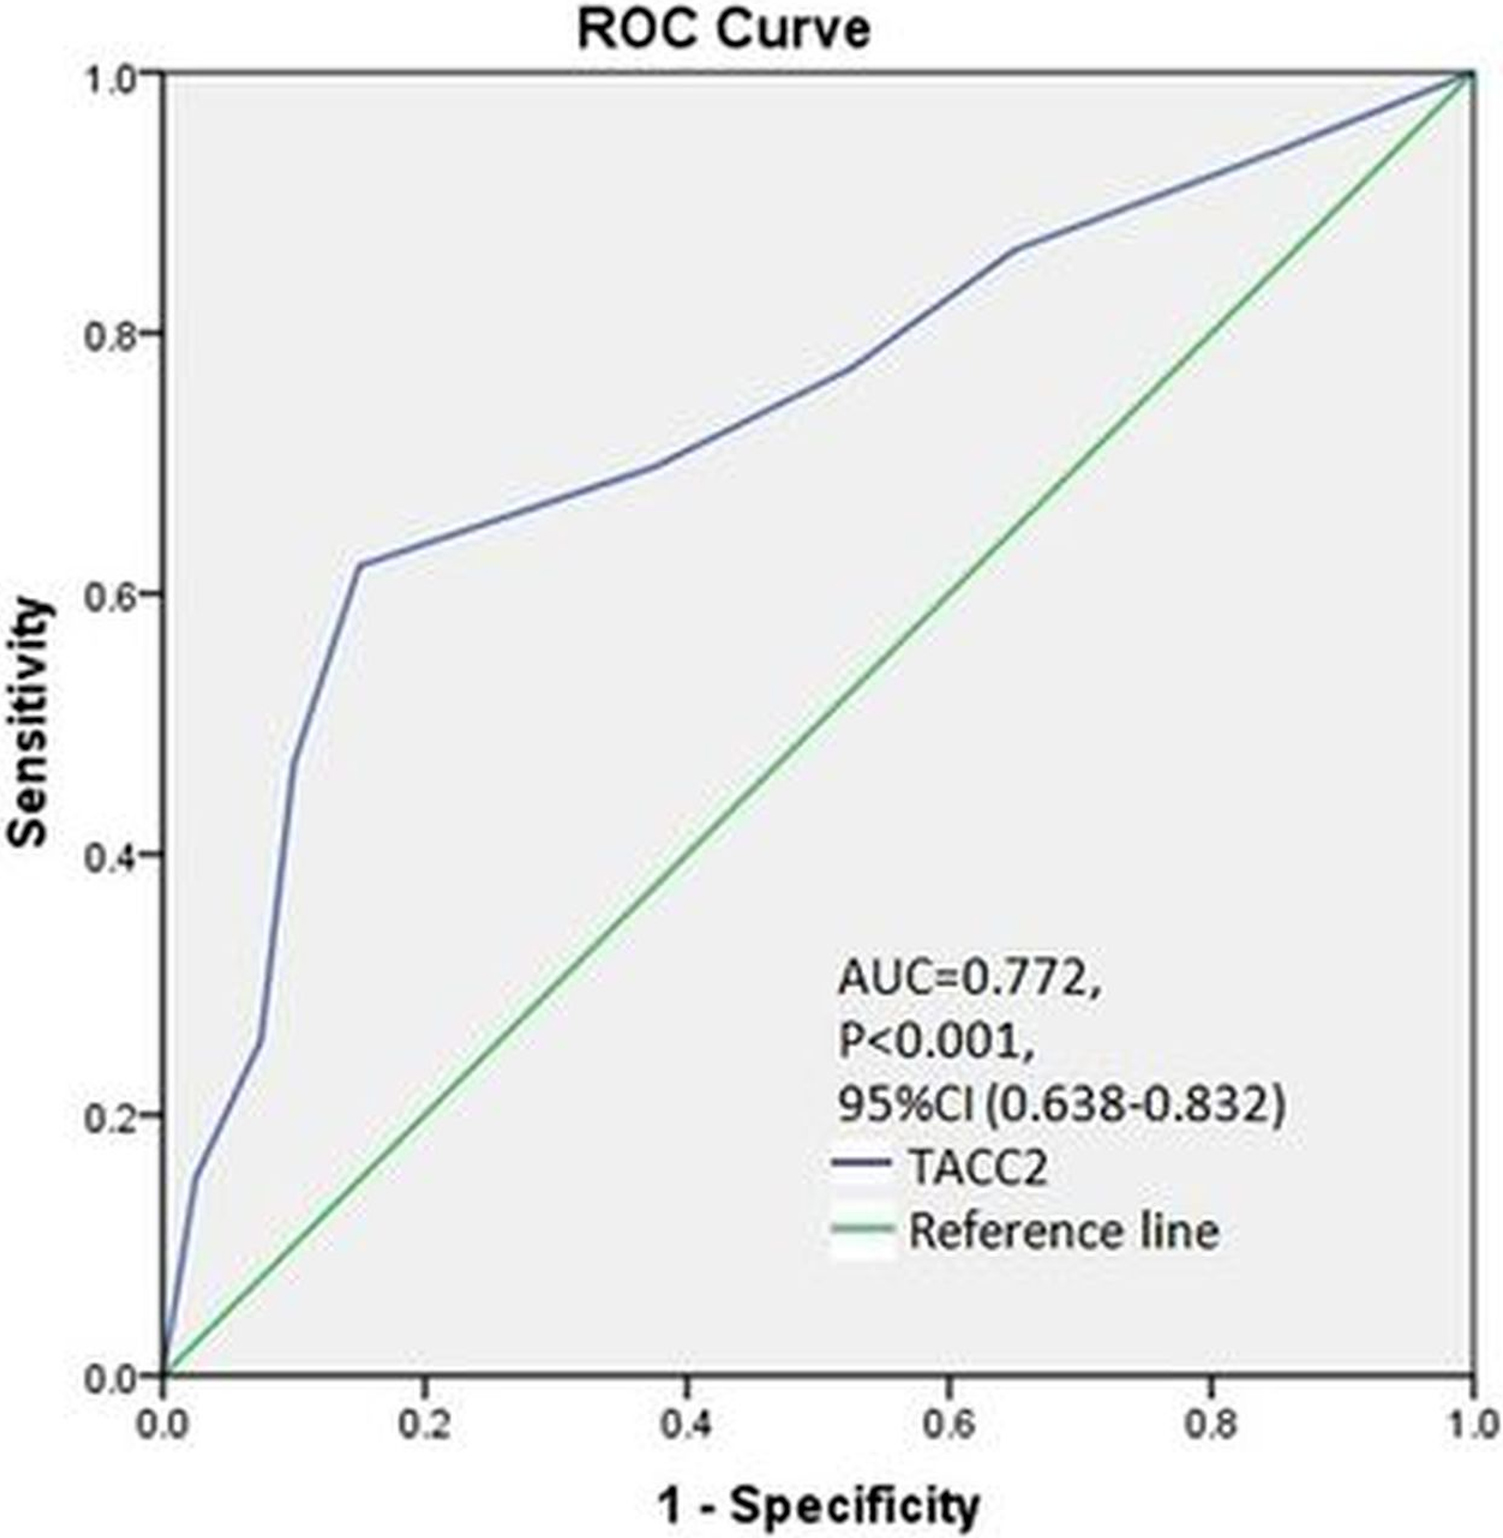
2.5IHC analysis and selection of cutoff score
The staining intensity was marked as 0 (no staining), 1
3.Statistical analysis
Data analyses were performed using SPSS v-20 (IBM) and Prism software (Graph Pad). Chi-square test was used to determine the correlation between TACC2 expression and the clinicopathological variables.
Figure 2.
Protein expression of TACC2 in 8 pairs of HCC and adjacent normal tissues determined by western blot. N, normal tissue; T, tumor tissue.
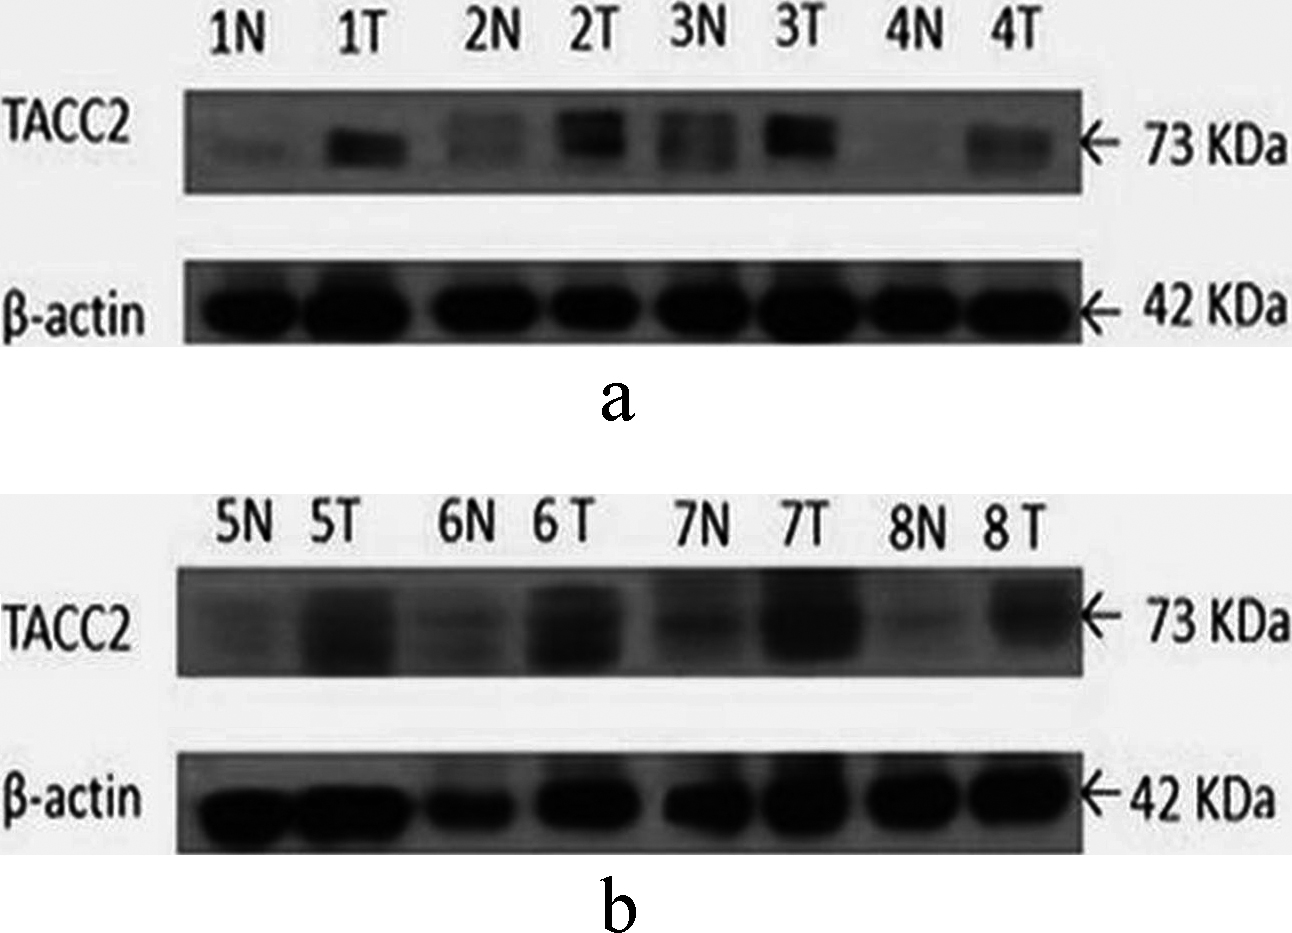
Figure 3.
mRNA expression of TACC2 in 23 pairs of HCC and adjacent normal tissues determined by q-PCR. N, matched noncancerous tissue; T, tumor tissue.
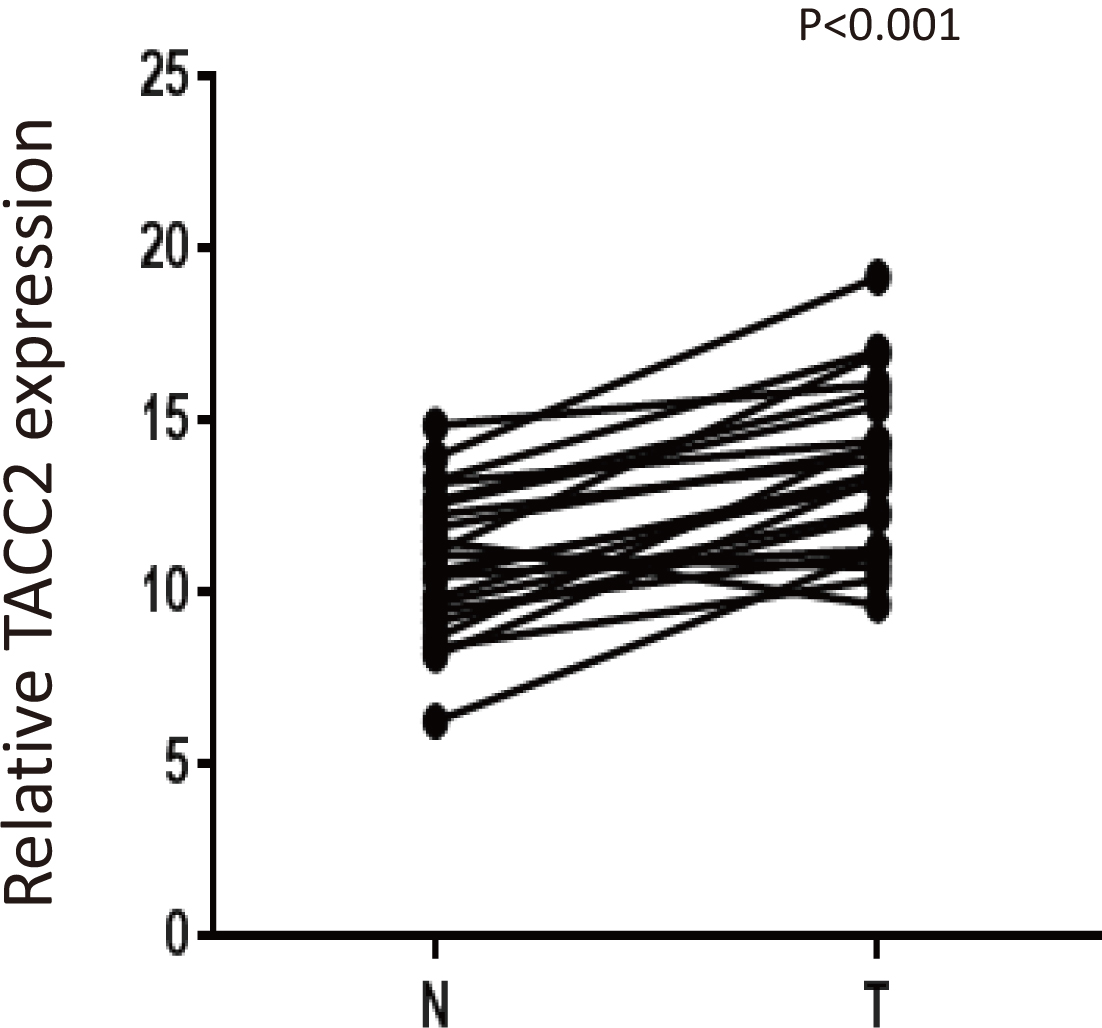
Figure 4.
Representative images of TACC2 expression in normal and HCC tissues via IHC. (a and b) TACC2 was absent in adjacent normal cells, whereas it was positively detected in HCC cells (magnification, x100 and x400).
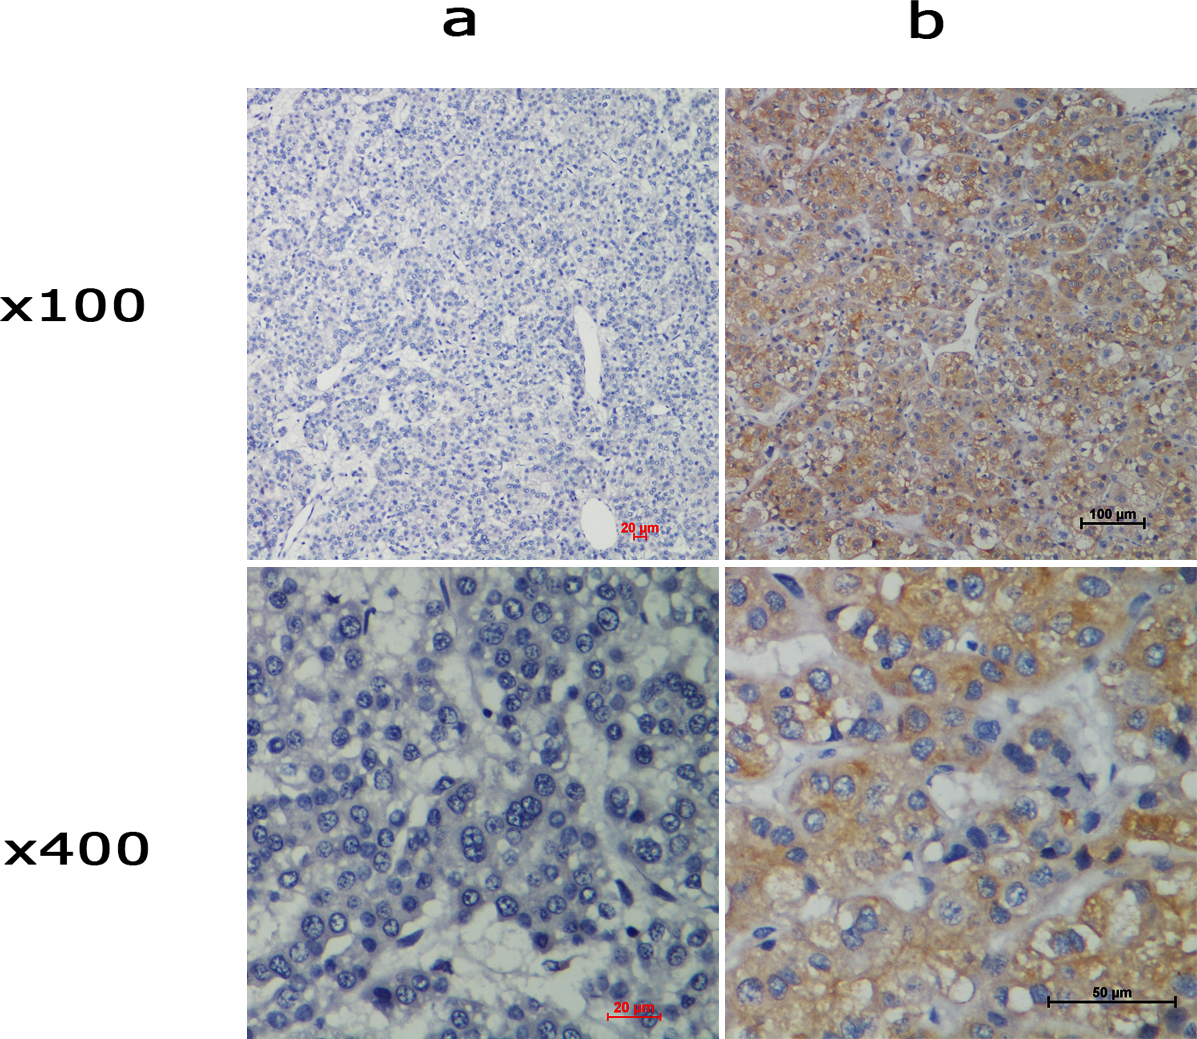
Figure 5.
Expression of TACC2 in HCC tissues by immunohistochemistry staining. (a) negative staining, (b) weak staining, (c) moderate staining, and (d) strong staining (original magnification, x100 and x400).
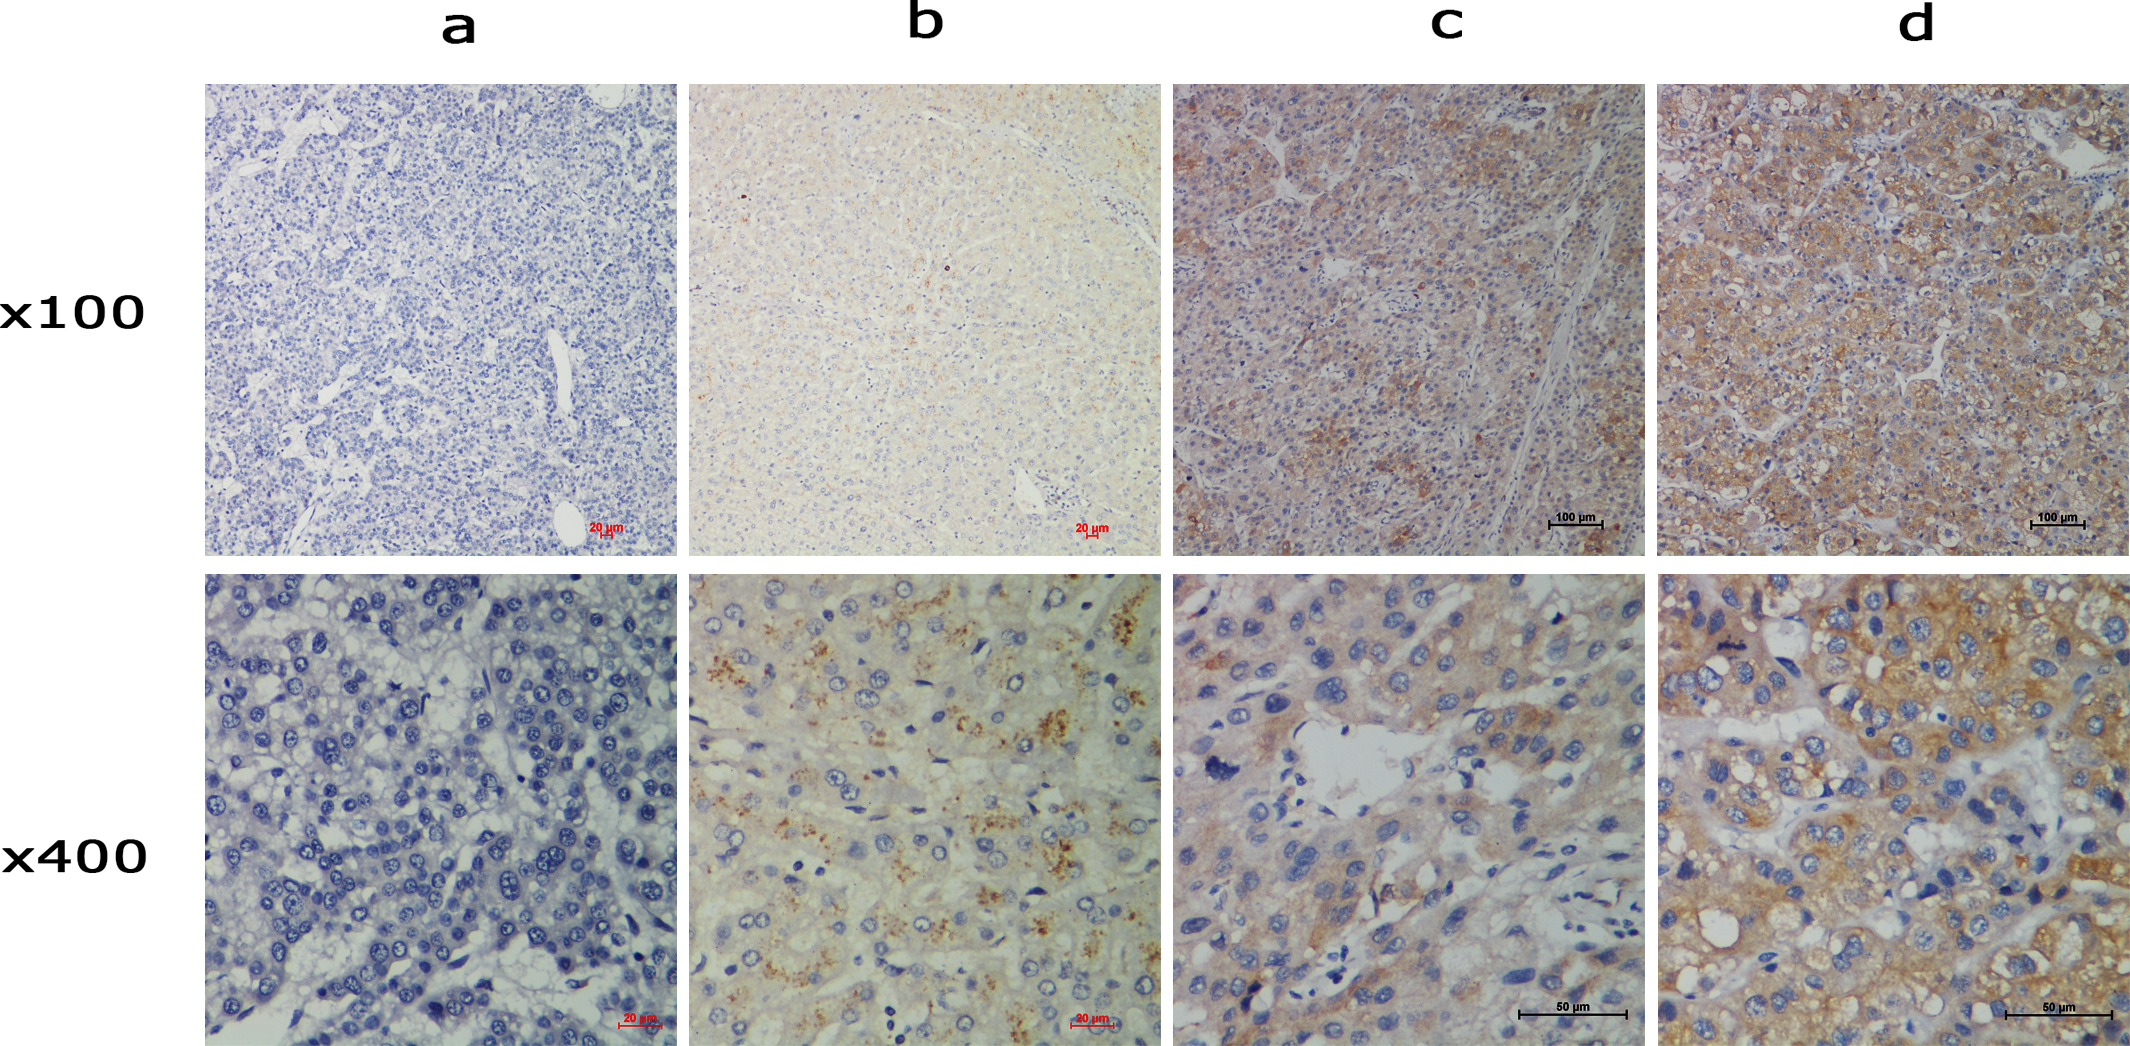
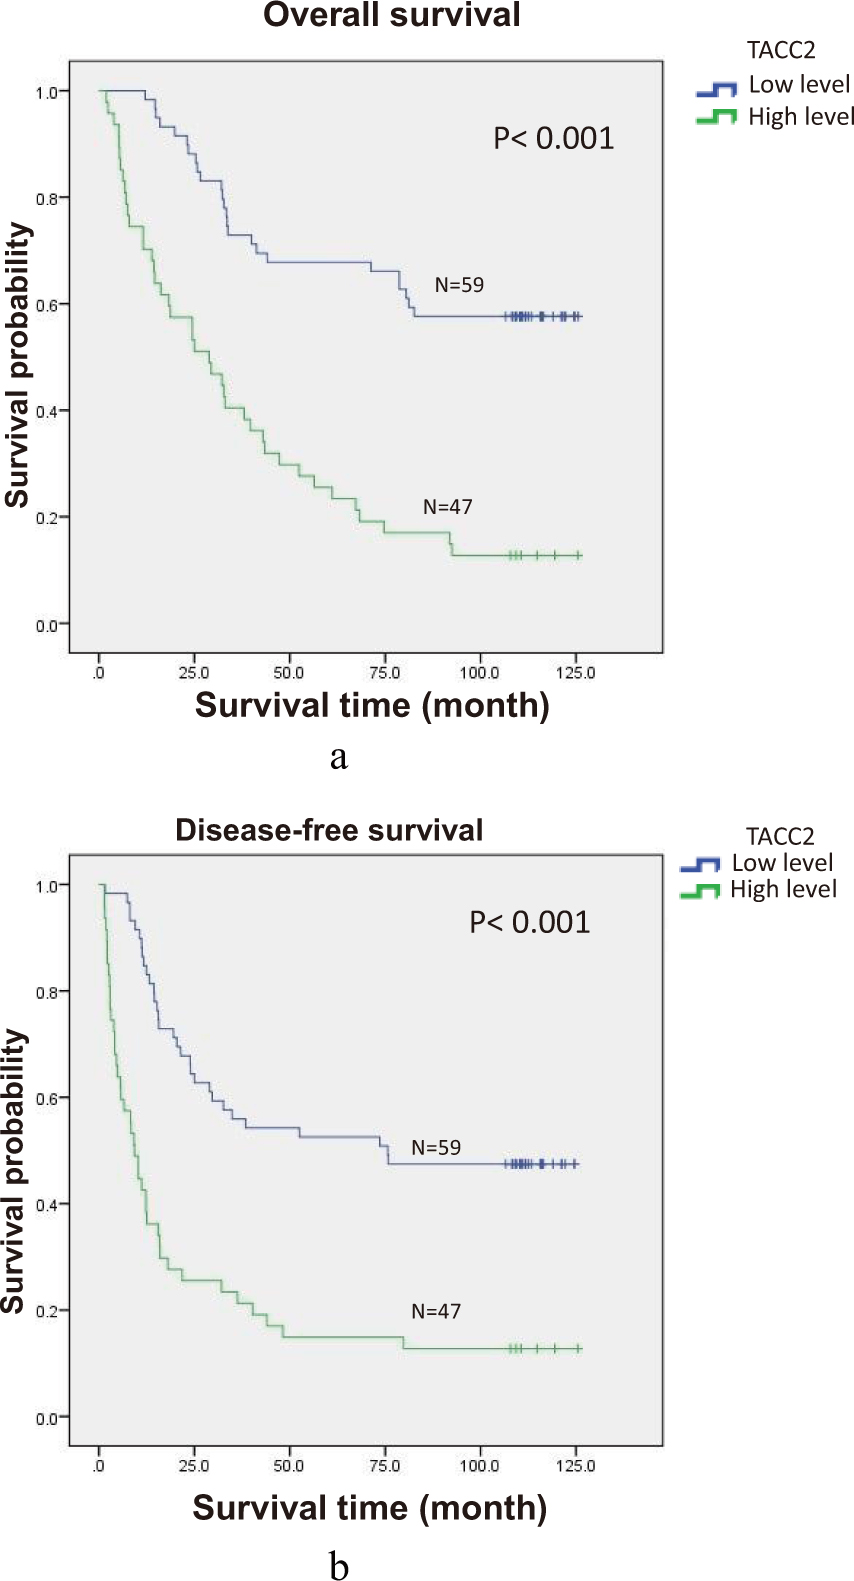
Figure 6.
Survival curves of 106 patients according to TACC2 expression (log-rank test). (a) Probability of OS for all HCC patients: Low TACC2 expression, N
4.Results
4.1Western blot analysis
Western blot was performed to determine the protein expression of TACC2 in eight pairs of HCC tissue samples and adjacent non-cancerous tissues. The paired samples exhibited a higher protein expression of TACC2 in HCC tissues than in the adjacent non-cancerous tissues (Fig. 2).
4.2Quantitative-PCR analysis
qPCR was performed in 23 pairs of HCC tissue and adjacent non-cancerous tissues from the same patients. There was increased expression of TACC2 mRNA in the tumor tissue compared to normal background tissue which showed statistically significance difference (
4.3IHC analysis
In HCC samples, TACC2 immunoreactivity was generally confined to the cytoplasm of tumor cells. IHC staining showed high expression of TACC2 in cancer cells and negative or weak expression in adjacent normal cells from the same patient specimens (Fig. 4). Negative staining, weak staining, moderate staining, and strong staining intensity of TACC2 are presented in Fig. 5. Patients were divided into low TACC2 expression (IHC score
4.4TACC2 expression and its association with the clinicopathological characteristics
There was higher expression of TACC2 in clinical stage III/IV than in stage I/II which could reach the statistically significant difference (
4.5TACC2 expression and survival status
Of the 106 patients in this study, sixty-six cancer related deaths had occurred at the end of our study with the median follow up period of 62.4 months (range, 2 to 125 months). Using the Kaplan–Meier survival curve method and Cox proportion hazards analysis, patient with high TACC2 expression exhibited a significantly shorter OS (41.3 vs. 89.2 months, log-rank test
4.6Univariate and multivariate analysis of the prognostic factors
The prognostic value of TACC2 expression was confirmed by Cox regression analysis. Clinical characteristics, including age, gender, histological grade, T status, cirrhosis, AFP, tumor size, location, staging, extracapsular extension, and TACC2 expression were included in the univariate analysis to assess their impact on OS and DFS of HCC patients. This analysis showed OS impact on pathological differentiation, T status, staging, tumor nodules, capsule status, tumor location and TACC2 expression. Therefore, these factors were further examined using a multivariate analysis. Tumor location and TACC2 expression were identified as independent prognostic factors (Table 2). Similarly, univariate analysis showed DFS impact on pathological differentiation, T status, staging, tumor nodules, tumor location and TACC2 expression and in multivariate analysis tumor nodules and TACC2 were identified as independent prognostic factors (Table 3).
Table 2
Univariate and multivariate COX regression analyses for overall survival in patients with hepatocellular carcinoma
| Variables | Univariate analysis | Multivariate analysis | ||||
|---|---|---|---|---|---|---|
| HR | (95% CI) | p-value | HR | (95% CI) | p-value | |
| Age (years) | 0.171 | |||||
| ( | 1.402 | (0.864–2.274) | ||||
| Gender | 0.137 | |||||
| M/F | 0.600 | (0.306–1.177) | ||||
| AFP | 0.359 | |||||
| | 1.259 | (0.770–2.057) | ||||
| Differentiation | 0.015 | 0.103 | ||||
| GI/G2 vs G3/G4 | 1.828 | (1.124–2.974) | 1.534 | (0.917–2.568) | ||
| Tumor status (T) |
| 0.623 | ||||
| T1/T2 vs T3/T4 | 2.815 | (1.649–4.805) | 2.439 | (0.555–10.71) | ||
| Tumor size | 0.260 | |||||
| | 1.329 | (0.811–2.179) | ||||
| Clinical stage |
| |||||
| I/II vs III/IV | 2.811 | (1.672–4.725) | ||||
| Tumor nodules |
| 0.236 | ||||
| (Single vs multiple) | 2.549 | (1.555–4.178) | 1.496 | (0.768–2.912) | ||
| Capsule | 0.015 | 0.111 | ||||
| No vs incomplete vs complete | 0.692 | (0.515–0.930) | 0.771 | (0.560–1.062) | ||
| Tumor location | 0.015 | 0.030 | ||||
| Left lobe vs right lobe | 0.546 | (0.335–0.891) | 0.576 | (0.350–0.949) | ||
| Cirrhosis | 0.319 | |||||
| (Absent vs present) | 0.780 | (0.479–1.271) | ||||
| TACC2 |
| 0.001 | ||||
| | 3.759 | (2.268–6.231) | 3.075 | (1.807–5.234) | ||
Note:
Table 3
Univariate and multivariate COX regression analyses for disease free survival in patients with hepatocellular carcinoma
| Variables | Univariate analysis | Multivariate analysis | ||||
|---|---|---|---|---|---|---|
| HR | (95% CI) | HR | (95% CI) | |||
| Age (years) | 0.123 | |||||
| ( | 1.440 | (0.906–2.287) | ||||
| Gender | 0.132 | |||||
| M/F | 0.609 | (0.320–1.160) | ||||
| AFP | 0.642 | |||||
| | 1.119 | (0.696–1.798) | ||||
| Differentiation | 0.019 | 0.115 | ||||
| GI/G2 vs G3/G4 | 1.094 | (1.094–2.787) | 1.482 | (0.908–2.419) | ||
| Tumor status (T) | 0.001 | 0.918 | ||||
| T1/T2 vs T3/T4 | 2.668 | (1.581–4.503) | 1.081 | (0.242–4.822) | ||
| Tumor size | 0.293 | |||||
| | 1.287 | (0.804–2.060) | ||||
| Clinical stage | 0.001 | 0.541 | ||||
| I/II vs III/IV | 2.592 | (1.561–4.306) | 1.582 | (1.717–4.553) | ||
| Tumor nodules |
| 0.030 | ||||
| (Single vs multiple) | 2.710 | (1.681–4.368) | 1.960 | (1.067–3.600) | ||
| Capsule | 0.080 | |||||
| No vs incomplete vs complete | 0.784 | (0.592–1.037) | ||||
| Tumor location | 0.027 | 0.020 | ||||
| Left lobe vs right lobe | 0.588 | (0.366–0.943) | 0.566 | (0.350–0.914) | ||
| TACC2 | 0.001 | 0.001 | ||||
| | 3.202 | (1.996–5.137) | 2.796 | (1.717–4.553) | ||
Note:
5.Discussion
To our knowledge this is the first study to demonstrate the association of TACC2 with the clinicopathological features and survival status in HCC patient where higher expression of TACC2 correlates with tumor recurrence and shorter survival in HCC patients. TACC2 was highly expressed at the protein and mRNA levels in the tumor tissues compared with the normal tissues. IHC also demonstrated higher expression of TACC2 protein in the cytoplasm of HCC samples than in adjacent normal tissue. Furthermore, high level of TACC2 protein expression significantly correlated with tumor recurrence and shorter OS and DFS which suggest that TACC2 is associated with HCC progression and can be a potential independent prognostic indicator of survival for HCC patients.
At present, hepatic resection, radiofrequency ablation, trans-arterial chemoembolization, liver transplantation and sorafinib chemotherapy remains the treatment modalities [14, 15, 16]. Despite the advancement in the management of HCC, recurrence is high and prognosis is still poor. At present
Each of the TACC family members only partially overlaps with each other. TACC2, in contrast to TACC3, is primarily expressed in post-mitotic tissues, with the highest levels of expression in the brain, heart, muscle and kidney [20]. Numerous attempts have failed to determine detectable levels of TACC2 protein, contrary to TACC3 protein, which is readily detectable. It is consistent with the considerably low levels of TACC2 RNA relative to those of TACC3 RNA but may also indicate that the TACC2 protein is more unstable and/or alternatively expressed at low levels in vivo [20].
TACC proteins are involved in the regulation of interaction between centrosome and microtubule which could explain the link between TACC gene and cancer [21]. Decreasing level of TACC at the centrosome leads to failure in pronuclear fusion, nuclear migration and chromosome segregation. Whereas increasing level of TACC also leads to defective chromosomal segregation and ultimately cancers. Several studies have demonstrated TACC1 and TACC3 exert an oncogenic role in different cancers. TACC1 promotes transformation and mammary tumorigenesis in a mouse model which was also overexpressed in prostate cancer [22, 23]. TACC3 is up-regulated in various cancer including esophageal cancer, gastric cancer, hepatocellular cancer, breast cancer, colorectal cancer, ovarian cancer and non-small cell lung cancer [24, 25, 26, 27, 28, 29]. Although there are several studies which demonstrates TACC2 acting as both oncogene and tumor suppressor gene in different types of cancer, this study demonstrates an oncogene role of TACC2 as there is overexpression of TACC2 both in protein and mRNA level which associate with recurrent disease and poor prognosis.
Several studies have demonstrated TACC2 plays an important role in the progression and development of cancers via their function in the formation of the mitotic spindle during mitosis [6]. Chen et al. identified TACC2 as a tumor suppressor protein called AZU-1 which was downregulated in breast cancer cell lines and primary tumors whereas normal level of TACC2/AZU-1 protein was associated with reduced malignancy [13]. Schuendeln et al. demonstrated TACC2 is not required for normal development and its deficiency don’t lead to cancer in animal model but TACC3 deficiency caused embryonic lethality at midgestation and affects a variety of cell types [20]. To the contrary, Shan Cheng et al. demonstrated overexpression of TACC2 in breast cancer patient which correlated with poor prognosis of a patient [10]. Recent study performed by Yoshiaki Onodera et al. also demonstrated TACC2 plays a crucial role in breast cancer cell proliferation and TACC2 status was significantly associated with recurrence and worse prognosis of breast cancer patient [11]. Similarly, Kenichi Takayama et al. also demonstrated overexpression of TACC2 in prostate cancer which promotes tumor progression in prostate cancer by regulating cell cycle during mitosis and high TACC2 immunoreactivity correlated with poor prognosis [9]. So our study was consistent with above results except that of Chen et al. [13].
In this study, high level of TACC2 was detected in 44% of HCC samples by immunohistochemistry, while it was negligible in normal adjacent tissue. Correlation analysis of clinicopathological parameters and TACC2 expression revealed that TACC2 expression was significantly correlated with clinical stage (
Based on our results, patients with a high level of TACC2 expression can be an alarming sign and could be given more priority regarding the management of HCC patient and recommended for aggressive adjuvant therapy to reduce tumor recurrence and improve survival. Collectively, our data indicate that TACC2 is a predictive factor for the survival of HCC patients and it may be used as a novel marker for HCC recurrence and prognosis.
6.Conclusion
We demonstrated higher TACC2 expression in HCC tissue which was significantly associated with poor prognosis and was an independent prognostic factor for overall and disease free survival. These results demonstrate that the degree of TACC2 expression may be relevant in terms of patient survival and may be used as a prognostic marker for HCC patient.
Acknowledgments
This study was funded by the Key Grant of National Nature Science Foundation of China (grant no. 81230045; 81602143).
References
[1] | F. Kamangar, G.M. Dores and W.F. Anderson, Patterns of cancer incidence, mortality, and prevalence across five continents: Defining priorities to reduce cancer disparities in different geographic regions of the world, Journal of clinical oncology: Official journal of the American Society of Clinical Oncology 24: ((2006) ), 2137–2150. |
[2] | J. Yamamoto et al., Recurrence of hepatocellular carcinoma after surgery, British J Surgery 83: (9) ((1996) ), 1219–1222. |
[3] | X.P. Chen et al., Long-term outcome of resection of large hepatocellular carcinoma, Br J Surgery 93: (5) ((2006) ), 600–606. |
[4] | A. Forner, M. Llovet and J. Bruix, Chemoembolization for intermediate HCC: Is there proof of survival benefit? Journal of Hepatology 56: ((2012) ), 984–986. |
[5] | C. Armengol et al., p27 (Kip1) is an independent predictor of recurrence after surgical resection in patients with small hepatocellular carcinoma, Journal of Hepatology 38: ((2003) ), 591–597. |
[6] | I. Peset and I. Vernos, The TACC proteins: TACC-ling microtubule dynamics and centrosome function, Trends in Cell Biology 18: (8) ((2008) ). |
[7] | F. Gergely et al., The TACC domain identifies a family of centrosomal proteins that can interact with microtubules, Proc Natl Acad Sci 97: ((2000) ), 14352–14357. |
[8] | O. Gangisetty et al., The transforming acidic coiled coil proteins interact with nuclear histone acetyltransferases, Oncogene 23: ((2004) ), 2559–2563. |
[9] | K. Takayama et al., TACC2 is an androgen-responsive cell cycle regulator promoting androgen-mediated and castration-resistant growth of prostate cancer, Molecular Endocrinology 26: ((2012) ), 748–761. |
[10] | S. Cheng et al., Transforming acidic coiled-coil-containing protein 2 (TACC2) in human breast cancer, expression pattern and clinical/prognostic relevance, Cancer Genomics & Proteomics 7: ((2010) ), 67–74. |
[11] | Y. Onodera et al., TACC2 (transforming acidic coiled-coil protein 2) in breast carcinoma as a potent prognostic predictor associated with cell proliferation, Cancer Medicine 5: (8) ((2016) ), 1973–1982. |
[12] | H. Kang et al., Gene expression profiles predictive of outcome and age in infant acute lymphoblastic leukemia, Children’s Oncology Group study, Blood 119: ((2012) ), 1872–1881. |
[13] | H.M. Chen et al., AZU-1: A candidate breast tumor suppressor and biomarker for tumor progression, Mol Biol Cell 11: ((2000) ), 1357–1367. |
[14] | J.M. Lovet, A. Burroughs, J. Bruix, Hepatocellular carcinoma, Lancet 362: ((2003) ), 1907–1917. |
[15] | M. Schwartz, S. Roayaie, M. Konstadoulakis, Strategies for the management of hepatocellular carcinoma, Nat Clin Pract Oncol 4: ((2007) ), 424–432. |
[16] | H.B. El-serag, L. Rudolph, Hepatocellular carcinoma: Epidemiology and molecular carcinogenesis, Gastroenterology 132: ((2007) ), 2557–2576. |
[17] | K. Taketa, Alpha-fetoprotein: Reevaluation in hepatology, Hepatology 12: ((1990) ), 1420–32. |
[18] | F. Farinati et al., Diagnostic and prognostic role of alpha-fetoprotein in hepatocellular carcinoma: Both or neither? Am J Gastroenterology 101: ((2006) ), 524–532. |
[19] | H.B. EL-Serag et al., Diagnosis and treatment of hepatocellular carcinoma, Gastroenterology 134: ((2008) ), 1752–1763. |
[20] | M.M. Schuendeln et al., The centrosomal, putative tumor suppressor protein TACC2 is dispensable for normal development, and deficiency does not lead to cancer, Mol Cell Biol 24: ((2004) ), 6403–6409. |
[21] | J.W. Raff, Centrosomes and cancer: Lessons from a TACC, Trends Cell Biol 12: ((2002) ), 222–225. |
[22] | M. Cully et al., Transforming acidic coiled coil 1 promotes transformation and mammary tumorigenesis, Cancer Res 65: ((2005) ), 10363–10370. |
[23] | S.M. Dhanasekaran et al., Delineation of prognostic biomarkers in prostate cancer, Nature 412: ((2001) ), 822–826. |
[24] | M. Yun et al., High expression of transforming acidic coiled coil containing protein 3 strongly correlates with aggressive characteristics and poor prognosis of gastric cancer, Oncology Reports 34: ((2015) ), 1397–1405. |
[25] | Y. Du et al., TACC3 promotes colorectal cancer tumourigenesis and correlates with poor prognosis, Oncotarget 7: (27) ((2016) ), 41885–41897. |
[26] | Z.L. Huang et al., High expression of TACC3 in esophageal squamous cell carcinoma correlates with poor prognosis, Oncotarget 6: (9) ((2015) ), 6850–6861. |
[27] | D.S. Zhou et al., TACC3 promotes stemness and is a potential therapeutic target in hepatocellular carcinoma, Oncotarget 6: (27) ((2015) ), 24163–24177. |
[28] | B. Lauffart et al., Aberrations of TACC1 and TACC3 are associated with ovarian cancer, BMC Women’s Health 5: ((2005) ), 8. |
[29] | C.K. Jung et al., Expression of transforming acidic coiled-coil containing protein 3 is a novel independent prognostic marker in non-small cell lung cancer, Pathol Int 56: ((2006) ), 503–509. |


