
Infiltration of γδ T cells, IL-17+ T cells and FoxP3+ T cells in human breast cancer
Abstract
BACKGROUND:
Tumor-infiltrating lymphocytes (TILs) have a strong prognostic value in various forms of cancers. These data often refer to use of the pan-T cell marker CD3, or the cytotoxic T lymphocyte marker CD8
OBJECTIVE:
In this study we have investigated the prognostic effects of some unconventional T cell subtypes in breast cancer;
METHODS:
This was done using immunohistochemistry on a human breast cancer tissue microarray consisting of 498 consecutive cases of primary breast cancer.
RESULTS:
Infiltration of
CONCLUSIONS:
This study sheds further light on the prognostic impact of various T cell subtypes in breast cancer.
1.Introduction
Breast cancer is a heterogeneous disease consisting of different subtypes with varying prognosis [1]. It is however not only the breast cancer subtype that determines the prognostic outcome, but also the tumor microenvironment cell composition [2]. The cells of the immune system are an important part of the tumor microenvironment, where presence of tumor infiltrating lymphocytes (TILs) usually is associated with a better prognosis, while infiltration of myeloid cells is associated with a worse prognosis [3]. T lymphocytes is an important TIL population [3]. In breast cancer, infiltration of T cells has been linked to different outcomes in different breast cancer subtypes. In HER2
Table 1
Correlations between CD3, T cell subtypes and breast cancer molecular subtypes
| Breast cancer molecular subtypes | CD3 | Treg | IL-17 | CD8 | ||
|---|---|---|---|---|---|---|
| Triple-negative | Correlation coefficient | 0.181** | 0.107* | 0.216** | 0.151** | |
| 0.03 | 0.012 | 0.001 | ||||
|
| 407 | 412 | 401 | 404 | 493 | |
| Luminal A | Correlation coefficient | 0.021 | ||||
| 0.008 | 0.018 | 0.678 | 0.267 | |||
|
| 406 | 411 | 400 | 403 | 492 | |
| Luminal B | Correlation coefficient | 0.000 | 0.034 | .052 | ||
| 0.996 | 0.493 | 0.303 | 0.904 | 0.462 | ||
|
| 406 | 411 | 400 | 403 | 492 | |
| HER2 | Correlation coefficient | 0.144** | 0.137** | 0.231** | 0.033 | |
| 0.004 | 0.005 | 0.650 | 0.466 | |||
|
| 406 | 411 | 400 | 403 | 492 | |
| ER status | Correlation coefficient | 0.096 | ||||
| 0.054 | 0.008 | |||||
|
| 408 | 413 | 402 | 405 | 498 |
Spearman’s rho. 2-tailed
T cells can grossly be divided into cytotoxic T lymphocytes (CTLs; CD8
Figure 1.
IHC staining of T cell subpopulations in breast cancers and association to survival outcome. A) IHC stainings in breast cancer TMA showing CD3; brown staining,
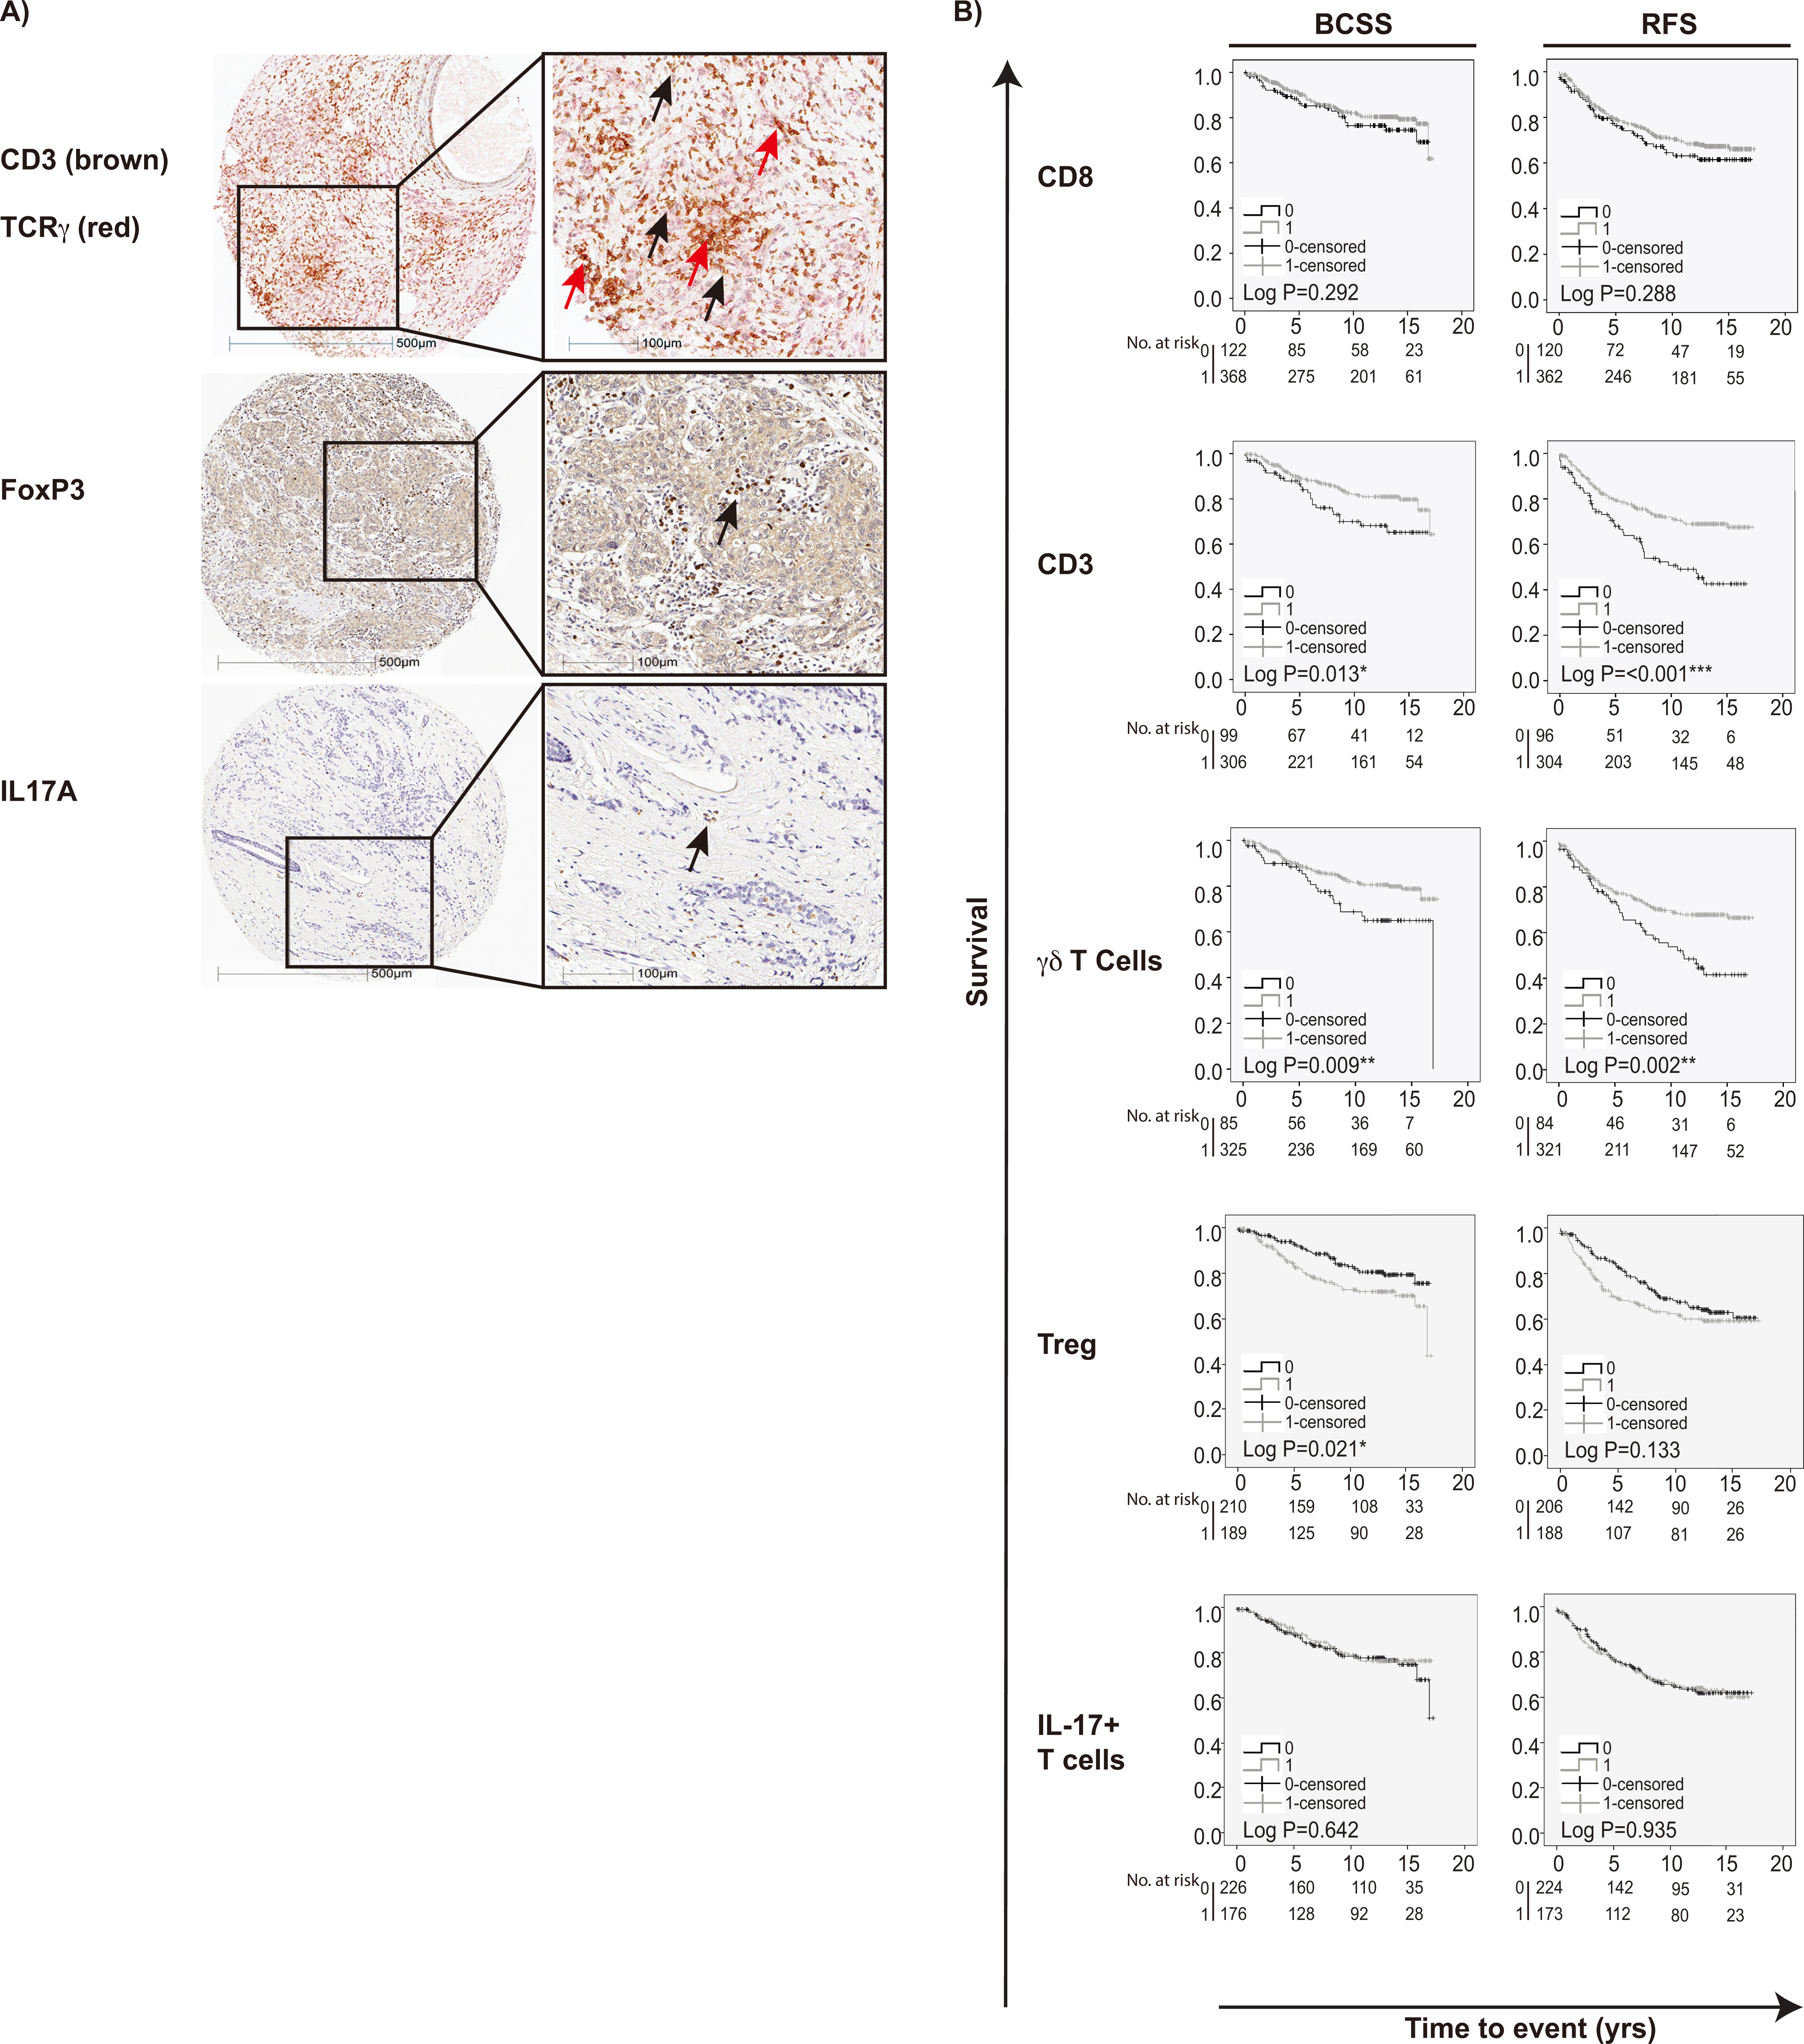
There are many reports concerning the prognostic and predictive impact of infiltrating T cells on breast cancer survival, but often only CD3, CD8 or FoxP3-positive T cells have been evaluated [23]. Furthermore, the T cell subpopulations
2.Materials and methods
2.1Breast cancer patients
The study cohort has been previously described [27, 28, 29, 30] and included 498 patients that were diagnosed with invasive breast cancer between 1 January 1988 and 31 December 1992 at the Department of Pathology, Skåne University Hospital, Malmö. Patient characteristics are provided in Supplementary Table 1. Ethical approval for this study was obtained from the Ethics Committee at Lund University (Dnr 613/02). Informed consent was not required and patients were offered the option to opt out.
Table 2
Crosstab
| 0 | 1 | ||
|---|---|---|---|
| Numbers (all breast cancers) | |||
| CD8 | |||
| 0 | 31 | 70 | |
| 1 | 52 | 257 | 0.003** |
| FOXP3 | |||
| 0 | 62 | 142 | |
| 1 | 20 | 169 | |
| IL-17 | |||
| 0 | 47 | 173 | |
| 1 | 33 | 143 | 0.520 |
| Numbers (HER2 | |||
| CD8 | |||
| 0 | 2 | 1 | |
| 1 | 0 | 20 | |
2.2TMA, immunohistochemistry and staining assessment
Tissue microarrays (TMA) were constructed as previously described [27, 28, 29, 30]. Analysis of ER, PR and HER2 status of the tumors in the TMA, was performed according to current Swedish guidelines. For antibodies and staining procedures see Supplementary Table 2. Anti-TCR
2.3Statistical analysis
Spearman’s Rho test was applied using non-dicho- tomized CD3, TCR
3.Results
3.1Infiltration of alternative T cell subpopulations and associations to molecular subtypes of primary breast cancer
Representative staining patterns of the analyzed T cell-subpopulations and correlations between different T cell populations and breast cancer subtypes are shown in Fig. 1a and Supplementary Fig. 1.
As shown in Table 1, infiltration of CD8
Table 3
Univariable Cox regression analysis for BCSS and RFS
| BCSS | RFS | |||||
|---|---|---|---|---|---|---|
| HR (CI 95%) |
| HR (CI 95%) |
| |||
| Univariable Cox regression analysis with no stratification | ||||||
| CD8 | ||||||
| 0 | 1.00 | 122 | 1.00 | 120 | ||
| 1 | 0.78 (0.49–1.24) | 0.29 | 368 | 0.82 (0.56–1.19) | 0.29 | 362 |
| CD3 | ||||||
| 0 | 1.00 | 99 | 1.00 | 96 | ||
| 1 | 0.56 (0.35–0.89) | 0.015* | 306 | 0.50 (0.35–0.72) | 304 | |
| 0 | 1.00 | 85 | 1.00 | 84 | ||
| 1 | 0.53 (0.33–0.86) | 0.01** | 325 | 0.56 (0.38–0.81) | 0.002** | 321 |
| Treg | ||||||
| 0 | 1.00 | 210 | 1.00 | 206 | ||
| 1 | 1.67 (1.08–2.60) | 0.022* | 189 | 1.30 (0.92–1.83) | 0.134 | 188 |
| IL-17 | ||||||
| 0 | 1.00 | 226 | 1.00 | 224 | ||
| 1 | 0.90 (0.58–1.40) | 0.643 | 176 | 1.02 (0.72–1.44) | 0.935 | 173 |
| Univariable Cox regression analysis stratified for treated patients | ||||||
| CD8 | ||||||
| 0 | 1.00 | 38 | 1.00 | 37 | ||
| 1 | 0.47 (0.25–0.88) | 0.019* | 120 | 0.58 (0.34–0.99) | 0.044* | 120 |
| CD3 | ||||||
| 0 | 1.00 | 39 | 1.00 | 39 | ||
| 1 | 0.72 (0.37–1.39) | 0.324 | 106 | 0.59 (0.35–0.99) | 0.046* | 105 |
| 0 | 1.00 | 34 | 1.00 | 34 | ||
| 1 | 0.53 (0.28–1.01) | 0.054 | 115 | 0.59 (0.35–1.02) | 0.058 | 114 |
| Treg | ||||||
| 0 | 1.00 | 74 | 1.00 | 73 | ||
| 1 | 1.22 (0.66–2.27) | 0.528 | 68 | 1.20 (0.73–1.98) | 0.469 | 68 |
| IL-17 | ||||||
| 0 | 1.00 | 89 | 1.00 | 88 | ||
| 1 | 0.98 (0.52–1.85) | 0.952 | 56 | 0.96 (0.57–1.62) | 0.886 | 56 |
| Univariable Cox regression analysis stratified for untreated patients | ||||||
| CD8 | ||||||
| 0 | 1.00 | 56 | 1.00 | 55 | ||
| 1 | 0.84 (0.35–2.01) | 0.69 | 161 | 0.71 (0.39–1.31) | 0.28 | 160 |
| CD3 | ||||||
| 0 | 1.00 | 38 | 1.00 | 37 | ||
| 1 | 0.35 (0.14–0.87) | 0.023* | 130 | 0.36 (0.20–0.68) | 0.002** | 130 |
| 0 | 1.00 | 32 | 1.00 | 31 | ||
| 1 | 0.50 (0.20–1.30) | 0.157 | 137 | 0.46 (0.24–0.89) | 0.021* | 137 |
| Treg | ||||||
| 0 | 1.00 | 84 | 1.00 | 83 | ||
| 1 | 2.59 (1.00–6.67) | 0.050* | 81 | 1.23 (0.67–2.24) | 0.502 | 81 |
| IL-17 | ||||||
| 0 | 1.00 | 86 | 1.00 | 86 | ||
| 1 | 1.02 (0.43–2.37) | 0.988 | 80 | 1.23 (0.67–2.26) | 0.501 | 79 |
Abbreviations: BCSS. breast cancer specific survival; RFS. recurrence free survival; HR. hazard ration.
Table 4
Multivariable Cox regression analysis for BCSS and RFS with no stratification
| BCSS | RFS | |||||
|---|---|---|---|---|---|---|
| HR (CI 95%) |
| HR (CI 95%) |
| |||
| Age (yrs) | ||||||
| | 1.00 | 52 | 1.00 | 52 | ||
| | 0.44 (0.22–0.87) | 0.019* | 263 | 0.65 (0.38–1.13) | 0.124 | 261 |
| Lymph node status | ||||||
| Negative | 1.00 | 182 | 1.00 | 181 | ||
| Positive | 6.53 (3.43–12.41) | 133 | 2.58 (1.69–3.95) | 132 | ||
| Ki67 grade | ||||||
| 0–10 | 1.00 | 120 | 1.00 | 120 | ||
| 11– | 2.27 (1.08–4.76) | 0.031* | 195 | 1.46 (0.89–2.39) | 0.131 | 193 |
| Size (mm) | ||||||
| | 1.00 | 186 | 1.00 | 186 | ||
| | 2.13 (1.22–3.73) | 0.008** | 129 | 1.55 (1.02–2.36) | 0.039* | 127 |
| NHG | ||||||
| I and II | 1.00 | 208 | 1.00 | 208 | ||
| III | 2.59 (1.34–5.02) | 0.005** | 107 | 2.46 (1.51–4.00) | 105 | |
| HER2 | ||||||
| Negative | 1.00 | 299 | 1.00 | 297 | ||
| Positive | 0.79 (0.21–2.96) | 0.722 | 16 | 1.26 (0.44–3.66) | 0.666 | 16 |
| Triple negative | ||||||
| Negative | 1.00 | 291 | 1.00 | 289 | ||
| Positive | 6.06 (1.32–27.70) | 0.02* | 24 | 13.36 (2.78–64.31) | 0.001*** | 24 |
| ER status | ||||||
| Negative | 1.00 | 45 | 1.00 | 44 | ||
| Positive | 3.20 (0.70–14.73) | 0.136 | 270 | 6.40 (1.30–31.48) | 0.022* | 269 |
| Luminal A | ||||||
| Negative | 1.00 | 152 | 1.00 | 151 | ||
| Positive | 0.34 (0.18–0.64) | 0.001*** | 163 | 0.91 (0.57–1.46) | 0.69 | 162 |
| Luminal B | ||||||
| Negative | 1.00 | 286 | 1.00 | 284 | ||
| Positive | 0.63 (0.26–1.55) | 0.315 | 29 | 1.09 (0.54–2.20) | 0.814 | 29 |
| CD8 | ||||||
| 0 | 1.00 | 81 | 1.00 | 80 | ||
| 1 | 0.44 (0.24–0.82) | 0.009** | 234 | 0.57 (0.36–0.92) | 0.022* | 233 |
| CD3 | ||||||
| 0 | 1.00 | 74 | 1.00 | 72 | ||
| 1 | 0.49 (0.25–0.98) | 0.043* | 241 | 0.42 (0.25–0.71) | 0.001*** | 241 |
| 0 | 1.00 | 60 | 1.00 | 59 | ||
| 1 | 0.68 (0.35–1.32) | 0.252 | 255 | 0.92 (0.55–1.54) | 0.748 | 254 |
| Treg | ||||||
| 0 | 1.00 | 156 | 1.00 | 154 | ||
| 1 | 1.62 (0.88–2.98) | 0.121 | 159 | 1.38 (0.88–2.16) | 0.159 | 159 |
| IL-17 | ||||||
| 0 | 1.00 | 172 | 1.00 | 171 | ||
| 1 | 1.31 (0.74–2.32) | 0.352 | 143 | 1.41 (0.92–2.16) | 0.115 | 142 |
Abbreviations: BCSS. breast cancer specific survival; RFS. recurrence free survival; HR. hazard ration; NHG. Nottingham histologic grade.
3.2Prognostic significance of alternative T cell subpopulations in the entire cohort
We next investigated the prognostic impact of individual T cell subsets (CD3, CD8
Univariable Cox regression analysis showed that presence of T cells (CD3), had an overall significant positive impact on BCSS (HR
When adjusted for clinicopathological parameters in multivariable Cox regression analysis, CD8
Figure 2.
Kaplan-Meier estimates of breast cancer specific survival according to different infiltrating T cell subpopulations in breast cancer. Impact of pan-T cell CD3,
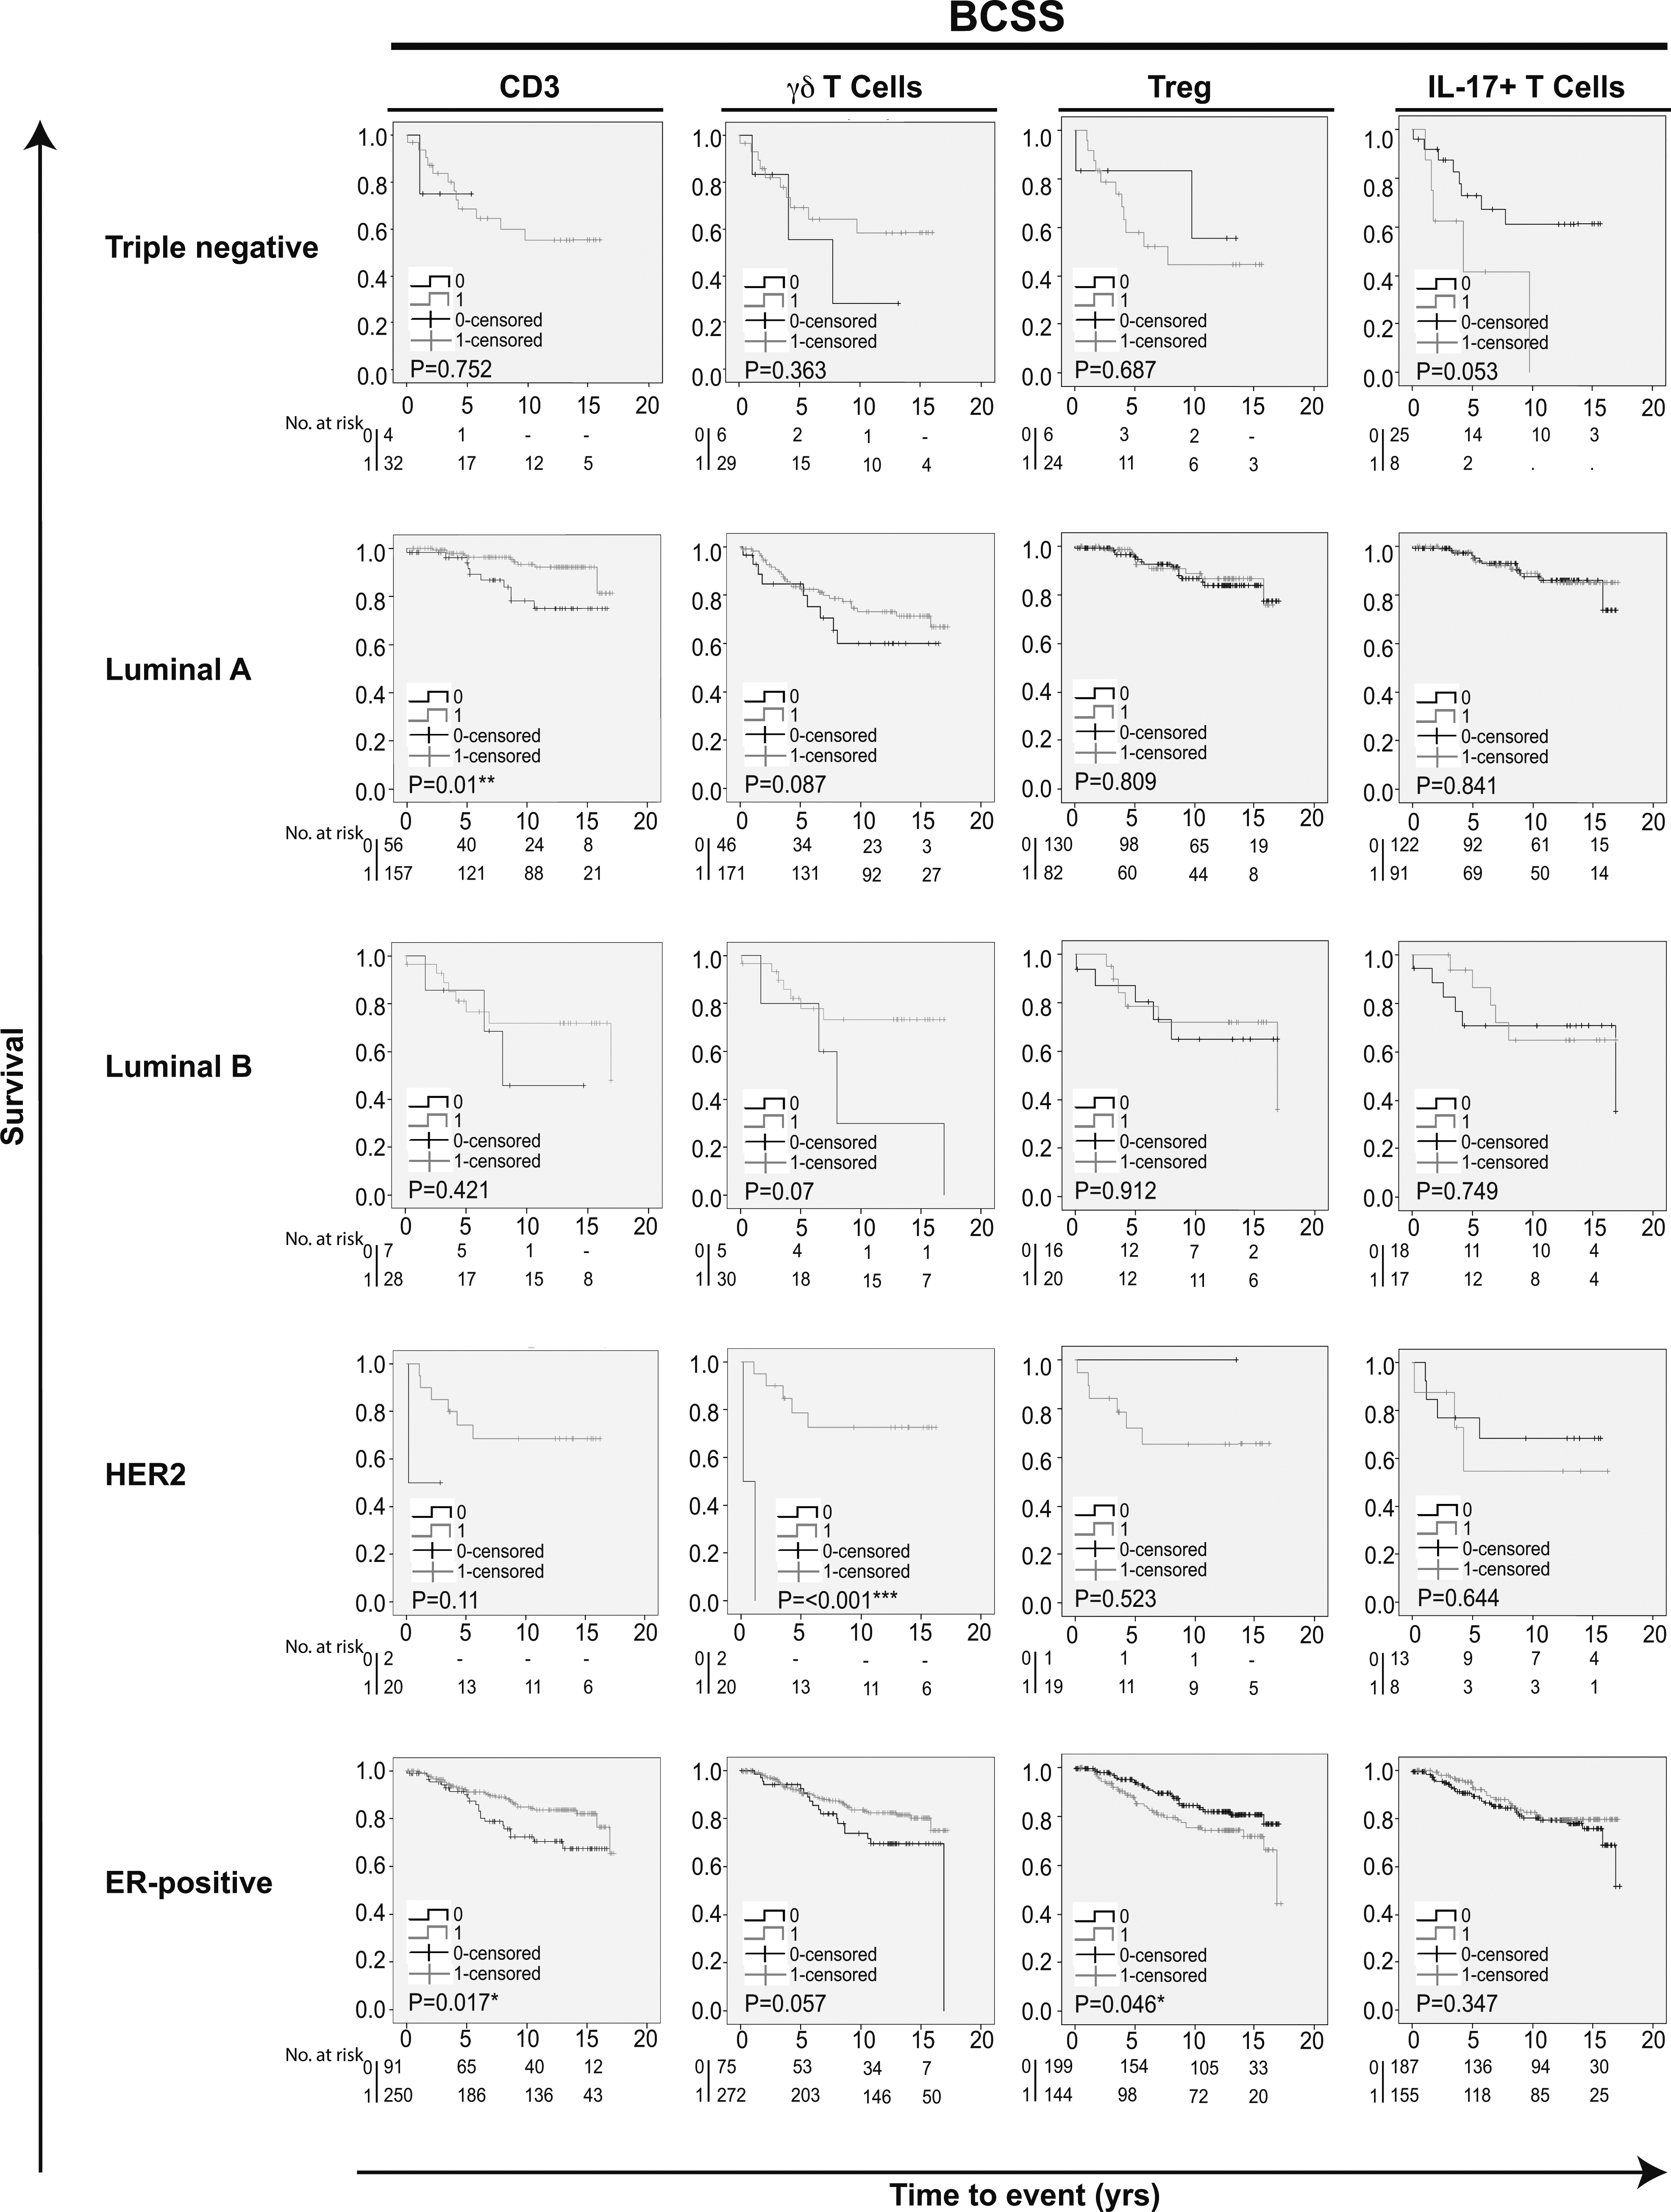
Figure 3.
Kaplan-Meier estimates of recurrence free survival according to different infiltrating T cell subpopulations in breast cancer. Impact of pan-T cell CD3,
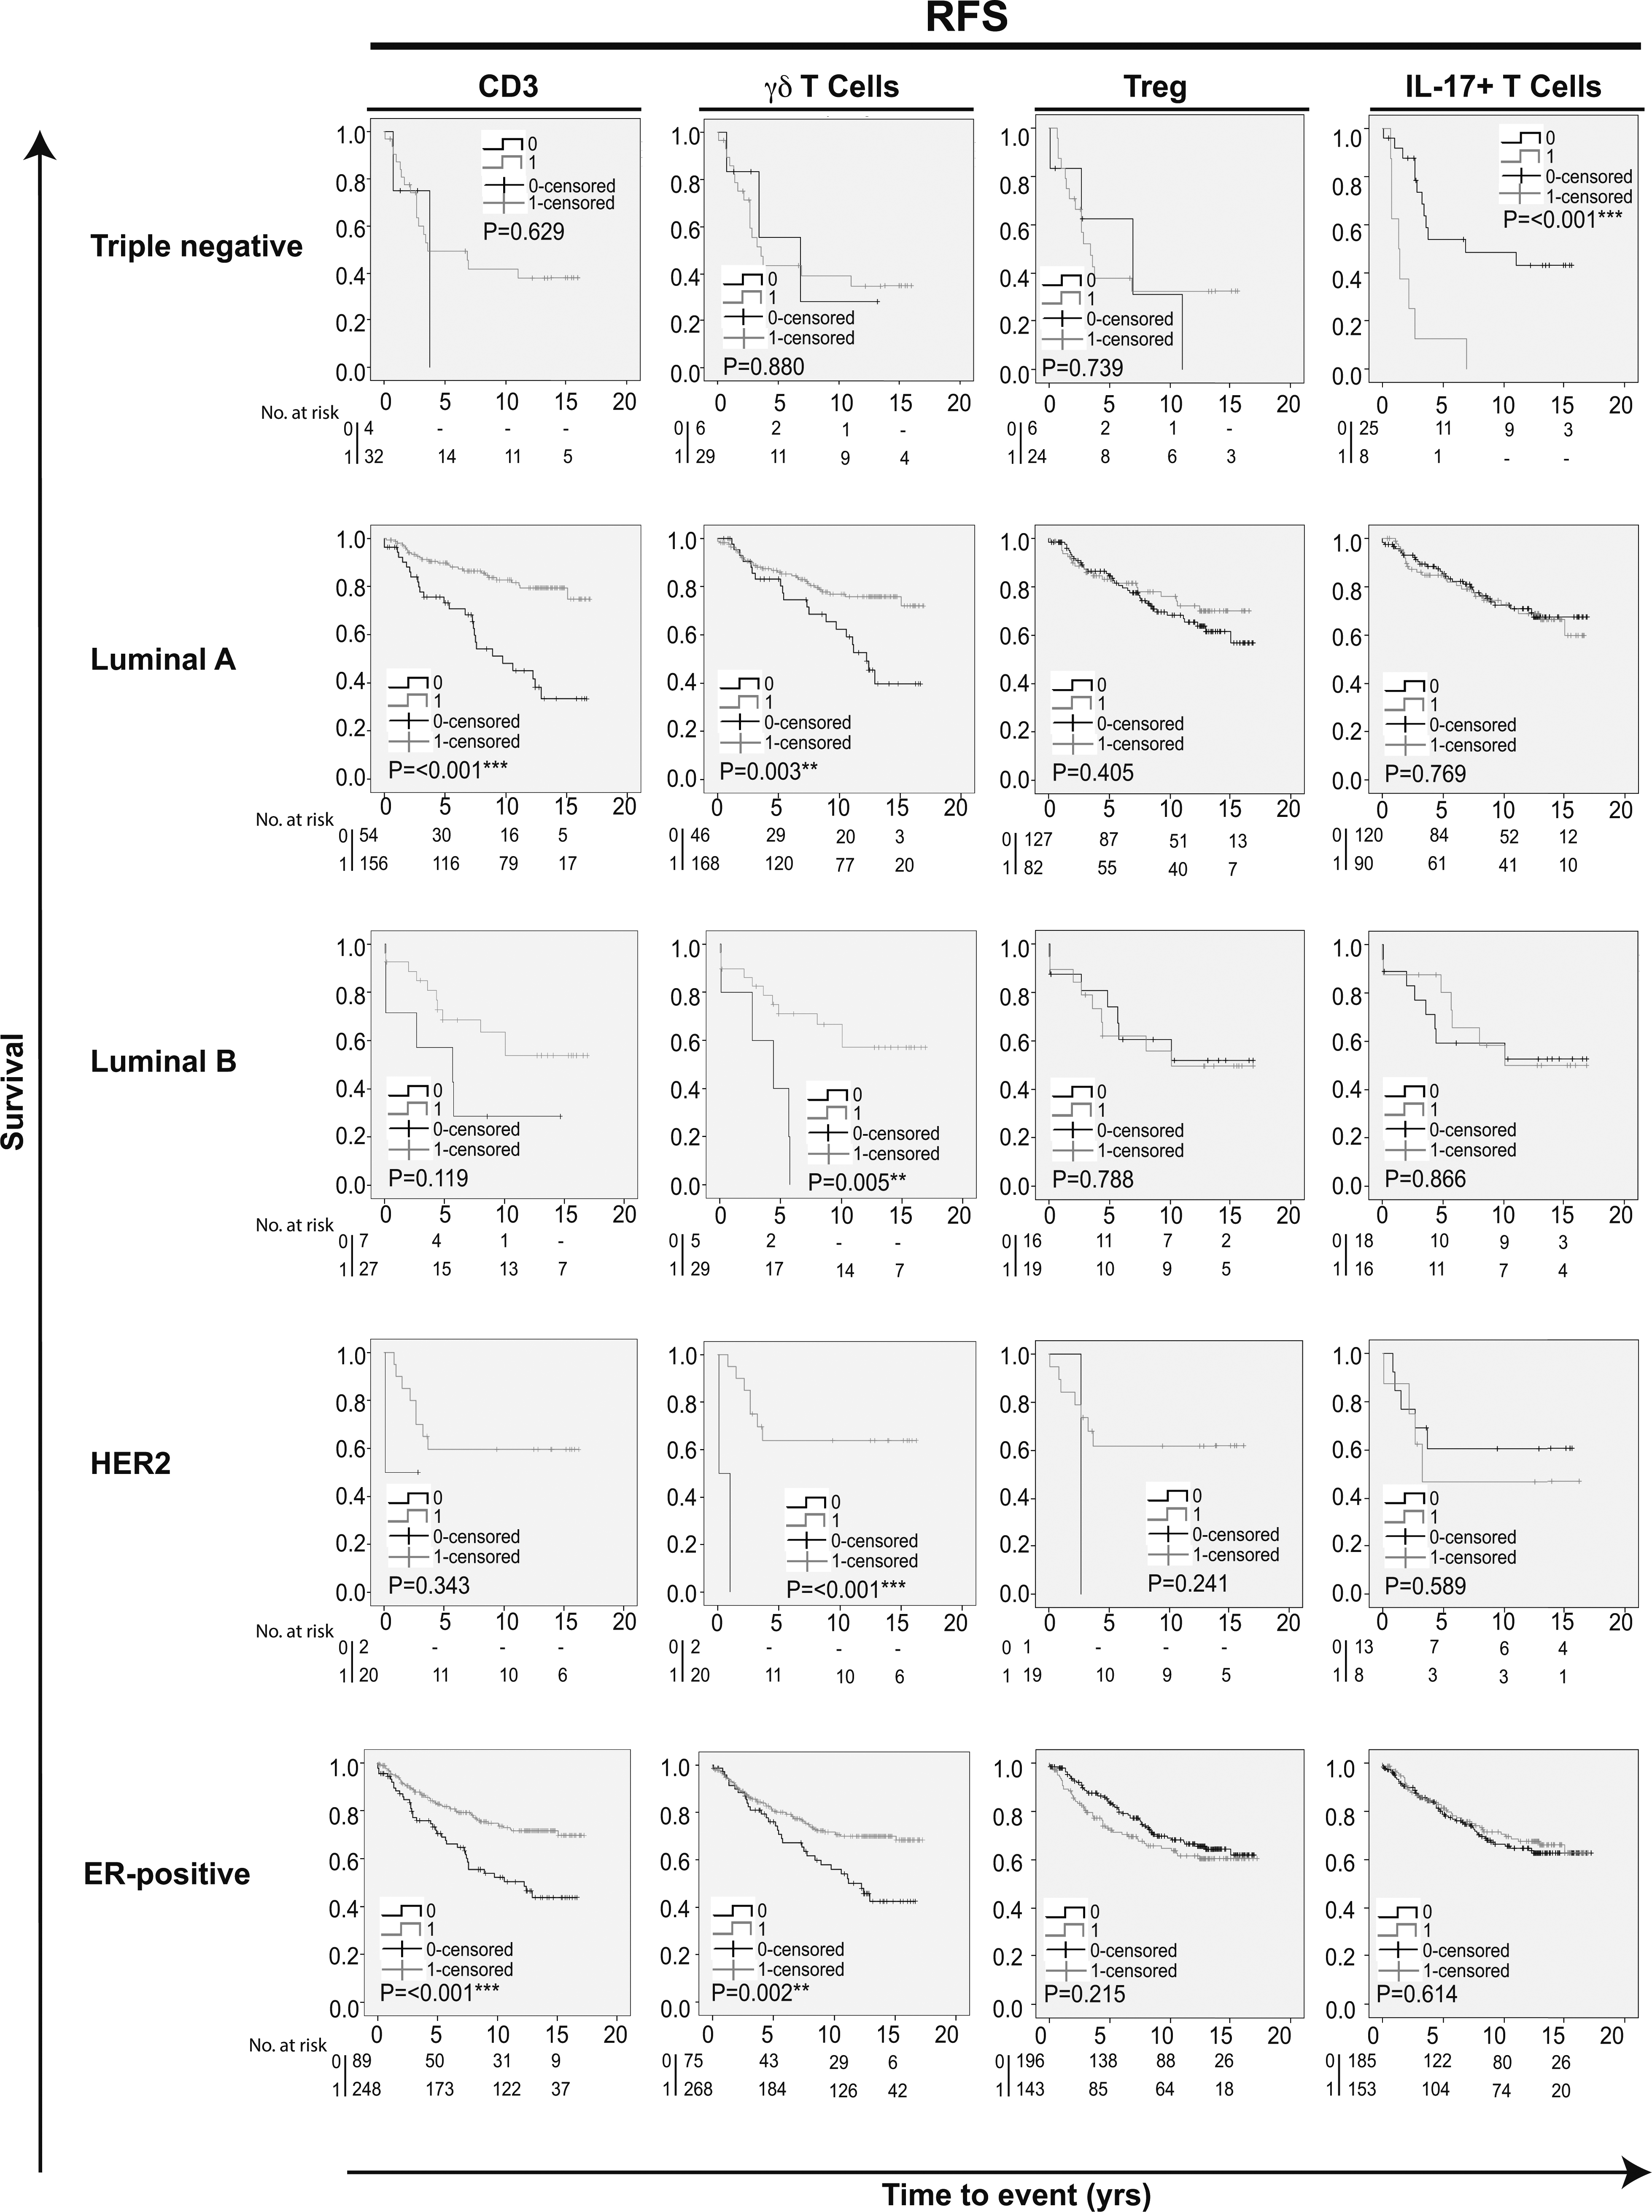
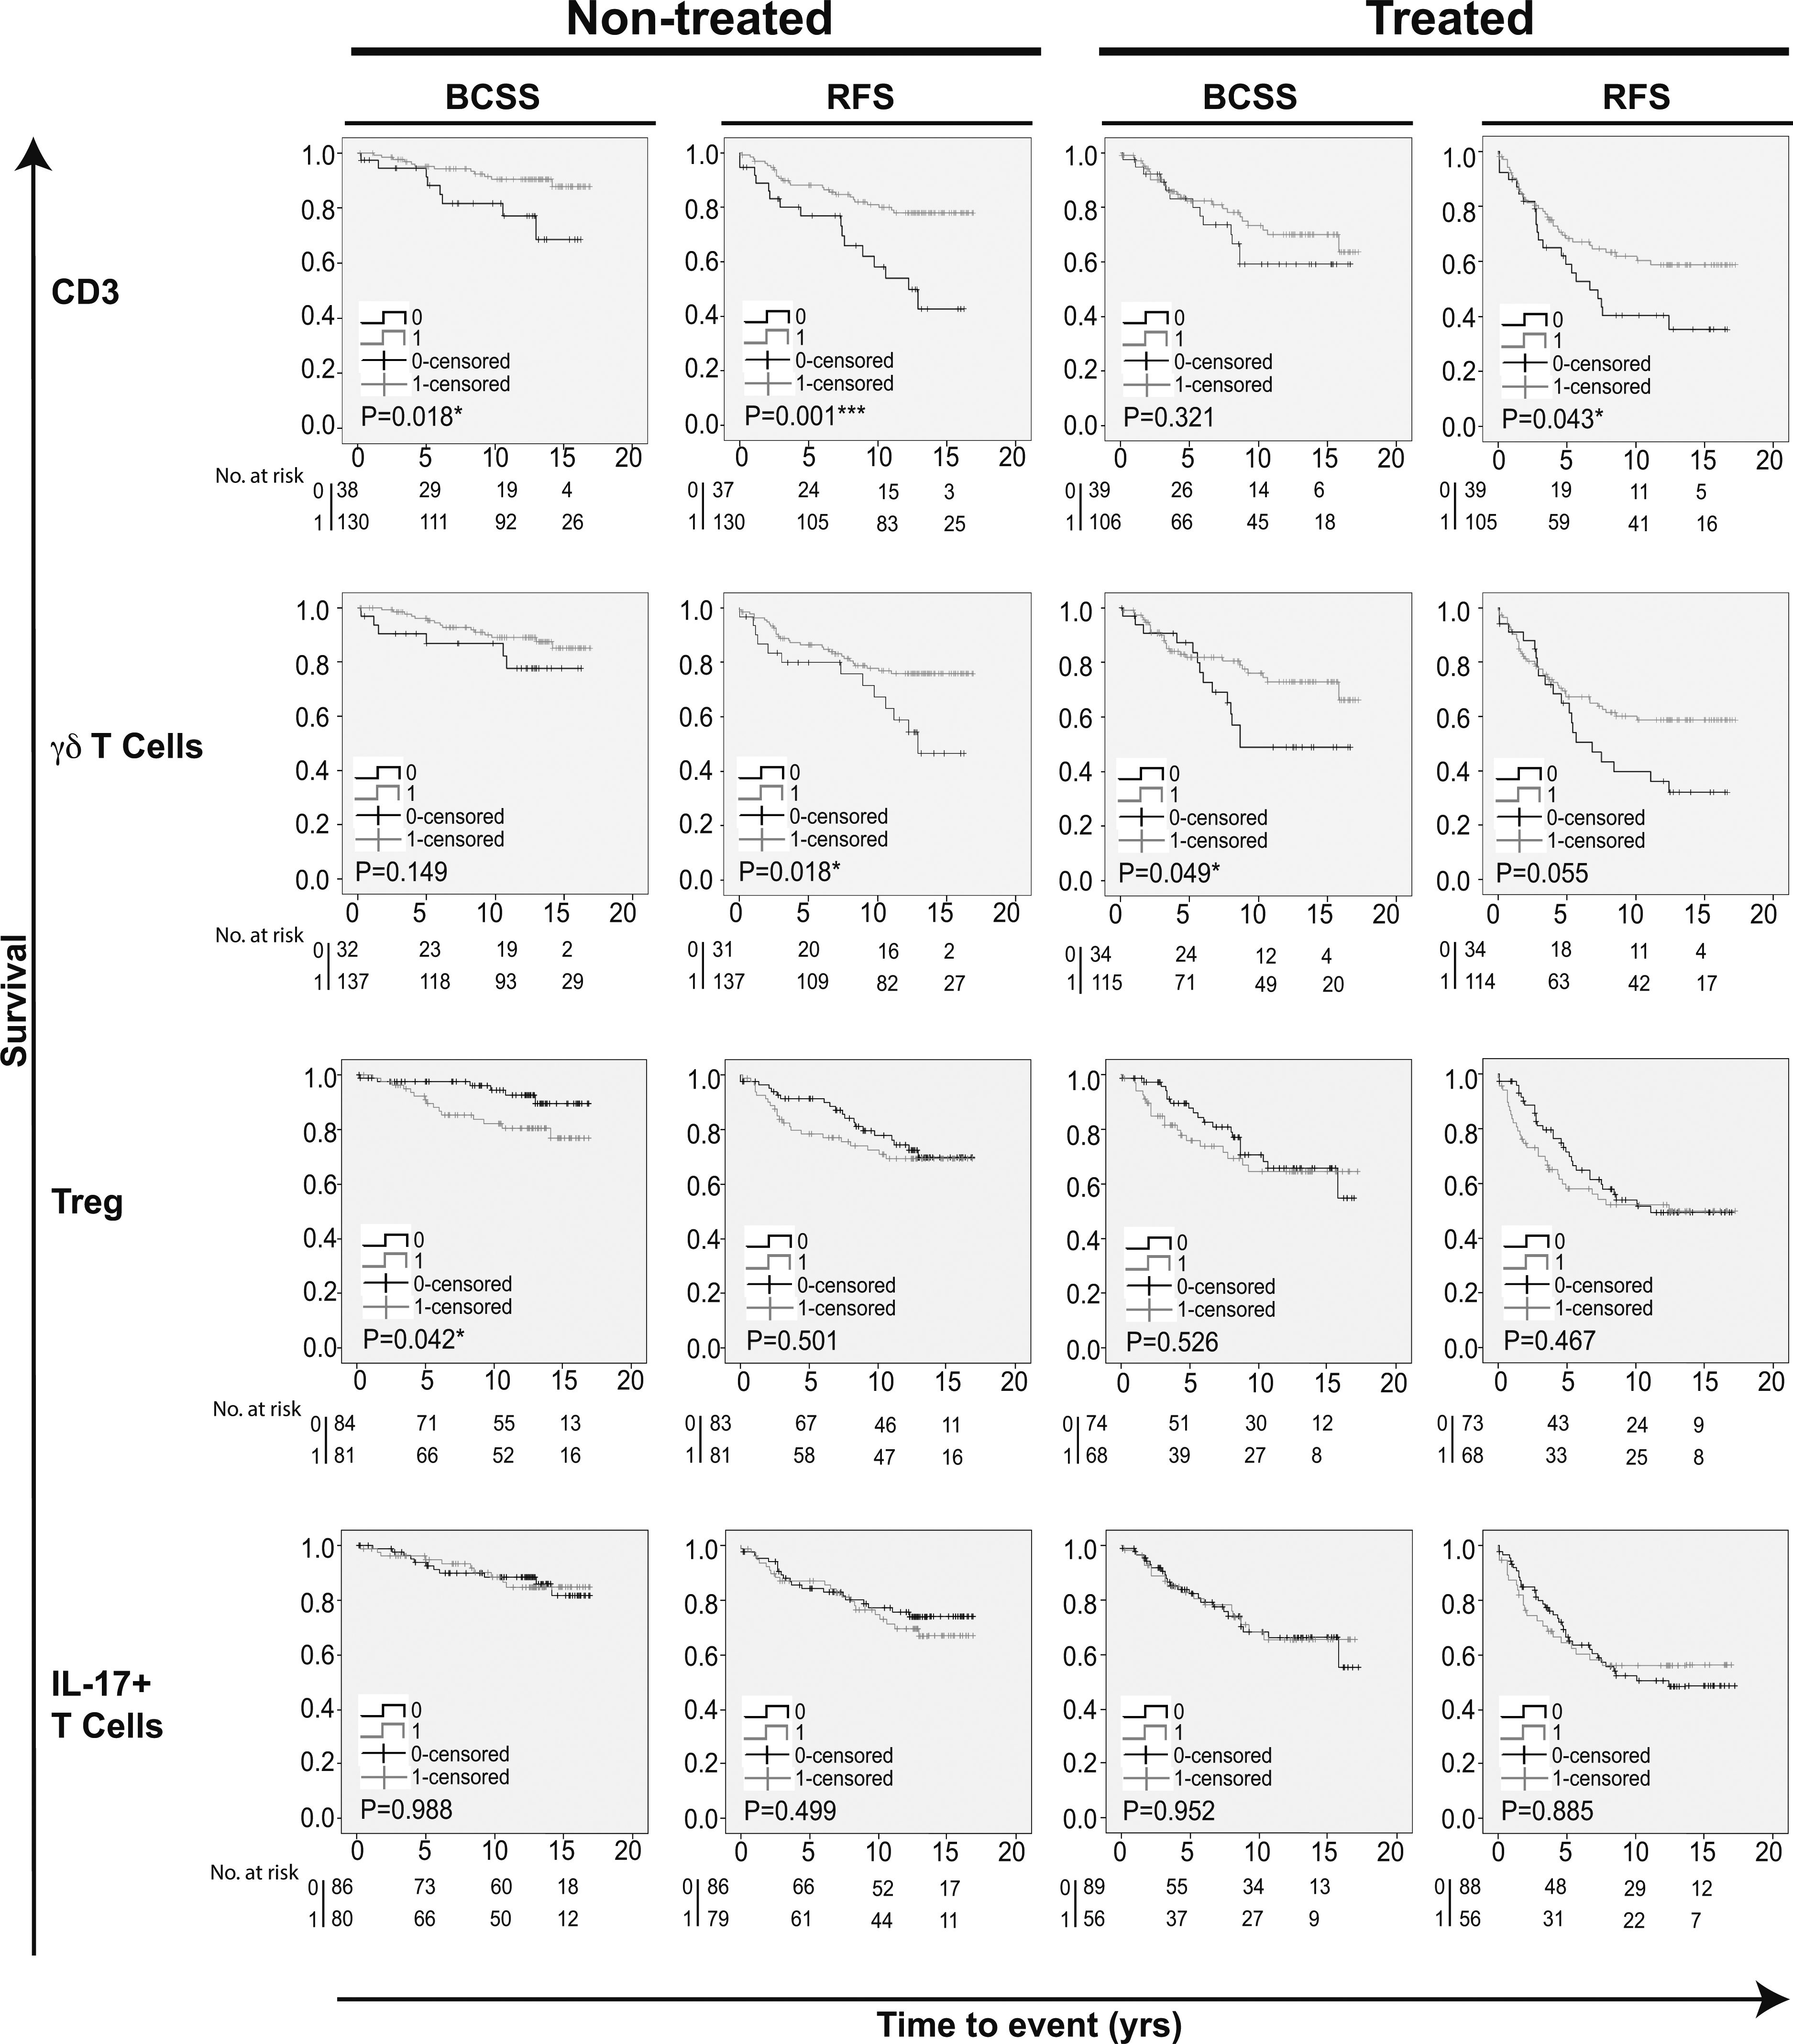
Figure 4.
Kaplan-Meier estimates on survival according to different infiltrating T-cell populations in patients receiving and not receiving adjuvant endocrine therapy. Impact of pan-T cell CD3,
3.3Prognostic value of alternative T cell subpopulations according to breast cancer subtype
Kaplan-Meier analyses were also performed in strata according to different subtypes of breast cancer. This revealed that tumor infiltration of T cells overall (CD3) was associated with an improved prognosis specifically in Luminal A and ER-positive breast cancers (BCSS and RFS; Figs 2 and 3). CD8
3.4Prognostic impact of T cell infiltration in relation to endocrine therapy
Next, we evaluated whether tumor infiltration of different T cell populations had any impact on prognosis in relation to endocrine therapy. The study cohort was conceived before clinical use of ER-testing, hence both groups include both ER-positive and ER-negative patients [27]. Kaplan-Meier analysis in strata according to treatment revealed that tumor infiltration of CD8
Univariable Cox regression analysis of the endocrine therapy treated group revealed that CD8
Table 5
Multivariable Cox regression analysis for BCSS and RFS stratified for treated patients
| BCSS | RFS | |||||
|---|---|---|---|---|---|---|
| HR (CI 95%) |
| HR (CI 95%) |
| |||
| Age (yrs) | ||||||
| | 1.00 | 6 | 1.00 | 6 | ||
| | 0.33 (0.07–1.64) | 0.176 | 105 | 0.19 (0.06–0.58) | 0.004** | 105 |
| Lymph node status | ||||||
| Negative | 1.00 | 26 | 1.00 | 26 | ||
| Positive | 27.39 (4.93–152.07) | 85 | 7.22 (2.39–21.82) | 85 | ||
| Ki67 grade | ||||||
| 0–10 | 1.00 | 40 | 1.00 | 40 | ||
| 11– | 2.36 (0.71–7.85) | 0.162 | 71 | 1.29 (0.58–2.89) | 0.536 | 71 |
| Size (mm) | ||||||
| | 1.00 | 47 | 1.00 | 47 | ||
| | 2.64 (1.07–6.51) | 0.035* | 64 | 2.32 (1.18–4.55) | 0.014* | 64 |
| NHG | ||||||
| I and II | 1.00 | 62 | 1.00 | 62 | ||
| III | 1.76 (0.56–5.52) | 0.333 | 49 | 1.82 (0.82–4.03) | 0.142 | 49 |
| HER2 | ||||||
| Negative | 1.00 | 106 | 1.00 | 106 | ||
| Positive | 0.99 (0.13–7.91) | 0.995 | 5 | 0.69 (0.09–5.07) | 0.715 | 5 |
| Triple negative | ||||||
| Negative | 1.00 | 102 | 1.00 | 102 | ||
| Positive | 12.21 (0.82–182.39) | 0.07 | 9 | 15.78 (1.11–224.73) | 0.042* | 9 |
| ER status | ||||||
| Negative | 1.00 | 15 | 1.00 | 15 | ||
| Positive | 3.78 (0.21–67.21) | 0.365 | 96 | 6.39 (0.37–108.91) | 0.2 | 96 |
| Luminal A | ||||||
| Negative | 1.00 | 64 | 1.00 | 64 | ||
| Positive | 0.24 (0.09–0.66) | 0.006** | 47 | 0.66 (0.32–1.37) | 0.265 | 47 |
| Luminal B | ||||||
| Negative | 1.00 | 101 | 1.00 | 101 | ||
| Positive | 0.34 (0.07–1.70) | 0.189 | 10 | 1.09 (0.37–3.22) | 0.882 | 10 |
| CD8 | ||||||
| 0 | 1.00 | 27 | 1.00 | 27 | ||
| 1 | 0.21 (0.09–0.52) | 0.001*** | 84 | 0.41 (0.20–0.84) | 0.014* | 84 |
| CD3 | ||||||
| 0 | 1.00 | 30 | 1.00 | 30 | ||
| 1 | 0.73 (0.26–2.06) | 0.55 | 81 | 0.66 (0.32–1.36) | 0.262 | 81 |
| 0 | 1.00 | 21 | 1.00 | 21 | ||
| 1 | 0.32 (0.12–0.82) | 0.018* | 90 | 0.68 (0.31–1.50) | 0.342 | 90 |
| Treg | ||||||
| 0 | 1.00 | 55 | 1.00 | 55 | ||
| 1 | 1.09 (0.39–3.06) | 0.865 | 56 | 1.71 (0.83–3.55) | 0.148 | 56 |
| IL-17 | ||||||
| 0 | 1.00 | 64 | 1.00 | 64 | ||
| 1 | 1.57 (0.66–3.71) | 0.309 | 47 | 1.53 (0.79–2.96) | 0.21 | 47 |
Abbreviations: BCSS. breast cancer specific survival; RFS. recurrence free survival; HR. hazard ration; NHG. Nottingham histologic grade.
Table 6
Multivariable Cox regression analysis for BCSS and RFS stratified for untreated patients
| BCSS | RFS | |||||
|---|---|---|---|---|---|---|
| HR (CI 95%) |
| HR (CI 95%) |
| |||
| Age (yrs) | ||||||
| | 1.00 | 37 | 1.00 | 37 | ||
| | 0.47 (0.12–1.89) | 0.288 | 105 | 1.15 (0.47–2.81) | 0.767 | 104 |
| Lymph node status | ||||||
| Negative | 1.00 | 123 | 1.00 | 123 | ||
| Positive | 16.11 (3.95–65.65) | 19 | 2.95 (1.24–7.02) | 0.014* | 18 | |
| Ki67 grade | ||||||
| 0–10 | 21.00 | 62 | 1.00 | 62 | ||
| 11– | 6.20 (2.33–295.19) | 0.008** | 80 | 1.92 (0.82–4.47) | 0.131 | 79 |
| Size (mm) | ||||||
| | 1.00 | 116 | 1.00 | 116 | ||
| | 13.97 (3.99–65.23) | 0.001*** | 26 | 2.52 (0.97–6.51) | 0.057 | 25 |
| NHG | ||||||
| I and II | 1.00 | 108 | 1.00 | 108 | ||
| III | 5.22 (1.20–22.81) | 0.028* | 34 | 3.82 (1.66–8.81) | 0.002** | 33 |
| HER2 | ||||||
| Negative | 1.00 | 133 | 1.00 | 132 | ||
| Positive | 0.44 (0.04–4.98) | 0.511 | 9 | 2.55 (0.60–10.81) | 0.203 | 9 |
| Triple negative | ||||||
| Negative | 1.00 | 131 | 1.00 | 130 | ||
| Positive | 10.20 (0.76–137.56) | 0.08 | 11 | 16.33 (1.58–169.16) | 0.019* | 11 |
| ER status | ||||||
| Negative | 1.00 | 23 | 1.00 | 22 | ||
| Positive | 7.87 (0.66- 93.92) | 0.103 | 119 | 8.02 (0.79–81.24) | 0.078 | 119 |
| Luminal A | ||||||
| Negative | 1.00 | 60 | 1.00 | 59 | ||
| Positive | 0.11 (0.02–0.57) | 0.009** | 82 | 1.78 (0.66–4.82) | 0.256 | 82 |
| Luminal B | ||||||
| Negative | 1.00 | 131 | 1.00 | 130 | ||
| Positive | 0.28 (0.03–2.51) | 0.255 | 11 | 3.14 (0.73–13.50) | 0.124 | 11 |
| CD8 | ||||||
| 0 | 1.00 | 40 | 1.00 | 39 | ||
| 1 | 0.36 (0.06–2.03) | 0.244 | 102 | 0.67 (0.31–1.44) | 0.303 | 102 |
| CD3 | ||||||
| 0 | 1.00 | 32 | 1.00 | 31 | ||
| 1 | 0.03 (0.00–0.24) | 0.001*** | 110 | 0.21 (0.07–0.64) | 0.006** | 110 |
| 0 | 1.00 | 28 | 1.00 | 27 | ||
| 1 | 2.64 (0.33–20.96) | 0.358 | 114 | 1.30 (0.43–3.92) | 0.644 | 114 |
| Treg | ||||||
| 0 | 1.00 | 68 | 1.00 | 67 | ||
| 1 | 17.31 (2.45–122.16) | 0.004** | 74 | 1.50 (0.68–3.31) | 0.317 | 74 |
| IL-17 | ||||||
| 0 | 1.00 | 74 | 1.00 | 74 | ||
| 1 | 2.12 (0.54–8.28) | 0.279 | 68 | 1.65 (0.77–3.52) | 0.195 | 67 |
Abbreviations: BCSS. breast cancer specific survival; RFS. recurrence free survival; HR. hazard ration; NHG. Nottingham histologic grade.
In endocrine therapy treated patients, CD8
4.Discussion
In this study, we investigated the prognostic value of infiltrating
We show that infiltration of T cells (CD3) had a positive effect on prognostic outcome in breast cancer, which supports previous studies evaluating TILs as a prognostic parameter. However, since CD3 is a pan-T cell marker, further investigation was needed to identify specific T cell subtypes that may play a role in breast cancer progression and as potential responders to immune-therapies.
The only T cell subpopulation with results similar to that of CD3, turned out to be
In multivariable Cox regression analyses however, both CD3 and CD8
In the herein studied cohort, infiltration of T
We show that infiltration of IL-17
5.Conclusions
In conclusion, our results demonstrate that in breast cancer, infiltration of T cells (CD3) and
Acknowledgments
The authors wish to thank Ms Elise Nilsson and Mrs Kristina Ekström-Holka for professional help with IHC. This work was generously supported by grants from the Swedish Cancer Society, Gunnar Nilsson Cancer Foundation, MAS Cancer Foundation, Åke Wibergs Foundation and Percy Falks Foundation.
Conflict of interest
The authors declare no conflict of interest.
Supplementary data
The supplementary files are available to download from http://dx.doi.org/10.323/CBM-170026.
References
[1] | T. Sorlie, C.M. Perou, R. Tibshirani, T. Aas, S. Geisler, H. Johnsen, T. Hastie, M.B. Eisen, M. van de Rijn, S.S. Jeffrey, T. Thorsen, H. Quist, J.C. Matese, P.O. Brown, D. Botstein, P.E. Lonning and A.L. Borresen-Dale, Gene expression patterns of breast carcinomas distinguish tumor subclasses with clinical implications, Proc Natl Acad Sci U S A 98: ((2001) ), 10869–10874. |
[2] | C. Medrek, F. Ponten, K. Jirstrom and K. Leandersson, The presence of tumor associated macrophages in tumor stroma as a prognostic marker for breast cancer patients, BMC Cancer 12: ((2012) ), 306. |
[3] | A. Mantovani, P. Allavena, A. Sica and F. Balkwill, Cancer-related inflammation, Nature 454: ((2008) ), 436–444. |
[4] | S.E. Stanton and M.L. Disis, Clinical significance of tumor-infiltrating lymphocytes in breast cancer, J Immunother Cancer 4: ((2016) ), 59. |
[5] | C. Denkert, G. von Minckwitz, J.C. Brase, B.V. Sinn, S. Gade, R. Kronenwett, B.M. Pfitzner, C. Salat, S. Loi, W.D. Schmitt, C. Schem, K. Fisch, S. Darb-Esfahani, K. Mehta, C. Sotiriou, S. Wienert, P. Klare, F. Andre, F. Klauschen, J.U. Blohmer, K. Krappmann, M. Schmidt, H. Tesch, S. Kummel, P. Sinn, C. Jackisch, M. Dietel, T. Reimer, M. Untch and S. Loibl, Tumor-infiltrating lymphocytes and response to neoadjuvant chemotherapy with or without carboplatin in human epidermal growth factor receptor 2-positive and triple-negative primary breast cancers, J Clin Oncol 33: ((2015) ), 983–991. |
[6] | S. Adams, R.J. Gray, S. Demaria, L. Goldstein, E.A. Perez, L.N. Shulman, S. Martino, M. Wang, V.E. Jones, T.J. Saphner, A.C. Wolff, W.C. Wood, N.E. Davidson, G.W. Sledge, J.A. Sparano and S.S. Badve, Prognostic value of tumor-infiltrating lymphocytes in triple-negative breast cancers from two phase III randomized adjuvant breast cancer trials: ECOG 2197 and ECOG 1199, J Clin Oncol 32: ((2014) ), 2959–2966. |
[7] | M. Ono, H. Tsuda, C. Shimizu, S. Yamamoto, T. Shibata, H. Yamamoto, T. Hirata, K. Yonemori, M. Ando, K. Tamura, N. Katsumata, T. Kinoshita, Y. Takiguchi, H. Tanzawa and Y. Fujiwara, Tumor-infiltrating lymphocytes are correlated with response to neoadjuvant chemotherapy in triple-negative breast cancer, Breast Cancer Res Treat 132: ((2012) ), 793–805. |
[8] | L. Apetoh, F. Ghiringhelli, A. Tesniere, M. Obeid, C. Ortiz, A. Criollo, G. Mignot, M.C. Maiuri, E. Ullrich, P. Saulnier, H. Yang, S. Amigorena, B. Ryffel, F.J. Barrat, P. Saftig, F. Levi, R. Lidereau, C. Nogues, J.P. Mira, A. Chompret, V. Joulin, F. Clavel-Chapelon, J. Bourhis, F. Andre, S. Delaloge, T. Tursz, G. Kroemer and L. Zitvogel, Toll-like receptor 4-dependent contribution of the immune system to anticancer chemotherapy and radiotherapy, Nat Med 13: ((2007) ), 1050–1059. |
[9] | R.A. Lake and B.W. Robinson, Immunotherapy and chemotherapy – a practical partnership, Nat Rev Cancer 5: ((2005) ), 397–405. |
[10] | B. Lakshmi Narendra, K. Eshvendar Reddy, S. Shantikumar and S. Ramakrishna, Immune system: A double-edged sword in cancer, Inflamm Res 62: ((2013) ), 823–834. |
[11] | D. Alizadeh, E. Katsanis and N. Larmonier, The multifaceted role of Th17 lymphocytes and their associated cytokines in cancer, Clin Dev Immunol 2013: ((2013) ), 957878. |
[12] | S. Sakaguchi, T. Yamaguchi, T. Nomura and M. Ono, Regulatory T cells and immune tolerance, Cell 133: ((2008) ), 775–787. |
[13] | S. Liu, W.D. Foulkes, S. Leung, D. Gao, S. Lau, Z. Kos and T.O. Nielsen, Prognostic significance of FOXP3+ tumor-infiltrating lymphocytes in breast cancer depends on estrogen receptor and human epidermal growth factor receptor-2 expression status and concurrent cytotoxic T-cell infiltration, Breast Cancer Res 16: ((2014) ), 432. |
[14] | L. Yang, Y. Qi, J. Hu, L. Tang, S. Zhao and B. Shan, Expression of Th17 cells in breast cancer tissue and its association with clinical parameters, Cell Biochem Biophys 62: ((2012) ), 153–159. |
[15] | W.C. Chen, Y.H. Lai, H.Y. Chen, H.R. Guo, I.J. Su and H.H. Chen, Interleukin-17-producing cell infiltration in the breast cancer tumour microenvironment is a poor prognostic factor, Histopathology 63: ((2013) ), 225–233. |
[16] | M. Thibaudin, M. Chaix, R. Boidot, F. Vegran, V. Derangere, E. Limagne, H. Berger, S. Ladoire, L. Apetoh and F. Ghiringhelli, Human ectonucleotidase-expressing CD25high Th17 cells accumulate in breast cancer tumors and exert immunosuppressive functions, Oncoimmunology 5: ((2016) ), e1055444. |
[17] | S.M. Mahmoud, E.C. Paish, D.G. Powe, R.D. Macmillan, M.J. Grainge, A.H. Lee, I.O. Ellis and A.R. Green, Tumor-infiltrating CD8+ lymphocytes predict clinical outcome in breast cancer, J Clin Oncol 29: ((2011) ), 1949–1955. |
[18] | S.R. Carding and P.J. Egan, Gammadelta T cells: Functional plasticity and heterogeneity, Nat Rev Immunol 2: ((2002) ), 336–345. |
[19] | S. Paul and G. Lal, Regulatory and effector functions of gamma-delta (gammadelta) T cells and their therapeutic potential in adoptive cellular therapy for cancer, Int J Cancer 139: ((2016) ), 976–985. |
[20] | C. Ma, Q. Zhang, J. Ye, F. Wang, Y. Zhang, E. Wevers, T. Schwartz, P. Hunborg, M.A. Varvares, D.F. Hoft, E.C. Hsueh and G. Peng, Tumor-infiltrating gammadelta T lymphocytes predict clinical outcome in human breast cancer, J Immunol 189: ((2012) ), 5029–5036. |
[21] | A.J. Gentles, A.M. Newman, C.L. Liu, S.V. Bratman, W. Feng, D. Kim, V.S. Nair, Y. Xu, A. Khuong, C.D. Hoang, M. Diehn, R.B. West, S.K. Plevritis and A.A. Alizadeh, The prognostic landscape of genes and infiltrating immune cells across human cancers, Nat Med 21: ((2015) ), 938–945. |
[22] | R.D. Bense, C. Sotiriou, M.J. Piccart-Gebhart, J.B. Haanen, M.A. van Vugt, E.G. de Vries, C.P. Schroder and R.S. Fehrmann, Relevance of tumor-infiltrating immune cell composition and functionality for disease outcome in breast cancer, J Natl Cancer Inst 109: ((2017) ). |
[23] | K. Wang, J. Xu, T. Zhang and D. Xue, Tumor-infiltrating lymphocytes in breast cancer predict the response to chemotherapy and survival outcome: A meta-analysis, Oncotarget ((2016) ). |
[24] | W.H. Fridman, F. Pages, C. Sautes-Fridman and J. Galon, The immune contexture in human tumours: Impact on clinical outcome, Nat Rev Cancer 12: ((2012) ), 298–306. |
[25] | B. Silva-Santos, K. Serre and H. Norell, gammadelta T cells in cancer, Nat Rev Immunol 15: ((2015) ), 683–691. |
[26] | S.B. Coffelt, K. Kersten, C.W. Doornebal, J. Weiden, K. Vrijland, C.S. Hau, N.J. Verstegen, M. Ciampricotti, L.J. Hawinkels, J. Jonkers and K.E. de Visser, IL-17-producing gammadelta T cells and neutrophils conspire to promote breast cancer metastasis, Nature 522: ((2015) ), 345–348. |
[27] | S. Borgquist, C. Holm, M. Stendahl, L. Anagnostaki, G. Landberg and K. Jirstrom, Oestrogen receptors alpha and beta show different associations to clinicopathological parameters and their co-expression might predict a better response to endocrine treatment in breast cancer, J Clin Pathol 61: ((2008) ), 197–203. |
[28] | F. Lanigan, G. Gremel, R. Hughes, D.J. Brennan, F. Martin, K. Jirstrom and W.M. Gallagher, Homeobox transcription factor muscle segment homeobox 2 (Msx2) correlates with good prognosis in breast cancer patients and induces apoptosis in vitro, Breast Cancer Res 12: ((2010) ), R59. |
[29] | O.L. PC, S.A. Penny, R.T. Dolan, C.M. Kelly, S.F. Madden, E. Rexhepaj, D.J. Brennan, A.H. McCann, F. Ponten, M. Uhlen, R. Zagozdzon, M.J. Duffy, M.R. Kell, K. Jirstrom and W.M. Gallagher, Systematic antibody generation and validation via tissue microarray technology leading to identification of a novel protein prognostic panel in breast cancer, BMC Cancer 13: ((2013) ), 175. |
[30] | S. Svensson, K. Jirstrom, L. Ryden, G. Roos, S. Emdin, M.C. Ostrowski and G. Landberg, ERK phosphorylation is linked to VEGFR2 expression and Ets-2 phosphorylation in breast cancer and is associated with tamoxifen treatment resistance and small tumours with good prognosis, Oncogene 24: ((2005) ), 4370–4379. |
[31] | D.G. DeNardo, D.J. Brennan, E. Rexhepaj, B. Ruffell, S.L. Shiao, S.F. Madden, W.M. Gallagher, N. Wadhwani, S.D. Keil, S.A. Junaid, H.S. Rugo, E.S. Hwang, K. Jirstrom, B.L. West and L.M. Coussens, Leukocyte complexity predicts breast cancer survival and functionally regulates response to chemotherapy, Cancer Discov 1: ((2011) ), 54–67. |
[32] | G. Churlaud, F. Pitoiset, F. Jebbawi, R. Lorenzon, B. Bellier, M. Rosenzwajg and D. Klatzmann, Human and mouse CD8(+)CD25(+)FOXP3(+) regulatory T cells at steady state and during interleukin-2 therapy, Front Immunol 6: ((2015) ), 171. |
[33] | T.F. Gajewski, H. Schreiber and Y.X. Fu, Innate and adaptive immune cells in the tumor microenvironment, Nat Immunol 14: ((2013) ), 1014–1022. |
[34] | M. Ferrarini, S. Heltai, G. Chiesa and M.G. Sabbadini, V delta 1+ gamma/delta T lymphocytes infiltrating human lung cancer express the CD8 alpha/alpha homodimer, Scand J Immunol 40: ((1994) ), 363–367. |
[35] | E.G. Addison, J. North, I. Bakhsh, C. Marden, S. Haq, S. Al-Sarraj, R. Malayeri, R.G. Wickremasinghe, J.K. Davies and M.W. Lowdell, Ligation of CD8alpha on human natural killer cells prevents activation-induced apoptosis and enhances cytolytic activity, Immunology 116: ((2005) ), 354–361. |
[36] | M. Iwasaki, Y. Tanaka, H. Kobayashi, K. Murata-Hirai, H. Miyabe, T. Sugie, M. Toi and N. Minato, Expression and function of PD-1 in human gammadelta T cells that recognize phosphoantigens, Eur J Immunol 41: ((2011) ), 345–355. |
[37] | J. Gertner-Dardenne, C. Fauriat, F. Orlanducci, M.L. Thibult, S. Pastor, J. Fitzgibbon, R. Bouabdallah, L. Xerri and D. Olive, The co-receptor BTLA negatively regulates human Vgamma9Vdelta2 T-cell proliferation: A potential way of immune escape for lymphoma cells, Blood 122: ((2013) ), 922–931. |
[38] | N. Kang, L. Tang, X. Li, D. Wu, W. Li, X. Chen, L. Cui, D. Ba and W. He, Identification and characterization of Foxp3(+) gammadelta T cells in mouse and human, Immunol Lett 125: ((2009) ), 105–113. |
[39] | C.M. Wilke, I. Kryczek, S. Wei, E. Zhao, K. Wu, G. Wang and W. Zou, Th17 cells in cancer: Help or hindrance? Carcinogenesis 32: ((2011) ), 643–649. |
[40] | V. Kaewkangsadan, C. Verma, J.M. Eremin, G. Cowley, M. Ilyas and O. Eremin, Crucial contributions by T lymphocytes (effector, regulatory, and checkpoint inhibitor) and cytokines (TH1, TH2, and TH17) to a pathological complete response induced by neoadjuvant chemotherapy in women with breast cancer, J Immunol Res 2016: ((2016) ), 4757405. |
[41] | J. Ye, X. Su, E.C. Hsueh, Y. Zhang, J.M. Koenig, D.F. Hoft and G. Peng, Human tumor-infiltrating Th17 cells have the capacity to differentiate into IFN-gamma+ and FOXP3+ T cells with potent suppressive function, Eur J Immunol 41: ((2011) ), 936–951. |
[42] | P. Wu, D. Wu, C. Ni, J. Ye, W. Chen, G. Hu, Z. Wang, C. Wang, Z. Zhang, W. Xia, Z. Chen, K. Wang, T. Zhang, J. Xu, Y. Han, T. Zhang, X. Wu, J. Wang, W. Gong, S. Zheng, F. Qiu, J. Yan and J. Huang, gammadeltaT17 cells promote the accumulation and expansion of myeloid-derived suppressor cells in human colorectal cancer, Immunity 40: ((2014) ), 785–800. |


