
An overview of integral abutments: Current practices, field monitoring and deck replacement measures
Abstract
The use of integral abutments in bridges goes back many years to the late 1930’s in the United States. Over the years, integral bridges became more popular as more and more states built those bridges and more engineers became familiar with their design and construction. These bridges are being built in Europe since the 1980’s. An integral abutment bridge acts as a frame structure with a continuity connection between the superstructure and the substructure. The substructure is typically an integral cap supported on single row of piles that provides flexibility to accommodate thermal loads and displacements. The main advantage of integral abutment bridges is that they are built without expansion joints which eliminates maintenance costs and reduces construction costs. Because of the interaction between the soil and the integral abutment under the applied loads and the cyclic nature of thermal loads, the analysis and design of integral abutment bridges can be, in some cases, challenging especially when the designs falls outside the geometrical limits set by existing standards. This overview focus on field performance data reported in the literature and interpretation of this data. IT also highlights the needs for more test data during construction and for long term performance under cyclic thermal movements. Deck replacement requirements in integral abutments were investigated using analytical models and recommendations for deck replacement preparations are provided.
1Introduction
Integral abutment bridges became a popular choice of bridge construction for state DOT’s as engineers gained more experience in their design and construction and more information was disseminated to the engineering community such as the 2013 TRB SHRP 2 Report S2-R19A-RW-2 [1] and other documents as well as publication of more research on the subject. Their acceptance stems from the fact that no expansion joints or bearings exist within the bridge or at its ends thus reducing construction costs and maintenance costs, disruption to traffic, and lessens discoloration of substructure components at joint locations. While these are significant advantages of integral abutment bridges, there are some challenges in their design such as criteria for maximum length and maximum skew, torsional forces in horizontally integral curved bridges, connection to the approach slabs, connections to wing walls in highly skewed abutments, the interaction between the abutment walls and the soil behind them, and the potential of ratcheting of the backfill after many cycles or bridge expansion and contraction. Semi-integral abutment and seamless bridges are other types of jointless bridges presented in the literature [1]. In semi-integral abutment bridges, the superstructure and the abutment wall are cast as an end diaphragm that sits on expansion bearing. In the seamless bridge, longitudinal movements are accommodated by a transition slab supported on small piles and secondary slab. The transition slab is designed as a controlling element to accommodate and minimize longitudinal movements so that no expansion joints exist where when the transition slab connects with the roadway pavement. The purpose of this study is to provide an overview of existing research on integral abutment bridges from current practices, surveys, and field performance as well review of some state DOT requirements and limitations. The study also investigates the effects of thermal changes on girder stresses when the deck is removed and the recommendations provided in the 2013 TRB SHRP-2 Report for deck removal [1].
2Review of existing investigations and current practices
According to a survey on integral abutment bridges conducted by Paraschos and Amde [2], 41 states are building integral abutment bridges. Information from the survey shows that the use of integral abutment bridges began in 1930’s. In 1938, Ohio DOT built a 5-span integral abutment bridge, believed to be the first jointless bridge in the United States [1]. White [3] reported that there are approximately 9,000 integral abutment bridges and 4,000 semi integral abutment bridges in the United States. Colorado has the longest integral abutment steel bridge (1,044 ft) and the longest cast-in-place integral abutment concrete bridge (952 ft), while Tennessee has the longest integral abutment bridge made of precast concrete (1,175 ft). In their study, Paraschos and Amde [2] reported the following states: Missouri, Tennessee, California, Iowa, Illinois, Kansas, Washington, and Wyoming have more than 1,000 integral abutment bridges in their inventories. In fact, Missouri has over 4,000 integral abutment bridges and Tennessee over 2,000. Interestingly, the state of Washington which built more than 1,000 integral abutment bridges by the year 2000, decided to switch to semi-integral abutments [2]. Because of its low initial cost and low life cycle costs, Indiana DOT requires all new bridges that fall within certain geometric limits to be integral abutment bridges [4]. Vermont Integral Abutment Bridge Design Guidelines [5] requires that ‘Integral abutment construction shall be considered as a first option for all slab and slab on stringer bridges’. Similarly, New Hampshire recommends that Integral abutments shall always be considered as the first choice of abutment because of their lower construction cost and superior long-term performance’ [6]. According to Tabatabai et al. [7], approximately 73% of states allow the use of integral abutment bridge and about 65% of states prefer using integral abutment bridges over traditional jointed bridges.
A report by White [3] compared European and US practice in designing and building integral abutment bridges. His research showed the results from the European survey and earlier surveys from US, that there are many similarities in assumption and practices. On the other hand, there also some significant differences. According to the European Survey [3], girders are designed using a line model for small skews. Girders are analyzed for 2 cases: simple ends and fully restrained ends. Sweden permits the use of 50% of the calculated passive pressure behind the abutment to lessen the mid-span positive moments on the bridge beams. NYSDOT allows all their single span girders to be designed as simply supported although field measurements showed that the actual behavior of the somewhere between a simple span and fully fixed ends [8]. In England, they highly recommend computer modeling for all integral abutment bridge design while in Germany 3D modeling is only used for large skews or complicated framing arrangements [9]. In Sweden 3D computer modeling is becoming more commonplace for all integral abutment bridge designs. According to Kunnin and Alampalli [10], state agencies in the United States are split between using line models and 3D models depending on the structure geometries and specific requirements. The survey by White [3] also showed differences in foundation types. In Europe, spread footings are allowed for foundations in addition to single row of piles while in the United States only piles are allowed. In addition, some European countries do not use steel piles and only England and Ireland use steel pipes filled with concrete. In the US, more than 70% of the states use H piles [11].
Russell and Gerken [12] described “Jointless” bridges and discussed the design practice by various states. They found that the maximum length criteria between the abutment and the superstructure maybe designed as fully integral (to transfer shear and moment) or semi integral to transfer shear only. Also, some states attach the approach slabs rigidly to the abutment and bridge deck whereas other states provide an expansion joint between the abutment and the approach slab. Most states, however, did set the upper limit on skew angle ranging from 10 to 30 degrees. Some designers use a soil pressure equal to 50 percent of the full passive pressure whereas others completely ignore it.
New York State Department of Transportation (NYSDOT) initiated a study in 1996 to investigate the design parameters regarding soil pressure on abutments and load distribution among piles. The survey identified the following design issues among all states: Thermal expansion design limits, Soil-pressure assumptions, Pile design, Approach slab, Temperature effects, Abutment Stiffness, Soil pressure, Pile capacity, Pier Stiffness, Positive moment connection, Creep and Shrinkage, Curved and skew bridges. Hoppe and Gomez [13] reported results of instrumentation and monitoring a bridge and satisfactory performance of the structure, however, maintenance problems associated with excessive approach slab settlement were observed. Soil pressures exerted on the back of the integral backwall showed significant variation as a result of ambient air temperature changes.
A review of some of the standard details of few states shows that these details are similar. Figures 1, 2, 3, 4, 5, 6, and 7 show abutment wall and wall-girder connection typical details from NYSDOT [14], MnDOT [15], PennDOT [16], NHDOT [6], IDOT [17], VTDOT [5], and CDOT [18]. The IDOT [17], NHDOT [6], and CDOT [18] reinforcing details between the abutment wall and the approach slab do not include 45 degree bars as in the other details. The details by VTDOT [5] and ILDOT [17] include anchor bolts connecting the steel girder to the abutment walls, while the NYSODT, MnDOT provide a neoprene pad at that location. Figure 7 also shows the integral abutment details supported on drilled shafts from CDOT [18]. Figure 8 shows ILDOT pile orientations for perpendicular and skewed integral abutments [17]. In a memo to bridge designers, Illinois DOT made changes to integral and semi integral design requirements and detailing in which the maximum total length was increased to 610 ft and maximum single span integral abutment bridge was limited to 170 ft.
![NYSDOT integral abutment connection details [14].](https://content.iospress.com:443/media/brs/2022/18-1-2/brs-18-1-2-brs220196/brs-18-brs220196-g001.jpg)
![MnDOT integral abutment connection details [15].](https://content.iospress.com:443/media/brs/2022/18-1-2/brs-18-1-2-brs220196/brs-18-brs220196-g002.jpg)
![PennDOT integral abutment connection details [16].](https://content.iospress.com:443/media/brs/2022/18-1-2/brs-18-1-2-brs220196/brs-18-brs220196-g003.jpg)
![NHDOT Integral abutment connection details [6].](https://content.iospress.com:443/media/brs/2022/18-1-2/brs-18-1-2-brs220196/brs-18-brs220196-g004.jpg)
![IDOT integral abutment details for steel girders [17].](https://content.iospress.com:443/media/brs/2022/18-1-2/brs-18-1-2-brs220196/brs-18-brs220196-g005.jpg)
![Vermont integral abutment detail for steel girder bridges [5].](https://content.iospress.com:443/media/brs/2022/18-1-2/brs-18-1-2-brs220196/brs-18-brs220196-g006.jpg)
![CDOT integral abutment details for H piles (left) and drilled shafts (right) [18].](https://content.iospress.com:443/media/brs/2022/18-1-2/brs-18-1-2-brs220196/brs-18-brs220196-g007.jpg)
![IDOT integral abutments pile orientation [17].](https://content.iospress.com:443/media/brs/2022/18-1-2/brs-18-1-2-brs220196/brs-18-brs220196-g008.jpg)
A study by Tabatabai et al. [7] of current practices in integral abutment bridges showed that the many states use similar details for the connection between the girders and the abutment wall as well the connection between the abutment wall and the piles. The study also showed that most states use HP piles for pile support and about 56% require piles to be oriented such that bending occurs about their weak axis. Their data also showed that about 65% of the states specify a pile embedment length of 11 in to 24 in into the abutment wall. Most states require the maximum skew angle of 30 degrees with few states set their maximum skew at 20 degrees and few states at 45 degrees as shown in Table 1. The maximum total length of steel and concrete integral abutment bridges in each state is summarized in Table 2 [7].
Table 1
Maximum skew angles of abutment walls from various states [7]
| Skew angle (degrees) | States |
| 20 | 4 |
| 25 | 2 |
| 30 | 14 |
| 45 | 6 |
| Not mentioned | 11 |
| Total | 37 |
Table 2
Maximum length of integral abutment bridges [7]
| State | Max.Length-Steel | Max.Length-Cone. | ||
| ft | m | ft | m | |
| Colorado | 640 | 195 | 790 | 241 |
| DC | 460 | 140 | 460 | 140 |
| Delaware | 400 | 122 | 400 | 122 |
| Idaho | 350 | 107 | 650 | 198 |
| Illinois | 310 | 94 | 410 | 125 |
| Indiana | 500 | 152 | 500 | 152 |
| Iowa | 400 | 122 | 575 | 175 |
| Kansas | 300 | 91 | 500 | 152 |
| Maine | 200 | 61 | 330 | 101 |
| Massachusetts | 350 | 107 | 600 | 183 |
| Michigan | 300 | 91 | 400 | 122 |
| Minnesota | 300 | 91 | 300 | 91 |
| Montana | 200 | 61 | 200 | 61 |
| Nevada | 150 | 46 | 250 | 76 |
| New Hampshire | 300 | 91 | 600 | 183 |
| New Jersey | 450 | 137 | 450 | 137 |
| North Carolina | 300 | 91 | 400 | 122 |
| North Dakota | 400 | 122 | 400 | 122 |
| Ohio | 400 | 122 | 400 | 122 |
| Pennsylvania | 390 | 119 | 590 | 180 |
| Rhode Island | 350 | 107 | 600 | 183 |
| South Carolina | 240 | 73 | 300 | 91 |
| Tennessee | 500 | 152 | 800 | 243 |
| Vermont | 395 | 120 | 695 | 212 |
| Virginia | 300 | 91 | 500 | 152 |
| Washington | 300 | 91 | 450 | 137 |
Some states provide information on estimating the pile length of fixity whether through empirical formulas or using finite element analysis of the pile-soil interaction. Other states (MA and RI) provide information on estimating earth pressure behind the abutment wall. Paraschos and Amde [2] reported some of the problems associated with the use of integral abutments bridges by surveying many states. Their results showed that some states did not report problems with their integral abutment bridges but other states reported some problems. The problems reported by some states included cracking at the connection between the approach slabs and the abutment walls; large thermal movements resulted in cracking and settlements in approach slabs; frozen soil around the pile preventing them from rotating; water intrusion between abutment wall and approach slab; problems at the expansion joint at the end of the approach slabs especially in long integral abutment bridges; deck cracks due to pouring sequence; problems with MSE walls; cracks and warping in abutment wall/diaphragm due to rigid fill and long abutments. However, the authors attribute the overall good performance of integral bridges to the fact that integral abutment bridges are built within the specific geometric and design limitations mandated by each state design requirements.
2.1Deck placement sequence
An important construction phase of integral abutments is the pouring sequence of the deck and the abutment walls. Integral abutment bridges are typically built with composite decks where the deck is poured in stages. A typical integral abutment bridge is constructed by driving piles first followed by construction of abutment walls up to the bridge seat elevation levels. Girders are typically set on small elastomeric pads or leveling plates on the partially built abutment wall. Some details require anchor bolts at the connection between the girder and the abutment wall while others do not. The deck is typically poured in multiple pours to minimize cracking potential at the interface between the deck and the wall. The first pour covers most of the span except for the areas near the walls. The second pour covers the remaining area of the deck and the abutment walls above the bridge seat elevation. Several states require the pouring sequence to be shown on the contract drawings. Figures 9 and 10 show the deck pouring sequence requirements for single and multiple span integral abutment bridges in Idaho [19]. Figure 11 shows the NYSDOT deck pouring sequence for single span integral abutment bridges [14]. Iowa DOT [20] deck placement sequence for two span integral abutment bridge is similar to the Idaho DOT (Fig. 9). Idaho DOT requires 24 hours waiting period between pours for single spans IAB and up to 48 hours waiting period between pours for multiple spans. NYSDOT requires 48 hours between pours. Colorado DOT requires less than 2 hours between deck concrete placement and abutment wall concrete placement [18]. PennDOT requires pouring the bridge deck first except for 4 ft of the deck near each abutment wall [16]. Those 4 ft will be poured no later than 2 hrs after the abutment walls are cast. There has been no research on the construction sequence of integral abutment deck and abutment walls and it will be worth looking into the effects of various deck and abutment pouring sequence schemes on deck and abutment walls stresses and strains.
![Idaho DOT deck pour seuence for single span integral abutment [19].](https://content.iospress.com:443/media/brs/2022/18-1-2/brs-18-1-2-brs220196/brs-18-brs220196-g009.jpg)
![Idaho DOT deck pour seuence for multispan integral abutment [19].](https://content.iospress.com:443/media/brs/2022/18-1-2/brs-18-1-2-brs220196/brs-18-brs220196-g010.jpg)
![NYSDOT proposed deck pour seuence for single span integral abutment [14].](https://content.iospress.com:443/media/brs/2022/18-1-2/brs-18-1-2-brs220196/brs-18-brs220196-g011.jpg)
3Review of field performance and test data
Several integral abutment bridges were instrumented and monitored in the last 20 years to collect data on their performance over time under applied loads, in particular, thermal loads. Researchers monitored minimum and maximum displacements (contraction and expansion), pile axial stress, pile bending moments at the top, soil pressures behind the abutment wall, bending moments in the bridge girders, and pile and wall rotations. In addition to reporting needed data on displacement magnitudes and stress levels, many researchers used the field data calibrate finite element simulation models.
Huntley and Valsangkar [21] collected data on integral abutment movements and earth pressures for an integral abutment bridge in Fredericton, New Brunswick, Canada over a 9 year period. The bridge was a two-span IAB and each span was 125 ft. The superstructure was made of prestressed concrete bulb tee girders and the piles were 22 HP 12×89 piles each side oriented such that they bend about their weak axis. The bridge had 0 skew. The data showed that at one abutment location, only translation displacements were observed while on the other abutment it was a combination of abutment wall translation and rotation. The data also showed the two abutment walls titling away from each other. No conclusive results were observed with respect to increased stiffness in the soil behind the abutment over the 9-year period.
Civjan et al [22] instrumented two bridges in Vermont. A straight bridge about 141 ft long (Middlesex Bridge) and a skewed bridge about 121 ft long and 15 degrees skew (East Montpelier Bridge). For both bridges the abutment wall height was 13 ft and the pile depth was 20 ft. Their test results showed that the measured earth pressure behind the abutment walls were less than 40% of the full passive pressure indicating that design for full passive pressure is too conservative. The magnitude of these pressures was in the order of 4 psi to 6 psi. The deformations on top of piles were much less than those that would cause yielding in the HP piles. Measured earth pressures showed no evidence of ratcheting of the earth pressure behind the walls. The data also showed rotation of the abutment walls where the peak temperature displacements at top of the wall were approximately 1.5 to 2 times larger than those measured at top of the piles. Wall rotations were of the order of 0.1 degrees. Figure 12 shows thermal displacements on top of pile and top of wall for the straight bridge for the coldest and hottest days for Year 1 (left) and Year 3 (right).
Fig. 12
Thermal displacements on top of pile and top of wall for the straight bridge for the coldest and hottest days for Year 1 (left) and Year 3 (right) [22].
![Thermal displacements on top of pile and top of wall for the straight bridge for the coldest and hottest days for Year 1 (left) and Year 3 (right) [22].](https://content.iospress.com:443/media/brs/2022/18-1-2/brs-18-1-2-brs220196/brs-18-brs220196-g012.jpg)
Frosch and Lovell [4] instrumented and monitored 3 integral abutment bridges in Indiana between 2001 and 2010. Figure 13 shows the temperature earth pressure variations for two span IAB 152 ft long bridge and 25 degrees skew. In general their test results showed that the earth pressure did increase for the first 4 years and then became less and more steady. The instrumentation of selected piles along their depths of 5 span 367 ft long bridge showed that the piles bend in double curvature as expected. Figure 14 shows computed curvatures from measured strains. Rotations as well as well longitudinal displacement were observed at abutment wall for IAB bridges with skew.
![Temperature earth pressure variations for two span IAB 152 ft long bridge [4].](https://content.iospress.com:443/media/brs/2022/18-1-2/brs-18-1-2-brs220196/brs-18-brs220196-g013.jpg)
![Approximated curvature for SR-18 5 span bridge Pile 6, Bent 1 for selected dates [4].](https://content.iospress.com:443/media/brs/2022/18-1-2/brs-18-1-2-brs220196/brs-18-brs220196-g014.jpg)
Wooseok and Laman [23] instrumented and monitored 4 IAB bridges in Pennsylvania from 2.5 years to nearly 7 years. All bridges have PPC girders and 0 skew. Bridge B109 was 4 spans 420 ft long. Bridge B203 was 3 spans 172 ft long. Bridges B211 and B222 were singles spans 114 ft and 62 long respectively. All piles were HP12×74 bending about their weak axis. They recorded wall and girder rotations, earth pressures, and girder strains. Figure 15 shows the recorded earth pressure behind the abutment walls for all 4 bridges. Table 3 shows wall rotations in degrees. Observations from the data in Fig. 15 and Table 3 seems to indicate higher earth pressures behind the abutment walls compared to other reported pressures. The rotations in Table 3 at abutment walls in bridges B203 and B211 seems to be relatively high. The abutment heights in B203 and B211 are 19 ft and 14 ft respectively.
![Earth pressures recorded at abutment walls of the 4 IAB bridges in Pennsylvania [23].](https://content.iospress.com:443/media/brs/2022/18-1-2/brs-18-1-2-brs220196/brs-18-brs220196-g015.jpg)
Table 3
Wall and girder rotations in degrees at the 4 bridge locations [23]
| Response | Gauge location | B109 | B203 | B211 | B222 |
| Abutment rotation | Interiora | 0.139 | 0.322 | 0.232 | 0.184 |
| (degree) | Exteriora | 0.184 | 0.187 | 0.162 | 0.096 |
| Girder rotation | Interiorb | 0.157 | 0.181 | 0.225 | 0.160 |
| (degree) | Exteriorb | 0.152 | 0.255 | 0.151 | 0.135 |
aAbutment rotations were measured under interior and exterior girders. bGirder rotations were measured at interior and exterior girders.
Khodair and Hassiotis [24] instrumented integral abutment beige in Scotch Plains, NJ and collected data on displacements due to thermal loads. Each abutment was supported on 19 HP14×89 piles. Temperature changes were measured and used as an input to the analytical model. They compared analytical results with experimental data. Figure 16 shows measured pile displacements versus predicted displacements from LPILE. The figure also shows the effect of the size of the sleeve around the piles on their displacements. They also recorded pressures in the fill material in the sleeves around the piles. These measurements showed that the influence of the lateral loads imposed by the superstructure on the piles is confined within a small volume of soil around the piles. Measured pressures in the crushed stone surrounding the piles at the perimeter of the galvanized steel sleeve were approximately zero in magnitudes regardless of the change in the diameter size.
![Measured pile displacements versus predicted displacements from LPILE [24].](https://content.iospress.com:443/media/brs/2022/18-1-2/brs-18-1-2-brs220196/brs-18-brs220196-g016.jpg)
Civjan et al [25] instrumented a three span integral abutment bridge 270 ft long. The bridge had 4 steel girders and two integral abutments. Each abutment is supported on 8–10×57 HP piles. The piles were 60 ft deep and 10 ft into augered holes. The weak axis of the piles was parallel to the transverse axis of the bridge. The bridge was instrumented for 16 months and the temperature range during that period ranged from -4F to 99F. Recorded longitudinal displacements recorded were +0.5 in and –0.2 in. These displacements were consistent with measured temperature variations. Soil pressures recorded varied from 0 psi to 40 psi.
Alshibli et al [26] instrumented PPC piles supporting an integral abutment bridge. The piles were 36 in x36 in square piles and 60 ft deep. The pile concrete strength was 10 ksi. The bridge was 3945 ft long divided into 11 spans with an integral connection at one end of the bridge and simple connection at the other end. Their results showed that the soil pressures behind the abutment wall were approximately 4 psi. The maximum bending moment calculated from pile strains was about 200 k-in compared to the cracking moment of 4500 k-in. Given the size of the piles and the recorded field data, the design seems to be overly conservative.
LaFave et al [27] instrumented two skewed IAB bridges in Illinois, USA (one bridge is 550 ft four span with 30 deg. skew and the other is 185 ft single span with 42.5 deg. skew). The bridges were monitored for two years. Field data showed that there is adequate pile strain capacity and the piles are not expected to yield under service conditions. Piles strains near acute corners showed higher strain levels. Measured expansion and contraction were slightly lower than predicted values and small differential rotations were observed at the connection between the abutment walls and the girders. These differential rotations were 0.1 deg for the single span bridge and 0.33 deg at the four span bridge.
4IAB deck rehabilitation
Review of Bridge Design Manuals from the majority of US State DOT’s revealed no rehabilitation guidelines specific to integral abutment bridges. TRB SHRP 2 [1] addressed deck replacement in integral abutment bridges and recommended that either the backfill behind the abutment walls and the approach slab be removed prior to deck replacement or calculate the stresses in the girders due to the passive pressure behind the walls to avoid local or global buckling. An integral abutment bridge failure occurred in Missouri in 2010 during deck replacement revealed that certain problems can occur during deck reconstruction and may lead to girder lateral buckling. Lee et al [28] investigated lateral buckling in integral abutments during deck replacement under thermal loads and proposed an equation to predict the girder lateral buckling loads. However there are other methods to avoid lateral buckling of girders during deck replacement. An analytical study of the various parameters that impact girder buckling during deck replacement is discussed in the next section:
As it is important to follow the deck placement sequence of integral abutments, it is also important to understand the issues associated with deck replacement of integral abutments.
In spring 2010 an integral abutment bridge in Missouri was undergoing deck replacement and approach slab rehabilitation. The contractor started the deck removal in the early morning hours. The weather on that day was typical for spring weather in the Midwest. The early morning temperatures were in the low 30’s, however by afternoon, the temperature increased to mid 70’s. Two hours after deck removal was completed, all bridge girders warped and buckled laterally as shown in Fig. 17. As a result, the bridge required complete superstructure replacement. There are many factors that may have contributed to the girder failure of this integral abutment during the deck replacement. This bridge was designed and constructed in 1960’s when integral abutment bridges were not very common and the experience in their design and construction was limited. Since that time, many more integral abutment bridges were built and more guidance was provided for their design and construction. One possible explanation for girders failure in the integral abutment bridge in Fig. 17 after deck removal was their inability to withstand the compressive stresses from thermal expansion. Since the integral abutment diaphragms (wall) were still in place at the time of deck removal, the girders could not expand freely in longitudinal direction thus resulting in high axial stress in the girders. In addition, the intermediate diaphragms between the girders and their spacing are other factors that can influence the lateral buckling and stability of the girders. Since integral abutment bridges are not as old as other bridges and deck replacement usually takes place after many years in service, it is possible that this may have contributed to the lack of experience among engineers and contractors in deck replacement of IAB bridges.
![Lateral buckling of girders following deck removal in Missouri, USA [28].](https://content.iospress.com:443/media/brs/2022/18-1-2/brs-18-1-2-brs220196/brs-18-brs220196-g017.jpg)
4.13D finite element IAB model
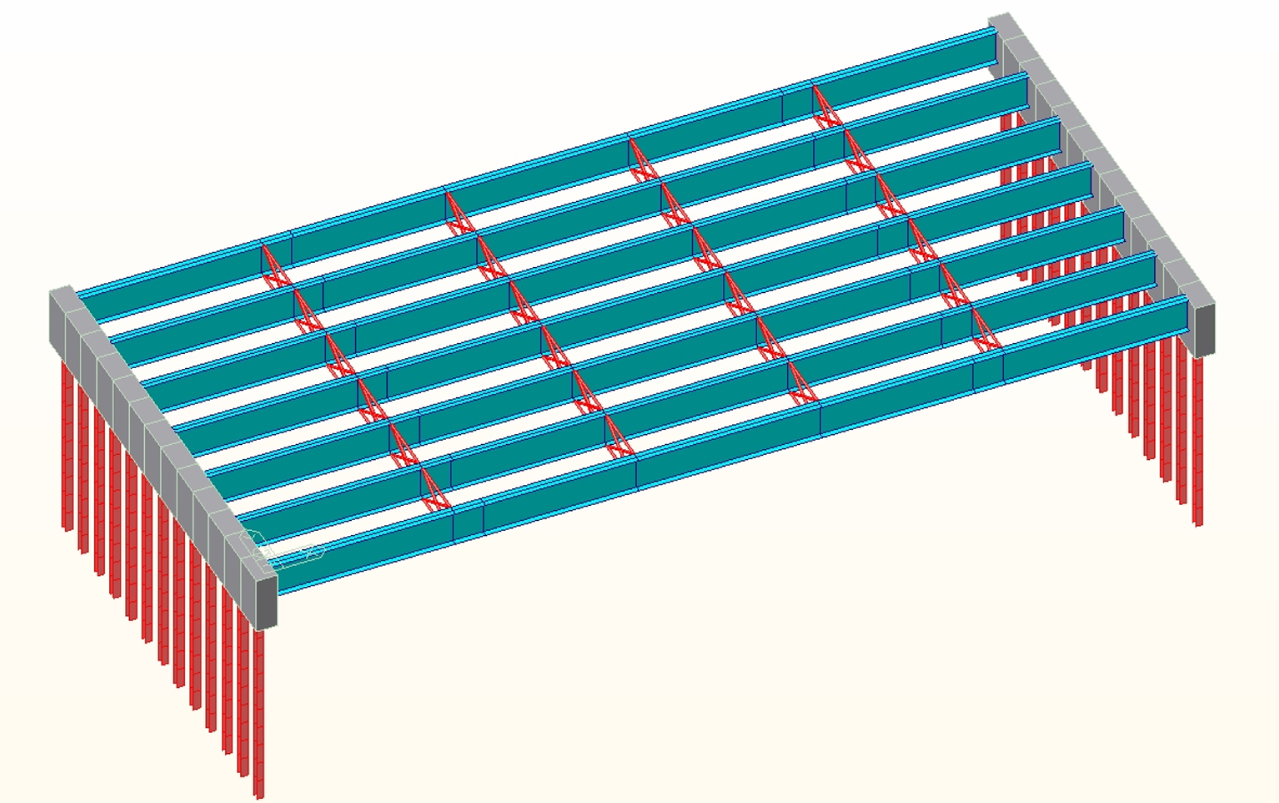
The main goal of the analytical investigation of deck replacement is to analyze the effects of the various components of an integral abutment bridge on girder behavior during deck removal and replacement. These components include: pile configuration, skew, backfill properties, and girder bracing. The applied loads on the modeled bridge are dead weight and temperature change. The temperature change was assumed to be 55 F in this analysis. Figure 18 represents a 3D computer model of the structure. The purpose of the finite element model is to investigate the axial stresses induced in the girders due to thermal expansion. The structure is a single span integral abutment bridge 130 ft long modeled using Midas Civil software as well as SAP2000 [29,30]. The superstructure consists of 7 steel plate girders each 130 ft long. The girder spacing is 10 ft with four rows of cross bracing (diaphragms) spaced at 26 ft. The abutment walls are 8 ft 6 in deep and 3 ft wide at both ends of the bridge. The abutments were modeled as solid elements. Shell elements were used to model the steel girders and beam elements were used to model cross bracing. The abutment walls were supported on 13 HP12×63 piles spaced at 5 ft center to center (one pile under each girder and one pile in between girders). The piles were modeled as beam elements with the top of the pile rigidly connected to the abutment wall. The backfill behind the abutment walls was represented as three dimensional non-linear springs. The Midas Civil has built in soil models. It also has ‘integral abutment’ option where springs are selected and modeled for the ‘abutment’ and for the ‘piles’. The abutment soil interaction was modeled using compression springs only model using passive pressure where the passive pressure coefficient are obtained by the program depending on the thermal movements. The pile springs were ‘multi-linear’ modeled using built in p-y curves for soft clay. The program has built-in p-y curves for sand, soft clay and dense clay. Midas compression only springs does not take into account the ‘Ratcheting’ effects due to repeated expansion and contraction cycles. This is very important as the passive pressure behind the soil can be significantly higher due to ratcheting. And this very important because deck replacement happens after many years of service and by ten the backfill has undergone many expansion and contraction cycles. The British Standards, BSI, PD6694-1 [31] has a formula for K* passive pressure coefficient that takes that into account the effects of ratcheting. Four general models were created with different skews of 0, 10, 20, 30 degrees.
Fig. 18
3D view of the integral abutment bridge (deck removed).
All girders were of structural steel AASHTO M270, Grade 50 W (ASTM A709, Grade 50 W). Sizes of exterior and interior girders are shown in Table 4. All girders were modeled using shell elements. All cross braces were single angles L4×4×raise0.7ex1 / - lower0.7ex2. Cross braces were modeled as beam elements. Girders and braces were connected together through a series of rigid links, therefore no girder section deformation were possible at braces.
Table 4
Interior and exterior girder dimensions in FE model
| Girder | Span | Length | Web | Top Plate | Bottom Plate |
| Exterior | End | 30’-6” | 60”×11/16” | 18”×1” | 20”×11/4” |
| Center | 70’-0” | 20”×13/4” | |||
| Interior | End | 30’-6” | 16”×1” | 18”×11/8” | |
| Center | 70’-0” | 18”×15/8” |
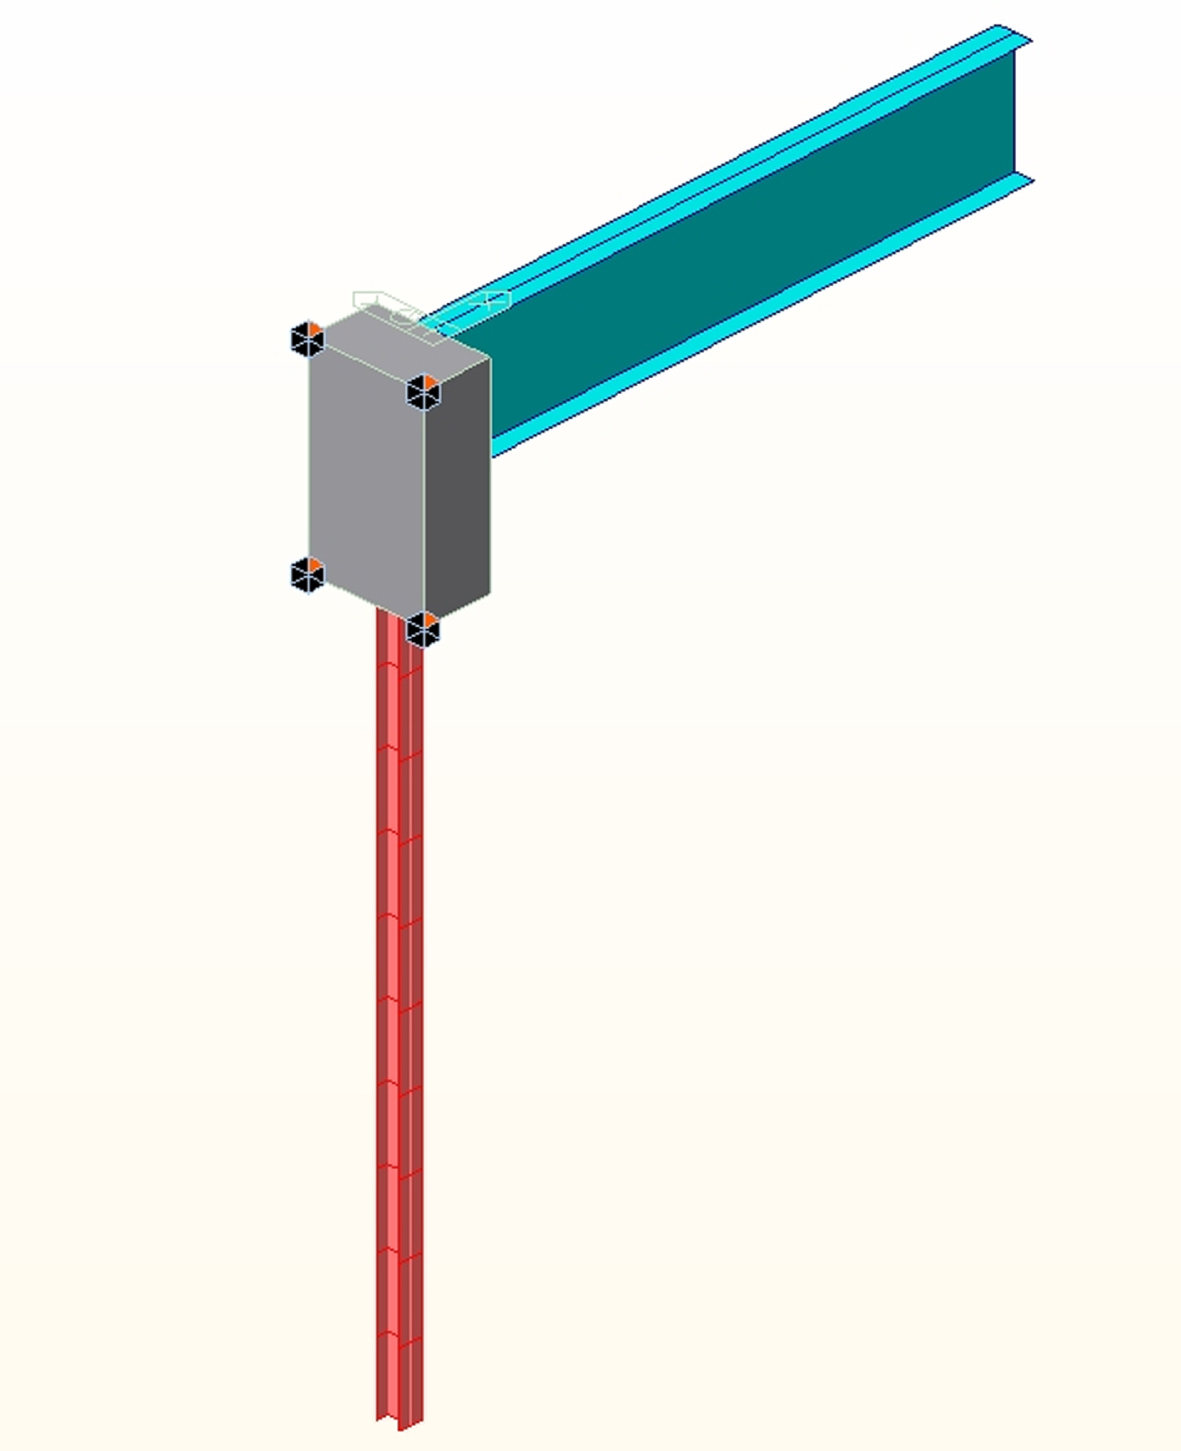
The backfill was assumed to be well graded granular material and was modeled in Midas using non-linear 3-dimentional discrete springs spaced vertically at 3 ft. The following soil properties were used for the model: angle of internal friction φ = 33°; specific gravity 2.65; void ratio 0.5; unit weight 120 pcf; coefficient of subgrade reaction 50 pci; and earth pressure coefficient at rest is 0.4. The piles were steel HP12×63, Grade 50 ASTM A572 piles 30 ft deep below the bottom of the abutment wall. As stated earlier, the piles were modeled as beam elements and the surrounding soil was modeled as non-linear 3D springs placed at every 3 ft. Abutment walls were modeled using solid elements. The walls were subdivided into segments each segment 5 ft wide supported by a single pile in the middle and four compression/tension springs at each corner adjacent to backfill soil as shown in Fig. 19. Abutment walls segment, pile and girder were connected with a series of rigid links in order to work as a whole integral piece. Class C 3500 psi concrete was used as abutment material.
Fig. 19
3D view of abutment segment, pile and girder connectivity.
4.2Parametric study and results
To reduce the susceptibility of girders to excessive axial stress during deck removal and replacement, certain measures should be considered to protect the girders against lateral buckling. The 3D finite element evaluates the effectiveness of two measures that can protect the girders. These include: 1) excavation of the backfill behind the abutment; and 2) adding temporary braces between the girders. Two sets of models were used in the parametric study. One set investigates the effect of the various integral abutment components on axial stresses in the girders when the deck is removed without any protective measures and the other including protective measures. The main purpose of first set of models group is to analyze how different bridge components influence the axial stresses produced in girders due to temperature change when the deck is removed. The key parameters were: soil parameters; pile configuration and orientation; skew angle; elevation difference between abutments; and the use of expanded polystyrene layer (EPS) behind the abutments. Table 5 shows the parameters of the IAB base model.
Table 5
IAB base model (without protective measures)
| Pile Size | HP12×63 |
| Pile Orientation | Weak |
| Skew | 0° |
| Backfill properties | Dense Sand |
| Temperature Change | 55°F |
| EPS | Without EPS |
Figure 20 shows stress distribution in a typical interior girder of the base model due to 55°F temperature change and a very stiff backfill. The maximum axial stress in Fig. 20 was approximately 16 ksi. Figures 21–23 show the axial stress distribution in a typical interior girder for stiff, medium stiff and soft backfill. The maximum axial stresses from Figs. 21–23 were 14 ksi, 4.5 ksi, and 0 ksi respectively. These results indicate that a combination of large temperature variations and stiff backfill could result in lateral buckling of the girders when the deck is removed. It is also important to note that the measured pressures in the backfill from field tests did not indicate the presence of stiff backfills. However, the majority of these field tests were conducted for time spans ranging from 4 to 9 years which are shorter than the service life of the deck. Due to thermal expansion and contraction of the bridge superstructure, the backfill behind the abutment walls is expected to undergo a large number of load cycles e to the cyclic over the life of the bridge deck. These cyclic loads in the backfill could result in redistribution of granular particles making the backfill much stiffer than expected.
Fig. 20
Axial stress distribution in a typical interior girder with very stiff backfill.
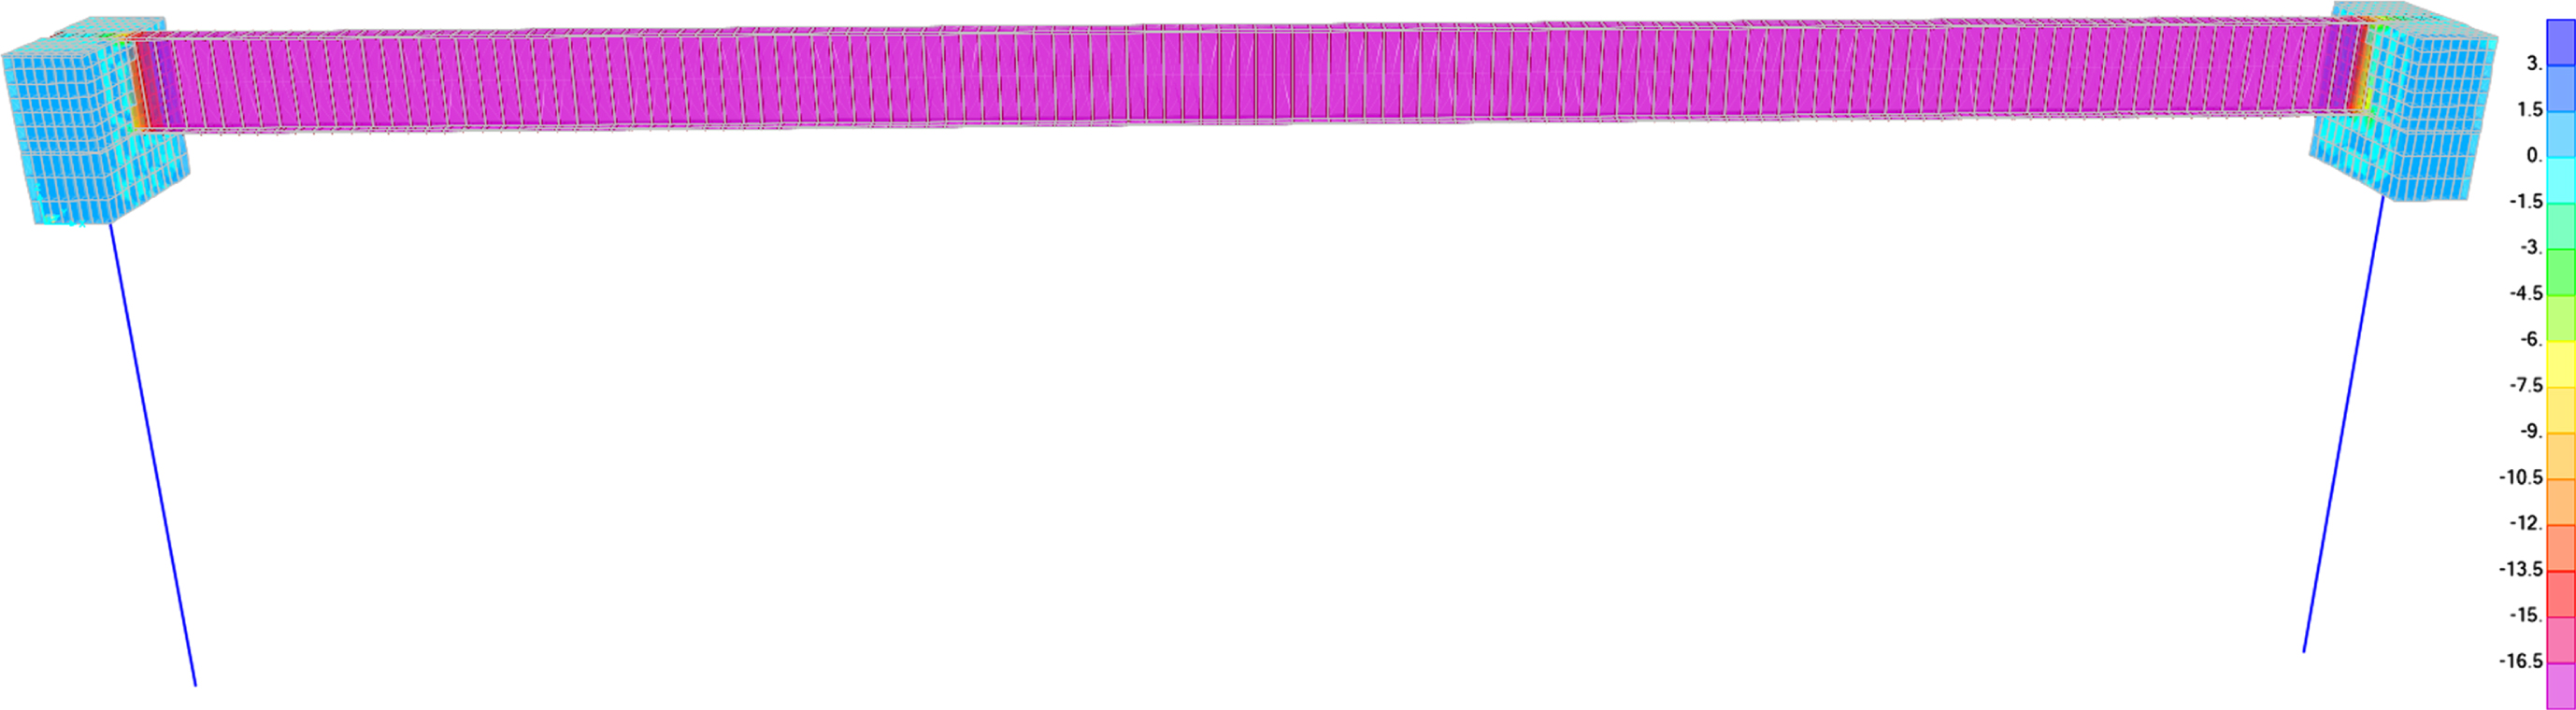
Fig. 21
Axial stress distribution in a typical interior girder with stiff backfill.
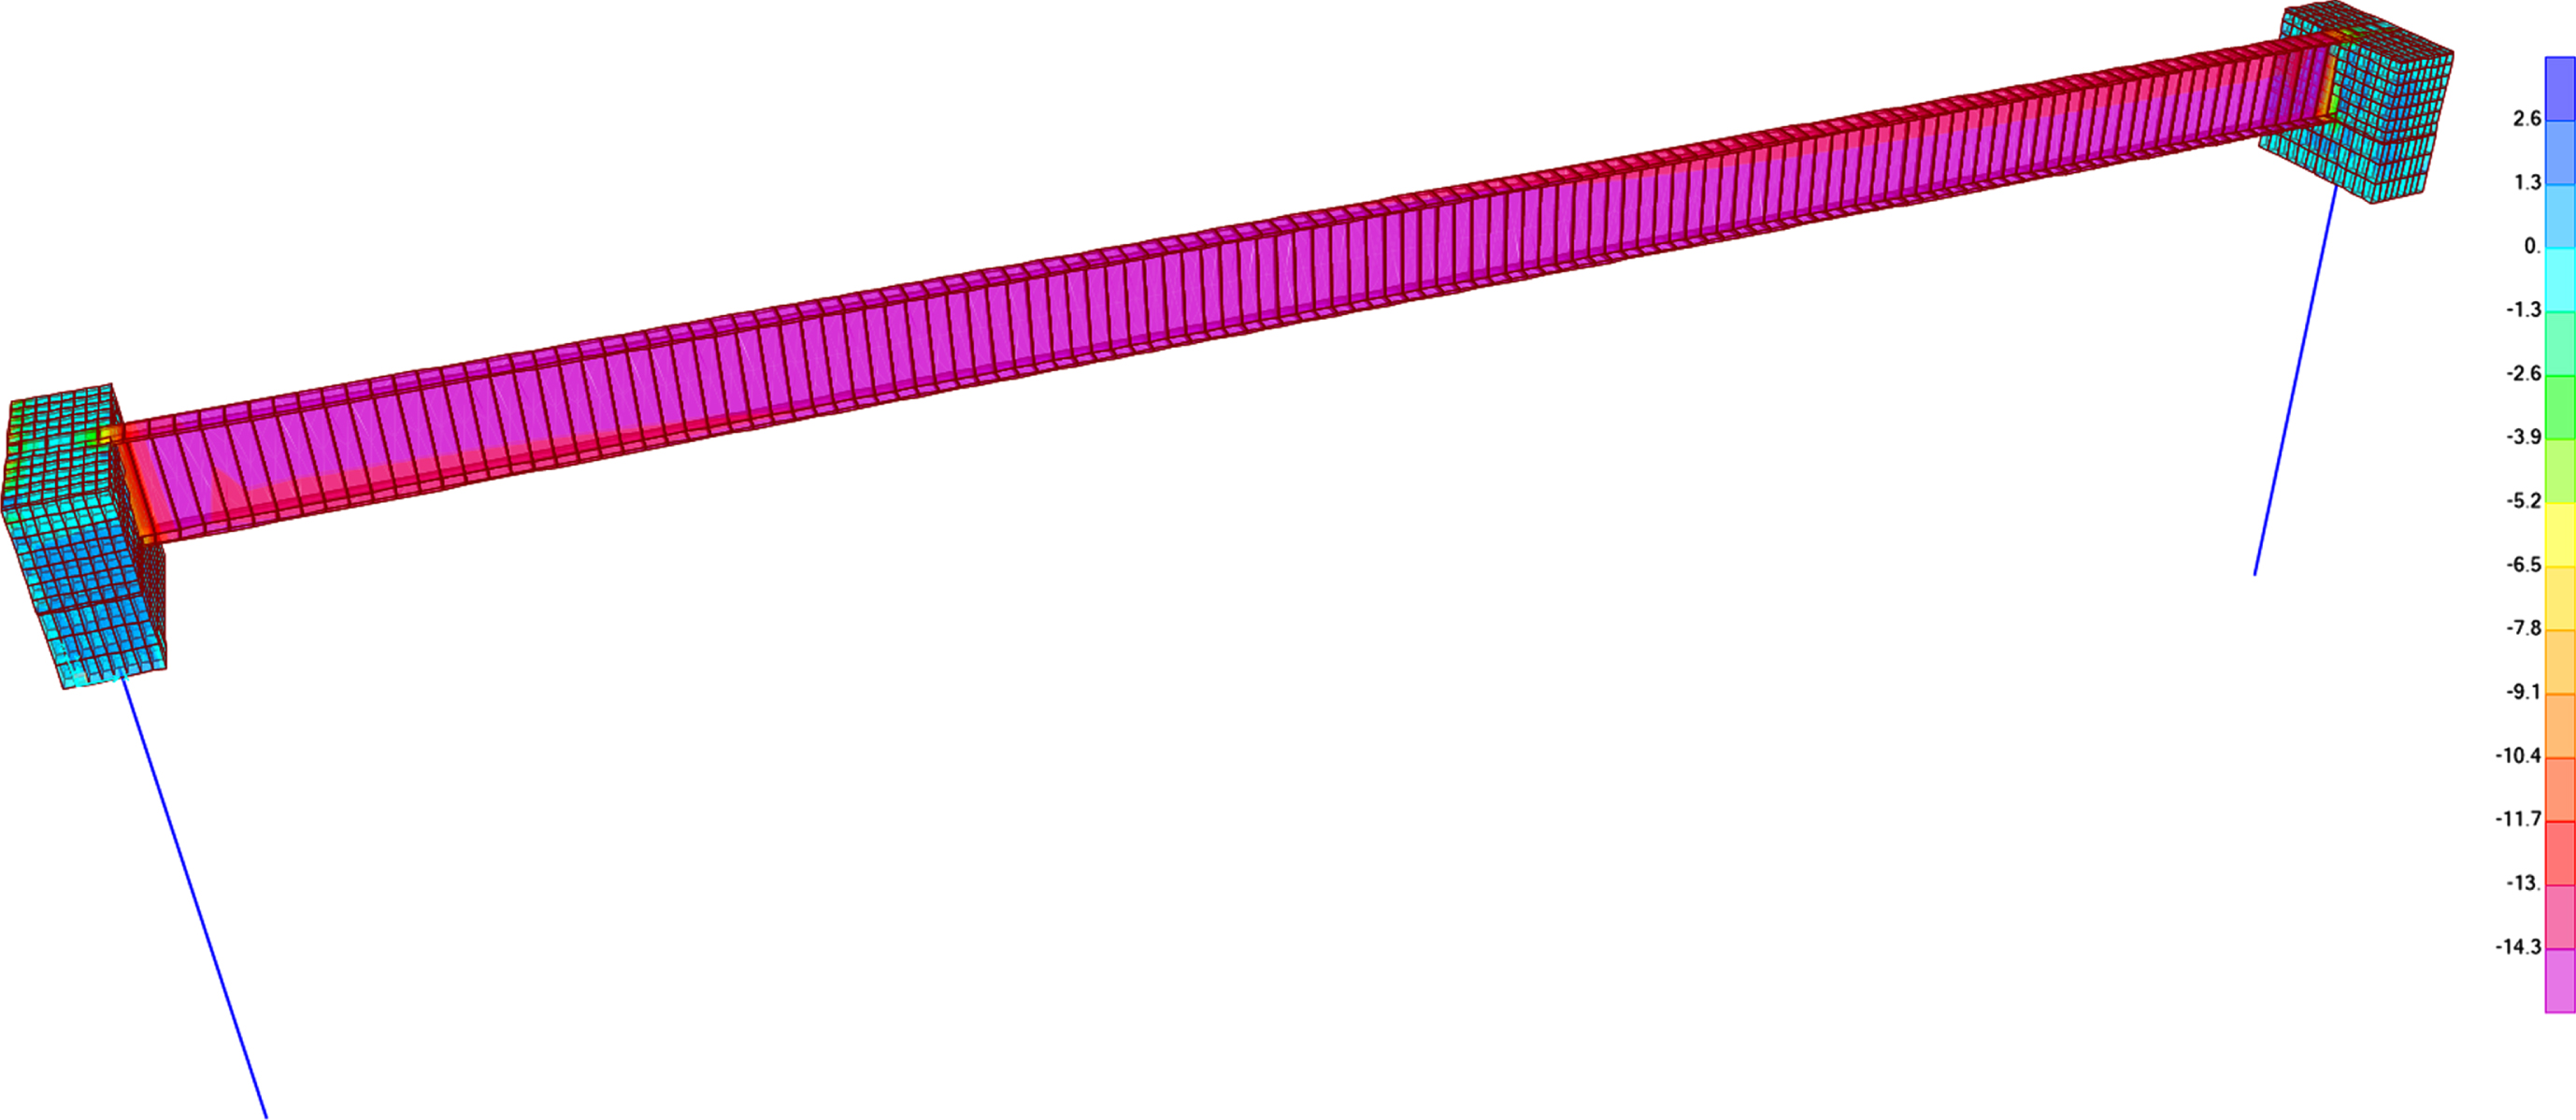
Fig. 22
Axial stress distribution in a typical interior girder with medium to soft backfill.
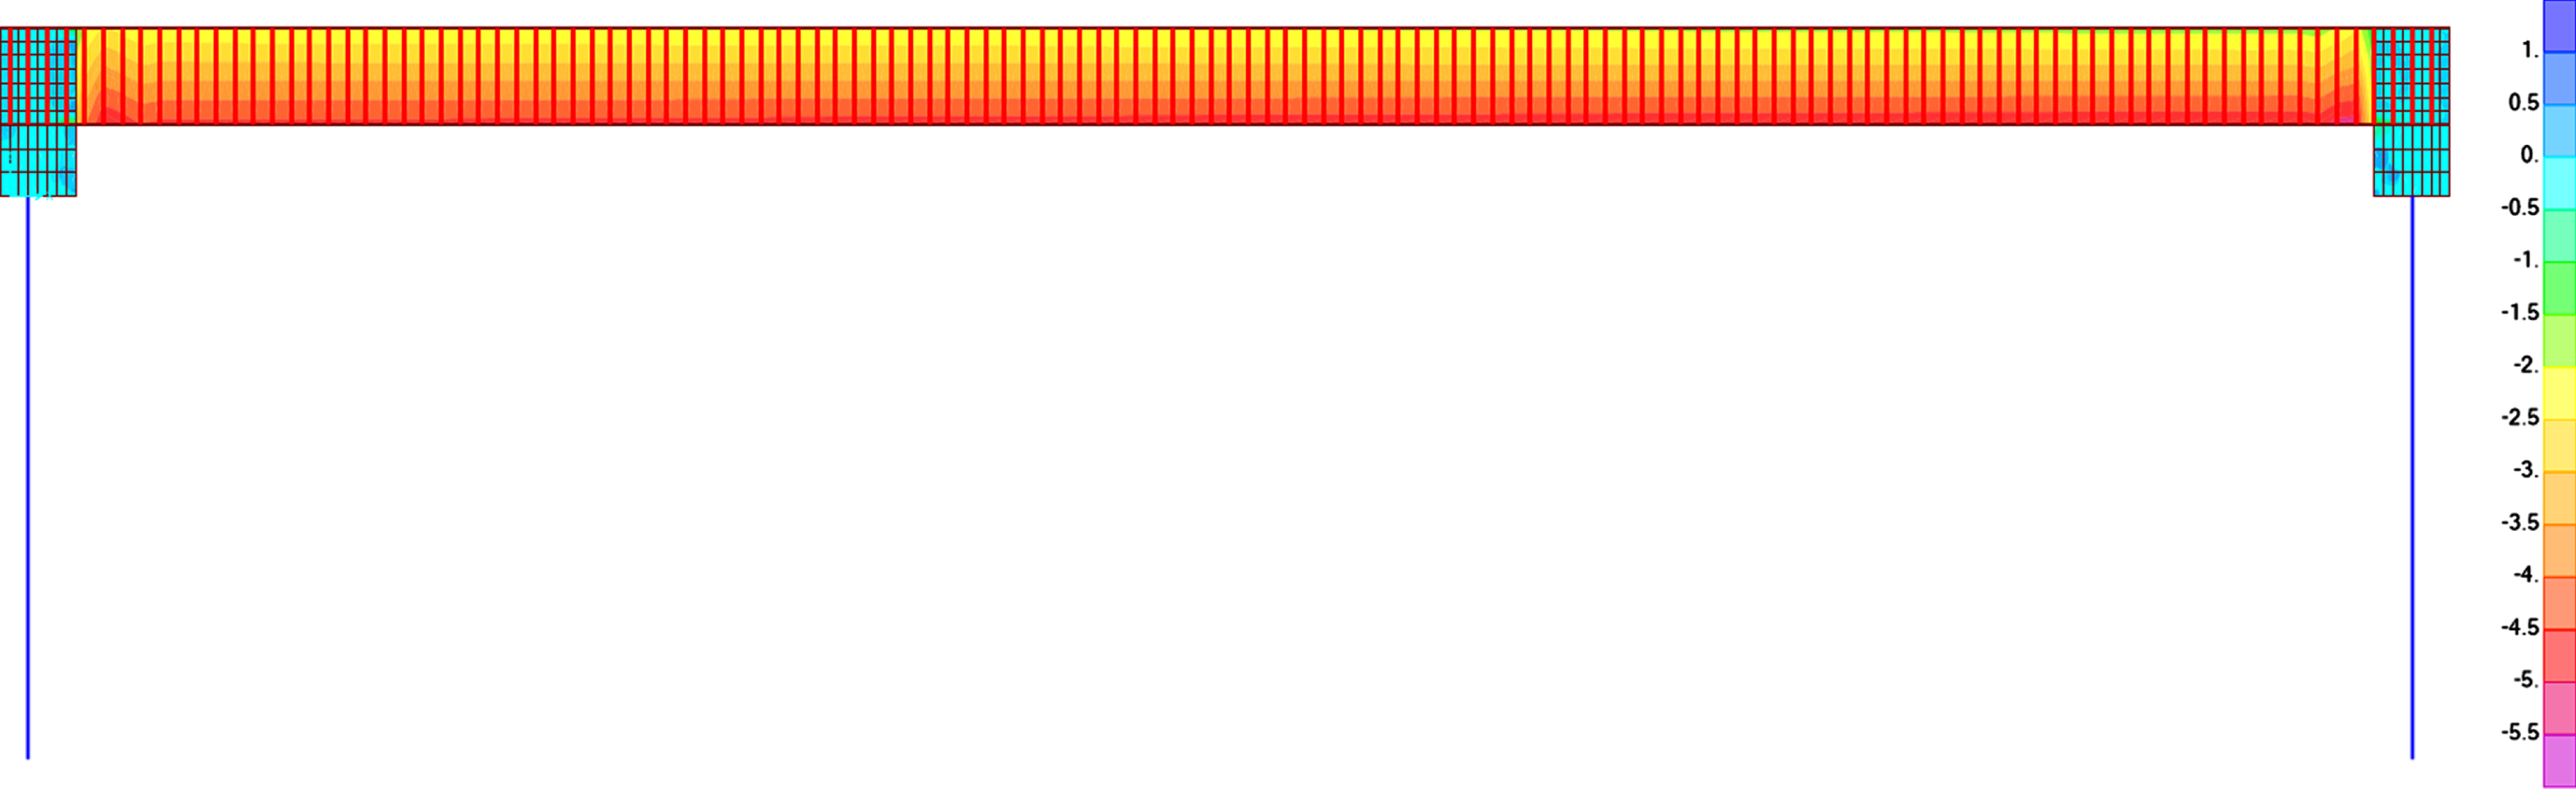
Fig. 23
Axial stress distribution in a typical interior girder with very soft or no backfill.
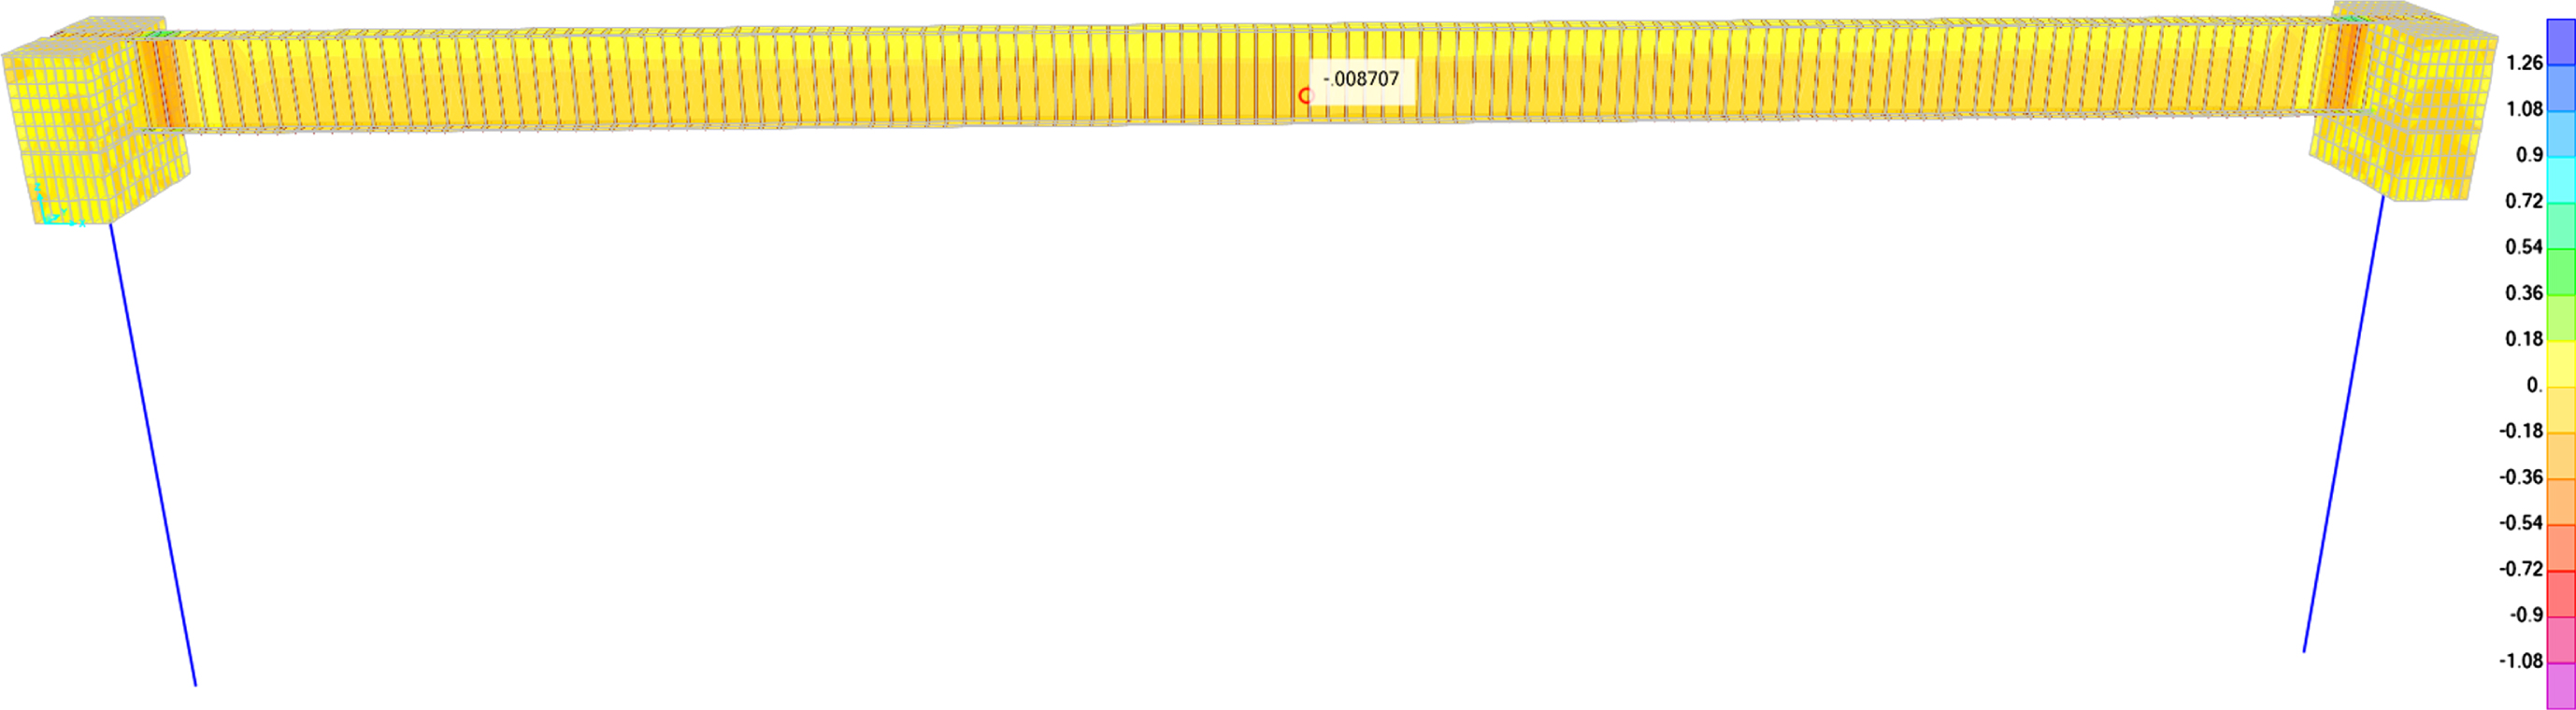
Table 6 shows the buckling stress limits for the girders used in the finite element model for various values of the unbraced length KL. Table 6 shows that, even with low axial stresses of few ksi in the girders during deck replacement, there is a potential of lateral buckling of the girders if the integral abutment is very long and the temperature increase was significant and adequate bracing was not provided. Figure 24 shows the deflected shape.
Fig. 24
Deflected shape due to 55° F temperature increase.
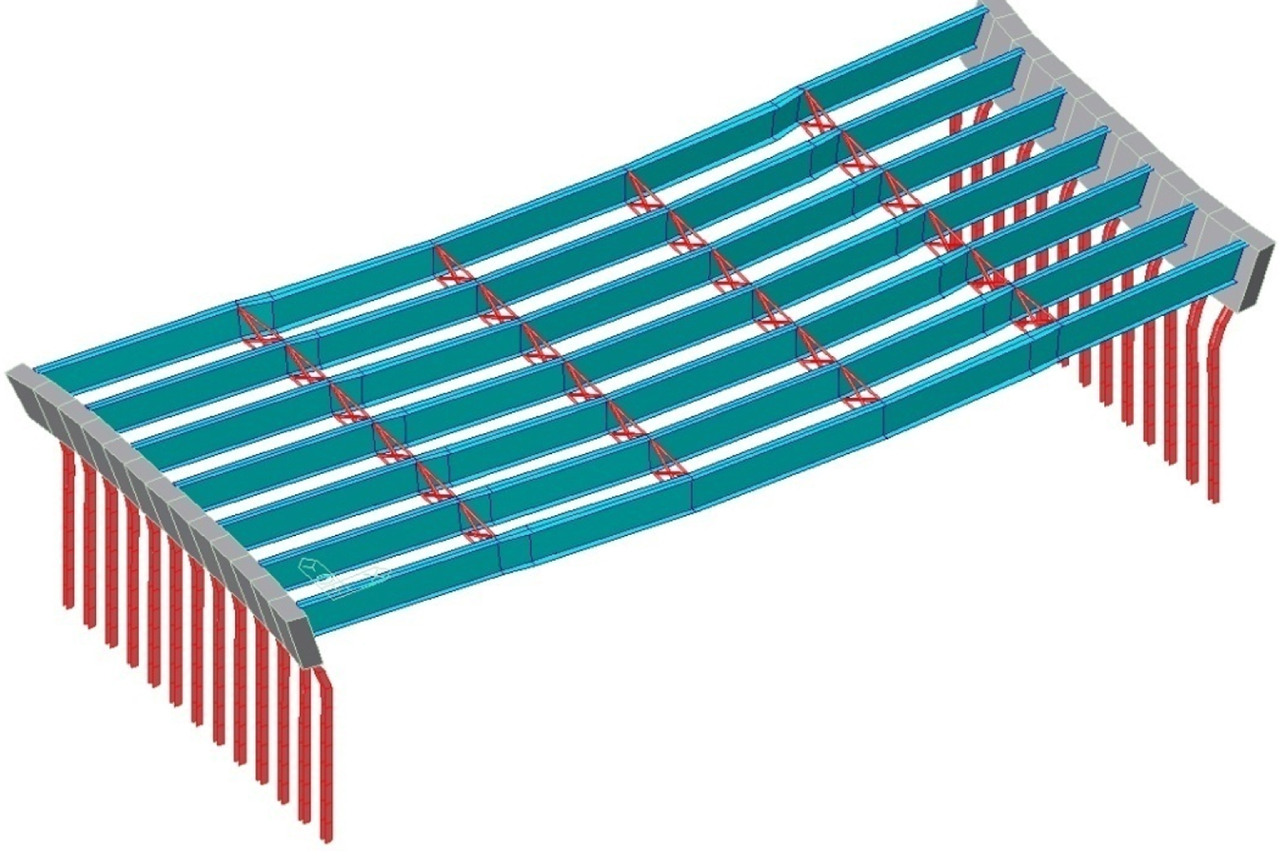
Table 6
Available buckling stress ΦFcr about the weak axis versus unbraced length (KL)
| KL (ft) | Area (in2) | Iy (in4) | Buckling Stress, ΦFcr (ksi) |
| 25 | 86.5 | 1131 | 27.2 |
| 30 | 86.5 | 1131 | 21.8 |
| 35 | 86.5 | 1131 | 16.8 |
| 40 | 86.5 | 1131 | 12.4 |
| 45 | 86.5 | 1131 | 8.8 |
| 50 | 86.5 | 1131 | 6.0 |
| 60 | 86.5 | 1131 | 2.5 |
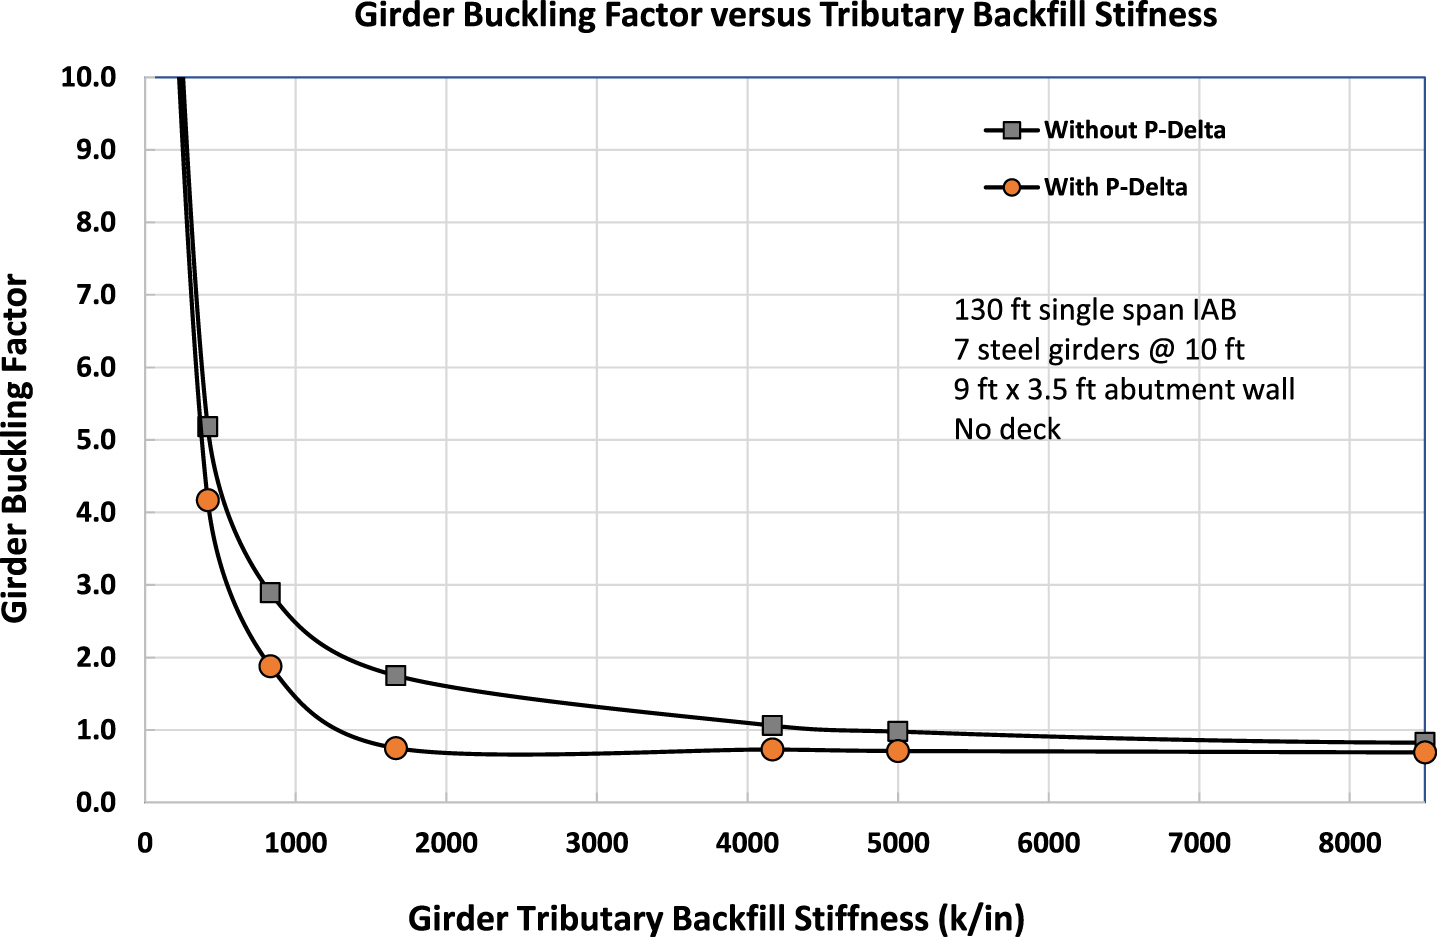
A stability analysis of a typical interior girder versus the stiffness of the backfill is shown in Fig. 25 for the girders length and dimensions used in this study with the deck removed. For the girder to remain stable and not to fail in buckling, the girder buckling factor should be less than 1.0. Figure 25 shows that as the stiffness of the backfill increases, the buckling factor decreases and could become less than one depending on the length of the girder, its size, and the stiffness of the backfill.
Fig. 25
Girder buckling factor versus tributary backfill stiffness.
4.2.1Effect of pile size and orientation
The decrease of the pile size from HP 12×63 to HP10×57 decreased girder stress by 2% and the increase of pile size to HP14×89 increased stress by 4%, however change of pile orientation from weak axis to strong axis increased girder stress by 11%. A change of pile configuration to 1.5 ft diameter pipe pile filled with concrete increased girder stress by 4%.
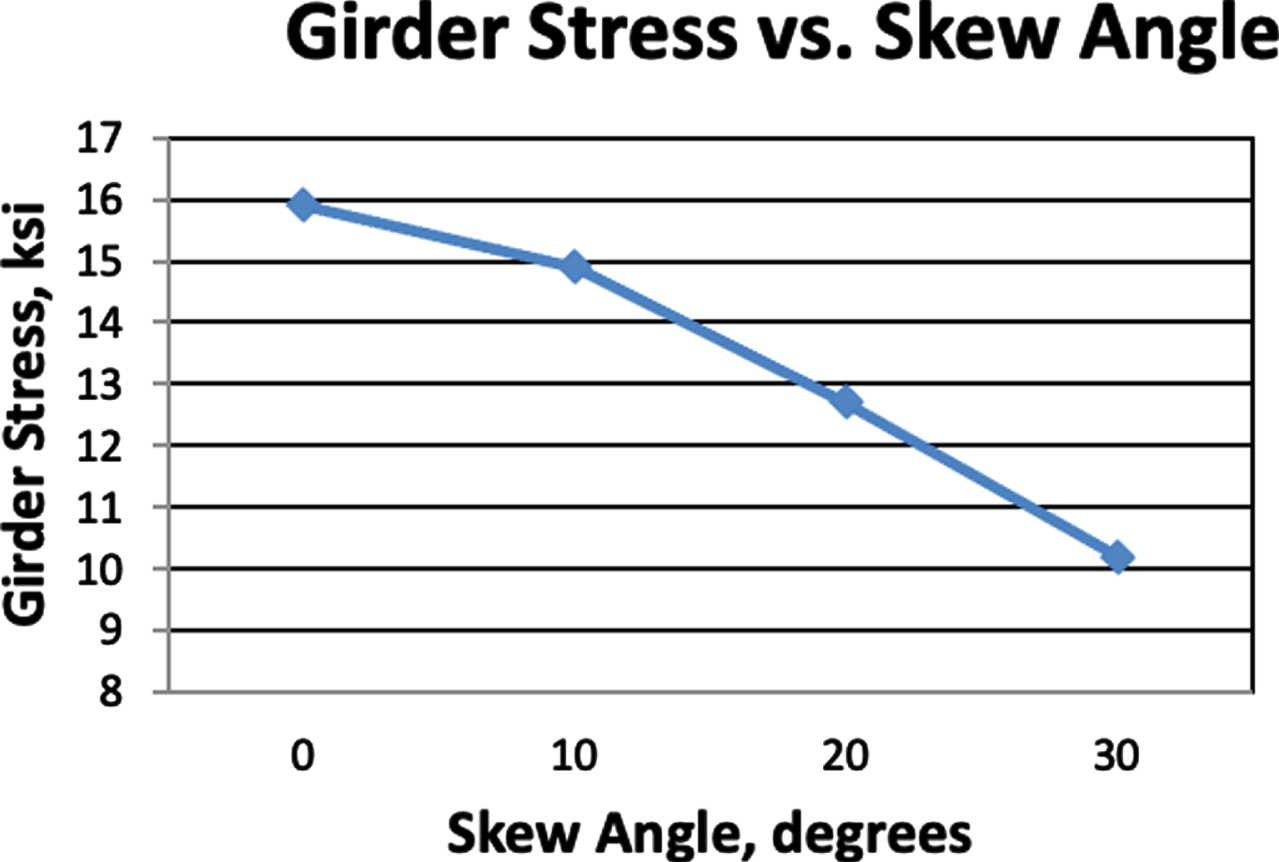
4.2.2Effect of skew
Figure 26 shows variation in girder stress due to change in skew angle. The girder stress decreased with the increase of the skew angle. This may be attributed to translation as well rotation at abutment walls due to skew resulting in less axial stress in the girders. The decrease in stresses was almost 36% from those of the base model with 0 skew.
Fig. 26
Variation of axial stress in girders versus skew angle.
4.2.3Backfill properties and presence of EPS
The backfill stiffness plays a significant role in girder stresses. As alternative backfill properties were changed from dense sand to medium sand, the girder stress decreased by approximately 13%. Expanded polystyrene (EPS) is used behind the abutments only by 10% of the States; however it is proven by many researchers that this material is beneficial in integral abutment bridges. When placing 3 inch EPS material between the abutment wall and the dense backfill, the girder stress decreased by approximately 18%. This observation was similar to those in the research done by Arenas et al [32].
4.3Analysis including protective measures
The effect of excavation some backfill prior to deck removal was analyzed by using the base model but without the EPS and the backfill. It is not necessary to remove a lot of the backfill and only few feet behind the abutment need to be excavated. When the backfill we removed the girder stresses dropped by approximately 17% to 30% depending on the pile orientation and skew. With stiffer piles and 0 skew the drop was approximately 30%. The effect of additional braces was also investigated. Reducing the spacing between braces increased the stress in the girder by about 5%. However, with added braces and reduced spacing between braces, the lateral buckling capacity of the girders may be increased to overcome the induced axial stresses in the girders. This study did not investigate the effectiveness of bracing in increasing the buckling capacities of the girders.
5Summary and conclusions
An overview of current practices in design and construction of integral abutments in the United States was presented. In addition, a review of the field monitoring studies conducted by several researchers was made and an analytical investigation of deck replacement in integral abutment was performed. The following observations and conclusions can be noted:
1. The review shows that many states use similar details for the connections between the superstructures girders and the abutment walls. Similar details are also used for the connection of piles to the abutment wall and their orientations. Limits on skew and total length vary between different states as well connections of the approach slab to the abutment wall. With more studies and research, the limits on skew and length can be made similar as well.
2. Several states reported problems with the joints of the approach slab and some cracking. Others reported cracking at the connection between the deck and wall and at wing wall locations in abutments with large skews. Problems were also reported in pavement fills for long IAB’s. More research is needed to study connections of deck and wing walls to abutment walls with large skews for better detailing and analysis methods.
3. Overall field monitoring did not show problems in IAB performance. Field data showed low earth pressures behind abutment wall to be somewhere between passive and at rest pressures. Reported wall rotations were generally small. Other data showed higher earth pressures and larger wall rotations. No yielding was reported in steel piles. Several researchers reported thermal movements in the field within range of predicted movements. There is a need for more field data on the effect of cyclic thermal loads on the backfill behind the abutment walls and on approach slab and pavement fill under the slab was well as data at connections in large skews.
4. There are no guidelines for deck rehabilitation of integral abutments. An analytical model showed that if the abutment walls can’t move or if the fill behind the abutment is too stiff, large axial stresses can develop in the girders. If some of backfill behind the abutment is not excavated prior to deck removal, they can buckle about their minor axis. Additional bracing of the girders before deck removal can protect against lateral buckling.
5. Since deck replacement happens after many years of service and by then the backfill has undergone a large number of expansion and contraction cycles, it is very important investigate girder stresses if the backfill closest to the abutment is not removed. It is well known that cyclic lateral loads on the backfill causes redistribution of granular particles making the backfill very stiff overtime (ratcheting of the backfill). More research and filed testing is needed to accurately estimate earth pressures behind abutment walls due to large number of expansion and contraction cycles.
Conflict of interest
Husam Najm is an Editorial Board Member of this journal but was not involved in the peer-review process nor had access to any information regarding its peer-review.
References
[1] | Design Guide for Bridges for Service Life. TRB Strategic Highway Research Program (SHRP 2) Report S2-R19A-RW-2; (2013) . |
[2] | Paraschos A , Amde A . A survey on the status of use, problems, and costs associated with Integral Abutment Bridges. Equipment World, Better Roads Publications. (2011) ;1–20. Available from: https://www.equipmentworld.com/better-roads/article/14957904/integral-abutment-bridges |
[3] | White H . Integral Abutment Bridges: Comparison Of Current Practice Between European Countries And The United States of America. Report FHWA/NY/SR-07/152, Transportation Research and Development Bureau, NYSDOT; (2007) . |
[4] | Frosch RJ , Lovell MD . Long-term Behavior of Integral Abutment Bridges. Publication FHWA/IN/JTRP-2011/16. Joint Transportation Research Program; 2011. DOI: 10.5703/1288284314640. |
[5] | VTrans Structural Section. Integral Abutment Bridge Design Guidelines.Vermont VTrans IAB Committee; 2009. |
[6] | NH DOT Bridge Design Manual. Chapter 6 Substructure, Section 6.4; 2016. |
[7] | Tabatabai H , Magbool H , Bahumdain A , Fu C . Criteria and Practices of Various States for the Design of Jointless and Integral Abutment Bridges. Third International Workshop on Jointless Bridges, Seattle, Washington; (2017) . |
[8] | Hag-Elsafi O , Kunin J . Monitoring and Structural Integrity Evaluation of Coeymans Creek Bridge for Superload Crossing. Transportation and Research Development Bureau, NYSDOT, Report FHWA/NY/SR-06/148; (2006) . |
[9] | IlesD. Integral Steel Bridges: A Summary of Current Practice in Design and Construction. SCI Publication P340; 2005. |
[10] | Kunin J , Alampalli S . Integral Abutment Bridges: Current Practice in the United States and Canada. Special Report 132, Transportation Research and Development Bureau, New York State Department of Transportation; 1999. |
[11] | Maruri R , Petro S . Integral Abutments and Jointless Bridges (IAJB) 2004 Survey Summary. Federal Highway Administration (FHWA)/Constructed Facilities Center (CFC) at West Virginia University; 2005. |
[12] | Russell H , Gerken L . Jointless bridges-the knowns and the unknowns. Concrete International. (1994) ;16: (4):44–8. |
[13] | Hoppe EJ , Gomez JP . Field Study of An Integral Backwall Bridge. Report FHWA/VA-97-R7 /VTRC 97-R7; 1997. |
[14] | NYSDOT. Bridge Details. Integral Abutments Typical Sections & Details, EB-10-024; 2010. |
[15] | MnDOT. Bridge Design Manual. Integral Abutments; 2016. |
[16] | Penn DOT. Standard Integral Abutment Details. BD 667M, Penn DOT; 2022. |
[17] | Illinois DOT. Integral and Semi-Integral Abutment Policies and Details. ABD Memo 19.8, Illinois State DOT; 2019. |
[18] | CDOT Bridge Design Manual. Section 11.3; 2022. |
[19] | Idaho DOT. Deck Placing Sequence. Bridge Design Manual, Article 17.5; 2021. |
[20] | Iowa DOT. Bridge Design Manual. Integral Abutments; 2022. |
[21] | Huntley S , Valsangkar A . Nine-Year Field-Monitoring Data from an Integral-Abutment Bridge. Innovations in Geotechnical Engineering. ASCE GSP 299; (2018) . |
[22] | Civjan SA , Kalayci E , Quinn BH , Brena SF , Allen CA . Observed integral abutment bridge substructure response. Engineering Structures. (2013) ;56: :1177–91. |
[23] | Kim W , Laman J . Seven-year field monitoring of four integral abutment bridges. ASCE Journal of Constructed Facilities. (2012) ;26: (1):54–64. |
[24] | Khodair Y , Hassiotis S . Analysis of soil–pile interaction in integral abutment. Computers and Geotechnics. (2005) ;32: :201–9. |
[25] | Alshibli K , Druckrey A , Voyiadjis G . Field Monitoring of Concrete Piles of an Integral Abutment Bridge. Springer International Publishing Advances in Analysis and Design of Deep Foundations, Sustainable Civil Infrastructures;. (2018) . DOI 10.1007/978-3-319-61642-1-18. |
[26] | Civjan SA , Breña S , Butler D , Corvo L . Field Monitoring of Integral Abutment Bridge in Massachusetts. Transportation Research Record: Journal of the Transportation Research Board, No.1892, TRB, National Research Council, Washington, D.C..; (2004) , pp. 160–9. |
[27] | LaFave J , Fahnestock L , Brambila G , Riddle J , Jarrett M , Svatora J , Wright B , An H . Integral Abutment Bridges under Thermal Loading: Field Monitoring and Analysis. Illinois Center of Transportation, Research Report No. FHWA-ICT-17-017. |
[28] | Lee J , Jeong Y , Kim W . Buckling behavior of steel girder in integral abutment bridges under thermal loadings in summer season during deck replacement. International Journal of Steel Structures. (2016) ;16: (4):1071–82. |
[29] | Midas Civil Software. MIDASoft Inc., NY, USA; 2020. |
[30] | SAP2000 v23 Ultimate. Structural Analysis Program. Computers and Structures, Inc., CA, USA; 2021. |
[31] | PD 6694-1:2011+A1:2020. Recommendations for the Design of Structures Subject to Traffic Loading to BS EN 1997-1:2004+A1:2013; BSI (British Standard International): London, UK; 2020. |
[32] | Arenas A , Filz G , Cousins T . Thermal response of integral abutment bridges with mechanically stabilized earth walls. VDOT, Report No. VCTIR 13-R7; 2013. |


