
The Effects of Cardiorespiratory and Motor Skill Fitness on Intrinsic Functional Connectivity of Neural Networks in Individuals with Parkinson’s Disease
Abstract
Background:
Studies in aging older adults have shown the positive association between cognition and exercise related fitness, particularly cardiorespiratory fitness. These reports have also demonstrated the association of high cardiorespiratory fitness, as well as other types of fitness, on the reversal of age-related decline in neural network connectivity, highlighting the potential role of fitness on age- and disease-related brain changes. While the clinical benefits of exercise are well-documented in Parkinson’s disease (PD), the extent to which cardiorespiratory fitness (assessed by estimated VO2max testing) or motor skill fitness (assessed by the Physical Performance Test (PPT)) affects neural network connectivity in PD remains to be investigated. The purpose of this study was to explore the hypothesis that higher fitness level is associated with an increase in the intrinsic network connectivity of cognitive networks commonly affected in PD.
Methods:
In this cross-sectional resting state fMRI, we used a multivariate statistical approach based on high-dimensional independent component analysis (ICA) to investigate the association between two independent fitness metrics (estimated VO2max and PPT) and resting state network connectivity.
Results:
We found that increased estimated VO2max was associated with increased within network connectivity in cognitive networks known to be impaired in PD, including those sub-serving memory and executive function. There was a similar trend for high levels of PPT to be associated with increased within network connectivity in distinct resting state networks. The between functional network connectivity analysis revealed that cardiorespiratory fitness was associated with increased functional connectivity between somatosensory motor network and several cognitive networks sub-serving memory, attention, and executive function.
Conclusion:
This study provides important empirical data supporting the potential association between two forms of fitness and multiple resting state networks impacting PD cognition. Linking fitness to circuit specific modulation of resting state network connectivity will help establish a neural basis for the positive effects of fitness and specific exercise modalities and provide a foundation to identify underlying mechanisms to promote repair.
LIST OF ABBREVIATIONS
BA | Brodmann’s area |
BG | basal ganglia |
BOLD | blood oxygenation level–dependent |
CAN | cognitive/attention network |
CEN | central executive network |
CRF | cardiorespiratory fitness |
DA | dopamine |
DAN | dorsal attention network |
DLPFC | dorsolateral prefrontal cortex |
DMN | default mode network |
EPI | echo-planar imaging |
FD | frame-wise displacement of head movement |
fMRI | functional magnetic resonance imaging |
FDR | false discovery rate |
FNC | functional network connectivity |
ICA | independent component analysis |
IC | independent component |
Iq | quality index |
MSF | motor skill fitness |
MCI | mild cognitive impairment |
MNI | Montreal Neurological Institute |
PD | Parkinson’s disease |
PPT | physical performance test |
ROI | region of interest |
rs-fMRI | resting state functional magnetic resonance imaging |
SRN | self-referential network |
RSN | resting state network |
SCN | subcortical network |
SMN | sensorimotor network |
SN | salience network |
VAN | ventral attention network |
VO2max | maximal oxygen uptake |
INTRODUCTION
Parkinson’s disease (PD) is a chronic, progressive neurodegenerative disorder that is the result of dopaminergic cell death and dopamine (DA) depletion. Loss of DA in turn leads to decreased synaptic connectivity and dysfunction in a number of cortical and subcortical networks resulting in motor impairment such as bradykinesia, rigidity, and gait and balance instability, as well as cognitive impairment. Cognitive impairment may include deficits in executive function, attention, visual spatial, and memory domains which often progresses to dementia and poor quality of life. Although the etiology for cognitive change in PD is not fully elucidated, studies in PD have used resting state functional magnetic resonance imaging (rs-fMRI) and either seed-based or independent component analysis (ICA) to explore functional connectivity. These approaches have generally demonstrated loss of functional connectivity within the cognitive networks, including the default mode network (DMN), central executive network (CEN), dorsal attention network (DAN), and the salience network (SN) [1, 2]. In addition, changes have been reported between these well-established cognitive networks and also the sensorimotor network (SMN) and the subcortical network (SCN) [3]. While DA therapy has generally been shown to be helpful for motor deficits in PD, currently there is no effective treatment for cognitive impairment. Identifying interventions that promote neuroplasticity and repair of cognitive networks may lead to new therapeutic strategies for improving cognitive function and slowing disease progression.
In the last decade, studies in aging older adults have supported the potential role that exercise may play in promoting neuroplasticity and improving cognitive performance [4]. These studies highlight the relationship between exercise related cardiorespiratory fitness (CRF) and attenuation of age-related brain atrophy as well as improved functional network connectivity in brain regions sub-serving cognitive performance [5, 6]. In particular, CRF has been shown to improve functional network connectivity of cortical networks associated with age-related impairment including the DMN and DAN. Taken together, studies in aging have supported the idea that CRF may be associated with improved connectivity of brain regions that are particularly vulnerable to the adverse effects of aging and/or areas at risk for neurological diseases [5, 7, 8]. The gold standard metric for measuring CRF is VO2max and is defined as the capacity of the heart and lungs to deliver oxygenated blood to working muscles and brain. Since individuals with PD may experience fatigue during a traditional maximal exercise fitness assessment, a sub-maximal exercise test can be used to predict an estimated VO2max [9]. In addition to CRF, exercise programs, particularly those incorporating aspects of skill including gait and balance practice may lead to improved motor skill fitness (MSF). While less is known about the role of motor skill fitness and its impact on neuroplasticity, a few studies in aging older adults have also supported the association of high levels of motor skill fitness with increased cognitive network activation and neural efficiency in brain regions also affected in aging [7, 8]. MSF is defined as physical activity training that incorporates aspects of complex motor performance including balance, agility, coordination, power, and speed, and higher levels of cognitive processing [10]. The Physical Performance Test (PPT) is a standardized test used to assess motor skill fitness that incorporates aspects of complex, fine and gross motor function, including coordination, balance, agility, and speed [10]. Importantly, fitness level (both CRF and MSF) may represent a means to determine exercise benefits that occur as a consequence of a variety of exercise types that engage either high aerobic practice such as running and swimming, and/or motor skill practice such as Tai Chi and yoga.
While the benefits of cardiorespiratory fitness and motor skill fitness have been shown in age-related changes in functional connectivity within the brain, there remain significant gaps in knowledge in understanding the role that CRF, and other types of fitness including MSF, may play in enhancing cognitive and motor network connectivity known to be dysfunctional in PD. Pre-clinical exercise studies in rodent models of PD have supported that different forms of exercise (aerobic versus skill-based) can lead to changes in synaptic and network connectivity as displayed through increased cortical and subcortical synaptogenesis, hippocampal neurogenesis, and changes in regional cerebral blood flow [11–15]. In addition, a few studies that have examined executive function, a domain commonly affected in PD, support the potential benefits of aerobic exercise and related improvement in cardiorespiratory fitness on cognitive circuits impaired in PD [16, 17].
In this study, we sought to explore the hypothesis that higher fitness level is associated with an increase in the intrinsic network connectivity of cognitive and motor networks commonly affected in PD. Using rs-fMRI and a cross-sectional study design, we examined the association between cardiorespiratory fitness (estimated by the VO2max test) and motor skill fitness (assessed with the PPT) on both within network connectivity, measured by network’s spatial map intensity, and between network connectivity, measured by functional network connectivity (FNC) [18] of intrinsic resting state networks (RSNs). Understanding the effects of fitness on intrinsic brain network connectivity is crucial to better elucidate effective interventional strategies important for brain repair in PD.
For this study we recruited PD individuals who were physically active and routinely exercising based on self-report. We used blood oxygenation level-dependent (BOLD) rs-fMRI and an ICA-based approach to extract a select number of cognitive and motor RSNs implicated in PD, [1–3, 19]. We used high-dimensional spatial ICA to obtain more refined neural networks, and applied a multivariate, data-driven method that takes into account the relationships between all voxels across the brain with appropriate dimension reduction of response variables to decrease risk of spurious findings [20], and also to provide better sensitivity to detect subtle differences between PD individuals [21, 22].
MATERIALS AND METHODS
PD individuals and clinical assessments
The PD individuals for this cross-sectional study included 24 physically active, non-demented and ambulatory individuals with PD (15 males/9 females, mean age 65.5 years, range 51 –88 years) with Hoehn and Yahr equal to II and years of diagnosis 4.9 + /- 3.3. Current physical activity levels were determined through self-report using the Global Physical Activity Questionnaire (GPAQ) [23]. Subjects provided written informed consent to participate in the study, which was approved by the Institutional Review Boards at the University of Southern California, and the University of California at Los Angeles. All PD individuals met the UK Parkinson’s Disease Brain Bank criteria for the diagnosis of idiopathic PD [24]. Inclusion and exclusion criteria were determined through chart review, participant interview, and physical and neurological screening performed by a board-certified neurologist with movement disorder expertise (GP). Inclusion criteria for participation included: (i) willing and able to provide informed consent; (ii) confirmed diagnosis of idiopathic PD based on the UK Brain Bank criteria; (iii) age 30 to 85, (iv) medically eligible for MRI imaging; (v) Hoehn and Yahr scale score of less than III [25]; (vi) stable PD medications for 3 months; and (vii) English as their primary language. Exclusion criteria for participation included: (i) electrically, magnetically, or mechanically activated implant (such as cardiac pacemakers or intracerebral respiratory clip); (ii) metal in any part of the body including metal injury to the eye; (iii) dementia based on performance or the inability to perform instrumental activities of daily living; (iv) other neurological diseases such as severe head trauma or stroke; (v) symptomatic orthostatic hypotension at the screening visit; and (vi) taking anticholinesterase inhibitors or anticholinergic medication. All subject assessments for the study were performed while on dopaminergic replacement medication (e.g., levodopa and DA agonists) and during the “on-state” period [26].
Fitness measurements
Cardiorespiratory fitness was determined using the Ebbeling Single Stage Treadmill Walking Test, which is a validated submaximal fitness test that can be used to estimate VO2max in adult subjects [27]. Briefly, subjects first underwent a 4-minute warm-up, walking at a brisk, but comfortable pace starting at 2.0 mph and increasing by 0.2 mph increments every 30 secs, and not to exceed 4.5 mph, and at 0%grade, eliciting a heart rate within 50 to 70%of age-predicted maximum. This was followed by a single testing stage of treadmill walking for 4 minutes at 5%grade. The steady state heart rate was determined from the average of the final 30 seconds at 5%grade and the tester was careful to avoid extremes of their heart rate range [28]. The equation to estimate VO2max (ml kg–1 min–1) from a single stage 4-minute, 5%grade submaximal treadmill test is as follows: estimated VO2max = 15.1 + 21.8*SPEED (mph) –0.327*HEART RATE (bpm) –0.263*SPEED*AGE (yr)+0.00504*HEART RATE*AGE+5.98*SEX (0 =female; 1 = male) [27]. The estimated VO2max values were adjusted for the effects of age and sex in order to avoid multicollinearity issues. Estimated VO2max was expressed as oxygen capacity per kilogram of body weight over time (mL/kg/min) [29], and is a value at which oxygen uptake volume (VO2) plateaus or increases minimally despite increased workload on the graded exercise test.
The Physical Performance Test (PPT) was used as an objective evaluation of an individual’s level of motor skill fitness [10]. PPT is a standardized, functional test with nine items that include upper limb fine and coarse motor functions, balance, coordination, and endurance, that requires timed performance in most items [10]. The PPT also simulates activities of daily living of various degrees of difficulty (writing, dressing, eating, stair climbing, walking, turning, bending, and lifting), and has been found to correlate well with the degree of geriatric disability, loss of independence, nursing home placement, and early mortality [30, 31]. The total score for the nine-item PPT ranges from 0 to 36 with lower scores indicating poorer physical performance. The PPT scores were assessed at a single point in time and adjusted for the effects of age and sex in order to avoid multicollinearity issues.
MRI acquisition
Structural MRI and rs-fMRI data were acquired on a Siemens 3T Trio (N = 11) and Prisma systems (N = 13) (Siemens, Erlangen, Germany) using a 12-channel head coil at the UCLA Staglin IMHRO Center for Cognitive Neuroscience. The functional T2*-weighted images were obtained with echo-planar imaging (EPI) sequence (repetition time = 2000 ms, echo time = 30 ms, field of view = 220 mm, image matrix = 64×64, flip angle = 77°, slice thickness =4 mm, interslice gap = 0.5 mm, 30 axial slices acq-uired in sequential ascending order). Head motion was minimized using padding. PD individuals were asked to lay still, not to think about anything in particular, and passively look at the fixation cross during the 5.13 min (154 volumes) rs-fMRI scanning. The first four images were automatically discarded by the scanner to allow for the establishment of steady-state magnetization. High-resolution T1-weighted magnetization-prepared ra-pid-gradient echo (MP-RAGE) structural images were also acquired for functional image registration and normalization (repetition time = 2300 ms, echo time = 2.91 ms, inversion time = 0.9 ms, flip angle = 9°, number of excitations = 1, resolution =256×256, slice thickness = 1.2 mm, 176 slices).
Image quality assessment and preprocessing
Upon completion of a scan, the imaging data were anonymized, and transferred to an offline workstation. Image data quality was assessed using the MRI Quality Control (MRIQC) software package [32]. Several of the quantitative image quality metrics from the quality assessment protocol of Human Connectomes Project [33] were calculated to ensure quality and consistency of images obtained in this aged population. They included metrics for (i) artifacts (AFNI’s outlier ratio and quality index, head motion-related framewise displacement [FD], and ghost to signal ratio), (ii) temporal quality (DVARS, global correlation, and temporal signal to noise ratio and, (iii) structural quality (Shannon’s entropy focus criterion, foreground-background energy ratio, and static signal to noise ratio). Upon passing the quality control (see supplementary material), images were preprocessed using the Statistical Parametric Mapping (SPM) software package (Wellcome Department of Cognitive Neurology, London, UK, version 12b) running under the MATLAB environment (Mathworks Inc., Natick, MA, USA, release 16a). In the first step, EPI images were realigned to correct head motions using rigid body transformations. Subsequently, images were corrected for acquisition time delay between different slices by temporally realigning the time series of each voxel to acquisition of the first slice. We chose to perform spatial realignment first to minimize the effect of inter-slice movement [34]. Spatial realignment parameters were computed by estimating the translational displacements along X, Y, and Z axes as well as the rotational displacements of pitch, yaw, and roll. Subjects’ spatial realignment parameters did not exceed 2 mm (translational) or 1.5° (rotational) in relation to the reference. However, considering the potential influence of even small degrees of head motions on the rs-fMRI connectivity analysis [35], we calculated FD, an index of volume-to-volume changes in head position [36] and used it as a nuisance covariate in our analysis. Next, EPI and structural scans were co-registered and normalized to the standard template in Montreal Neurological Institute (MNI) space using the linear (affine transformation) followed by nonlinear deformations defined by linear combinations of 3D discrete cosine transform basis functions implemented in SPM, resampled to 2×2×2 mm3 isotropic voxels, and spatially smoothed using a Gaussian filter with a full-width half maximum smoothness [FWHM] of 4 mm [37]. A relatively small smoothing kernel size was used to allow detection of RSN especially those containing refined subcortical structures. To further improve the accuracy and test-retest reliability of ICA, data intensity was normalized by dividing each voxel time course by its average intensity and converting data to percent signal change units [20].
High-dimensional independent component analysis (ICA)
Following a validated ICA analysis framework for rs-fMRI [1], we applied a relatively high model order ICA to the preprocessed data using the Group ICA of fMRI Toolbox (GIFT)-toolbox (Medical Image Analysis Lab, University of New Mexico; version 4.0b). Specifically, we chose 75-IC model order because recent ICA rs-fMRI studies have shown that such high-order ICA models yield more refined and particularly robust decomposition of components [38, 39]. A two-step data reduction approach using principal component analysis was carried out prior to performing the group ICA [40]. First, subject-specific data reduction principal component analysis with a standard economy-size decomposition retained 100 principal components. Next, subject reduced data were concatenated across time, and group data reduction retained 75 principal components using the expectation–maximization algorithm. The choice of retaining more principal components at the first reduction step was based on a previous study that showed more principal components at the first reduction step stabilized subsequent back-reconstruction and could better account for greater subject-specific variance [41]. Spatial ICA was subsequently performed using the infomax algorithm [42]. To ensure stability of estimation, ICA algorithm was repeated 100 times in ICASSO and the agglomerative hierarchical clustering with average-linkage criterion was used for calculating the cluster quality index (Iq) of the estimated ICs [43]. In the last step, subject-specific spatial maps and their corresponding time courses were back-reconstructed using the dual regression analysis technique (GICA-3 algorithm in GIFT), and scaled to Z-scores [41].
Resting state network (RSN) identification and feature extraction
We used a methodical approach to identify RSNs from noise or physiological artifacts. First, Iq measures from 100 ICASSO runs were examined to validate the reliability and stability of IC decomposition. ICs with Iq value below 0.8 were excluded from further analysis as lower Iq indicates that the likelihood that the IC is randomly produced is higher [44]. In the second identification step, the spatial correlations of IC spatial maps with a priori probabilistic maps of cerebrospinal fluid, white matter, and gray matter in MNI space (using templates provided in SPM12b) were calculated. Components that showed low correlations with gray matter, or high correlations with cerebrospinal fluid or white matter were excluded from analysis. Artifactual components were further identified based on (i) their motion-related spatial maps (e.g., rings near the borders of the brain), (ii) special confinement of their peak activation to cerebrospinal fluid, proximity to known cerebral blood vessels, or to regions susceptible to physiological pulsations with mixed high frequency power [45]. Identification of remaining ICs was carried out by regression-based spatial sorting to reference standard network templates from Allen and colleagues [20] as well as knowledge from established brain networks described in previous studies [20, 46–50]. Components averaged across all subjects were calculated with a one-sample t-test in SPM12b and thresholded at family-wise error rate (FWE-corrected p < 0.05). Component anatomical extents in MNI space, and corresponding Brodmann’s areas (BA) and peak activations were determined using the cytoarchitectonic probability maps as implemented in the SPM Anatomy Toolbox [51, 52].
Following the methodological approach explained above, we identified a subset of 18 surviving components as RSNs compatible with those obtained in previous studies that used high-dimensional ICA [20, 38, 39, 46, 48, 50, 53, 54]. These 18 RSNs fell into one of the following four standard rs-fMRI network categories:
• Sensorimotor Network (SMN) consisting of IC 19 (bilateral ventral somatosensory), IC 46 (right dorsal somatosensory), IC 48 (left dorsal somatosensory), IC 54 (bilateral motor), and IC 62 (supramarginal gyrus).
• Subcortical Network (SCN) consisting of IC 24 (hippocampus) and IC 35 (basal ganglia; BG, and also included thalamus and amygdala).
• Default-Mode Network (DMN) consisting of IC 49 (posterior DMN), and IC 63 (containing both anterior and posterior DMN).
• Cognitive and Attention Network (CAN) consisting of IC 2 (self-referential network (SRN) comprising ventromedial prefrontal cortex), IC 17 (bilateral DLPFC part of the Central Executive Network (CEN)), IC 40 (right hemisphere of CEN), IC 45 (left hemisphere of CEN), IC 47 (dorsal attention network (DAN)), IC 32 (ventral attention network (VAN)), IC 50 (salience network (SN) including bilateral insula), IC 53 (second SN comprising the frontoinsular regions), and IC 75 (third SN with dorsal anterior cingulate and insular cortices).
Spatial maps of these networks are shown in Fig. 1. Detailed information of component spatial maps including the rs-fMRI defined networks, anatomical regions, t-value of maxima, and MNI coordinates are listed in Table 1.
Fig. 1
Spatial maps of eighteen RSNs that were entered into the MANCOVA analysis. RSNs are grouped by their anatomical and functional properties into the sensorimotor networks (SMN; ICs 19, 46 48, 54, and 62), the subcortical networks (SCN; ICs 24, and 35), the default-mode networks (DMN; ICs 49, and 63), and the cognitive and attention networks (CAN; ICs 2, 17, 32, 40, 45, 47, 50, 53, and 75). Spatial maps are plotted as t-statistics, thresholded at FWE-corrected p-value of 0.05 and displayed in neurological convention (right is right). The scale bar, red-to-yellow, represents t-values of the strength of each voxel’s connectivity to the overall component time series. See Table 1 for MNI coordinates of maxima and corresponding t-values for each RSN. L, left; R, right.
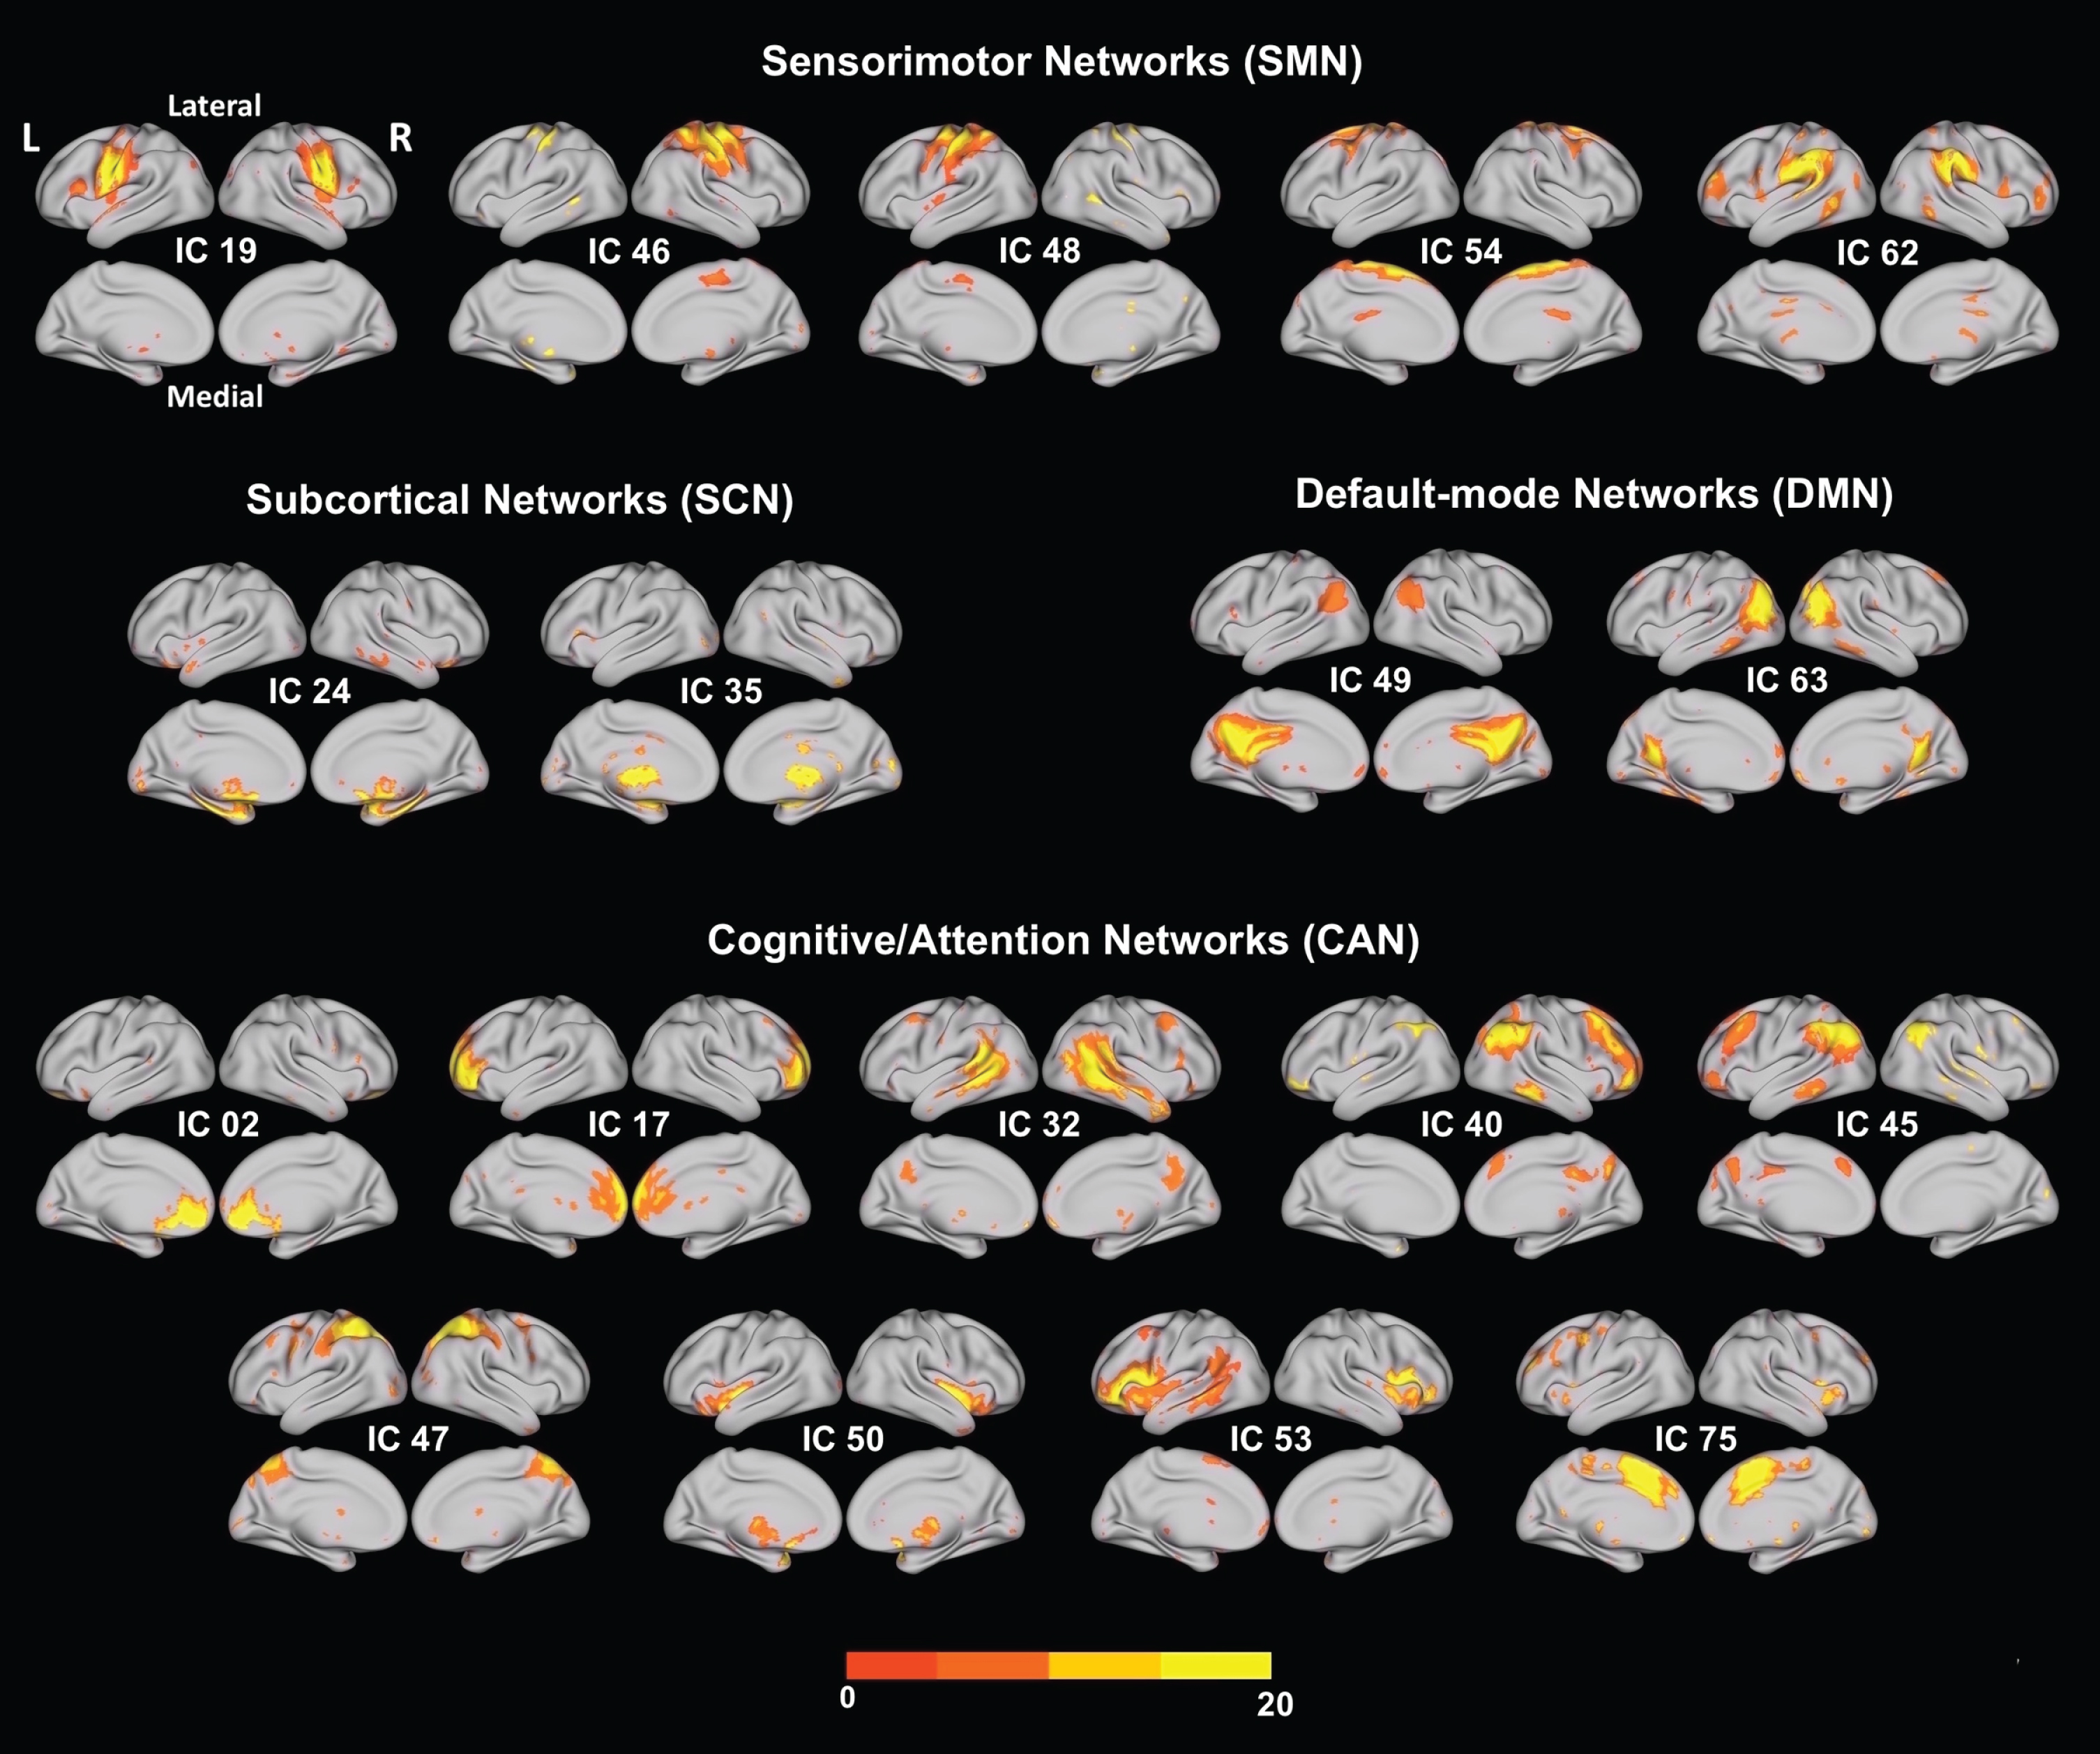
Table 1
Peak coordinates of 18 selected RSNs. The MNI (Montreal Neurological Institute) coordinates show the coordinates of the peak voxels with negative x coordinates refer to left hemisphere activations. Brodmann’s area as indicated by the cytoarchitectonic maximum probability map using the SPM-Anatomy toolbox developed by Eickhoff, et al. (2005) [49]. The quality index (Iq) associated with each component is listed in parentheses next to the component number
| IC | Brain region | Cluster size (voxels) | tmax | MNI coordinates | Cytoarchitectonic Brodmann area (Probability, if available) | |||||
| x | y | z | ||||||||
| Sensorimotor Networks (SMN) | ||||||||||
| IC 19 (0.98) | Left Postcentral Gyrus | 759 | 13.87 | –60 | –14 | 34 | Area 1 (40%) | |||
| Ventral | Area 3b (40%) | |||||||||
| Somatosensory Network | Left Precentral Gyrus | same cluster | 11.84 | –54 | –6 | 34 | Area 4p (50%) | |||
| Area 6 (30%) | ||||||||||
| Right Postcentral Gyrus | 649 | 11.86 | 50 | –12 | 38 | Area 3b (60%) | ||||
| Area 4p (50%) | ||||||||||
| Right Precentral Gyrus | same cluster | 11.14 | 54 | –6 | 38 | Area 6 (40%) | ||||
| Area 4p (40%) | ||||||||||
| IC 46 (0.98) | Right Postcentral Gyrus | 2493 | 14.41 | 42 | –20 | 50 | Area 3b (90%) | |||
| Right Dorsal | Area 4a (40%) | |||||||||
| Somatosensory Network | Right Precentral Gyrus | same cluster | 13.35 | 40 | –24 | 62 | Area 1 (40%) | |||
| Area 6 (40%) | ||||||||||
| IC 48 (0.96) | Left Postcentral Gyrus | 2225 | 15.29 | –36 | –40 | 56 | Area 2 (50%) | |||
| Left Dorsal Somatosensory | Area SPL (7PC) (40%) | |||||||||
| Network | Left Precentral Gyrus | same cluster | 14.40 | –32 | –26 | 56 | Area 4p (40%) | |||
| Area 4a (40%) | ||||||||||
| IC 54 (0.98) | Left SMA | 4412 | 17.93 | 0 | –12 | 62 | Area 6 (90%) | |||
| Motor Cortex | Area 4a (10%) | |||||||||
| Right SMA | same cluster | 13.93 | 8 | 2 | 72 | Area 6 (80%) | ||||
| Left Precentral Gyrus | same cluster | 12.86 | –36 | 0 | 58 | |||||
| IC 62 (0.93) | Left Supramarginal Gyrus | 1145 | 13.28 | –58 | –28 | 34 | IPC (PFt) (60%) | |||
| Supramarginal | IPC (PF) (40%) | |||||||||
| Gyrus | Right Supramarginal Gyrus | 556 | 12.85 | 58 | –34 | 32 | IPC (PF) (80%) | |||
| IPC (PFcm) (40%) | ||||||||||
| Subcortical Networks (SCN) | ||||||||||
| IC 24 (0.98) | Left ParaHippocampal Gyrus | 361 | 8.73 | –18 | –10 | –22 | Hipp (SUB) (60%) | |||
| Hippocampal | Hipp (HATA) (40%) | |||||||||
| Hipp (CA) (40%) | ||||||||||
| Right Hippocampus | 160 | 10.40 | 20 | –10 | –18 | Hipp (SUB) (50%) | ||||
| Amyg (SF) (50%) | ||||||||||
| Hipp (CA) (50%) | ||||||||||
| Right ParaHippocampal Gyrus | same cluster | 7.74 | 20 | –8 | –26 | Hipp (EC) (60%) | ||||
| Hipp (SUB) (40%) | ||||||||||
| Hipp (CA) (30%) | ||||||||||
| IC 35 (0.98) | Right Putamen | 2107 | 12.90 | 28 | 6 | –2 | ||||
| Basal Ganglia (BG) | Left Amygdala | same cluster | 12.46 | –22 | 0 | –16 | Amyg (SF) (70%) | |||
| Left Putamen | same cluster | 12.34 | –24 | 6 | 0 | |||||
| Left Thalamus | same cluster | 12.00 | –6 | –20 | 6 | |||||
| Right Thalamus | same cluster | 11.57 | 8 | –20 | 4 | |||||
| Right Amygdala | same cluster | 11.56 | 26 | 2 | –16 | Amyg (SF) (30%) | ||||
| Default-Mode Networks (DMN) | ||||||||||
| IC 49 (0.97) | Right Precuneus | 3530 | 18.94 | 4 | –52 | 24 | ||||
| Posterior Default Mode Network (DMN) | Left Posterior Cingulate Cortex | same cluster | 18.83 | –2 | –44 | 32 | ||||
| Left Angular Gyrus | 366 | 11.24 | –46 | –62 | 26 | IPC (PGp) (30%) | ||||
| Left Inferior Parietal Lobule | same cluster | 8.44 | –30 | –56 | 40 | hIP3 (50%) | ||||
| Right Angular Gyrus | 346 | 12.53 | 44 | –64 | 32 | IPC (PGp) (70%) | ||||
| IC 63 (0.96) | Right Precuneus | 541 | 14.00 | 2 | –58 | 22 | ||||
| DMN | Left Precuneus | same cluster | 12.31 | –4 | –54 | 14 | ||||
| Left Middle Occipital Gyrus | 491 | 10.64 | –42 | –72 | 24 | IPC (PGp) (60%) | ||||
| Left Middle Temporal Gyrus | same cluster | 10.49 | –44 | –68 | 22 | IPC (PGp) (50%) | ||||
| Right Middle Temporal Gyrus | 396 | 10.04 | 46 | –62 | 22 | IPC (PGp) (50%) | ||||
| Cognitive and Attention Network (CAN) | ||||||||||
| IC 2 (0.98) | Left Anterior Cingulate Cortex | 1310 | 13.59 | –4 | 44 | –2 | ||||
| Self-Referential Network (SRN) | Left Mid Orbital Gyrus | same cluster | 13.39 | –2 | 48 | –6 | ||||
| Right Anterior Cingulate Cortex | same cluster | 12.09 | 8 | 34 | 10 | |||||
| IC 17 (0.98) | Right Anterior Cingulate Cortex | 4850 | 13.39 | 6 | 46 | 8 | ||||
| Central | Left Superior Medial Gyrus | same cluster | 12.94 | –2 | 54 | 10 | ||||
| Executive Network (CEN) | Right Superior Frontal Gyrus | same cluster | 12.06 | 24 | 58 | 14 | ||||
| IC 32 (0.98) | Right Middle Temporal Gyrus | 1933 | 14.72 | 52 | –20 | –12 | ||||
| Ventral Attention | Right Angular Gyrus | same cluster | 12.55 | 56 | –56 | 24 | IPC (PGa) (70%) | |||
| Network (VAN) | Left Middle Temporal Gyrus | 987 | 13.48 | –58 | –38 | –2 | ||||
| Left SupraMarginal Gyrus | same cluster | 10.17 | –52 | –52 | 26 | IPC (PGa) (40%) | ||||
| IPC (PF) (30%) | ||||||||||
| Right Precuneus | 174 | 10.33 | 6 | –58 | 46 | SPL (7A) (40%) | ||||
| SPL (7P) (10%) | ||||||||||
| IC 40 (0.98) | Right Inferior Parietal Lobule | 1395 | 12.44 | 46 | –54 | 40 | IPC (PGa) (40%) | |||
| Right CEN | hIP1 (10%) | |||||||||
| Right Inferior Frontal Gyrus (p. Triangularis) | 277 | 11.70 | 44 | 28 | 28 | |||||
| Right Middle Frontal Gyrus | same cluster | 10.15 | 46 | 36 | 22 | |||||
| Right Middle Frontal Gyrus | 271 | 11.62 | 42 | 50 | 0 | |||||
| Right Inferior Frontal Gyrus (p. Orbitalis) | same cluster | 10.48 | 38 | 40 | –18 | |||||
| Right Superior Frontal Gyrus | same cluster | 9.36 | 24 | 54 | 2 | |||||
| IC 45 (0.97) | Left Inferior Parietal Lobule | 1645 | 14.29 | –32 | –72 | 40 | IPC (PGp) (20%) | |||
| Left CEN | Left Angular Gyrus | same cluster | 12.18 | –36 | –60 | 42 | hIP1 (30%) | |||
| Left Middle Frontal Gyrus | 188 | 11.30 | –44 | 12 | 46 | |||||
| Right Inferior Parietal Lobule | 98 | 10.16 | 46 | –56 | 46 | IPC (PGa) (40%) | ||||
| IC 47 (0.97) | Right Inferior Parietal Lobule | 5056 | 14.47 | 50 | –36 | 50 | IPC (PFt) (40%) | |||
| Dorsal Attention Network (DAN) | IPC (PFm) (30%) | |||||||||
| Right Superior Parietal Lobule | same cluster | 14.41 | 28 | –60 | 50 | hIP3 (30%) | ||||
| SPL (7A) (20%) | ||||||||||
| Right Angular Gyrus | same cluster | 12.88 | 30 | –60 | 44 | hIP3 (30%) | ||||
| Right SupraMarginal Gyrus | same cluster | 12.49 | 44 | –36 | 42 | hIP2 (30%) | ||||
| IPC (PF) (20%) | ||||||||||
| IC 50 (0.97) | Left Insula Lobe | 252 | 8.22 | –32 | 18 | –14 | ||||
| Salience Network (SN) | Right Insula Lobe | 235 | 9.76 | 46 | 2 | –4 | OP 4 (10%) | |||
| IC 53 (0.98) | Left Inferior Frontal Gyrus (p. Opercularis) | 1874 | 13.61 | –48 | 14 | 14 | Area 44 (40%) | |||
| SN | ||||||||||
| Left Insula Lobe | same cluster | 10.81 | –36 | 8 | 6 | Area 44 (10%) | ||||
| Right Inferior Frontal Gyrus (p. Opercularis) | 292 | 10.62 | 50 | 18 | 6 | Area 44 (40%) | ||||
| Area 45 (30%) | ||||||||||
| Right Insula Lobe | same cluster | 8.23 | 40 | 6 | 0 | |||||
| Left Middle Temporal Gyrus | 193 | 9.91 | –42 | –52 | 14 | |||||
| Left Superior Temporal Gyrus | same cluster | 8.54 | –56 | –48 | 18 | IPC (PGa) (20%) | ||||
| IC 75 (0.96) | Left Anterior Cingulate Cortex | 2316 | 14.67 | –8 | 22 | 26 | ||||
| SN | Left Insula Lobe | 83 | 10.67 | –46 | 10 | –8 | ||||
| Right Insula Lobe | 50 | 9.05 | 44 | 16 | –8 | |||||
Multivariate statistical analysis
We used multivariate analysis of covariance (MANCOVA), which is a multivariate analytical method comparable to a standard ANOVA F-test, followed by a post hoc univariate analysis. The MANCOVAN toolbox in GIFT software package was used to discover which spatial map voxels (related to the connectivity within a network) and FNC correlations (related to the connectivity between networks) were uniquely associated with each of our two variables of interest (i.e., MSF measured by PPT and CRF measured by estimated VO2max), while statistically controlling for the effects of covariates including age, sex and years of education. Head movement estimates (i.e., FD) were included as covariates of no interest (nuisance predictors). To minimize the potential disproportionate influence of covariates on the MANCOVA model fit, log transformations were applied to continuous covariates as recommended in [20]. To optimize for the large dimensions of the voxelwise ICA outcome measures (spatial maps and FNC correlations) and reduce the number of statistical tests performed, backward multivariate stepwise regressions (implemented as mStepwise in GIFT MANCOVAN toolbox) were performed for each response matrix separately. For more details on the multivariate analysis please refer to [20]. This approach first utilizes MANCOVA to determine contributions of each fitness parameter (CRF and MSF levels) on the ICs. Then, univariate tests corrected for multiple comparisons are carried out on a reduced design matrix, which reduces the number of statistical tests performed, to highlight the direction and strength of the relationship between fitness levels and ICA measures (spatial map intensity and FNC correlations).
Spatial map intensity statistical analysis
Following the multivariate analysis, univariate tests were performed on the reduced model applied to the original (not-dimension reduced) feature matrix to identify the effects of predictors (i.e. PPT and estimated VO2max) on RSN spatial map intensities as detailed in [20]. In brief, partial correlation coefficients for each predictor were calculated from linear regressions with the feature matrix as a dependent variable while covarying out the effects of the other predictors (the remaining regressors in the model). Results from the univariate tests for RSN spatial map intensities were corrected for multiple comparisons using the false discovery rate (FDR) [55].
Functional network connectivity statistical analysis
In addition to the network spatial features, we also considered network temporal features, namely FNC. FNC serves as a correlational value that measures the functional connectivity (i.e., temporal dependencies) among RSN time courses [20]. FNC was computed as the Pearson’s correlation coefficient between RSN time course pairs as detailed in [18]. In brief, subject-specific time courses were detrended and de-spiked, and a fifth-order Butterworth band-pass filter was used to filter time courses with cut-off frequencies at [0.01 –0.15] Hz. FNC correlation values were normalized using Fisher r-to-z transformation, i.e., z = atanh(r), where r is the pairwise correlation value between RSN time courses. Results from the univariate tests for FNC were corrected with a strict control of false positives using the Bonferroni correction threshold of 0.003 (0.05/18).
RESULTS
Demographic and clinical characteristics
PD individuals’ demographic and clinical information is summarized in Table 2. Our PD cohort had an average age of 65.5 years±9.6 years and were approximately 4 to 5 years on average from disease onset (average disease duration of 4.9±3.3 years), the average UPDRS part III was 24.6±9.0, all 24 PD individuals were Hoehn and Yahr stage II. The average adjusted (for age and sex) motor skill fitness was PPT = 27.88±3.24 (in terms of total scores), and cardiorespiratory fitness was estimated VO2max = 32.18±3.08 ml kg–1 min–1.
Table 2
centerline Demographic information and clinical characteristics of PD individuals
| Variable | PD subjects |
| n | 24 |
| Age | 65.5 (9.6) |
| Sex, M/F | 15/9 |
| Years of diagnosis | 4.9 (3.3) |
| UPDRS Part III | 24.58 (8.99) |
| Hoehn & Yahr | 24 Stage II |
| Education, years | 17.0 (2.1) |
| Handedness, R/L | 23/1 |
| Estimated VO2max | 32.18 (3.08) |
| PPT | 27.88 (3.24) |
Data are means (SD) unless noted. PD = Par-kinson’s disease, Estimated VO2max = Estimated Maximal oxygen uptake, PPT = Physical Performance Test total scores.
Multivariate analysis
A multivariate model selection strategy [20] was applied to determine the association of fitness (CRF, MSF) on ICA outcome measures (RSN spatial map intensity and FNC). The associations of each fitness type on the variability of the spatial map intensities are shown in Supplementary Figure 1.
Univariate analysis
Association of fitness measurements (Cardiorespiratory and Motor Skill) with RSN spatial map intensities in PD
We found an association between higher fitness levels and a number of RSNs that included cognitive-attention (CAN), default-mode (DMN), sensorimotor (SMN), and subcortical (SCN) networks. The univariate analysis demonstrated a significant association between estimated VO2max (CRF) and a trend with PPT (MSF) measures and distinct RSN spatial map intensities detailed below.
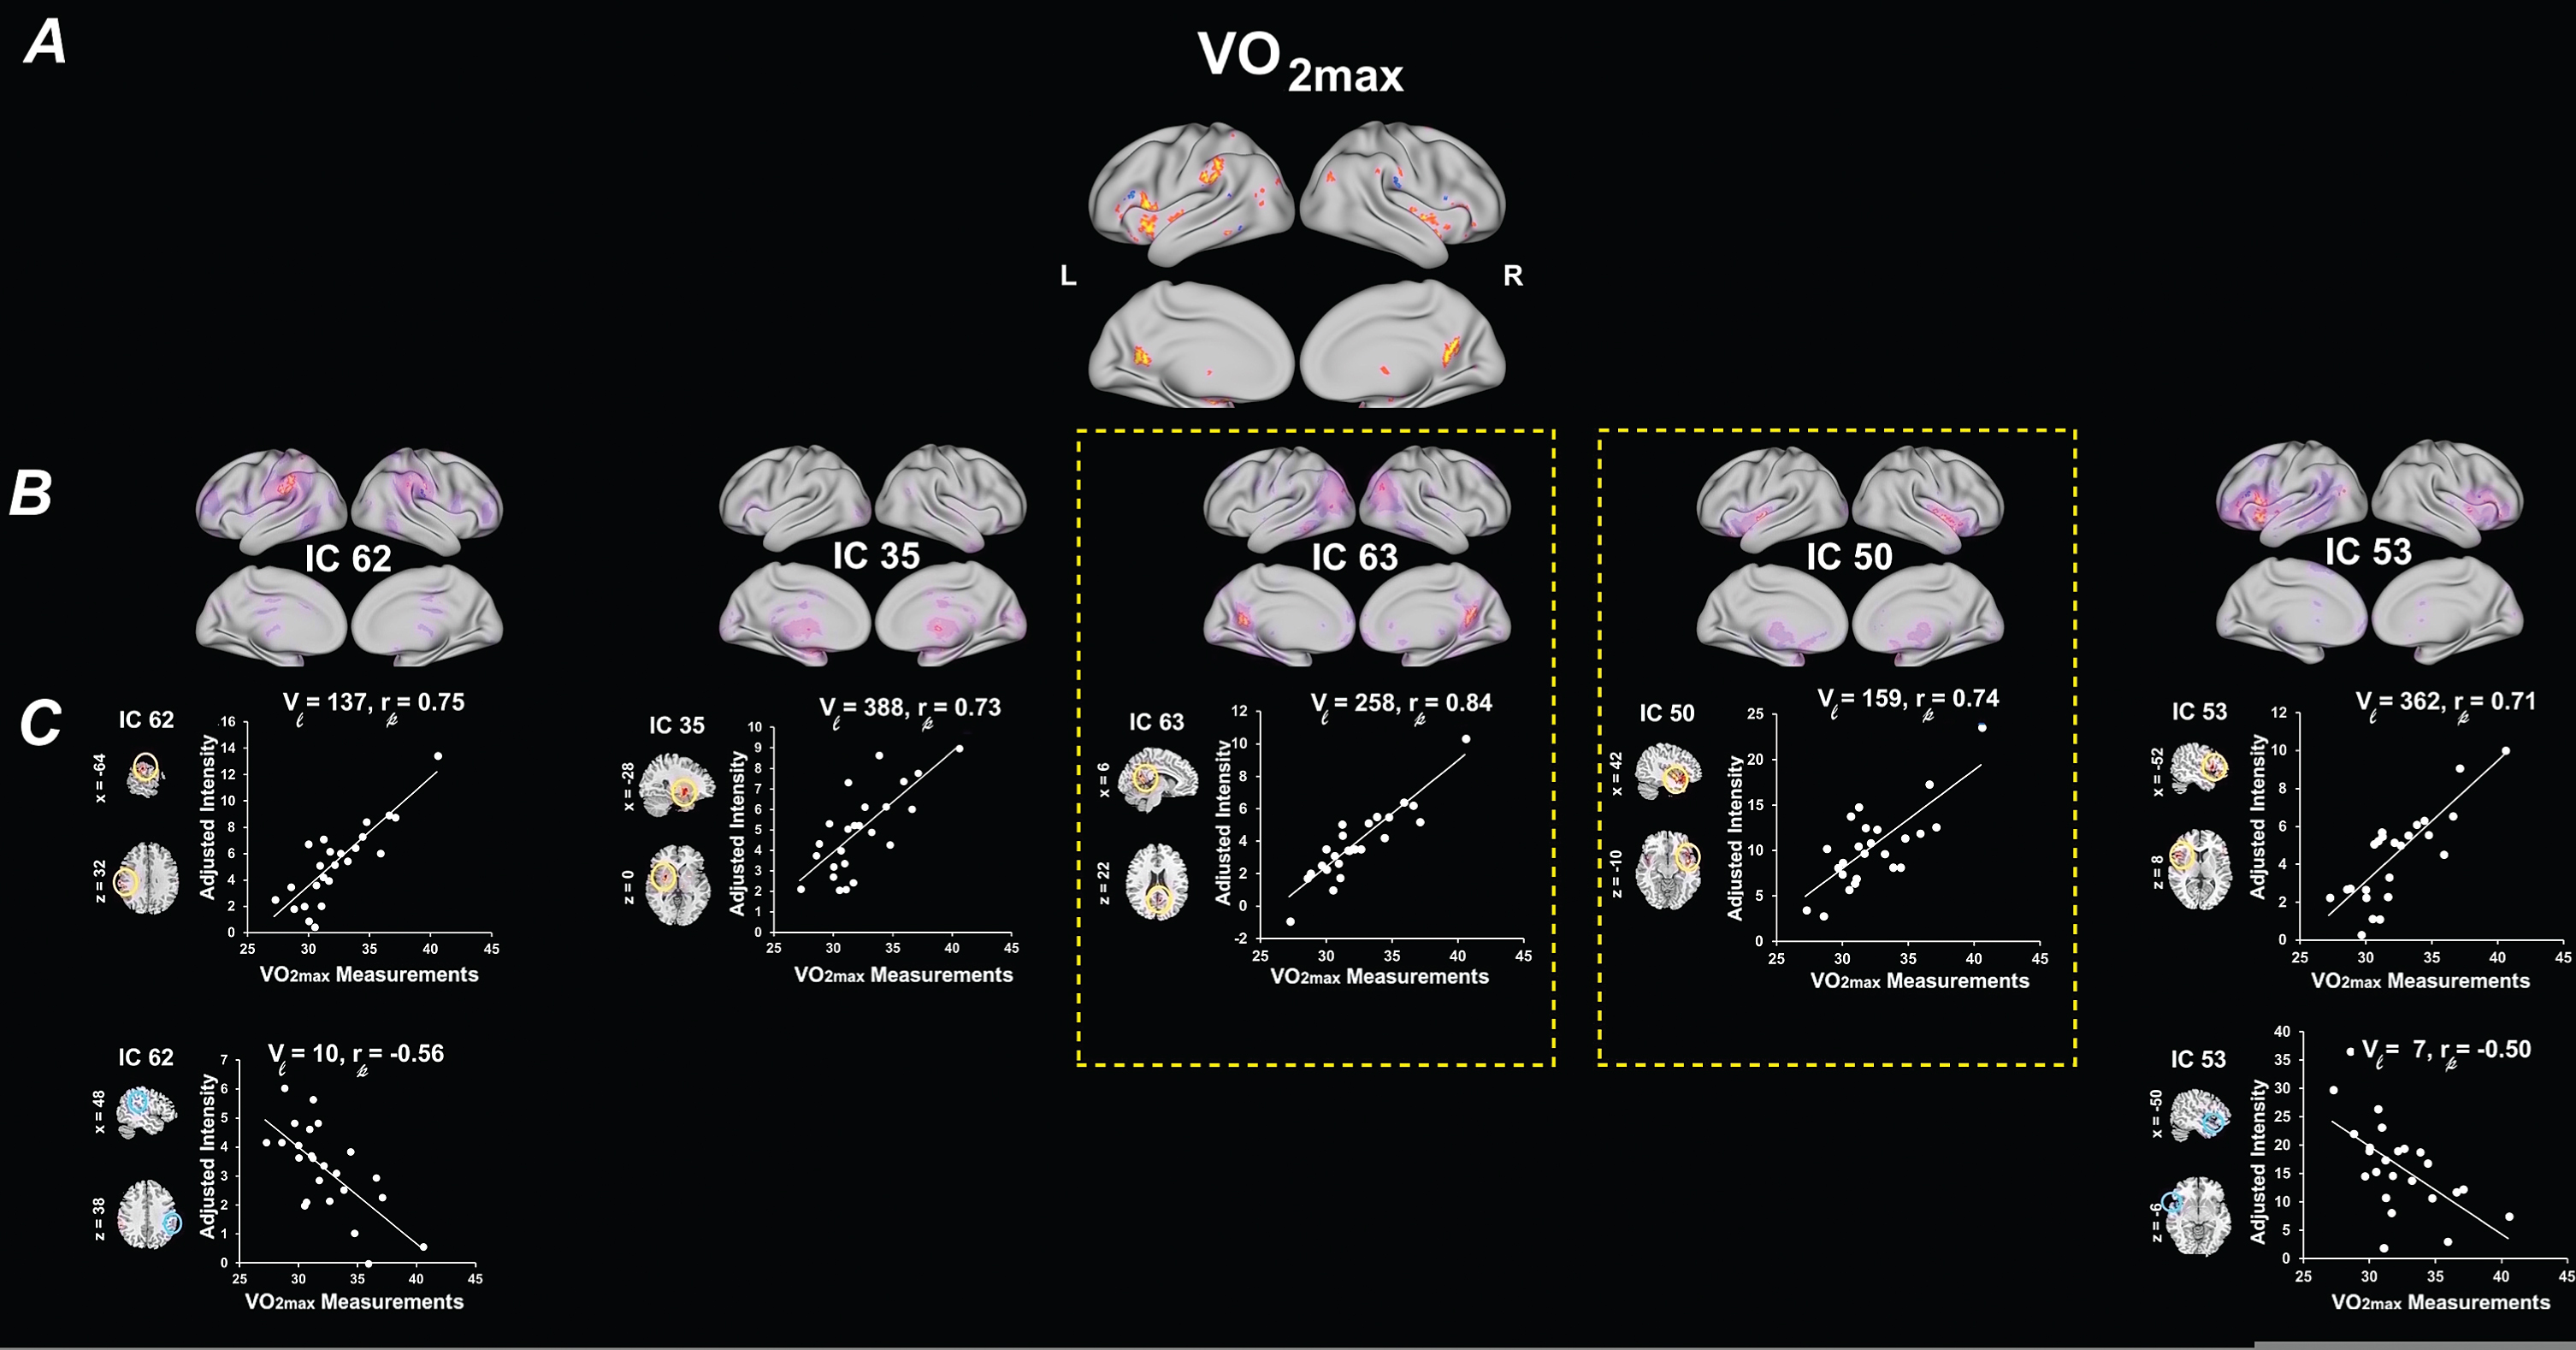
Regarding the role of CRF, we found that increased estimated VO2max was significantly associated with several spatial map intensities of distinct RSNs (Table 3A). Specifically, estimated VO2max was significantly associated with increased RSN spatial map intensities with IC 63 (DMN; Peak activation cluster: bilateral precuneus), and with IC 50 (CAN/SN; Peak: right insula). These associations were the only ones to survive the stringent FDR correction for multiple comparisons. The remaining associations show a trend for significance (p < 0.03, FDR corrected). Estimated VO2max was positively associated with increased RSN spatial map intensities of IC 35 (SCN/BG; Peak: left putamen and left amygdala), IC 62 (SMN/supramarginal; Peak: left supramarginal gyrus), and IC 53 (CAN/SN; Peak: left inferior frontal gyrus). Negative associations were found with RSN spatial map intensities of IC 62 (SMN; Peak: right supramarginal gyrus), and IC 53 (CAN/SN; Peak: left temporal pole). Figure 2 illustrates the regions of RSN spatial map whose intensities were associated with estimated VO2max. Associations were visualized by plotting the log of the p value with the sign of the corresponding t-statistic (i.e.,–sign(t)log10(p)) to provide information on both the directionality and the statistical strength of the result.
Table 3
Summary of univariate test results for spatial map intensities. Peak coordinates of largest significant clusters from univariate tests on RSN spatial map intensities are listed here
| IC RSN | Average t-value | Average p-value | Brain region of the largest cluster | Cluster size (voxels) | Cluster tmax | Cluster MNI coordinates* | Cytoarchitectonic Brodmann area (Probability, if available) | ||
| x | y | z | |||||||
| A. Estimated VO2max | |||||||||
| IC 62 | 2.72 | 0.020 | Left Supramarginal Gyrus | 137 (+) | 3.89 | –64 | –26 | 32 | Area PFt (IPL) (46%) |
| Area PFop (IPL) (32%) | |||||||||
| –2.37 | 0.031 | Right Supramarginal Gyrus | 10 (-) | 1.88 | 48 | –32 | 38 | Area PFt (IPL) (45%) | |
| Area 2 (24%) | |||||||||
| IC 35 | 2.80 | 0.018 | Left Putamen | 388 (+) | 4.20 | –28 | 4 | 0 | |
| Left Amygdala | same cluster | 2.90 | –28 | –6 | 16 | Amygdala (AStr) (39%) | |||
| Amygdala (LB) (9%) | |||||||||
| IC 63 | 2.94 | 0.017* * | Right Precuneus | 258 (+) | 3.92 | 6 | –56 | 22 | |
| IC 50 | 2.86 | 0.019 ** | Right Insula Lobe | 159 (+) | 5.78 | 42 | 4 | –10 | |
| IC 53 | 2.69 | 0.022 | Left IFG (p. Opercularis) | 362 (+) | 3.74 | –52 | 14 | 8 | Area 44 (58%) |
| Area 45 (14%) | |||||||||
| –2.37 | 0.031 | Left Temporal Pole | 7 (-) | 1.93 | –50 | 14 | –6 | Area 45 (9%) | |
| B. PPT | |||||||||
| IC 2 | 2.44 | 0.028 | Left Anterior Cingulate Cortex | 102 (+) | 3.08 | –2 | 46 | 2 | |
| IC 47 | 2.52 | 0.026 | Right Angular Gyrus | 579 (+) | 3.49 | 28 | –52 | 44 | Area hIP3 (IPS) (23%) |
| Area hIP1 (IPS) (20%) | |||||||||
*The Cluster MNI (Montreal Neurological Institute) coordinates of the peak voxels with negative x coordinates refer to left hemisphere activations. Brodmann’s area as indicated by the cytoarchitectonic maximum probability map using the SPM-Anatomy toolbox developed by Eickhoff et al. (2005) [51]. **Represents RSN spatial map clusters that survived multiple comparison corrections (Bonferroni corrected, p≤0.003). IC RSN, independent component resting state network; VO2max, maximal oxygen uptake; PPT, Physical Performance Test total scores.
Fig. 2
Univariate results summarizing the effects of estimated VO2max on RSN spatial map intensities. (A) 3D brain map depicting the composite renderings of significant effects of estimated VO2max over all RSNs are displayed as the –sign(t)log10(p) (p < 0.05, uncorrected). (B) Significant effects of estimated VO2max are shown in individual RSNs overlaid on their corresponding RSN template (purple) and displayed as the –sign(t)log10(p) (p < 0.05, uncorrected). (C) Scatter plots show the estimated VO2max effects for the largest significant cluster in each affected RSN (indicated by yellow or blue circles on the RSN maps shown in representative orthogonal slices with corresponding MNI coordinates) with the number of contributing voxels (Vl), and the partial correlation coefficient (rp). RSNs of significance are highlighted by yellow boxes with dashed lines. See Table 3 for the associated statistics, anatomical extent, the t-value of the maxima, and corresponding MNI coordinates for the largest significant clusters. Estimated VO2max, maximal oxygen uptake.; SMN, sensorimotor networks; SCN, subcortical networks; DMN, default-mode networks; CAN, cognitive and attention networks; L, left; R, right.
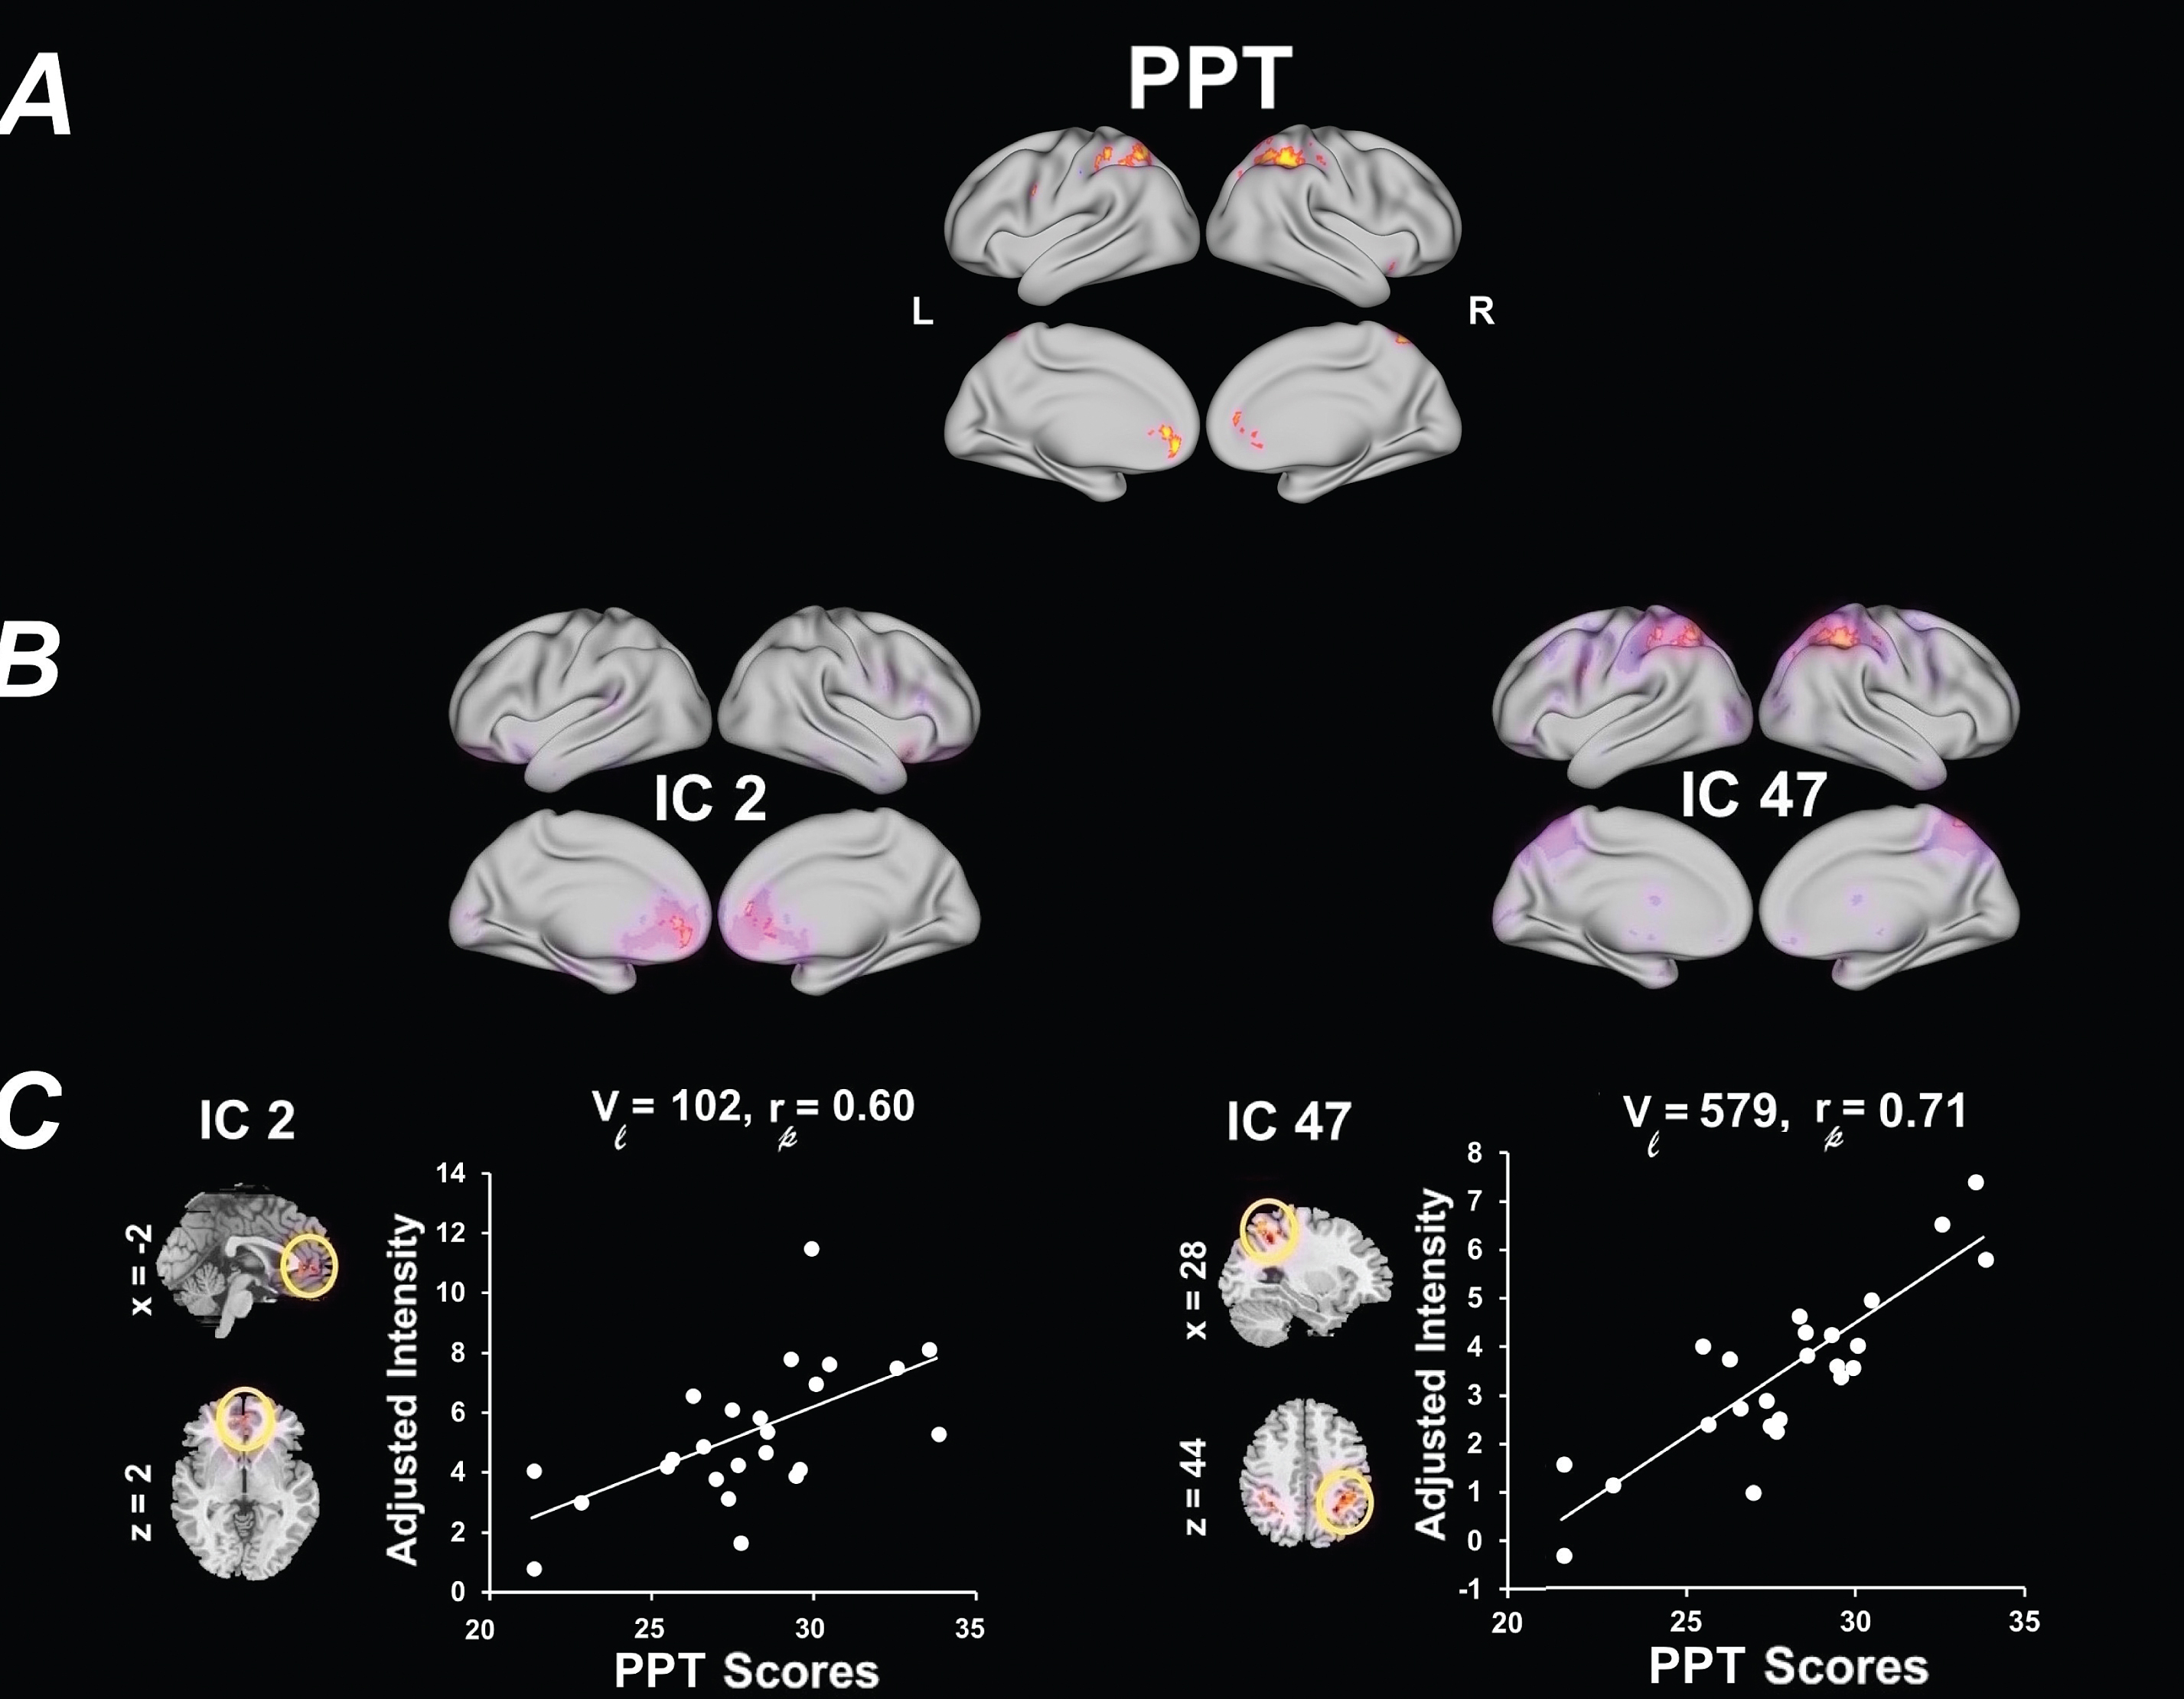
There were no significant associations between PPT and RSN after stringent FDR multiple comparisons (Fig. 3). However, there was a trend for higher levels of PPT and increased RSN spatial map intensities with IC 2 (CAN/SRN; Peak: bilateral anterior cingulate), and IC 47 (CAN/DAN; Peak: right angular gyrus) (p < .05, FDR uncorrected) (Table 3B). Figure 3 illustrates the regions of RSN spatial map whose intensities were associated with PPT. Associations were visualized by plotting the log of the p value with the sign of the corresponding t-statistic (i.e.,–sign(t)log10(p)) to provide information on both the directionality and the statistical strength of the result.
Fig. 3
Univariate results summarizing the effects of PPT on RSN spatial map intensities. (A) 3D brain map depicting the composite renderings of significant effects of PPT over all RSNs are displayed as the –sign(t)log10(p) (p < 0.05, uncorrected). (B) Significant effects of PPT are shown in individual RSNs overlaid on their corresponding RSN template (purple) and displayed as the –sign(t)log10(p) (p < 0.05, uncorrected). (C) Scatter plots show the PPT effects for the largest significant cluster in each affected RSN (indicated by yellow or blue circles on the RSN maps shown in representative orthogonal slices with corresponding MNI coordinates) with the number of contributing voxels (Vl), and the partial correlation coefficient (rp). See Table 3 for the associated statistics, anatomical extent, the t-value of the maxima, and corresponding MNI coordinates for the largest significant clusters. PPT, Physical Performance Test total scores; SMN, sensorimotor networks; SCN, subcortical networks; DMN, default-mode networks; CAN, cognitive and attention networks; L, left; R, right.
Functional network connectivity (FNC) analysis
Detailed information about the FNC pairs, and effect sizes are summarized in Table 4. Connectograms in Fig. 4 illustrate all of the pairwise FNC results for both fitness types measured (p < 0.05, Bonferroni uncorrected). The only FNC correlation that survived stringent multiple comparison correction (p < 0.003, Bonferroni corrected) was an association between estimated VO2max and an increase in FNC between IC 48 (SMN; Peak: left dorsal somatosensory) and IC 49 (DMN; rp =0.71, p = 0.001). The remaining correlations showed a trend towards significance. This included a trend between increased estimated VO2max and increased pairwise FNC between RSNs IC 48 (SMN; Peak: left dorsal somatosensory) and the following networks: IC 63 (DMN; rp = 0.59, p = 0.007), IC 40 (CAN/CEN; rp = 0.59, p = 0.008), and IC 32 (CAN/VAN) (rp = 0.55, p = 0.015). Estimated VO2max also showed a tend towards a positive association in pairwise FNC between IC 19 (SMN; Peak: bilateral ventral somatosensory) and the following networks: IC 47 (CAN/DAN; rp = 0.54, p = 0.018), IC 40 (CAN/CEN; rp = 0.52, p = 0.022) and IC 63 (DMN; rp = 0.49, p = 0.034). Estimated VO2max was also associated with an increase in pairwise FNC between IC 53 (CAN/SN) and the following networks: IC 54 (SMN; Peak: motor cortex; rp = 0.56, p = 0.012), IC 24 (SCN; Peak: hippocampus; rp = 0.47, p = 0.041) and IC 46 (SMN; Peak: right dorsal somatosensory) (rp = 0.46, p = 0.050). Finally, estimated VO2max was associated with an increase in FNC between IC 63 (DMN) and IC 45 (CAN/CEN) (rp = 0.49, p = 0.032). Alternatively, increased estimated VO2max was negatively associated with pairwise FNC between IC 62 (SMN/supramarginal) and the following networks: IC 63 (DMN; rp = –0.50, p = 0.030), and IC 17 (CAN/CEN; rp = –0.47, p = 0.041).
Table 4
Summary of univariate test results for functional network connectivity (FNC). FNC components that were significantly affected by covariates of interests are listed here (p-value < 0.05, uncorrected)
| Measurement | Positive IC pairs | rp | t-value | p-value | Negative IC pairs | rp | t-value | p-value |
| PPT | IC 62 –IC 17 | 0.55 | 2.71 | 0.015 | IC 24 –IC 35 | –0.53 | –2.61 | 0.018 |
| IC 47 –IC 53 | 0.56 | 2.79 | 0.012 | IC 32 –IC 45 | –0.48 | –2.27 | 0.037 | |
| VO2max | IC 46 –IC 53 | 0.46 | 2.11 | 0.050 | IC 62 –IC 17 | –0.50 | –2.36 | 0.030 |
| IC 24 –IC 53 | 0.47 | 2.21 | 0.041 | IC 62 –IC 63 | –0.47 | –2.21 | 0.041 | |
| IC 19 –IC 63 | 0.49 | 2.31 | 0.034 | |||||
| IC 63 –IC 45 | 0.49 | 2.33 | 0.032 | |||||
| IC 19 –IC 40 | 0.52 | 2.52 | 0.022 | |||||
| IC 19 –IC 47 | 0.54 | 2.62 | 0.018 | |||||
| IC 48 –IC 32 | 0.55 | 2.70 | 0.015 | |||||
| IC 54 –IC 53 | 0.56 | 2.80 | 0.012 | |||||
| IC 48 –IC 40 | 0.59 | 2.98 | 0.008* | |||||
| IC 48 –IC 63 | 0.59 | 3.04 | 0.007* | |||||
| IC 48 –IC 49 | 0.71 | 4.23 | 0.001** |
Estimated VO2max, maximal oxygen uptake; PPT, Physical Performance Test total scores; rp, partial correlation coefficient. **Represents FNC correlations that are significant (Bonferroni corrected, p≤0.003). *Represents FNC correlations that show trend to significance (Bonferroni corrected, p≤0.009).
Fig. 4
Differences in FNC correlations related to fitness measures. In each connectogram, FNC correlations are shown using bezier curves. RSN within the same categories are shown in the same color. FNC, functional network connectivity; PPT, Physical Performance Test total scores; estimated VO2max, maximal oxygen uptake.; SMN, sensorimotor networks; SCN, subcortical networks; DMN, default-mode networks; CAN, cognitive and attention networks. The “*” represents a statistically significant FNC after FDR corrections for multiple comparisons.
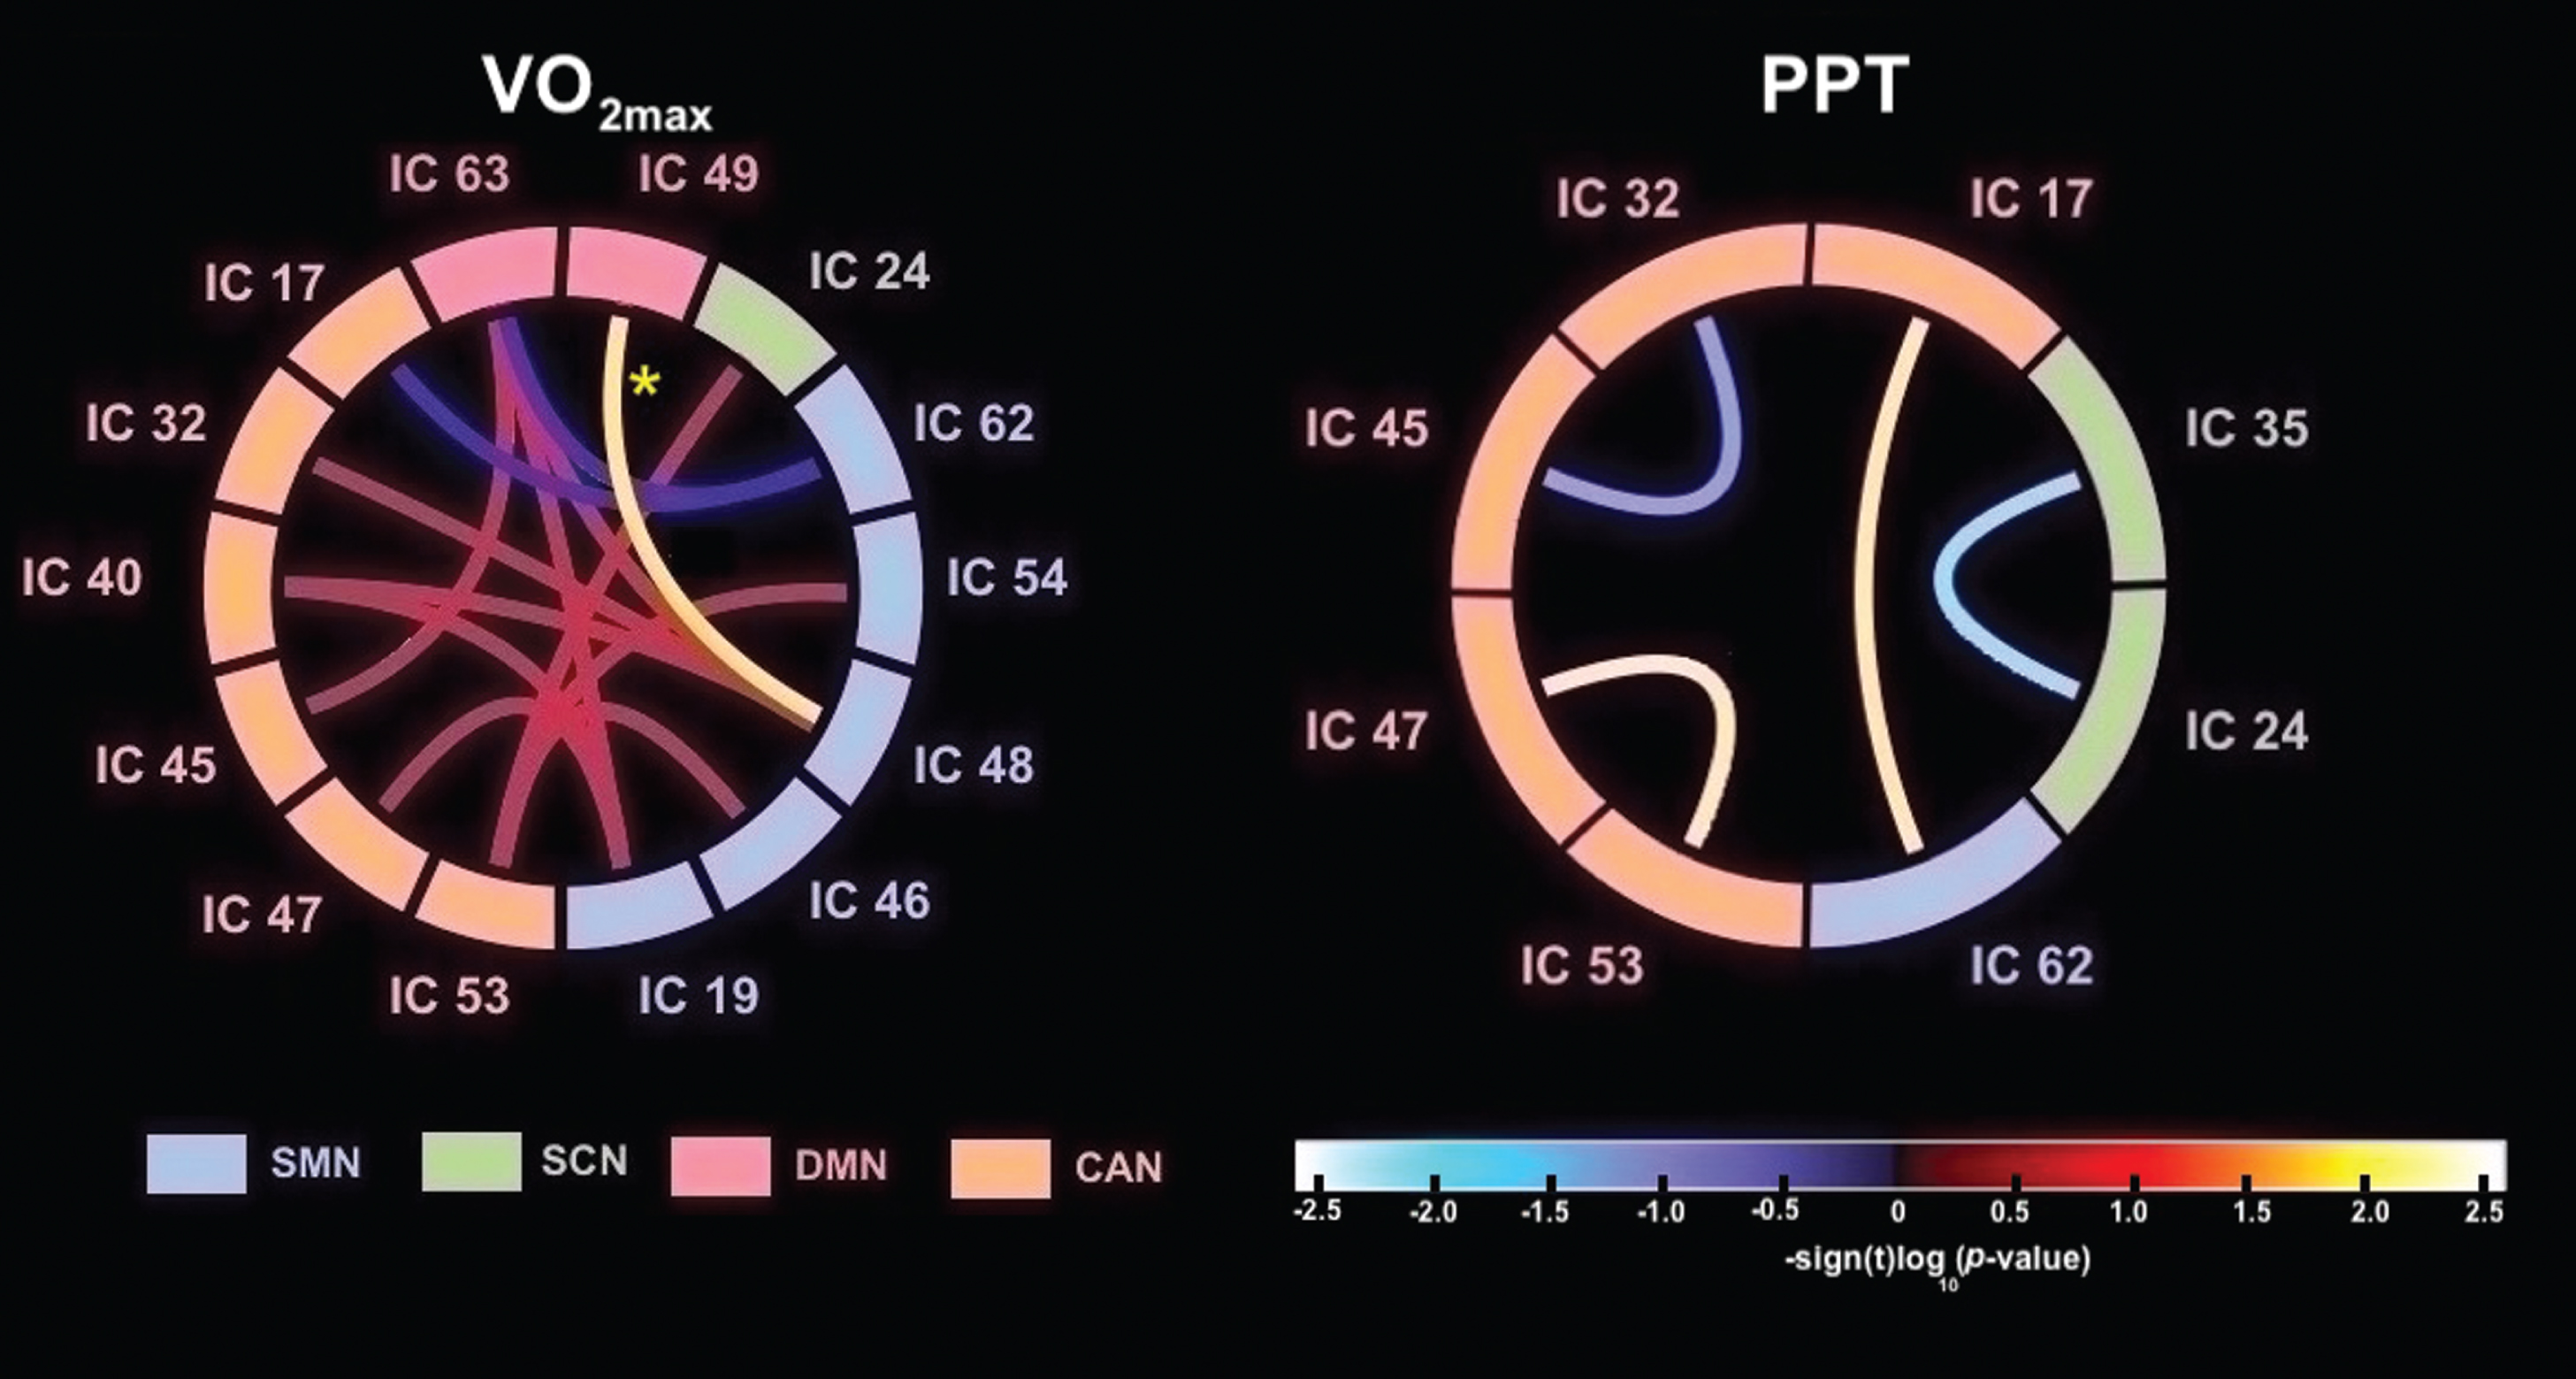
No FNC correlation with PPT survived stringent multiple comparison corrections (p < 0.003, Bonferroni corrected). A trend towards significance was seen between increased PPT and a positive pairwise FNC between IC 62 (SMN; Peak: supramarginal gyrus) and IC 17 (CAN/CEN) (rp = 0.55, p = 0.015) and between IC 47 (CAN/DAN) and IC 53 (CAN/SN) (rp = 0.56, p = 0.012). Alternatively, increased PPT was associated with reduced pairwise FNC between IC 24 (SCN; Peak: hippocampus) and IC 35 (SCN; Peak: basal ganglia) (rp = –0.53, p = 0.018), and between IC 32 (CAN/VAN) and IC 45 (CAN/CEN) (rp = –0.48, p = 0.037).
DISCUSSION
Impact of fitness on resting state networks
Cardiorespiratory (CRF) and motor skill fitness (MSF) have both been shown to be directly associated with improved cognitive structure and function in brain regions adversely affected by aging [5, 7]. These findings support the hypothesis that fitness may have its greatest impact on regions of the brain impacted in aging and neurological disease and that fitness level may serve as a valuable exercise parameter to predict behavioral benefit. There are a number of cognitive networks known to be affected in PD as shown by fMRI studies including central executive (CEN), default mode network (DMN), dorsal attentional network (DAN) and salience network (SN) [2, 56]. While exercise has been shown to be beneficial in PD, the relationship between fitness and functional brain connectivity in these PD affected networks remains to be elucidated. In this cross-sectional rs-fMRI study we examined the relationship between two types of fitness parameters (CRF and MSF) and within network and between network functional network connectivity (FNC) of established networks subserving cognitive function and impacted in PD. Our main significant findings were that increased CRF (estimated V02max) was associated with increased within network connectivity in cognitive networks subserving memory and executive function in the posterior DMN and salience network (SN), respectively, which are known to be impaired in PD. We also found trends for an association between MSF (assessed by the PPT) and increased within network connectivity in cognitive networks subserving executive function and attention in the self-referential network (SRN) and dorsal attention network (DAN), respectively. Taken together, fitness, particularly CRF is associated with cognitive networks impacted in PD.
Impact of cardiorespiratory fitness (CRF) on resting state networks
Specifically, we observed a significant association between increased CRF and increased within network spatial map intensity of the posterior DMN, localized in the bilateral precuneus, and between increased CRF and increased within network spatial map intensity of the SN, with peak activation localized in the right insula. Cross-sectional studies in older adults have also demonstrated a significant association between CRF and increased network connectivity within the DMN and SN [5, 57]. Both the DMN and SN have been shown to play an important role in memory, and to be disrupted in older adults and in PD [58, 59]. The DMN comprises the hippocampal formation, medial temporal cortices, posterior cingulate cortex (PCC) and adjacent midline parietal areas, the precuneus, and the medial prefrontal cortex (mPFC) [60]. The DMN is implicated in memory consolidation, self-referential thought, mind-wandering, and autobiographical memory [61]. Aberrant functional connectivity of the DMN has been implicated in a number of neurodegenerative disorders including Alzheimer’s disease (AD), frontotemporal dementia, Huntington’s disease, and PD [62–66]. In PD, the DMN has emerged as a key functional substrate for cognitive deficits [67, 68]. Recent meta-analysis studies of the resting state functional connectivity in PD similarly found alterations in regions connected to the DMN [63]. The decreased functional connectivity of DMN during resting state in PD compared with healthy controls is reported to be significantly correlated with cognitive parameters [64, 69, 70] but not with disease duration, motor impairment, or levodopa therapy [70]. The SN has been widely studied in rs-fMRI data since it has been found to be a large scale network that mediates switching between the DMN and CEN, and to segregate the most relevant among internal and extra-personal stimuli in order to guide behavior [71]. Within the SN, the anterior insula, anterior to mid-cingulate cortex, middle frontal gyrus, and inferior parietal lobule support episodic memory encoding and retrieval by directing attention to relevant material, engaging working memory, organizing (“controlling”) available information strategy, and adjusting motivation. High functional connectivity in the SN has also been associated with high memory performance in “super-agers”, defined as older individuals who achieve a youthful performance on a memory task [72]. Taken together our results identify the potential role of CRF for promoting increased connectivity within RSNs which are known to sub-serve executive function and memory in PD.
Impact of motor skill fitness (MSF) on resting state networks
With respect to MSF, we observed a trend towards a significant association (p < .05, uncorrected) between increased PPT and increased within network spatial map intensity of the DAN, specifically within the inferior and superior regions of the parietal lobe. We also observed a trend towards a significant association between increased PPT and increased within network spatial map intensity of the SRN, including the bilateral anterior cingulate cortex (ACC) and the orbitofrontal cortex. The DAN is disrupted early in PD and is integral for orchestrating top-down attentional control, including participating in successful goal-directed activities [73]. The SRN, particularly the ACC, is important for self-focused attention and internally generated information processing of one’s current mental and physical state, conflict resolution, memories, emotions, and mood [74, 75]. In PD, alterations in the ACC are associated with early executive dysfunction as well as mood disorders, including depression, commonly observed in this disease [76]. While the association between higher levels of cardiorespiratory fitness and activation of top-down CEN and attention networks have been previously reported in older healthy adults [77, 78], our study suggests the potential association between MSF on cognitive networks sub-serving executive function and attentional control in PD and supports the need for future studies to explore the different fitness types on cognitive network function and connectivity.
Impact of cardiorespiratory fitness (CRF) on functional network connectivity (FNC)
Functional network connectivity (FNC) analysis demonstrated that CRF is significantly associated with increased network connectivity between the left sensorimotor network (SMN) and the DMN. Although not significant, there was a trend for an association with CRF and FNC between SMN and other cognitive networks including the CEN, DAN, and VAN. While there was a trend for association with MSF and FNC between SMN and CEN nothing survived multiple comparison correction. Overall, these findings suggest a potential association between high CRF and FNC between motor and cognitive networks.
Specifically, we found that high CRF was associated with FNC between the SMN (specifically the left dorsolateral somatosensory network) and the posterior DMN. There were also trends for increased CRF and increased FNC between the SMN (specifically the left dorsolateral and bilateral ventral somatosensory network) and the attentional networks (VAN and DAN), and between the SMN and the right CEN (right frontal parietal lobe). Studies of rsfMRI in PD have reported a loss of connectivity within regions of the SMN, such as a the SMA, and that DA replacement therapy in general is associated with increased SMN connectivity [3]. Therefore, CRF could augment this in individuals with PD. While others have reported the association of increased fitness and increased brain connectivity within the SMN in healthy young adults, our study is the first to report a potential association of CRF with the SMN and its connectivity to associated cognitive networks sub-serving memory, attention, and executive function in PD.
Mechanisms of exercise on plasticity and brain health impacting connectivity
Studies in animal models of PD and aging are useful for elucidating potential mechanisms underlying exercise-induced neuroplasticity and repair. Specifically, exercise studies in young and aging rodents have reported increased expression of angiogenesis and neurotrophic factors, especially brain-derive neurotrophic factors (BDNF), as well as an increase in neurogenesis and synaptogenesis [13, 14, 79, 80]. Furthermore, studies in our lab and others have also shown exercise induced neuroplasticity in animal models of neurodegeneration including synaptogenesis and changes in dopamine and glutamate neurotransmission, as well as changes in cellular metabolism [12, 80–82]. Studies in animal models are also elucidating the contribution of different forms of exercise, such as skill-based versus aerobic, on aspects of neuroplasticity, including differences in the distribution and degree of synaptogenesis and angiogenesis. For example, Greenough and colleagues reported that aerobic exercise that promotes cardiorespiratory fitness enhances angiogenesis in the cerebral cortex of rodents, while activities that target motor skill fitness, such as acrobatic activities (beam walking and ladders in the home cage), induce synaptogenesis [83]. Relevant to the differential contribution of motor skill fitness on the CEN and SMN are findings previously reported by our group in the 6-hydroxydopamine rodent model of PD. Rodents trained for 4 weeks in a skilled motor task (running in a wheel with irregularly spaced rungs) exhibited greater regional cerebral blood flow in both medial prefrontal cortex and sensorimotor cortices when imaged at rest than animals trained in a non-skilled motor task (running in a wheel with smooth surface) [15]. This finding was accentuated when animals were imaged during a locomotor challenge, with concomitant skill-related increases in functional connectivity between medial prefrontal cortex and sensorimotor cortices. Taken together, these studies support that while exercise effects on brain circuitry may involve a number of different mechanisms, the predominance by any one of these physiological processes may be dictated in part by the type of exercise.
Limitations of these studies
Our findings should be interpreted in light of several potential limitations. First, our analysis was based on a cross-sectional analysis of a modest number of individuals with PD. Thus, these neuroimaging findings deserve replication with a larger sample size and over a longer period of time. This study did not include healthy age-matched controls, but age effects were controlled for in the analysis. The PD individuals were assessed after having received their usual anti-parkinsonian medication (“best on” state) and dopaminergic medication may have influenced some of the connectivity patterns as previously shown [84]. Furthermore, while we measured PPT and the estimated VO2max, we did not directly assess the duration, intensity or type of exercise individuals engaged in. Future studies with “off” medication PD individuals, as well as detailed activity logs will provide more accurate information about the different dimensions of fitness (e.g., motor skill and cardiorespiratory) on the resting state networks without the potential confound of medication masking some symptoms. This study did not include cognitive behavior analysis; however, a strength is that it did examine a wide spectrum of cognitive networks thus providing rationale for future studies to explore the interactions of fitness with parameters of cognitive behavior. There is also a possibility of false negatives due to low thresholding, and lack of multiple comparisons because of small power, and small sample size. However, as a strong point of this study, we emphasize that we used ICA as a model free approach with no bias in selecting the brain regions. To add to the fidelity of our results, we particularly followed the ICA procedure that is suggested from the literature to yield more robust and reliable components (e.g., 75-IC decomposition, GICA-3 dual-regression algorithm [41], intensity normalization in preprocessing, and 100 re-runs of ICA algorithm with random initiation in ICASSO [43] and strict image quality control with MRIQC. Another strength of our study was the observational approach to evaluating exercise in PD individuals within the framework of their daily lives. This naturalistic approach suggests that our findings may be more broadly applicable, and that activity levels described are within the scope of what a person could practically implement within his or her daily schedule.
CONCLUSIONS
Our study demonstrates the potential neuromodulatory role of cardiorespiratory fitness (estimated VO2max test) and motor skill fitness (PPT) on intrinsic resting state networks (RSNs) impacting cognition in individuals with PD. This study provides important new empirical data to examine the association between the different types of fitness and multiple RSNs using a multivariate analysis approach. Considering the effect of PD on the intrinsic architecture of the brain, linking exercise related fitness parameters to RSN connectivity will help provide a means to monitor the effects of exercise on brain plasticity and to better understand the underlying neuronal mechanisms of plasticity to promote repair and treat cognitive and motor dysfunctions in PD.
SUPPLEMENTARY MATERIAL
[1] The supplementary material is available in the electronic version of this article: https://dx.doi.org/10.3233/BPL-200115.
FUNDING
This research was supported by NIDA Mentored Quantitative Research Career Development Award K25 (DA048179) (BJ), NIDA T32 (DA035165) (BJ), NIMH Mentored Research Scientist Career Development Award K01 (MH099431) (SM), and by grants from the US Department of Defense (U.S. Army, CDMRP) #W81XWH18-1-0666 (DPH), # W81XWH19-1-0443 (MWJ), #W81XWH18-1-0665 (GP). VA Merit Award CX12004 (JVF), VA Merit Award 1101 RX001691-01A1 (DS), the Parkinson’s Foundation (GP), the Don Roberto Gonzalez Family Foundation (GP), and Anthony McClaren and the Climb Above Parkinson Foundation (GP, MJ).
ACKNOWLEDGMENTS
We would like to thank the individuals with Parkinson’s disease who participated in this work. We would like to thank Vincent Calhoun (Georgia Tech) and his lab for helpful discussions. This paper is dedicated to the memory of Andrew Whittaker, a young man whose spirit showed us why we need a cure.
CONFLICT OF INTEREST
The authors declare that there is no conflict of interest.
REFERENCES
[1] | Filippi M , Elisabetta S , Piramide N , Agosta F . Functional MRI in Idiopathic Parkinson’s Disease. Int Rev Neurobiol. (2018) ;141: :439–67. |
[2] | Tessitore A , Cirillo M , De Micco R . Functional Connectivity Signatures of Parkinson’s Disease. Journal of Parkinson’s disease. (2019) ;9: (4):637–52. |
[3] | Esposito F , Tessitore A , Giordano A , De Micco R , Paccone A , Conforti R , et al. Rhythm-specific modulation of the sensorimotor network in drug-naive patients with Parkinson’s disease by levodopa. Brain. (2013) ;136: (Pt 3):710–25. |
[4] | Voss MW , Nagamatsu LS , Liu-Ambrose T , Kramer AF . Exercise, brain, and cognition across the life span. Journal of Applied Physiology. (2011) ;111: (5):1505–13. |
[5] | Voss MW , Weng TB , Burzynska AZ , Wong CN , Cooke GE , Clark R , et al. Fitness, but not physical activity, is related to functional integrity of brain networks associated with aging. Neuroimage. (2016) ;131: :113–25. |
[6] | Smith JC , Nielson KA , Antuono P , Lyons JA , Hanson RJ , Butts AM , et al. Semantic memory functional MRI and cognitive function after exercise intervention in mild cognitive impairment. J Alzheimers Dis. (2013) ;37: (1):197–215. |
[7] | Voelcker-Rehage C , Godde B , Staudinger UM . Cardiovascular and coordination training differentially improve cognitive performance and neural processing in older adults. Front Hum Neurosci. (2011) ;5: :26. |
[8] | Voelcker-Rehage C , Niemann C . Structural and functional brain changes related to different types of physical activity across the life span. Neurosci Biobehav Rev. (2013) ;37: (9 Part B):2268–95. |
[9] | Noonan V , Dean E . Submaximal exercise testing: clinical application and interpretation. Phys Ther. (2000) ;80: (8):782–807. |
[10] | Reuben DB , Siu AL . An objective measure of physical function of elderly outpatients. The Physical Performance Test. J Am Geriatr Soc. (1990) ;38: (10):1105–12. |
[11] | Garcia PC , Real CC , Ferreira AF , Alouche SR , Britto LR , Pires RS . Different protocols of physical exercise produce different effects on synaptic and structural proteins in motor areas of the rat brain. Brain Res. . (2012) ;1456: :36–48. |
[12] | Halliday MR , Abeydeera D , Lundquist AJ , Petzinger GM , Jakowec MW . Intensive treadmill exercise increases expression of hypoxia-inducible factor 1alpha and its downstream transcript targets: a potential role in neuroplasticity. Neuroreport. (2019) ;30: (9):619–27. |
[13] | Toy WA , Petzinger GM , Leyshon BJ , Akopian GK , Walsh JP , Hoffman MV , et al. Treadmill exercise reverses dendritic spine loss in direct and indirect striatal medium spiny neurons in the 1-methyl-4-phenyl-1,2,3,6-tetrahydropyridine (MPTP) mouse model of Parkinson’s disease. Neurobiol Dis. (2014) ;63: :201–9. |
[14] | van Praag H , Christie BR , Sejnowski TJ , Gage FH . Running enhances neurogenesis, learning, and long-term potentiation in mice. Proc Natl Acad Sci U S A. (1999) ;96: (23):13427–31. |
[15] | Wang Z , Guo Y , Myers KG , Heintz R , Peng YH , Maarek JM , et al. Exercise alters resting-state functional connectivity of motor circuits in parkinsonian rats. Neurobiol Aging. (2015) ;36: (1):536–44. |
[16] | Duchesne C , Lungu O , Nadeau A , Robillard ME , Bore A , Bobeuf F , et al. Enhancing both motor and cognitive functioning in Parkinson’s disease: Aerobic exercise as a rehabilitative intervention. Brain Cogn. (2015) ;99: :68–77. |
[17] | Uc EY , Doerschug KC , Magnotta V , Dawson JD , Thomsen TR , Kline JN , et al. Phase I/II randomized trial of aerobic exercise in Parkinson disease in a community setting. Neurology. (2014) ;83: (5):413–25. |
[18] | Jafri MJ , Pearlson GD , Stevens M , Calhoun VD . A method for functional network connectivity among spatially independent resting-state components in schizophrenia. Neuroimage. (2008) ;39: (4):1666–81. |
[19] | McKeown MJ , Sejnowski TJ . Independent component analysis of fMRI data: examining the assumptions. Hum Brain Mapp. (1998) ;6: (5-6):368–72. |
[20] | Allen EA , Erhardt EB , Damaraju E , Gruner W , Segall JM , Silva RF , et al. A baseline for the multivariate comparison of resting-state networks. Front Syst Neurosci. (2011) ;5: :2. |
[21] | Koch W , Teipel S , Mueller S , Buerger K , Bokde AL , Hampel H , et al. Effects of aging on default mode network activity in resting state fMRI: does the method of analysis matter? Neuroimage. (2010) ;51: (1):280–7. |
[22] | Petersen RC , Doody R , Kurz A , Mohs RC , Morris JC , Rabins PV , et al. Current concepts in mild cognitive impairment. Arch Neurol. (2001) ;58: (12):1985–92. |
[23] | Keating XD , Zhou K , Liu X , Hodges M , Liu J , Guan J , et al. Reliability and Concurrent Validity of Global Physical Activity Questionnaire (GPAQ): A Systematic Review. Int J Environ Res Public Health. (2019) ;16: (21). |
[24] | Gibb WR , Lees AJ . The relevance of the Lewy body to the pathogenesis of idiopathic Parkinson’s disease. J Neurol Neurosurg Psychiatry. (1988) ;51: (6):745–52. |
[25] | Hoehn MM , Yahr MD . Parkinsonism: onset, progression and mortality. Neurology. (1967) ;17: (5):427–42. |
[26] | Langston JW , Widner H , Goetz CG , Brooks D , Fahn S , Freeman T , et al. Core assessment program for intracerebral transplantations (CAPIT). Mov Disord. (1992) ;7: (1):2–13. |
[27] | Ebbeling CB , Ward A , Puleo EM , Widrick J , Rippe JM . Development of a single-stage submaximal treadmill walking test. Med Sci Sports Exerc. (1991) ;23: (8):966–73. |
[28] | Waddoups L , Wagner D , Fallon J , Heath E . Validation of a single-stage submaximal treadmill walking test. J Sports Sci. (2008) ;26: (5):491–7. |
[29] | Thompson PD , Arena R , Riebe D , Pescatello LS . ACSM’s new preparticipation health screening recommendations from ACSM’s guidelines for exercise testing and prescription, ninth edition. Curr Sports Med Rep. (2013) ;12: (4):215–7. |
[30] | Reuben DB , Siu AL , Kimpau S . The predictive validity of self-report and performance-based measures of function and health. J Gerontol. (1992) ;47: (4):M106–10. |
[31] | Terret C , Albrand G , Moncenix G , Droz JP . Karnofsky Performance Scale (KPS) or Physical Performance Test (PPT)? That is the question. Crit Rev Oncol Hematol. (2011) ;77: (2):142–7. |
[32] | Esteban O , Birman D , Schaer M , Koyejo OO , Poldrack RA , Gorgolewski KJ . MRIQC: Advancing the automatic prediction of image quality in MRI from unseen sites. PLoS One. (2017) ;12: (9):e0184661. |
[33] | Shehzad Z , Kelly C , Reiss PT , Cameron Craddock R , Emerson JW , McMahon K , et al. A multivariate distance-based analytic framework for connectome-wide association studies. Neuroimage. (2014) ;93 Pt 1: (0 1):74–94. |
[34] | Sladky R , Friston KJ , Tröstl J , Cunnington R , Moser E , Windischberger C . Slice-timing effects and their correction in functional MRI. Neuroimage. (2011) ;58: (2):588–94. |
[35] | Van Dijk KR , Sabuncu MR , Buckner RL . The influence of head motion on intrinsic functional connectivity MRI. Neuroimage. (2012) ;59: (1):431–8. |
[36] | Power JD , Barnes KA , Snyder AZ , Schlaggar BL , Petersen SE . Spurious but systematic correlations in functional connectivity MRI networks arise from subject motion. Neuroimage. (2012) ;59: (3):2142–54. |
[37] | Ashburner J , Friston KJ . Nonlinear spatial normalization using basis functions. Hum Brain Mapp. (1999) ;7: (4):254–66. |
[38] | Abou Elseoud A , Littow H , Remes J , Starck T , Nikkinen J , Nissilä J , et al. Group-ICA Model Order Highlights Patterns of Functional Brain Connectivity. Front Syst Neurosci. (2011) ;5: :37. |
[39] | Kiviniemi V , Starck T , Remes J , Long X , Nikkinen J , Haapea M , et al. Functional segmentation of the brain cortex using high model order group PICA. Hum Brain Mapp. (2009) ;30: (12):3865–86. |
[40] | Calhoun VD , Adali T , Pekar JJ . A method for comparing group fMRI data using independent component analysis: application to visual, motor and visuomotor tasks. Magn Reson Imaging. (2004) ;22: (9):1181–91. |
[41] | Erhardt EB , Rachakonda S , Bedrick EJ , Allen EA , Adali T , Calhoun VD . Comparison of multi-subject ICA methods for analysis of fMRI data. Hum Brain Mapp. (2011) ;32: (12):2075–95. |
[42] | Bell AJ , Sejnowski TJ . An information-maximization approach to blind separation and blind deconvolution. Neural Comput. (1995) ;7: (6):1129–59. |
[43] | Himberg J , Hyvärinen A , Esposito F . Validating the independent components of neuroimaging time series via clustering and visualization. Neuroimage. (2004) ;22: (3):1214–22. |
[44] | Li YO , Adali T , Calhoun VD . Estimating the number of independent components for functional magnetic resonance imaging data. Hum Brain Mapp. (2007) ;28: (11):1251–66. |
[45] | Duff EP , Johnston LA , Xiong J , Fox PT , Mareels I , Egan GF . The power of spectral density analysis for mapping endogenous BOLD signal fluctuations. Hum Brain Mapp. (2008) ;29: (7):778–90. |
[46] | Corbetta M , Shulman GL . Control of goal-directed and stimulus-driven attention in the brain. Nat Rev Neurosci. (2002) ;3: (3):201–15. |
[47] | Damoiseaux JS , Rombouts SA , Barkhof F , Scheltens P , Stam CJ , Smith SM , et al. Consistent resting-state networks across healthy subjects. Proc Natl Acad Sci U S A. (2006) ;103: (37):13848–53. |
[48] | D’Argembeau A , Collette F , Van der Linden M , Laureys S , Del Fiore G , Degueldre C , et al. Self-referential reflective activity and its relationship with rest: a PET study. Neuroimage. (2005) ;25: (2):616–24. |
[49] | Raichle ME , MacLeod AM , Snyder AZ , Powers WJ , Gusnard DA , Shulman GL . A default mode of brain function. Proc Natl Acad Sci U S A. (2001) ;98: (2):676–82. |
[50] | Seeley WW , Menon V , Schatzberg AF , Keller J , Glover GH , Kenna H , et al. Dissociable intrinsic connectivity networks for salience processing and executive control. J Neurosci. (2007) ;27: (9):2349–56. |
[51] | Eickhoff SB , Stephan KE , Mohlberg H , Grefkes C , Fink GR , Amunts K , et al. A new SPM toolbox for combining probabilistic cytoarchitectonic maps and functional imaging data. Neuroimage. (2005) ;25: (4):1325–35. |
[52] | Ballo AW , Nadim F , Bucher D . Dopamine modulation of Ih improves temporal fidelity of spike propagation in an unmyelinated axon. J Neurosci. (2012) ;32: (15):5106–19. |
[53] | Caspers S , Geyer S , Schleicher A , Mohlberg H , Amunts K , Zilles K . The human inferior parietal cortex: cytoarchitectonic parcellation and interindividual variability. Neuroimage. (2006) ;33: (2):430–48. |
[54] | Mantini D , Perrucci MG , Del Gratta C , Romani GL , Corbetta M . Electrophysiological signatures of resting state networks in the human brain. Proc Natl Acad Sci U S A. (2007) ;104: (32):13170–5. |
[55] | Genovese CR , Lazar NA , Nichols T . Thresholding of statistical maps in functional neuroimaging using the false discovery rate. Neuroimage. (2002) ;15: (4):870–8. |
[56] | Baggio HC , Segura B , Junque C . Resting-state functional brain networks in Parkinson’s disease. CNS Neurosci Ther. (2015) ;21: (10):793–801. |
[57] | Voss MW , Erickson KI , Prakash RS , Chaddock L , Malkowski E , Alves H , et al. Functional connectivity: a source of variance in the association between cardiorespiratory fitness and cognition? Neuropsychologia . (2010) ;48: (5):1394–406. |
[58] | Kim YK , Yoon HK . Common and distinct brain networks underlying panic and social anxiety disorders. Prog Neuropsychopharmacol Biol Psychiatry. (2018) ;80: (Pt B):115–22. |
[59] | Putcha D , Ross RS , Cronin-Golomb A , Janes AC , Stern CE . Altered intrinsic functional coupling between core neurocognitive networks in Parkinson’s disease. NeuroImage Clinical. (2015) ;7: :449–55. |
[60] | RaichleME . The brain’s default mode network. Annu Rev Neurosci. (2015) ;38: :433–47. |
[61] | Fransson P . How default is the default mode of brain function? Further evidence from intrinsic BOLD signal fluctuations. Neuropsychologia. (2006) ;44: (14):2836–45. |
[62] | Kobeleva X , Firbank M , Peraza L , Gallagher P , Thomas A , Burn DJ , et al. Divergent functional connectivity during attentional processing in Lewy body dementia and Alzheimer’s disease. Cortex. (2017) ;92: :8–18. |
[63] | Krajcovicova L , Mikl M , Marecek R , Rektorova I . The default mode network integrity in patients with Parkinson’s disease is levodopa equivalent dose-dependent. Journal of neural transmission (Vienna, Austria : 1996). (2012) ;119: (4):443–54. |
[64] | Lucas-Jimenez O , Ojeda N , Pena J , Diez-Cirarda M , Cabrera-Zubizarreta A , Gomez-Esteban JC , et al. Altered functional connectivity in the default mode network is associated with cognitive impairment and brain anatomical changes in Parkinson’s disease. Parkinsonism Relat Disord. (2016) ;33: :58–64. |
[65] | Sorg C , Riedl V , Mühlau M , Calhoun VD , Eichele T , Läer L , et al. Selective changes of resting-state networks in individuals at risk for Alzheimer’s disease. Proc Natl Acad Sci U S A. (2007) ;104: (47):18760–5. |
[66] | Wolf RC , Sambataro F , Vasic N , Wolf ND , Thomann PA , Saft C , et al. Default-mode network changes in preclinical Huntington’s disease. Exp Neurol. (2012) ;237: (1):191–8. |
[67] | Amboni M , Tessitore A , Esposito F , Santangelo G , Picillo M , Vitale C , et al. Resting-state functional connectivity associated with mild cognitive impairment in Parkinson’s disease. J Neurol. (2015) ;262: (2):425–34. |
[68] | Gorges M , Muller HP , Lule D , Pinkhardt EH , Ludolph AC , Kassubek J . To rise and to fall: functional connectivity in cognitively normal and cognitively impaired patients with Parkinson’s disease. Neurobiol Aging. (2015) ;36: (4):1727–35. |
[69] | Disbrow EA , Carmichael O , He J , Lanni KE , Dressler EM , Zhang L , et al. Resting state functional connectivity is associated with cognitive dysfunction in non-demented people with Parkinson’s disease. Journal of Parkinson’s Disease. (2014) ;4: (3):453–65. |
[70] | Tessitore A , Esposito F , Vitale C , Santangelo G , Amboni M , Russo A , et al. Default-mode network connectivity in cognitively unimpaired patients with Parkinson disease. Neurology. (2012) ;79: (23):2226–32. |
[71] | Menon V , Uddin LQ . Saliency, switching, attention and control: a network model of insula function. Brain Struct Funct. (2010) ;214: (5-6):655–67. |
[72] | Sun FW , Stepanovic MR , Andreano J , Barrett LF , Touroutoglou A , Dickerson BC . Youthful Brains in Older Adults: Preserved Neuroanatomy in the Default Mode and Salience Networks Contributes to Youthful Memory in Superaging. J Neurosci. (2016) ;36: (37):9659–68. |
[73] | Jacob Y , Rosenberg-Katz K , Gurevich T , Helmich RC , Bloem BR , Orr-Urtreger A , et al. Network abnormalities among non-manifesting Parkinson disease related LRRK2 mutation carriers. Hum Brain Mapp. (2019) ;40: (8):2546–55. |
[74] | Ingram RE . Self-focused attention in clinical disorders: review and a conceptual model. Psychol Bull. (1990) ;107: (2):156–76. |
[75] | Yoon EJ , Ismail Z , Hanganu A , Kibreab M , Hammer T , Cheetham J , et al. Mild behavioral impairment is linked to worse cognition and brain atrophy in Parkinson disease. Neurology. (2019) ;93: (8):e766–e77. |
[76] | Vogt BA . Cingulate cortex in Parkinson’s disease. Handb Clin Neurol. (2019) ;166: :253–66. |
[77] | Colcombe S , Kramer AF . Fitness effects on the cognitive function of older adults: a meta-analytic study. Psychol Sci. (2003) ;14: (2):125–30. |
[78] | Prakash RS , Voss MW , Erickson KI , Lewis JM , Chaddock L , Malkowski E , et al. Cardiorespiratory fitness and attentional control in the aging brain. Front Hum Neurosci. (2011) ;4: :229. |
[79] | Berchtold NC , Chinn G , Chou M , Kesslak JP , Cotman CW . Exercise primes a molecular memory for brain-derived neurotrophic factor protein induction in the rat hippocampus. Neuroscience. (2005) ;133: (3):853–61. |
[80] | Petzinger GM , Walsh JP , Akopian G , Hogg E , Abernathy A , Arevalo P , et al. Effects of treadmill exercise on dopaminergic transmission in the 1-methyl-4-phenyl-1,2,3,6-tetrahydropyridine-lesioned mouse model of basal ganglia injury. J Neurosci. (2007) ;27: (20):5291–300. |
[81] | Caldwell CC , Petzinger GM , Jakowec MW , Cadenas E . Treadmill exercise rescues mitochondrial function and motor behavior in the CAG140 knock-in mouse model of Huntington’s disease. Chem Biol Interact. (2019) ;315: :108907. |
[82] | Kintz N , Petzinger GM , Akopian G , Ptasnik S , Williams C , Jakowec MW , et al. Exercise modifies alpha-amino-3-hydroxy-5-methyl-4-isoxazolepropionic acid receptor expression in striatopallidal neurons in the 1-methyl-4-phenyl-1,2,3,6-tetrahydropyridine-lesioned mouse. J Neurosci Res. (2013) ;91: (11):1492–507. |
[83] | Black JE , Isaacs KR , Anderson BJ , Alcantara AA , Greenough WT . Learning causes synaptogenesis, whereas motor activity causes angiogenesis, in cerebellar cortex of adult rats. Proc Natl Acad Sci U S A. (1990) ;87: (14):5568–72. |
[84] | Delaveau P , Salgado-Pineda P , Fossati P , Witjas T , Azulay JP , Blin O . Dopaminergic modulation of the default mode network in Parkinson’s disease. Eur Neuropsychopharmacol. (2010) ;20: (11):784–92. |


