
Advances in Intravital Non-Linear Optical Imaging of the Central Nervous System in Rodents
Abstract
Purpose of review: Highly coordinated cellular interactions occur in the healthy or pathologic adult rodent central nervous system (CNS). Until recently, technical challenges have restricted the analysis of these events to largely static modes of study such as immuno-fluorescence and electron microscopy on fixed tissues. The development of intravital imaging with subcellular resolution is required to probe the dynamics of these events in their natural context, the living brain.
Recent findings: This review focuses on the recently developed live non-linear optical imaging modalities, the core principles involved, the identified technical challenges that limit their use and the scope of their applications. We highlight some practical applications for these modalities with a specific attention given to Experimental Autoimmune Encephalomyelitis (EAE), a rodent model of a chronic inflammatory disease of the CNS characterized by the formation of disseminated demyelinating lesions accompanied by axonal degeneration.
Summary: We conclude that label-free nonlinear optical imaging combined to two photon imaging will continue to contribute richly to comprehend brain function and pathogenesis and to develop effective therapeutic strategies.
INTRODUCTION
Efforts to understand how the brain works require tools for observing cells, their interactions and their outcome as well as neural circuits in action. For example, in recent years, accumulated evidence has suggested that neuroinflammation was a major component of several central nervous system (CNS) pathologies such as stroke, Multiple Sclerosis [1], Alzheimer’s disease and Parkinson’s disease [2, 3], but also in schizophrenia and malignant CNS neoplasms (e.g., glioblastoma multiforme) [4], among many others. A prerequisite for a more comprehensive description of immunological processes in the brain is a thorough characterization of the dynamics and function of the different involved immune cells types. This can only be achieved at the systemic level in animal models by long-term visualization and mapping of neuro-immune cellular dynamic interactions in the living brain and their interactions with neural cells. Moreover, destabilization of myelin membrane assembly leading to swelling, vesiculation and desintegration of the myelin structure is also a common underlying feature of these neurological disorders. In the corresponding animal models, a coordinated interplay seems to exist between, immune cells and myelin [5]. Indeed, oligodendrocytes, the myelinating glial cells of the CNS, are, due to their high specialization and metabolic needs, highly vulnerable to various insults although they are also capable of immune-modulation and to interact with immune cells in acute and chronic CNS inflammation [6]. Finally, the exploration in animal models of pathologies of the relationships between neuronal activity, cognition and behavior cannot be explored in simple preparations or even in anesthetized animals, as the neural basis of behavior in normal or pathological conditions must be explored in awake behaving subjects.
The architecture of neuronal networks has been studied by different imaging techniques. Each of them has its own advantages and drawbacks. For instance, the magnetic resonance imaging (MRI) as well as its derivatives (magnetic resonance spectroscopy (MRS), magnetization transfer imaging (MTI), diffusion-weighted imaging (DWI)), although extremely powerful techniques able to map the white matter density in the whole brain and spinal cord with approximately 200 μm resolution [7], does no provide a sufficient specific information on the cellular composition of the imaged area. Positron emission tomography (PET), by the use of exogenous radioactive labeling agents, provides ≈ 1 mm resolution images that are more specific since based on direct labeling [8]. These techniques, providing three-dimensional (3D) reconstruction, are important tools for the diagnosis of various nervous system abnormalities especially in humans. Due to the lack of high spatial [9], and temporal resolution, the produced information, however, is poorly correlated with functional deficits and also insufficiently accurate to properly evaluate the relative amount of neuro-degeneration and demyelination in rodents.
We will focus on in vivo optical microscopy techniques that have recently become a gold standard in studies involving small animals including (a) multiphoton microscopy that has found a niche in the world of biological imaging as the best noninvasive means of fluorescence microscopy in living animals. Coupled with transgenic mouse models and genetically encoded fluorescent indicators, its use is now increasing exponentially, (b) several label-free optical methods currently available for in vivo imaging with high resolution of myelin architecture and myelin-producing cells. Fluorescence tomography and opto-acoustic tomography [10] that do not provide cellular resolution will not be discussed. Finally, we will illustrate that information on tissue morphology, cell behavior or diseases’ states can be obtained by combining different contrasts for instance multiphoton fluorescence with coherent label-free microscopes [11].
MULTIPHOTON EXCITED FLUORESCENCE MICROSCOPY
Principle and properties of two photon microscopy
Recent developments in fluorescent imaging technology together with the generation of transgenic mice expressing fluorescent proteins linked to specific endogenous proteins make the mouse a powerful model organism to study cell populations in the brain. In two-photon excitation fluorescence, two near-infrared photons (700 to 1200 nm wavelength) are absorbed simultaneously, where each photon provides half of the energy, which is normally required to excite the fluorophore into a higher electronic state. Therefore, emission of fluorophores in wavelengths that fall in visible light or UV region can be induced with low-energy near-infrared photons. The near-infrared excitation spectrum is unique as the linear absorption and scattering coefficients contributed by cells and tissues is low in this wavelength range, which leads to a high light penetration depth [12, 13]. Two-photon excitation fluorescence, however, is achieved only at very high photon concentration in space and time, requiring extremely high near infra-red laser intensities. The development of ultra-short pulsed lasers can now provide transient intensities of GW/cm2 in a pulsed form, with the pulse duration of 100 femtoseconds to picoseconds range, at a high pulse rate of 80–90 MHz. As a result two-photon excited fluorescence signals can be generated effectively at average laser powers lower than 5 mW incident on the tissue. In addition, the two-photon absorption occurs only in the plane of focus, minimizing background scatter from regions outside focus. In particular, two photon excited fluorescence microscopy allows subcellular-scale 3D imaging of complex media over depths of several hundreds of micrometers (typically 1000 in the cortex and 150 in the spinal cord), and it has become an indispensable tool for volume and live-tissue studies. It thus provides deeper penetration of live tissues with reduced phototoxicity and photobleaching in comparison to classical confocal microscopy. The technique is qualified as non or minimally invasive, which makes it useful for imaging the physiology, morphology, and cell– cell interactions in neural tissue of living animals with high spatial and temporal resolution. At the cost of depth penetration, the imaging speed can be increased up to 1000 images/seconds on the most fluorescent objects using multibeam excitation of the fluorescence [14].
Moreover, nanomolar concentrations of fluorophores can be detected in vivo in volumes as small as few μm3 [15], comparable to PET scan sensitivity of femtomolar concentrations in mm3.
Studies including analysis of single neurons as well as neural network are challenging. The small size of neuronal dendrites and spines combined with the high speed of neurophysiological signals, such as transients in membrane potential or ion concentration, necessitates that functional study of these structures uses recording methods with not only high spatial but also high temporal resolutions. In this regard, conventional two-photon microscopy, in combination with fluorescent indicators sensitive to physiological parameters, has proven to be only a partial solution by providing near-diffraction-limited spatial resolution even when imaging structures are deep inside light-scattering tissue. This is because the relatively slow beam-scanning methods used severely limit the extent to which functional data can be recorded. In this regard, a recent method of laser scanning for multiphoton microscopy overcomes the temporal limitations of previous approaches and allows for what is known as 3D Random Access Multiphoton (3D RAMP) microscopy, an imaging technique that supports full 3D recording of many sites of interest on physiologically relevant time scales[16].
Multicolor imaging
Until recently, implemented methodology did not provide simultaneous, efficient and independent multiphoton excitation of more than two spectrally distinct chromophores whereas integrative biological studies require to visualize and track various cell populations. The main challenges toward this goal are adding multiple non descaned detectors with suited band pass filters or ultimately using detector arrays to acquire and analyze photons over the whole spectrum, labeling cells of interest by expression of new fluorescent proteins with non-overlapping emission spectra, finding optimal excitation strategies to reveal the fluorescence of all markers. Recent significant improvements have been made [17]. Recently, Ricard & Debarbieux [18] described a multiphoton imaging set up (Fig. 1) to dynamically characterize the interactions between five cellular components in a clinically relevant glioblastoma multiforme (GBM) model designed in reporter mice with targeted cell populations labeled by fluorescent proteins of different colors. They made non-invasive longitudinal and multi-scale observations of cell-to-cell interactions on a daily basis from volumes of interest, covering most of the mouse parietal cortex at subcellular resolution (Fig. 2).
FLIM and FRET imaging
Technological advances have made also a significant contribution to the ability to extend fluorescent two photon imaging techniques beyond that of simple morphological analysis. Three microscopic methodologies take advantage of fluorescent probe properties: fluorescence recovery after photobleaching (FRAP), fluorescence lifetime imaging microscopy (FLIM), and fluorescence resonance energy transfer (FRET). FRAP provides valuable information about the mobility of molecules on surfaces and within cells, and can be used to monitor molecular assemblies and the dynamics of complex domains over time. FLIM uses a short pulsed light source (femtoseconds to picoseconds) to excite the sample and the subsequent fluorescence emission decay is recorded by high-speed detectors. FLIM monitors the environment around fluorophores by altering the characteristic lifetime of those molecules. As an example, Rusakov’s team [19] has implemented and validated the method of monitoring low resting [Ca2+] and [Ca2+] dynamics in neurons and astroglia in situ at high resolution using two-photon excitation FLIM of the common Ca2+ indicator OGB-1. They unveiled some previously unrecognized features of intracellular Ca2+ homeostasis that might have fundamental implications for cellfunction.
FRET monitors the transfer of energy between two fluorophores with significant spectral overlap, when they come within nanometer distances (2–10 nm) of one another. Several sensors have been developed to use FRET to study in a direct manner a wide variety of cell based dynamic biological events ([20, 21]; see also section 3).
FRET can be combined to FLIM to simultaneously assess the biochemical environment. FRET measurements are dependent on the acceptor/donor ratio, but FLIM-FRET behaves independently of the donor concentration given that fluorescence lifetime is inherent to each fluorophore and its surrounding environment in a concentration independent manner. Although the in vivo FLIM-FRET technique is still in its infancy it has already captivated researchers due to its unique live imaging ability [22, 23].
Preparations for chronic imaging
Non invasive chronic imaging of the same area in the CNS for long periods of time (i.e. days) had required to design techniques minimizing invasiveness to access the cortex or the spinal cord. Concerning the cortex, the thinned skull and cranial window techniques dominate in the literature. Thinned skull technique consists of drilling the skull enough to allow imaging of the underlying brain [24]. The proposed advantage of this method is the reduced risks of tissue injury and microglial activation, but the inconvenient is the inhomogeneity of the overlying bone layer, hence the inhomogeneous optical properties and the limited depth accessible. Cranial window technique consists of the full removal of part of the skull and its replacement by a thin glass window. Sensitivity and imaging depth are much improved with full removal of the skull. Careful consideration of both sterile technique and surgical expertise are paramount to a successful imaging experiment regardless of the approach taken since both techniques can lead to transient inflammation. A very comprehensive review comparing and contrasting the pros and cons of each method had been recently published [25]. Similarly, a few techniques have been developed for implanting and maintaining windows over the spinal cords of adult mice (Fig. 3) for high-throughput imaging data acquisition [26-28].
Limitations of multiphoton microscopy
Although multiphoton microscopy is clearly a very promising technology, it faces some challenges. First of all, it requires the presence of fluorescence in the sample that has to be introduced in the living animals as discussed in the following section. Then, because each image is acquired pixel by pixel, the volume of tissue that can be imaged in a reasonable time (typically one hour) is small (i.e. a few mm3). Therefore, the density of fluorescent objects of interest within the imaged tissue must be high enough to ensure that they will be present in the imaged area. Nevertheless, parcimonious density of fluorescent objects is preferable to uniform distribution in the whole tissue since the contrast is optimal for objects surrounded by dark or different colors. Another limitation is the presence of physiological respiratory and heart movements that impede the desired micrometric resolution of cell processes. These movements can however be partially compensated by image acquisition gating [29], on line autofocussing and post-acquisition registration [30].
FLUORESCENT LABELS
Exogenous fluorescent labels
Exogenous fluorescent labels (Table 1) can be used to label vascularization or cells of interestex-vivo prior to reinjection in the animal. For example blood vessels can be highlighted by injection in a tail vein of a fluorescent marker such as 70kDa dextran, conjugated with either fluorescein or rhodamineB isothiocyanate or Cascade Blue (example in Fig. 2). Interest of fluorescent dextrans is that they can be uploaded by macrophages from the plasmatic compartment within a few hours, resulting in a long term intravital labeling of macrophagic populations. For selective labeling of the vascular compartment, quantum dots have to be preferred to labeled dextran as they barely accumulate in phagocytic cells [27]. Quantum dots are small, inorganic nanoparticles that emit a specific wavelength of light depending on their size, from ultraviolet to near infrared. Moreover, these nanoparticles are promising scaffolds for imaging applications, for example designing quantum-dot surfaces with various functionalities, for use as nanosensors or as fluorescent probes[21].
In the context of studying neuroinflammation, some of the earliest studies to visualize the immune response in situ were performed using adoptive transfer of exogenously labeled cells. Cell populations collected in vivo were purified and labeled with fluorescent dyes with non-overlapping emission spectra, such as CFSE [31], SNARF [32], CMAC [33] or DiI [34]. Although it has been useful for short-term trafficking and migration studies, cell division however resulted in the dilution of dyes and made them difficult to track.
Cell-type-specific expression of fluorophores
Genetically encoded proteins (Table 1) represent fantastic new tools for long term labeling, manipulation and characterization of inflammatory cells in real time and with cellular specificity. Since the breakthrough discovery of the green fluorescent protein (GFP) in 1978 a protein that can be excited with blue light to emit green fluorescence, a large number of other fluorescent proteins have been discovered and constantly optimized. Today, they comprise a palette of proteins spanning the spectrum from ultraviolet to far red, laying the basis for multicolor imaging [35]. Usually, they exhibit very high extinction coefficients and very high quantum yields, properties making them very bright. Genes coding for fluorescent proteins can be introduced into the mouse genome by either random transgenesis or targeted transgenesis via homologous recombination [36]. It is also possible to introduce conditional genome alterations that are spatially and temporally restricted by combining the Cre/loxP site-specific recombination system with random transgenesis technologies [37]. There was a report on labeling neurons with multiple colors using a mixture of several fluorescent proteins expressed under the neuron-specific Thy1 promoter, obtained by random Cre recombination, which produced more than 100 colorful hues that could be distinguished by fluorescence microscopy [38]. This technique, called Brainbow, uses Cre-mediated recombination to generate a random mix of several fluorescent proteins expressed in individual neurons and is expected to facilitate the deciphering of complex neuronal circuits. The fluorescent protein tags can be cytoplasmic, nuclear or membranous. Care should be taken that the localization of the large fluorescent protein does not impede the cell physiology. Experience seems to indicate that cytoplasmic expression is usually safe for the cells. Moreover, beside specific cell targeting, fluorescent molecules can be linked to multiple proteins with various functions, e.g. calcium [39], voltage [40], glutamate [41] or caspases [42] sensors. These conjugated molecules allow the activation of the fluorescent protein when the sensor binds to the appropriate stimulus molecule.
Optical indicators for fast circuit imaging
Electrical signals are fundamental to cellular sensing, communication and motility. Understanding how brain functions emerge from these electrical signals requires a methodology to monitor membrane voltage transients from large numbers of cells at high spatio-temporal resolution. Voltage-sensitive dye imaging enables visualization of information processing in different areas of the brain with reasonable spatial and temporal resolution (see above). It employs different chemical compounds to transduce neural activity directly into the changes in intrinsic optical signal. Voltage-sensitive dyes are chemical probes that reside in the neural membrane and change their fluorescence or absorbance in response to membrane potential changes [43]. However, by far the most widely used reporters of neural activity rely on detection of Ca2++. Action potentials lead to opening of voltage-gated calcium channels, and thus to an elevation in cytoplasmic Ca2++concentration, typically from 50 –100 nM to 5–10 microM; the Ca2++ transient decays over 100–500 ms [44]. Development of cell permeable calcium dyes has contributed greatly to the understanding of intracellular calcium signaling. Dyes such as Fluo-5N with fast off rates have been commonly used to monitor calcium dynamics. However, the use of these small molecule dyes suffers from several limitations including invasive staining procedures and blindness toward cellular diversity. The field has recently gained a fresh powerful momentum with the development of genetically encoded calcium or voltage indicators [45, 46] one recently useful example of which is the GCaMP6 family [47].
TWO PHOTON IMAGING OF NEUROINFLAMMATION
Reporter fluorescent mice
In vivo two photon imaging data can assist in achieving an understanding of the dynamics of mechanisms involved in inflammation at the cellular level. The brain parenchyma is separated from peripheral tissue by the blood brain barrier, which prevents blood immune cells from entering brain under normal conditions. Many neurological disorders are associated with a blood– brain barrier disruption that strongly impact the integrity of the neurovascular unit, composed of cerebral blood vessels, glial cells and neurons.
The CNS has its own innate immune system and microglial cells are the resident macrophages of the brain [48]. The generation of various reporter mice expressing fluorescent proteins under promoters specific for different myeloid cell types (e.g. dendritic cells, neutrophils, macrophages) has permitted long-term tracking of many different types of immune cells in vivo. Nevertheless, until recently most of these mice have been generated using GFP thus limiting the analysis of several reporter genes in the same animal. For more information, there are a few databases of mouse lines that list available reporter mouse lines (http://www.informatics.jax.org/ and http://jaxmice.jax.org/research/fluorescent_proteins_or_lacZ.html). However, it is still difficult for researchers to search for reporter mouse lines that meet their specific purposes and thus a new database of reporter mouse lines expressing fluorescent markers that would facilitate this search would be interesting.
Moreover, the most important consequence of neuroinflammation being damage to axons/neurons, it is particularly interesting to generate mice allowing their observation. In this line, the difference in fluorescence emission spectra for eGFP, eYFP and CFP allows for intravital identification of the three fluorophores in triple labeled Thy1-CFP//LysM-eGFP//CD11c-eYFP animals [55]. In the context of research on neuroinflammation, these animals with CFP expression in subpopulations of neurons [56], eGFP expression in peripheral myelomonocytic cells including neutrophils, granulocytes, circulating macrophage precursors and activated infiltrating macrophages [51], and eYFP expression in a subset of myelomonocytic cells resident to the CNS including a subset of microglia [52] are particularly appropriate to study the contribution of resident and peripheral immune cells in neuropathology.
To explore how blood brain barrier disruption instigates and amplifies immune and degenerative responses, Ryu JK. et al. [57] developed an experimental setting for exploring the cascade of pathogenic events that directly follows from the leakage of plasma proteins in the white matter. They established that fibrinogen is a major protein in the blood that drives sustained neuro-inflammatory responses in the CNS. This was first substantiated in vivo, where a single stereotactic injection of fibrinogen in the corpus callosum induced recruitment and local differentiation of myelin antigen-specific Th1 cells leading to demyelination. Then the authors injected fibrinogen into Ccr2-RFP//Cx3cr1-GFP mice, which differentially label resident microglia (GFP+) and inflammatory monocytes (RFP+). They quickly detected RFP+ cells after injection and propose that the extravascular fibrinogen triggers recruitment of inflammatory monocytes into the CNS.
Imaging neurodegeneration in the pathological spinal cord
Intravital multicolor imaging has also increased our understanding of events occurring during neurodegeneration. For example, Fenrich et al. [55] performed a spinal cord lesion in the Thy1-CFP//LysM-eGFP//CD11c-eYFP mice. They provided a quantitative assessment of recruitment and redistribution dynamics of infiltrating LysM+ cells and resident CD11c+ cells over the long term in the same animals, as well as their real-time interactions with axons after spinal cord injury (Fig. 4). The findings showed that infiltrating LysM+ cells are rapidly recruited to injury sites and are associated with the collapse of distended axon terminals caudal of injury sites. Conversely, resident microglial CD11c+ cells peaked at the injury sites later, and are more closely associated with clearing axon debris rostral of injury sites. The mice and protocol described in this study can be used for studying inflammation and cell interaction dynamics in other pathologies such as EAE [28].
Two photon Imaging of axonal transport in EAE
Intravital imaging has also increased our understanding of axonal pathology in neuroinflammation. Axonal transport impairment has been described in classical neurodegenerative diseases. Axonal transport is the process by which cargo shuttles long distances between the neuronal cell body and synapses along the axon; it allows axons to be supplied with lipids, proteins, and organelles from the soma (through anterograde transport), while components that require degradation or recycling are trafficked back to the cell body (through retrograde transport). Nikic et al. [58] using in vivo two-photon microscopy on an EAE mouse model observed for the first time that axonal abnormalities start with focal swellings, and while some axons degenerate, in others swellings are reversible resulting in spontaneous recovery. More recently, the same group [59] used mice in which the transport of single, fluorescently-labeled organelles mitochondria (in Thy1-MitoCFP mice) and peroxisomes (in Thy1-PeroxiYFP mice) can be tracked along the spinal axons in vivo (Fig. 5). The group directly assayed organelle trafficking and microtubule stability along individual spinal axons following EAE induction. Intriguingly, they found that transport was not only reduced in the degenerating axons but also in the majority of normal-appearing myelinated axons found in the lesions, indicating that transport disturbances may promote and demarcate the more pervasive axonal dysfunction that precedes progressive degeneration. A net deficiency of organelle delivery from the cell body to the synapses was observed as anterograde rather than retrograde transport was more significantly affected. This also coincided with organelle arrest in areas of neuroinflammation such that mitochondrial accumulation, for example, was observed within the lesions. Importantly, this study also showed that both a standard anti-inflammatory treatment, as well as a redox-scavenging protocol, efficiently reversed the transport deficit. Altogether their in vivo observations strongly suggested that reactive species released by activated immune cells in neuroinflammatory lesions acutely induce transport disruptions by altering the attachment of motor/cargo complexes to microtubules.
In a similar topics, Gonzalez et al. [60] used viral vectors to specifically transduce mito-dsRed2 that selectively labels mitochondria, in the sciatic nerve of living mice. They reliably imaged live animals under anesthesia for approximately 5 h. The parameters recorded in living animals were characteristic/indicative of healthy mitochondria under physiological condition. They also showed that changes in mitochondrial parameters correlate with alteration of mitochondria physiology and with mitochondrial diseases in peripheral nerves.
LABEL– FREE OPTICAL METHODS
Recently, several optical imaging modalities have been developed, which do not require fluorescence labeling, relying rather on local refractive index properties or intrinsic responses from the biological sample. Among those label-free methods, the most used exploit non linear optical signals directly provided by the biological molecules themselves. We will briefly cover those techniques and present optical coherence tomography (OCT) [61, 62], third harmonic generation (THG) [63, 64], confocal reflectance [65] and vibrational microscopy (Coherent Anti Stokes Raman - CARS- microscopy) [66]. We will illustrate the knowledge that nonlinear microscopy brings on endogenous molecules and their architecture, in particular in collagen, myelin and myelin-producing cells.
Characteristic features of myelin
Since label free optical microscopy techniques dedicated to neuro-imaging essentially image myelin, we remind here a few essential properties that make myelin a source of label-free contrast. One of the most important features defining the functionality of myelin is its unique composition. The myelin sheath is composed of lipids (≈ 70% by dry weight) and proteins (≈ 30% by dry weight) with a low water content [67]. The components of the myelin sheath present the extraordinary ability to self-assemble into a highly ordered and stable structure. The balanced intermolecular forces between lipids as well as between lipids and proteins results in the formation of organized and tightly packet multi-bilayers, which makes it a high refractive index structure, moreover strongly birefringent. Myelin Basic Protein (MBP) by acting as an electrostatic glue between negatively charged bilayers and positively charged amino acids groups, maintain the structure and stability of the cytoplasmic region of the myelin sheath [68]. Moreover, the adhesion between bilayers highly depends on the lipid composition [69], in particular, the ratio between the saturated to unsaturated lipid molecules. Interestingly, the lipid composition differs between the healthy and EAE white matter and the ratio of charged to uncharged lipids [70, 71] is modified. A possibility is that alterations in the distribution of intermolecular forces decreases the myelin stability and provokes the swelling process. Moreover, such lipid abnormalities have been reported in the EAE white matter before the apparition of lesions [72].
Optical coherence tomography
Optical coherence tomography (OCT) is based on the evaluation of the interference between near-ballistic backscattered photons from the sample, with unscattered light from a reference low-coherence beam. Thus, OCT provides information about the different reflective layers in a sample that are due to differences in refractive indexes. Many studies exploring its diagnostic feasibility for several tissue types have been conducted, particularly, real-time in vivo applications. A full Field OCT has been developed based on a large field of view imaging combined with high-frame-rate interferometry [61]. This tool has been employed as a deep optical coherence microscope to measure the density of individual myelinated fibers in the rat cortex over a large volume of gray matter, providing perspectives for myelin chronic imaging in demyelinating diseases. Henry et al. [62] demonstrated that polarization sensitive-OCT (PS-OCT) is capable of providing nondestructive and quantitative assessment of nerve health after injury. They assessed the sciatic nerve microenvironment through measurements of birefringence after applying a nerve crush injury in a rat model. Initial loss of function and subsequent recovery were demonstrated by calculating the sciatic function index. They reported that the PS-OCT phase retardation slope, which is proportional to birefringence, increased monotonically with the sciatic function index. Additionally, morphometric analysis of the myelin thickness showed that the PS-OCT slope is a good indicator of myelin health and recovery after injury. However, this technique, which measures the difference in the refractive index between tissues components, is very sensitive to experimental motion artifacts.
Second and third -harmonic generation microscopy
When illuminated by short pulses of high-peak power (typically around 100 femtosecond in time width, 80 MHz repetition rate, 10 to 100mW average power) in the near infrared spectral range, ordered structures such as collagen, tubulin and myosin are responsible for the creation of a coherent radiation which photons exhibit double energy, in a process known as second harmonic generation (SHG). The characteristics of SHG originate from its requirements regarding the structure of the sample, which should not possess any center of symmetry (e.g. typically obtained from helical arrangement of amino acids in collagen) [73]. SHG microscopy imaging thus provides an endogenous contrast modality that allows for morphological observation in collagen-rich or microtubule-rich structures such as the brain and the lymph nodes [74, 75]. The lateral and axial resolutions for two-photon excited fluorescence as given above are also valid for SHG microscopy (see for example Fig. 2).
At a higher order, any material exhibits the possibility to emit a photon of triple energy of the incident photon under pulsed excitation regime, in a process called Third Harmonic Generation (THG). THG microscopy is able in particular to image structures that exhibit high refractive index [76], which is very strong in myelin [63]. Using THG microscopy Lim et al. [64] visualized Schwann cell myelination in live culture and ex vivo tissue. THG is capable of imaging compact myelin as well as non– compact subcellular domains, including nodal segments, Schmidt– Lanterman incisures, and Cajal bands, thus attractive for elucidating their functional roles. So far, in vivo THG imaging of sciatic nerve in live mice prove to be more difficult. Indeed, although the brightness of the images obtained is comparable to the ex vivo conditions, the resolution of imaging is degraded by motion artifacts (Fig. 6). The movement of nerves as much as a few micrometers per second, especially in the axial direction, confound g-ratio analysis (a well known parameter to define myelin state). Nevertheless, nodes and incisures are visible in living mice. As for PS-OCT, suitable methods to immobilize in vivo tissue should further improve the overall image quality.
Spectral confocal reflectance microscopy
Spectral confocal reflectance microscopy takes advantage of the high refractive index contrast of lipid-rich myelin and uses a conventional laser-scanning confocal system to generate images by merging the simultaneously reflected signals from multiple lasers of different wavelengths. Schain et al. [65] described the striking color patterns generated that appear unique to individual myelinated fibers allowing their tracing in dense axonal areas. Although the precise mechanism for the multicolor reflection is not clear, it is likely that the thickness and number of layers of myelin may determine the wavelengths that are preferentially reflected, with further variability due to focal irregularities in myelin sheath thickness, lipid composition and other local cellular variables. In any case the patterns highlight nodes of Ranvier and Schmidt-Lanterman incisures and can be used to detect various myelin pathologies. For example, they carried out chronic brain imaging up to 400 μm deep, capturing de novo myelination of mouse cortical axons in vivo. Confocal reflectance as THG, are specifically sensitive to the inner and outer interface of the myelin sheath and not necessarily to its volume. Complementary studies are therefore still needed to find more reliable opticalcontrasts.
Coherent anti-Stokes Raman Scattering imaging
Vibrational microscopy (Raman microscopy and infrared microscopy), which observes molecular vibrations, gives information of molecular species without staining. However, infrared radiation is absorbed with water, and the long wavelength (3-10 μm) limits the spatial resolution to several micrometers. While Raman processes are known to be of very low scattering cross sections, Coherent anti-Stokes Raman scattering (CARS) relies on a stimulated Raman process induced by a nonlinear excitation by two incident synchronized pulsed lasers [77]. The coherent nature of this process strongly increases the signal, while benefiting from the advantages of nonlinear microscopy (near infra red illumination penetration depth, sub-micrometric resolution in particular). The vibrational based contrast CARS has been applied to visualize the myelin sheath for the first time by Wang et al. in 2005 [66]. They have demonstrated that CARS microscopy, sensitive to the CH2 vibration modes, permits to retrieve the molecular orientation and vibrational spectral profiles of myelin lipids in a live spinal tissue in epi- (E-CARS) and forward (F-CARS) directions. Since this time, CARS microscopy applied to neuronal tissues has been extensively developed. Myelin from the CNS or peripheral nervous system (PNS) was observed in vivo [78–80]. Now, it is possible to perform 3D high resolution, video-rate CARS images [81] in live animals over weeks [82]. CARS microscopy in combination with other techniques, such as electrophysiology for instance, have allowed to observe the myelin envelope behavior following high-frequency stimulation [83]. Although small details of the myelin morphology, such as the node of Ranvier or the Schmidt-Lanterman clefts, had been already observed by CARS microscopy [66], the recently developed method for resolution enhancement and suppression of distortions [84, 85] and polarization sensitivity [86] has given a possibility to obtain even more insights into the structural information of myelin. With these advances, the mechanistic disruption of myelin in various models has been studied. Bégin et al. [87] have developed an approach to calculate the average orientation and the directional anisotropy within a myelin image domain. They also introduced a new quantitative parameter, the corrected correlation parameter (CCP), used to assess myelin health locally on images taken from the spinal cord of mice at different stages of a EAE pathology. They showed that the CCP can be used to quantify the degree of organization/disorganization in the myelin structure. As a proof of concept they showed that in the EAE mice, the number of sites with a lower CCP increases as the disease progresses. The CCP could therefore be developed into a parameter for pre-symptomatic detection of myelin disruption. It has also been found, for instance, that degraded myelin has higher degree of lipids unsaturation and lower lipid-packing ordering as compare to normal myelin, and that the lipid conformation is not fully recovered in regenerated fibers. Moreover, analysis of tissue sections uncovered that the density of myelin is strongly affected with structures showing decreasing straightness with disease progression [81, 88,89].
Pros and cons of the label free techniques
It is highly probable that the label-free techniques will have a significant role to play in the future of brain research as the required technology is currently available. However, presently their use on leaving animals is still to be improved. Among the above presented techniques CARS present many advantages, providing specificity to the molecular content of myelin rather than macroscopic refractive index changes that are detected by OCT and THG, and relying on endogenous contrast without need for chemical fluorescent markers like fluorescent two photon microscopy [90] which can ease its transfer to in vivo application. A serious limitation of the technique is however the depth penetration. CARS signals from myelin reach up to ≈ 250 μm depths for fresh and ≈ 100 μm depths for fixed nervous tissues.
It is obvious however, that imaging of myelin wrapped around the axon only provides a partial information about the structure, dynamics and functionality of the CNS. Importantly, the possibility to image myelin by CARS together with another contrasts such as reflectance [81], two-photon fluorescence [88, 91] or second harmonic generation (coming from fibrous filaments of glial cells) [92] opens a door for the future fast live imaging of the architecture of the white matter and its changes during neurological disorders.
OUTLOOK FOR THE FUTURE
Microscopy based on different nonlinear processes can provide distinctive contrast for observing diverse endogenous cellular events and biomarkers. In this focused review, some demonstrations provided by a restricted number of research groups worldwide, active in this developing field, have been highlighted. Although these works have proven that in vivo optical imaging is already mature for specific applications in the CNS the deployment of its full potential is yet to come.
Looking into the future, we expect to see the growth of optical imaging through pioneering work in several directions. Recent developments in technical instruments and fluorescent reporter dyes and technologies will provide researchers with previously unimagined possibilities. Intravital imaging by two-photon microscopy started with the observation of a single-cell population, now the tracking of interactions between several cell types become feasible. Imaging also proceeded to intravital imaging at greater depth (to 1000 μm in the cortex), longer periods of observation and highest speed.
Moreover, multimodal microscopy that combines several imaging modalities can bring together more cellular and molecular information and contrast to bring about a more profound understanding of normal and diseased CNS. Indeed, different types of nonlinear microscopy can be integrated effectively to image the same sample at the same time because they all use ultrafast lasers and laser-scanning technology for imaging (see example Fig. 2). Femtosecond sources with their extraordinary features, such as broadband frequency coverage for multiplex imaging, higher signal levels, and versatility in pulse shaping are particularly suited. The coupling of multiphoton fluorescence, second-harmonic generation, and coherent anti-Stokes Raman scattering is very promising to investigate the dynamics of events occurring in demyelinating pathologies such as EAE [93]. It is likely that commercial systems combining all of the necessary elements into a single package will become available, opening up the techniques to a wider audience by making the setup and operation user-friendly.
Novel approaches are also being developed such as laquo two-photon fiberscopes raquo [94] to overcome the confounding effects of anesthesia on animals. They should allow to image cell Ca2++ and blood flow or interactions across pairs of brain areas in a way that simultaneously provides cellular resolution within each area in awake and behaving animals [95]. Novel achievements in transgenic mouse technology, such as genetically encoded biosensors for different signaling pathways, will make possible to gain information about molecular events taking place inside neural cells within their spatiotemporal context. Finally, the nexus of dramatic recent developments in optogenetic probes, genetically encoded activity sensors, and novel microscopies, together allow the activity of neural circuits to be recorded and manipulated entirely using light [96].
Noteworthy, the fiber versions of these microscopies will ultimately facilitate the combination of optical techniques with existing preclinical and clinical imaging modalities, giving access to unprecedented characterization of the cellular substrates of the contrast acquired by MRI or CT.
The shortcoming however resides in the fact that these imaging techniques provide a huge amount of data that must be stored and processed to extract the relevant information and quantitative results. This demands the development of new and specific tools and there is a real need for progresses in quantitative analysis of the data. Such effort is worth given that these advances promise to illuminate many fundamental challenges in neuroscience, from understanding the outcome of cell-cell interactions in pathologies to finding the links between neural circuit activity and behavior.
CONFLICT OF INTEREST
The authors declare that they have no conflict of interest.
ACKNOWLEDGMENTS
This review would not have been possible if not for all the researchers worldwide who have and are still contributing immensely to establish in vivo non linear optical imaging as a valuable tool for CNS research. The authors apologize for the significant studies in the related field that have been overlooked. Studies in our laboratories are supported by CNRS, Aix-Marseille University, ANR (grant NeuroinflamDYN n° ANR-15CE16-009-01 and MyDeepCARS n° ANR-15-CE19-0018-01), ARSEP and Institut National du Cancer (PLBIO n° 14-197).
REFERENCES
[1] | Miron VE , Franklin RJ . Macrophages and CNS remyelination. Journal of Neurochemistry. (2014) ;130: (2):165–71. Epub 2014/03/08. |
[2] | Weiner HL , Selkoe DJ . Inflammation and therapeutic vaccination in CNS diseases. Nature. (2002) ;420: (6917):879–84. Epub 2002/12/20. |
[3] | Schwartz M . Macrophages and microglia in central nervous system injury: Are they helpful or harmful? Journal of Cerebral Blood Flow and Metabolism: Official Journal of the International Society of Cerebral Blood Flow and Metabolism. (2003) ;23: (4):385–94. Epub 2003/04/08. |
[4] | Kore RA , Abraham EC . Inflammatory cytokines, interleukin-1 beta and tumor necrosis factor-alpha, upregulated in glioblastoma multiforme, raise the levels of CRYAB in exosomes secreted by U373 glioma cells. Biochemical and Biophysical Research Communications. (2014) ;453: (3):326–31. Epub 2014/09/28. |
[5] | Klein D , Martini R . Myelin and macrophages in the PNS: An intimate relationship in trauma and disease. Brain research 2015. Epub 2015/12/04. |
[6] | Zeis T , Enz L , Schaeren-Wiemers N . The immunomodulatory oligodendrocyte. Brain research. (2015) . Epub 2015/10/02. |
[7] | Kozlowski P , Rosicka P , Liu J , Yung AC , Tetzlaff W . In vivo longitudinal Myelin Water Imaging in rat spinal cord following dorsal column transection injury. Magnetic Resonance Imaging. (2014) ;32: (3):250–8. Epub 2014/01/28. |
[8] | Stankoff B , Wang Y , Bottlaender M , Aigrot MS , Dolle F , Wu C , et al . Imaging of CNS myelin by positron-emission tomography. Proceedings of the National Academy of Sciences of the United States of America. (2006) ;103: (24):9304–9. Epub 2006/06/07. |
[9] | Vigeveno RM , Wiebenga OT , Wattjes MP , Geurts JJ , Barkhof F . Shifting imaging targets in multiple sclerosis: From inflammation to neurodegeneration. Journal of Magnetic Resonance Imaging: JMRI. (2012) ;36: (1):1–19. Epub 2012/06/15. |
[10] | Arranz A , Ripoll J . Advances in optical imaging for pharmacological studies. Frontiers in Pharmacology. (2015) ;6: , 189. Epub 2015/10/07. |
[11] | Kwan AC , Duff K , Gouras GK , Webb WW . Optical visualization of Alzheimer’s pathology via multiphoton-excited intrinsic fluorescence and second harmonic generation. Optics Express. (2009) ;17: (5):3679–89. Epub 2009/03/05. |
[12] | Niesner RA , Andresen V , Gunzer M . Intravital two-photon microscopy: Focus on speed and time resolved imaging modalities. Immunological Reviews. (2008) ;221: , 7–25. Epub 2008/02/16. |
[13] | Hoover EE , Squier JA . Advances in multiphoton microscopy technology. Nature Photonics. (2013) ;7: (2):93–101. Epub 2013/12/07. |
[14] | Qu J , Liu L , Shao Y , Niu H , Gao BZ . Recent Progress in Multifocal Multiphoton Microscopy. Journal of Innovative Optical Health Sciences. (2012) ;5: (3). Epub 2012/07/01. |
[15] | Malcor JD , Payrot N , David M , Faucon A , Abouzid K , Jacquot G , et al . Chemical optimization of new ligands of the low-density lipoprotein receptor as potential vectors for central nervous system targeting. Journal of Medicinal Chemistry. (2012) ;55: (5):2227–41. Epub 2012/01/20. |
[16] | Reddy GD , Cotton RJ , Tolias AS , Saggau P . Random-access multiphoton microscopy for fast three-dimensional imaging. Advances in Experimental Medicine and Biology. (2015) ;859: :455–72. Epub 2015/08/05. |
[17] | Mahou P , Zimmerley M , Loulier K , Matho KS , Labroille G , Morin X , et al. Multicolor two-photon tissue imaging by wavelength mixing. Nature Methods. (2012) ;9: (8):815–8. Epub 2012/07/10. |
[18] | Ricard C , Debarbieux FC . Six-color intravital two-photon imaging of brain tumors and their dynamic microenvironment. Frontiers in Cellular Neuroscience. (2014) ;8: :57. Epub 2014/03/08. |
[19] | Zheng K , Bard L , Reynolds JP , King C , Jensen TP , Gourine AV , et al . Time-resolved imaging reveals heterogeneous landscapes of nanomolar Ca(2+) in neurons and astroglia. Neuron. (2015) ;88: (2):277–88. Epub 2015/10/24.20. |
[20] | Lam AJ , St-Pierre F , Gong Y , Marshall JD , Cranfill PJ , Baird MA , et al . Improving FRET dynamic range with bright green and red fluorescent proteins. Nature Methods. (2012) ;9: (10):1005–12. Epub 2012/09/11. |
[21] | Maysinger D , Ji J , Hutter E , Cooper E . Nanoparticle-based and bioengineered probes and sensors to detect physiological and pathological biomarkers in neural cells. Frontiers in Neuroscience. (2015) ;9: :480. Epub 2016/01/07. |
[22] | Ueda Y , Kwok S , Hayashi Y . Application of FRET probes in the analysis of neuronal plasticity. Frontiers in Neural Circuits. (2013) ;7: :163. Epub 2013/10/18. |
[23] | Byrne RD , Larijani B , Poccia DL . The use of two-photon FRET-FLIM to study protein interactions during nuclear envelope fusion In Vivo and In Vitro. Methods Mol Biol. (2016) ;1411: :123–32. Epub 2016/05/06. |
[24] | Drew PJ , Shih AY , Driscoll JD , Knutsen PM , Blinder P , Davalos D , et al . Chronic optical access through a polished and reinforced thinned skull. Nature Methods. (2010) ;7: (12):981–4. Epub 2010/10/23. |
[25] | Dorand RD , Barkauskas DS , Evans TA , Petrosiute A , Huang AY . Comparison of intravital thinned skull and cranial window approaches to study CNS immunobiology in the mouse cortex. Intravital. (2014) ;3: (2). Epub 2015/01/09. |
[26] | Farrar MJ , Bernstein IM , Schlafer DH , Cleland TA , Fetcho JR , Schaffer CB . Chronic in vivo imaging in the mouse spinal cord using an implanted chamber. Nature Methods. (2012) ;9: (3):297–302. Epub 2012/01/24. |
[27] | Fenrich KK , Weber P , Hocine M , Zalc M , Rougon G , Debarbieux F . Long-term in vivo imaging of normal and pathological mouse spinal cord with subcellular resolution using implanted glass windows. The Journal of Physiology. (2012) ;590: (16):3665–75. Epub 2012/05/30. |
[28] | Fenrich KK , Weber P , Rougon G , Debarbieux F . Implanting glass spinal cord windows in adult mice with experimental autoimmune encephalomyelitis. Journal of Visualized Experiments: JoVE. (2013) (83):e50826. Epub 2014/01/01. |
[29] | Taylor JM , Saunter CD , Love GD , Girkin JM , Henderson DJ , Chaudhry B . Real-time optical gating for three-dimensional beating heart imaging. Journal of Biomedical Optics. (2011) ;16: (11):116021. Epub 2011/11/25. |
[30] | Rohde GK , Dawant BM , Lin SF . Correction of motion artifact in cardiac optical mapping using image registration. IEEE Transactions on Bio-Medical Engineering. (2005) ;52: (2):338–41. Epub 2005/02/16. |
[31] | Koyanagi M , Kawakabe S , Arimura Y . A comparative study of colorimetric cell proliferation assays in immune cells. Cytotechnology. (2015) . Epub 2015/08/19. |
[32] | Singh Y , Dyson J , Garden OA . Use of SNARF-1 to measure murine T cell proliferation in vitro and its application in a novel regulatory T cell suppression assay. Immunology Letters. (2011) ;140: (1-2):21–9. Epub 2011/06/15. |
[33] | Tauskela JS , Hewitt K , Kang LP , Comas T , Gendron T , Hakim A , et al . Evaluation of glutathione-sensitive fluorescent dyes in cortical culture. Glia. (2000) ;30: (4):329–41. Epub 2000/05/08. |
[34] | Vandepitte J , Maes J , Van Cleynenbreugel B , Van Poppel H , Lerut E , Agostinis P , et al . An improved orthotopic rat bladder tumor model using Dil-loaded fluorescent AY-27 cells. Cancer Biology & Therapy. (2010) ;9: (12):986–93. Epub 2010/04/21. |
[35] | Stepanenko OV , Shcherbakova DM , Kuznetsova IM , Turoverov KK , Verkhusha VV . Modern fluorescent proteins: From chromophore formation to novel intracellular applications. BioTechniques. (2011) ;51: (5):313–4, 6, 8 passim. Epub 2011/11/08. |
[36] | Hadjantonakis AK , Macmaster S , Nagy A . Embryonic stem cells and mice expressing different GFP variants for multiple non-invasive reporter usage within a single animal. BMC Biotechnology. (2002) ;2: :11. Epub 2002/06/25. |
[37] | Lobe CG , Koop KE , Kreppner W , Lomeli H , Gertsenstein M , Nagy A . Z/AP, a double reporter for cre-mediated recombination. Developmental Biology. (1999) ;208: (2):281–92. Epub 1999/04/07. |
[38] | Livet J , Weissman TA , Kang H , Draft RW , Lu J , Bennis RA , et al . Transgenic strategies for combinatorial expression of fluorescent proteins in the nervous system. Nature. (2007) ;450: (7166):56–62. Epub 2007/11/02. |
[39] | Jiang R , Haustein MD , Sofroniew MV , Khakh BS . Imaging intracellular Ca(2)(+) signals in striatal astrocytes from adult mice using genetically-encoded calcium indicators. Journal of Visualized Experiments: JoVE. (2014) ;(93):e51972. Epub 2014/12/10. |
[40] | Gong Y . The evolving capabilities of rhodopsin-based genetically encoded voltage indicators. Current Opinion in Chemical Biology. (2015) ;27: :84–9. Epub 2015/07/06. |
[41] | Marvin JS , Borghuis BG , Tian L , Cichon J , Harnett MT , Akerboom J , et al . An optimized fluorescent probe for visualizing glutamate neurotransmission. Nature Methods. (2013) ;10: (2):162–70. Epub 2013/01/15. |
[42] | Yan H , He L , Zhao W , Li J , Xiao Y , Yang R , et al . Poly beta-cyclodextrin/TPdye nanomicelle-based two-photon nanoprobe for caspase-3 activation imaging in live cells and tissues. Analytical Chemistry. (2014) ;86: (22):11440–50. Epub 2014/10/28. |
[43] | Zecevic D , Djurisic M , Cohen LB , Antic S , Wachowiak M , Falk CX , et al . Imaging nervous system activity with voltage-sensitive dyes. Current protocols in neuroscience / editorial board, Jacqueline N Crawley [et al]. (2003) ;Chapter 6:Unit 6 17. Epub 2008/04/23.. |
[44] | Grienberger C , Konnerth A . Imaging calcium in neurons. Neuron. (2012) ;73: (5):862–85. Epub 2012/03/13. |
[45] | Knopfel T . Genetically encoded optical indicators for the analysis of neuronal circuits. Nature Reviews Neuroscience. (2012) ;13: (10):687–700. Epub 2012/08/31. |
[46] | Carandini M , Shimaoka D , Rossi LF , Sato TK , Benucci A , Knopfel T . Imaging the awake visual cortex with a genetically encoded voltage indicator. The Journal of Neuroscience: The Official Journal of the Society for Neuroscience. (2015) ;35: (1):53–63. Epub 2015/01/09. |
[47] | Chen TW , Wardill TJ , Sun Y , Pulver SR , Renninger SL , Baohan A , et al . Ultrasensitive fluorescent proteins for imaging neuronal activity. Nature. (2013) ;499: (7458):295–300. Epub 2013/07/23. |
[48] | Gomez Perdiguero E , Klapproth K , Schulz C , Busch K , Azzoni E , Crozet L , et al . Tissue-resident macrophages originate from yolk-sac-derived erythro-myeloid progenitors. Nature. (2015) ;518: (7540)547–51. Epub 2014/12/04. |
[49] | Alferink J , Lieberam I , Reindl W , Behrens A , Weiss S , Huser N , et al . Compartmentalized production of CCL17 in vivo: Strong inducibility in peripheral dendritic cells contrasts selective absence from the spleen. The Journal of Experimental Medicine. (2003) ;197: (5):585–99. Epub 2003/03/05. |
[50] | Lindquist RL , Shakhar G , Dudziak D , Wardemann H , Eisenreich T , Dustin ML , et al . Visualizing dendritic cell networks in vivo . Nature Immunology. (2004) ;5: (12):1243–50. Epub 2004/11/16. |
[51] | Faust N , Varas F , Kelly LM , Heck S , Graf T . Insertion of enhanced green fluorescent protein into the lysozyme gene creates mice with green fluorescent granulocytes and macrophages. Blood. (2000) ;96: (2):719–26. Epub 2000/07/11. |
[52] | Hume DA . Applications of myeloid-specific promoters in transgenic mice support in vivo imaging and functional genomics but do not support the concept of distinct macrophage and dendritic cell lineages or roles in immunity. Journal of Leukocyte Biology. (2011) ;89: (4):525–38. Epub 2010/12/21. |
[53] | Jung S , Aliberti J , Graemmel P , Sunshine MJ , Kreutzberg GW , Sher A , et al . Analysis of fractalkine receptor CX(3)CR1 function by targeted deletion and green fluorescent protein reporter gene insertion. Molecular and Cellular Biology. (2000) ;20: (11):4106–14. Epub 2000/05/11. |
[54] | Wolf Y , Yona S , Kim KW , Jung S . Microglia, seen from the CX3CR1 angle. Frontiers in Cellular Neuroscience. (2013) ;7: :26. Epub 2013/03/20. |
[55] | Fenrich KK , Weber P , Rougon G , Debarbieux F . Long- and short-term intravital imaging reveals differential spatiotemporal recruitment and function of myelomonocytic cells after spinal cord injury. The Journal of Physiology. (2013) ;591: (19):4895–902. Epub 2013/08/07. |
[56] | Feng G , Mellor RH , Bernstein M , Keller-Peck C , Nguyen QT , Wallace M , et al . Imaging neuronal subsets in transgenic mice expressing multiple spectral variants of GFP. Neuron. (2000) ;28: (1):41–51. Epub 2000/11/22. |
[57] | Ryu JK , Petersen MA , Murray SG , Baeten KM , Meyer-Franke A , Chan JP , et al . Blood coagulation protein fibrinogen promotes autoimmunity and demyelination via chemokine release and antigen presentation. Nature Communications. (2015) ;6: :8164. Epub 2015/09/12. |
[58] | Nikic I , Merkler D , Sorbara C , Brinkoetter M , Kreutzfeldt M , Bareyre FM , et al . A reversible form of axon damage in experimental autoimmune encephalomyelitis and multiple sclerosis. Nature Medicine. (2011) ;17: (4):495–9. Epub 2011/03/29. |
[59] | Sorbara CD , Wagner NE , Ladwig A , Nikic I , Merkler D , Kleele T , et al . Pervasive axonal transport deficits in multiple sclerosis models. Neuron. (2014) ;84: (6):1183–90. Epub 2014/12/01. |
[60] | Gonzalez S , Fernando R , Berthelot J , Perrin-Tricaud C , Sarzi E , Chrast R , et al . In vivo time-lapse imaging of mitochondria in healthy and diseased peripheral myelin sheath. Mitochondrion. (2015) ;23: :32–41. Epub 2015/06/03. |
[61] | Ben Arous J , Binding J , Leger JF , Casado M , Topilko P , Gigan S , et al . Single myelin fiber imaging in living rodents without labeling by deep optical coherence microscopy. Journal of Biomedical Optics. (2011) ;16: (11):116012. Epub 2011/11/25. |
[62] | Henry FP , Wang Y , Rodriguez CL , Randolph MA , Rust EA , Winograd JM , et al . In vivo optical microscopy of peripheral nerve myelination with polarization sensitive-optical coherence tomography. Journal of Biomedical Optics. (2015) ;20: (4):046002. Epub 2015/04/11. |
[63] | Farrar MJ , Wise FW , Fetcho JR , Schaffer CB . In vivo imaging of myelin in the vertebrate central nervous system using third harmonic generation microscopy. Biophysical Journal. (2011) ;100: (5):1362–71. Epub 2011/03/01. |
[64] | Lim H , Sharoukhov D , Kassim I , Zhang Y , Salzer JL , Melendez-Vasquez CV . Label-free imaging of Schwann cell myelination by third harmonic generation microscopy. Proceedings of the National Academy of Sciences of the United States of America. (2014) ;111: (50):18025–30. Epub 2014/12/03. |
[65] | Schain AJ , Hill RA , Grutzendler J . Label-free in vivo imaging of myelinated axons in health and disease with spectral confocal reflectance microscopy. Nature Medicine. (2014) ;20: (4):443–9. Epub 2014/04/01. |
[66] | Wang H , Fu Y , Zickmund P , Shi R , Cheng JX . Coherent anti-stokes Raman scattering imaging of axonal myelin in live spinal tissues. Biophysical Journal. (2005) ;89: (1):581–91. Epub 2005/04/19. |
[67] | Quarles RH , Macklin WB , Morell P . Myelin Formation, Structure and Biochemistry. In: Siegel GJ , Albers RW , Brady ST , Price DL , editor. Basic Neurochemistry: Molecular, Cellular and Medical Aspects 7th edition. New York: Academic Press Elsevier; (2006) . pp. 51–71. |
[68] | Min Y , Kristiansen K , Boggs JM , Husted C , Zasadzinski JA , Israelachvili J . Interaction forces and adhesion of supported myelin lipid bilayers modulated by myelin basic protein. Proceedings of the National Academy of Sciences of the United States of America. (2009) ;106: (9):3154–9. Epub 2009/02/17. |
[69] | Banquy X , Kristiansen K , Lee DW , Israelachvili JN . Adhesion and hemifusion of cytoplasmic myelin lipid membranes are highly dependent on the lipid composition. Biochimica et Biophysica Acta. (2012) ;1818: (3):402–10. Epub 2011/11/04. |
[70] | Husted CA , Matson GB , Adams DA , Goodin DS , Weiner MW . In vivo detection of myelin phospholipids in multiple sclerosis with phosphorus magnetic resonance spectroscopic imaging. Annals of Neurology. (1994) ;36: (2):239–41. Epub 1994/08/01. |
[71] | Lee DW , Banquy X , Kristiansen K , Kaufman Y , Boggs JM , Israelachvili JN . Lipid domains control myelin basic protein adsorption and membrane interactions between model myelin lipid bilayers. Proceedings of the National Academy of Sciences of the United States of America. (2014) ;111: (8):E768–75. Epub 2014/02/12. |
[72] | Laule C , Pavlova V , Leung E , Zhao G , MacKay AL , Kozlowski P , et al . Diffusely abnormal white matter in multiple sclerosis: Further histologic studies provide evidence for a primary lipid abnormality with neurodegeneration. Journal of Neuropathology and Experimental Neurology. (2013) ;72: (1):42–52. Epub 2012/12/18. |
[73] | Campagnola P . Second harmonic generation imaging microscopy: Applications to diseases diagnostics. Analytical Chemistry. (2011) ;83: (9):3224–31. Epub 2011/03/31. |
[74] | Winkler M , Jester B , Nien-Shy C , Massei S , Minckler DS , Jester JV , et al . High resolution three-dimensional reconstruction of the collagenous matrix of the human optic nerve head. Brain research Bulletin. (2010) ;81: (2-3):339–48. Epub 2009/06/16. |
[75] | Guc E , Fankhauser M , Lund AW , Swartz MA , Kilarski WW . Long-term intravital immunofluorescence imaging of tissue matrix components with epifluorescence and two-photon microscopy. Journal of Visualized Experiments: JoVE. (2014) (86). Epub 2014/05/07. |
[76] | Debarre D , Supatto W , Pena AM , Fabre A , Tordjmann T , Combettes L , et al . Imaging lipid bodies in cells and tissues using third-harmonic generation microscopy. Nature Methods. (2006) ;3: (1):47–53. Epub 2005/12/22. |
[77] | Zumbusch A , Holtom GR , Xie XS . Three-dimensional vibrational imaging by coherent anti-stokes raman scattering. Physical Review Letters. (1999) ;82: (20):4142–5. |
[78] | Fu Y , Huff TB , Wang HW , Wang H , Cheng JX . Ex vivo and in vivo imaging of myelin fibers in mouse brain by coherent anti-Stokes Raman scattering microscopy. Optics Express. (2008) ;16: (24):19396–409. Epub 2008/11/26. |
[79] | Wang H , Huff TB , Fu Y , Jia KY , Cheng JX . Increasing the imaging depth of coherent anti-Stokes Raman scattering microscopy with a miniature microscope objective. Optics Letters. (2007) ;32: (15):2212–4. Epub 2007/08/03. |
[80] | Belanger E , Henry FP , Vallee R , Randolph MA , Kochevar IE , Winograd JM , et al . In vivo evaluation of demyelination and remyelination in a nerve crush injury model. Biomedical Optics Express. (2011) ;2: (9):2698–708. Epub 2011/11/18. |
[81] | Imitola J , Cote D , Rasmussen S , Xie XS , Liu Y , Chitnis T , et al . Multimodal coherent anti-Stokes Raman scattering microscopy reveals microglia-associated myelin and axonal dysfunction in multiple sclerosis-like lesions in mice. Journal of Biomedical Optics. (2011) ;16: (2):021109. Epub 2011/03/03. |
[82] | Shi Y , Zhang D , Huff TB , Wang X , Shi R , Xu XM , et al . Longitudinal in vivo coherent anti-Stokes Raman scattering imaging of demyelination and remyelination in injured spinal cord. Journal of Biomedical Optics. (2011) ;16: (10):106012. Epub 2011/10/28. |
[83] | Huff TB , Shi Y , Sun W , Wu W , Shi R , Cheng JX . Real-time CARS imaging reveals a calpain-dependent pathway for paranodal myelin retraction during high-frequency stimulation. PloS One. (2011) ;6: (3):e17176. Epub 2011/03/11. |
[84] | Gasecka A , Daradich A , Dehez H , Piche M , Cote D . Resolution and contrast enhancement in coherent anti-Stokes Raman-scattering microscopy. Optics Letters. (2013) ;38: (21):4510–3. Epub 2013/11/02. |
[85] | de Vito G , Tonazzini I , Cecchini M , Piazza V . RP-CARS: Label-free optical readout of the myelin intrinsic healthiness. Optics Express. (2014) ;22: (11):13733–43. Epub 2014/06/13. |
[86] | Bioud F-Z , Gasecka P , Ferrand P , Rigneault H , Duboisset J , Brasselet S . Structure of molecular packing probed by polarization-resolved nonlinear four-wave mixing and coherent anti-Stokes Raman-scattering microscopy. Physical Review A. (2014) ;89: (1):013836. |
[87] | Begin S , Belanger E , Laffray S , Aube B , Chamma E , Belisle J , et al . Local assessment of myelin health in a multiple sclerosis mouse model using a 2D Fourier transform approach. Biomedical Optics Express. (2013) ;4: (10):2003–14. Epub 2013/10/25. |
[88] | Fu Y , Frederick TJ , Huff TB , Goings GE , Miller SD , Cheng JX . Paranodal myelin retraction in relapsing experimental autoimmune encephalomyelitis visualized by coherent anti-Stokes Raman scattering microscopy. Journal of Biomedical Optics. (2011) ;16: (10):106006. Epub 2011/10/28. |
[89] | Begin S , Dupont-Therrien O , Belanger E , Daradich A , Laffray S , De Koninck Y , et al . Automated method for the segmentation and morphometry of nerve fibers in large-scale CARS images of spinal cord tissue. Biomedical Optics Express. (2014) ;5: (12):4145–61. Epub 2015/01/13. |
[90] | Romanelli E , Sorbara CD , Nikic I , Dagkalis A , Misgeld T , Kerschensteiner M . Cellular, subcellular and functional in vivo labeling of the spinal cord using vital dyes. Nature Protocols. (2013) ;8: (3):481–90. Epub 2013/02/09. |
[91] | Ylera B , Erturk A , Hellal F , Nadrigny F , Hurtado A , Tahirovic S , et al . Chronically CNS-injured adult sensory neurons gain regenerative competence upon a lesion of their peripheral axon. Current Biology: CB. (2009) ;19: (11):930–6. Epub 2009/05/05. |
[92] | Fu Y , Wang H , Shi R , Cheng JX . Second harmonic and sum frequency generation imaging of fibrous astroglial filaments in ex vivo spinal tissues. Biophysical Journal. (2007) ;92: (9):3251–9. Epub 2007/02/13. |
[93] | Meyer T , Baumgartl M , Gottschall T , Pascher T , Wuttig A , Matthaus C , et al . A compact microscope setup for multimodal nonlinear imaging in clinics and its application to disease diagnostics. The Analyst. (2013) ;138: (14):4048–57. Epub 2013/05/02. |
[94] | Helmchen F , Denk W , Kerr JN . Miniaturization of two-photon microscopy for imaging in freely moving animals. Cold Spring Harbor Protocols. (2013) ;2013: 10 904–13. Epub 2013/10/03. |
[95] | Lecoq J , Savall J , Vucinic D , Grewe BF , Kim H , Li JZ , et al. Visualizing mammalian brain area interactions by dual-axis two-photon calcium imaging. Nature Neuroscience. (2014) ;17: (12):1825–9. Epub 2014/11/18. |
[96] | Emiliani V , Cohen AE , Deisseroth K , Hausser M . All-Optical Interrogation of Neural Circuits. The Journal of Neuroscience: The Official Journal of the Society for Neuroscience. (2015) ;35: (41):13917–26. Epub 2015/10/16. |
Figures and Tables
Fig.1
Schematic representation of the two-photon microscopy setup. The excitation beam is produced by a femtosecond pulsed infrared tunable (720–1020 nm) laser. The laser power is modulated by an Acousto-Optic Modulator (AOM). The beam is scanned in the xy direction by galvanometric mirrors present in the scan head of a Zeiss LMS 7 MP two-photon microscope. The beam then passes through a LP690 dichroic mirror and is focused in the brain of the anaesthetized animal by a 20X-1.0 NA water immersion objective. The emitted epifluorescence is collected and reflected by the LP690 mirror in a non-descanned mode. The fluorescence is finally splitted and filtered using a set of dichroic mirrors and filters and collected by a set of 5 non-descanned detectors mounted in cascade (NDD). The characteristics of the dichroic mirrors and filters are depicted on the scheme.
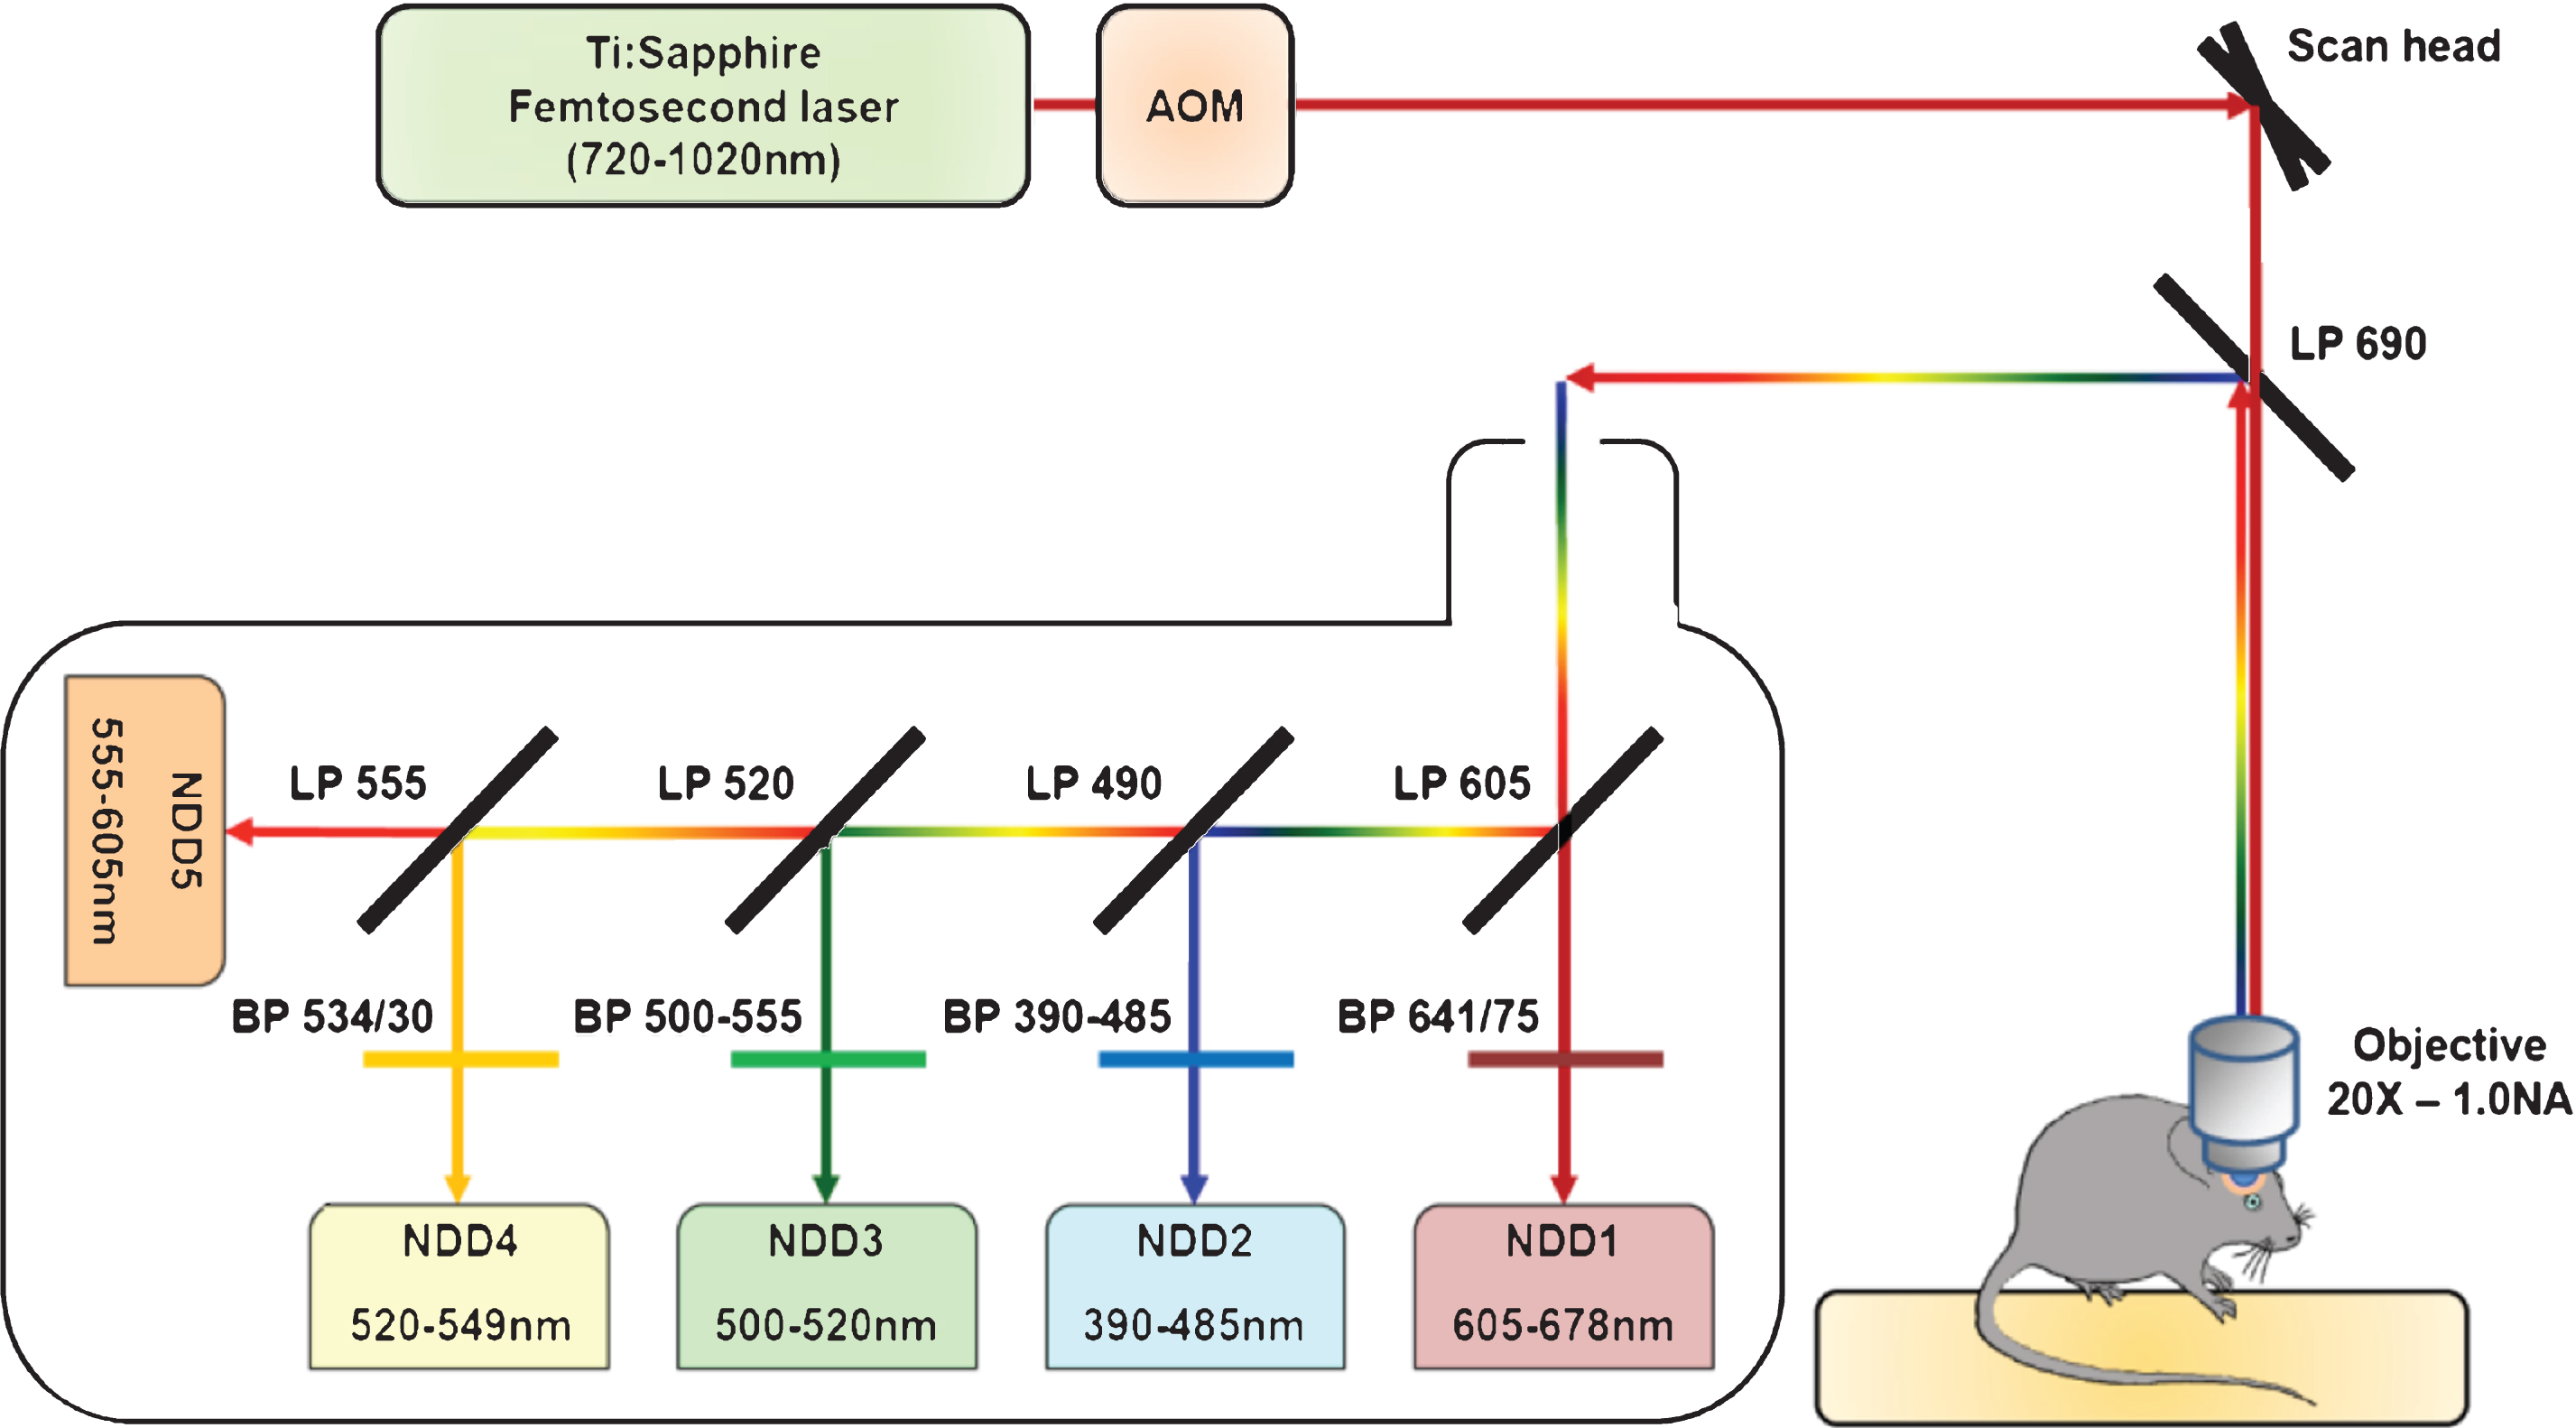
Fig.2
Five-color intravital two-photon imaging of glioblastoma tumor and its dynamic environment. Upper panel: fluorescent mice. (A) 5-colors tile scan (3 × 3 images) of the GBM and its microenvironment; inset: macroscopic image of the cranial window with the area covered by the tile scan (large white square) and the area covered by a single plane acquisition (small dotted square). (B) Orthogonal reconstructions obtained from a stack acquired from 0 to 300 μm below the glass coverslip with a z-step of 3 μm. Each YZ image shows the maximum intensity projection over 10 microns along the X axis. (Note in B the vertical orientation of major brain vessels; dotted lines: the levels of xy-sections. (C) Apical dendrites GFP positive of neurons are visible (arrows). Also note the SHG signal (magenta) corresponding to the collagen fibers at the level of the dura-mater. CD11c-positive cells (yellow) have invaded the tumor but not surrounding healthy tissues. (D, E) xy-sections taken at 45 μm and 145 μm below the glass coverslip. Colors: blue: vasculature, cyan: astrocytes, green: neurons, yellow: CD11c-positive cells, magenta: SHG signal (dura-mater), red: tumor cells. Scale bars: 100 μm (adapted from Ref.18).
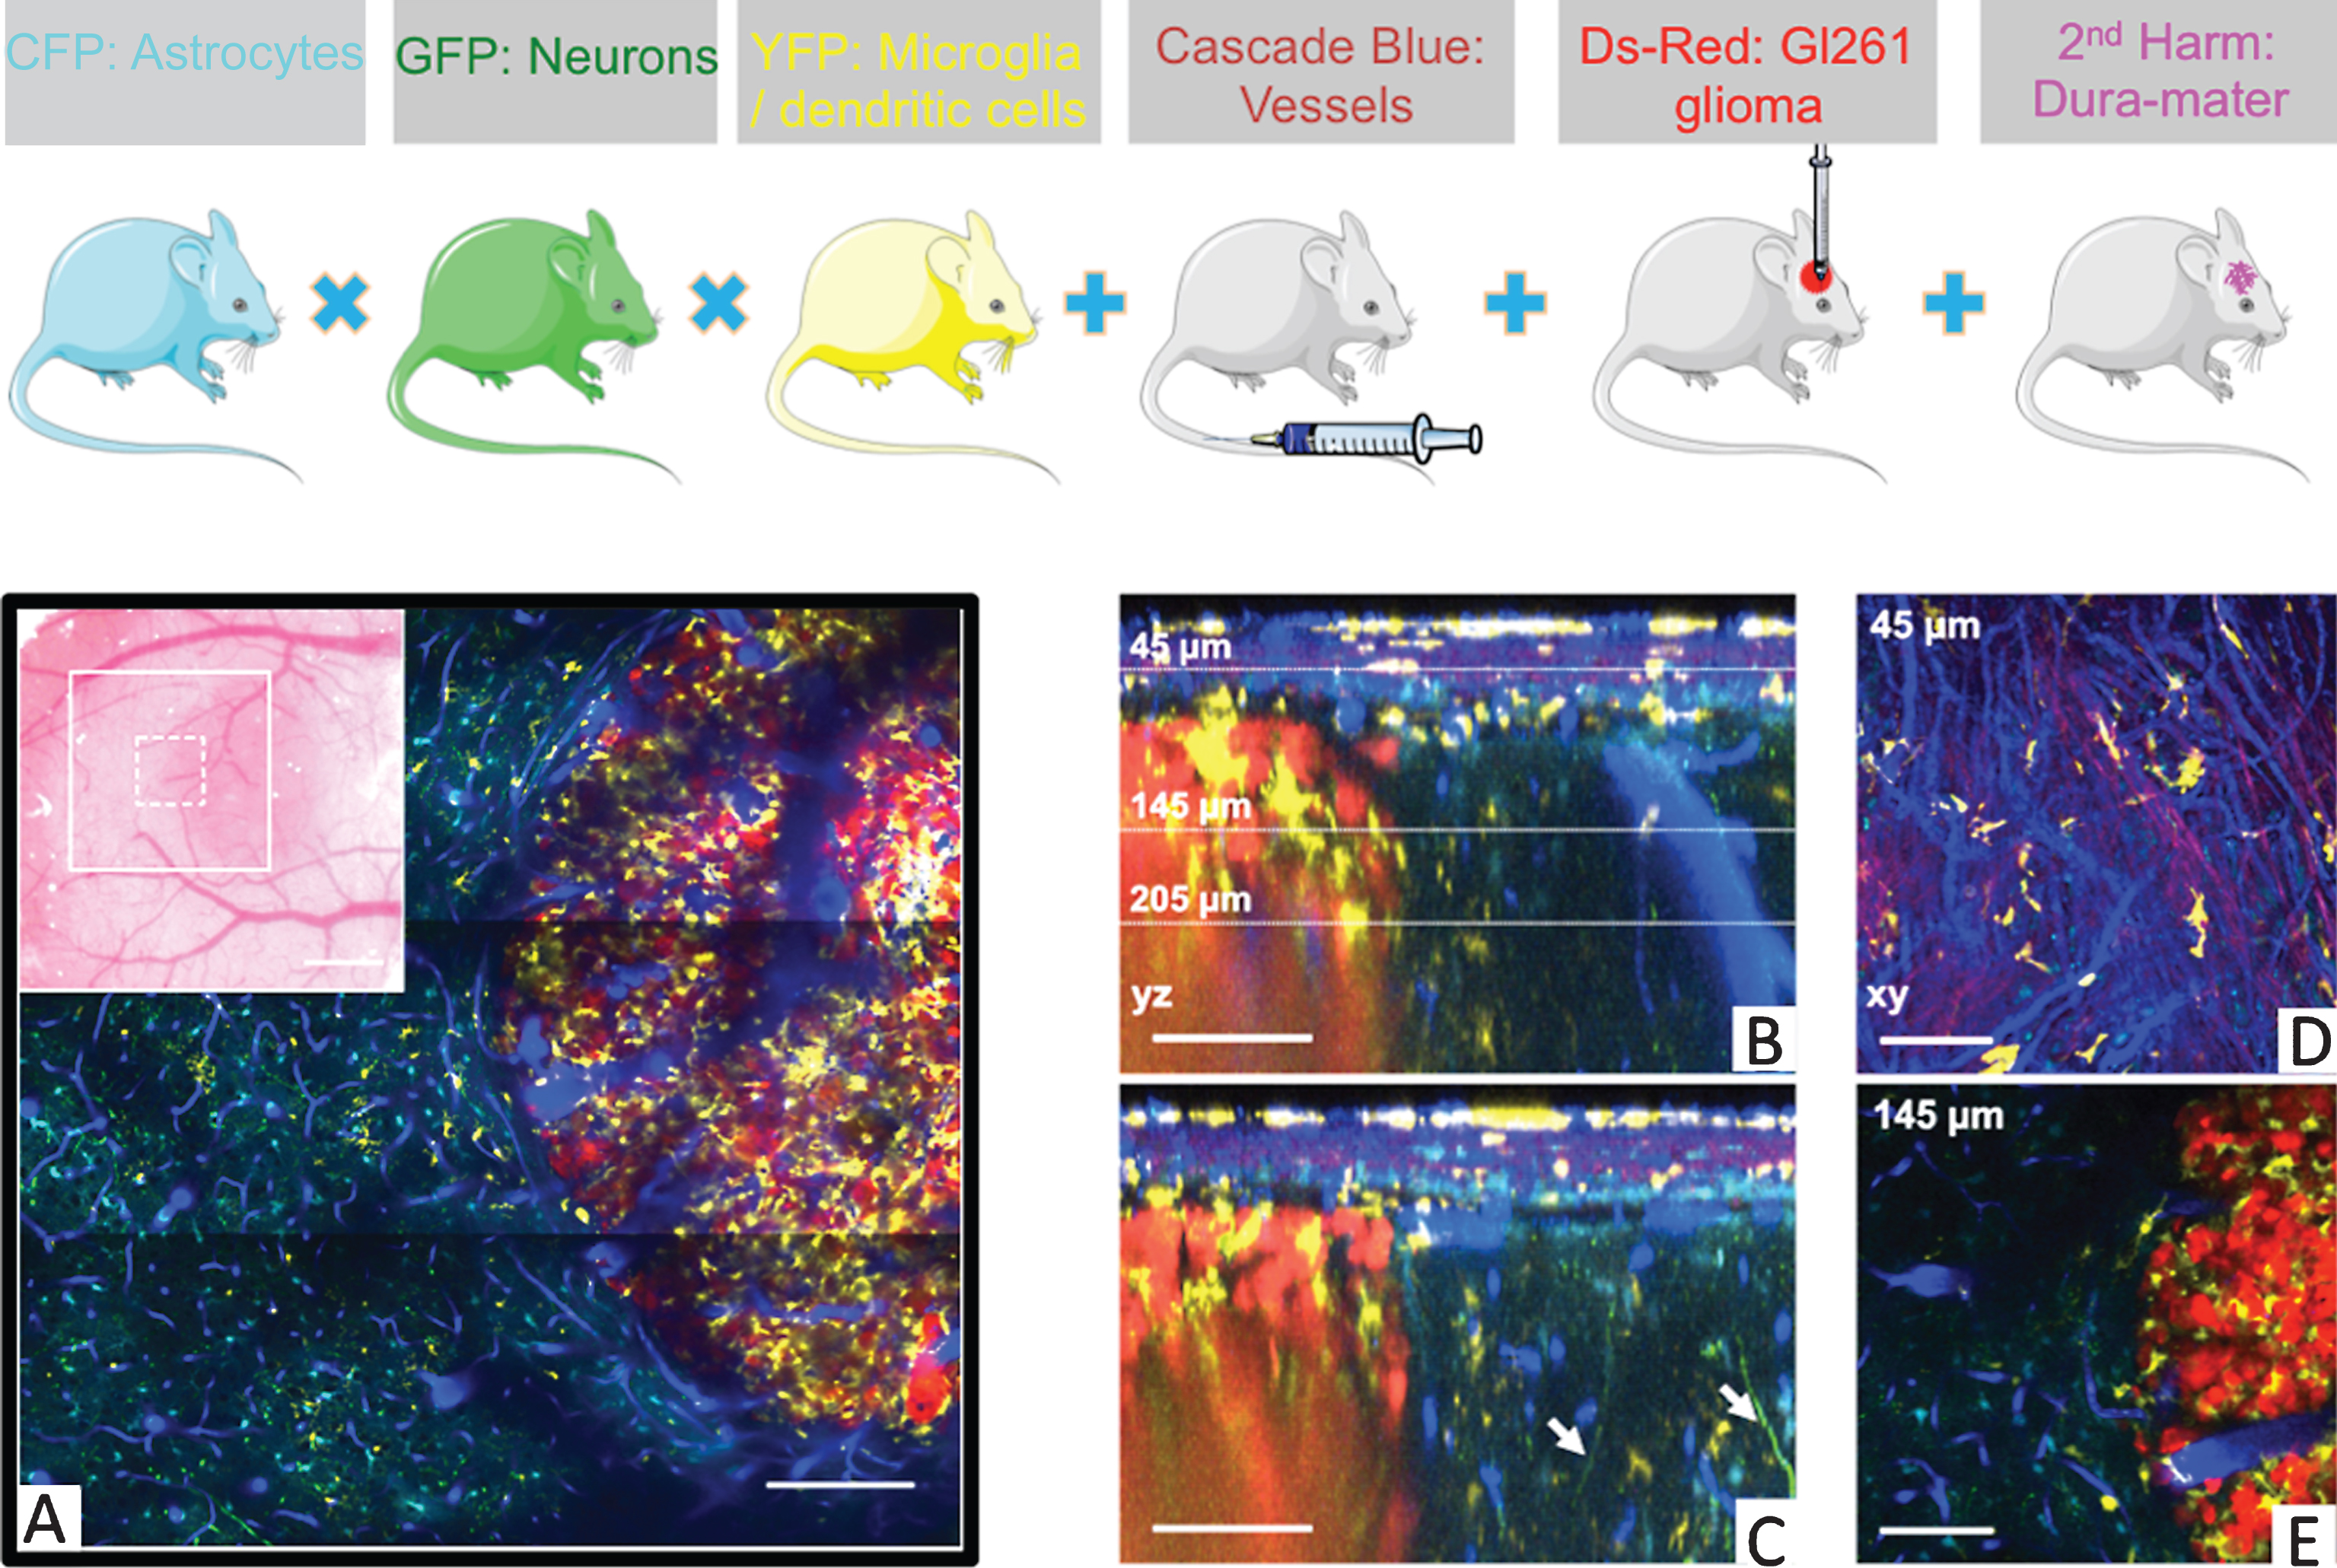
Fig.3
Spinal glass window for long term recurrent imaging of the spinal cord. Upper panel (right) Detailed view of spinal glass window. The edges of the vertebrae are shaped so that the window rests on both sides of the vertebral opening without compressing the spinal cord. Kwik-Sil is used as a physical barrier preventing the infiltration of opaque tissue between the window and spinal cord. Upper panel (left) Image of an anaesthetized mouse with an implanted window. The window structure is being supported by a clamp attached to a plastic base. The animal is freely breathing while in the support, but the window remains stationary relative to the clamp. Lower panel: Long-term spinal cord integrity after glass window implantation. Recurrent imaging sessions (from day 0 to day 350) of the same region of a Thy1-CFP mouse spinal cord after using Rhodamine– Dextran to visualize the vascular compartment. Note that individual axons can be followed for approximately one year. Scale bar, 50 μm; Excitation wavelength 945 nm (adapted from Ref. 27).
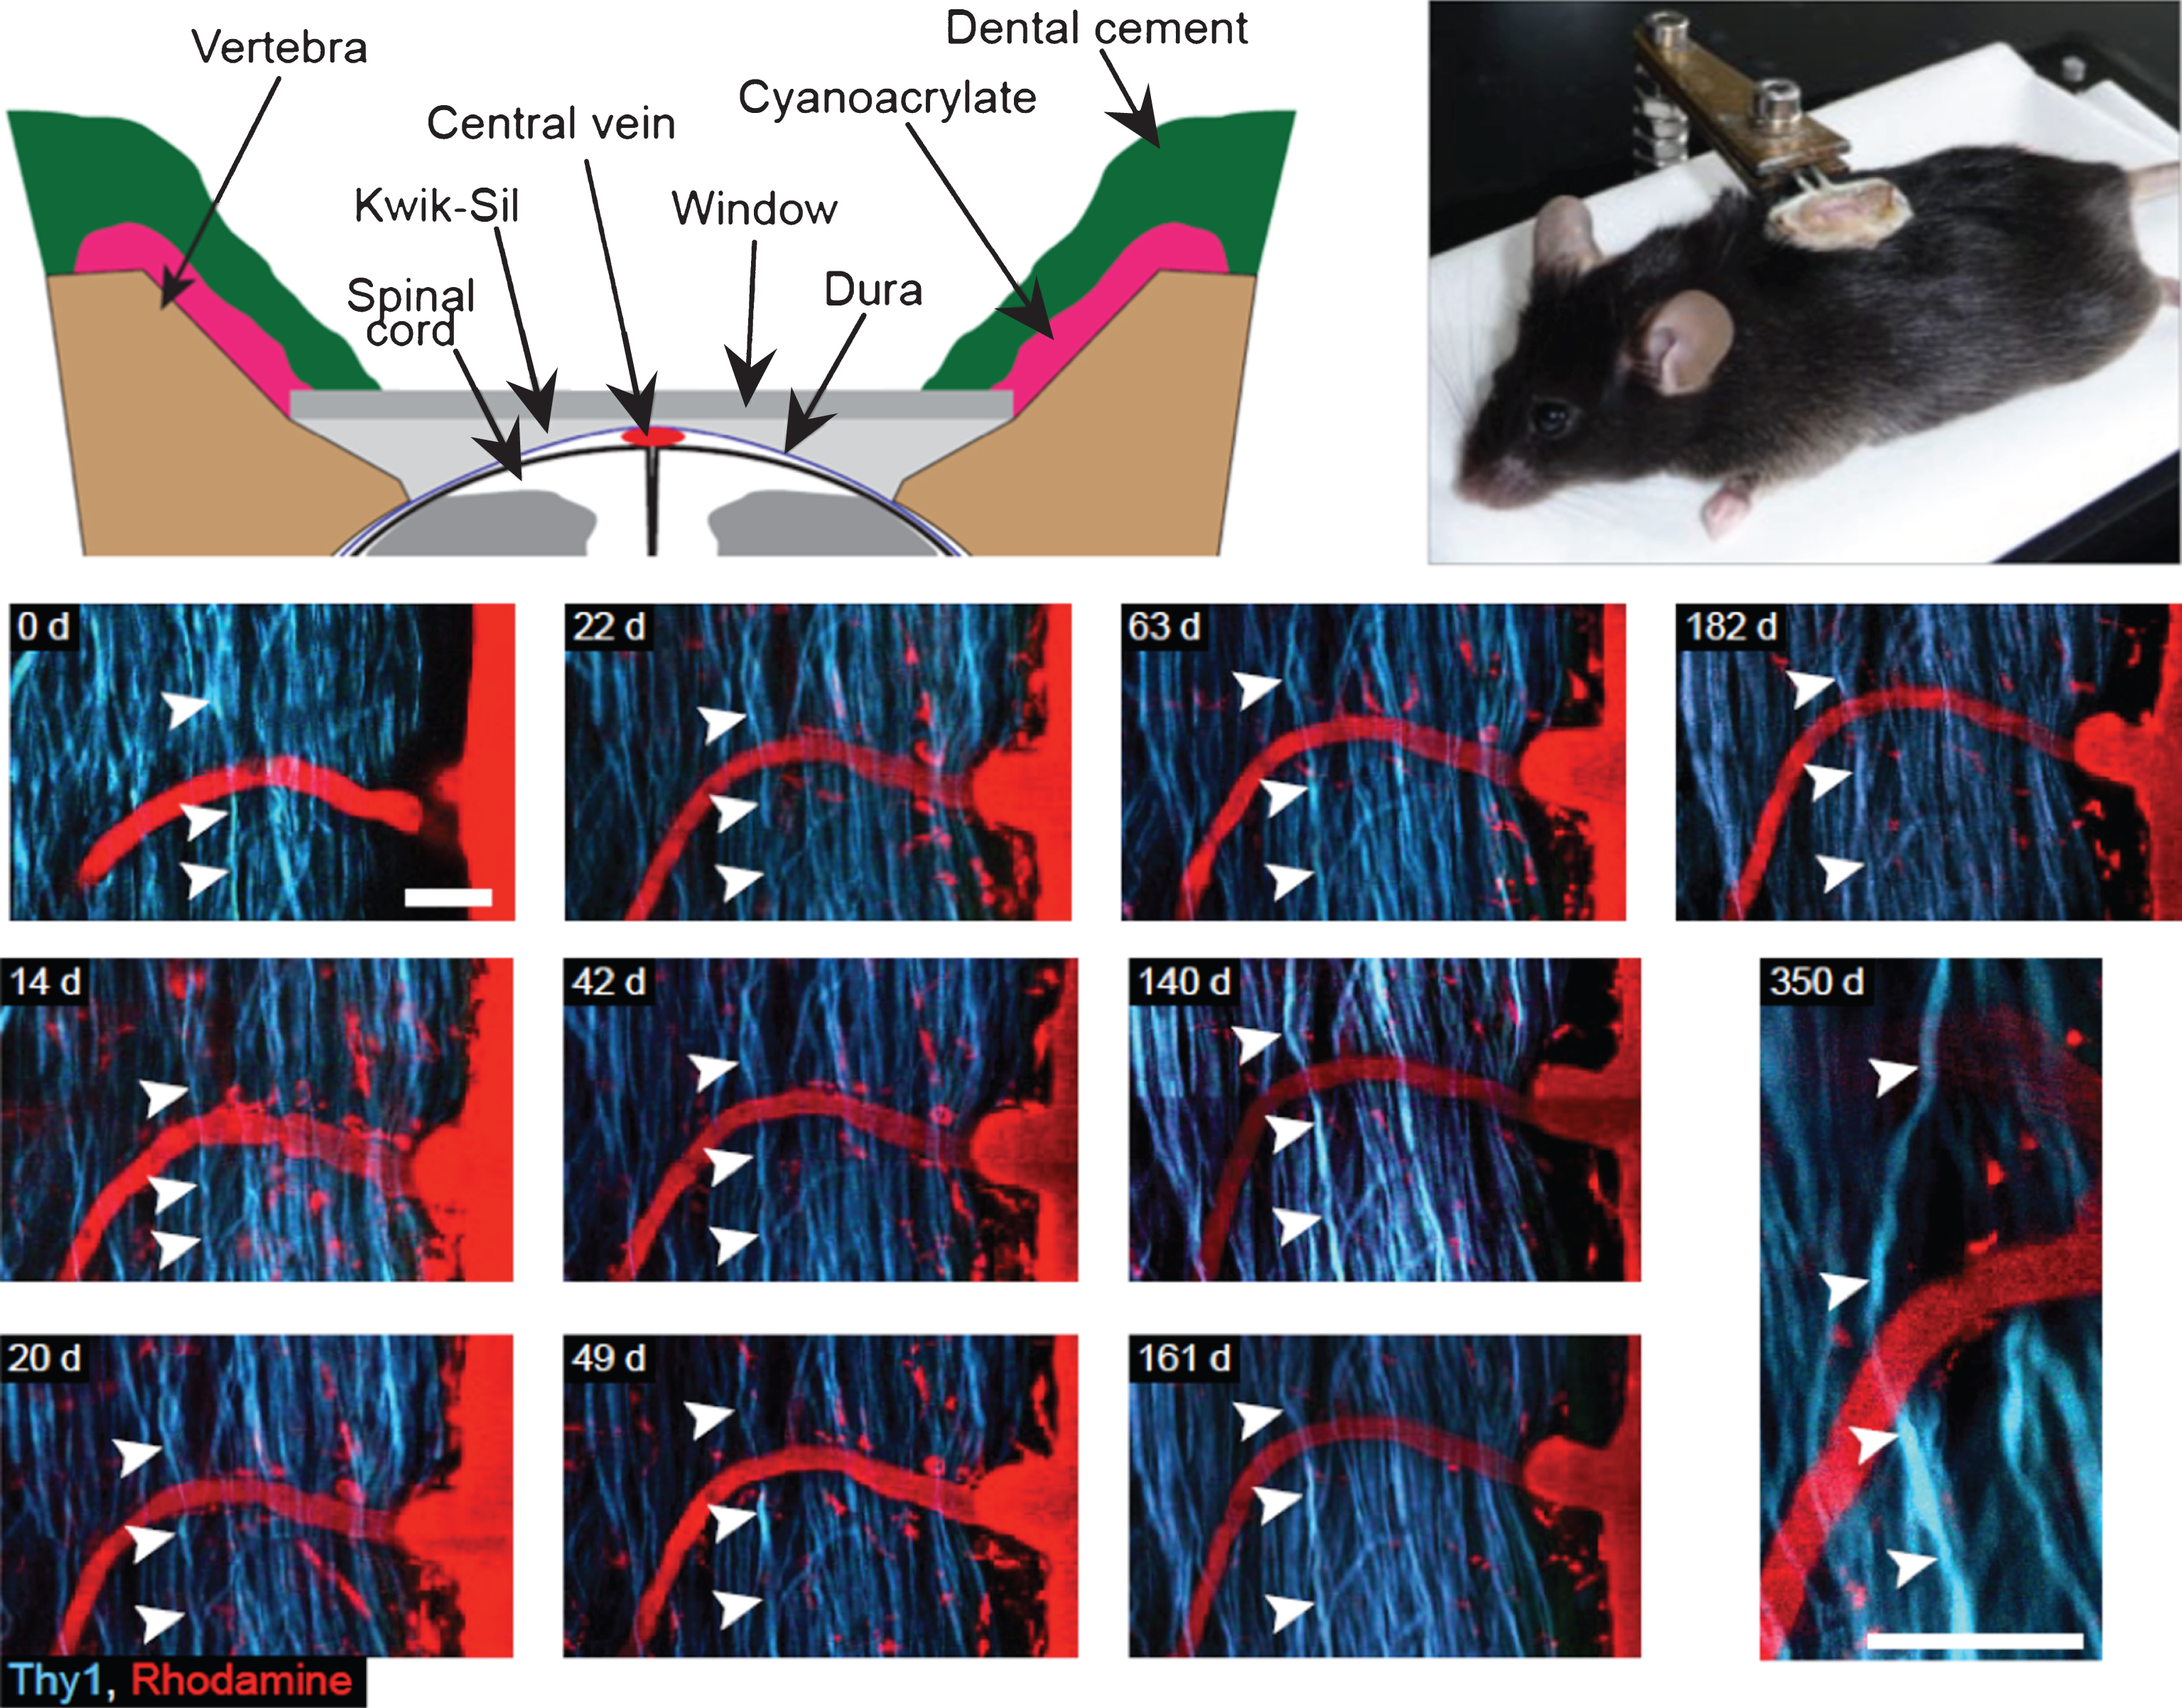
Fig.4
Time series showing cellular events occurring after spinal cord injury: (A) time-series images (60 min) of a LysM positive cell (arrow) that formed a close apposition with an injured axon with a tortuous morphology and irregular swellings (arrowhead). (B) time-series (9 h) images of a CD11c positive cell undergoing cell division at 3 days post-injury. (C) two-photon image stack near a lesion site showing LysM positive cells and CD11c positive cells with amoeboid morphology and containing CFP positive vacuoles (arrows) at 4 and 6 days post-injury, respectively. Thy1-CFP dorsal column axons, LysM-GFP recruited peripheral myeloid cells, CD11c-EYFP microglial cells, QDot655 in blood vessels and second harmonic generation (SHG) from collagen in dura mater. Scale bars: 20 μm. (adapted from Ref. 55).
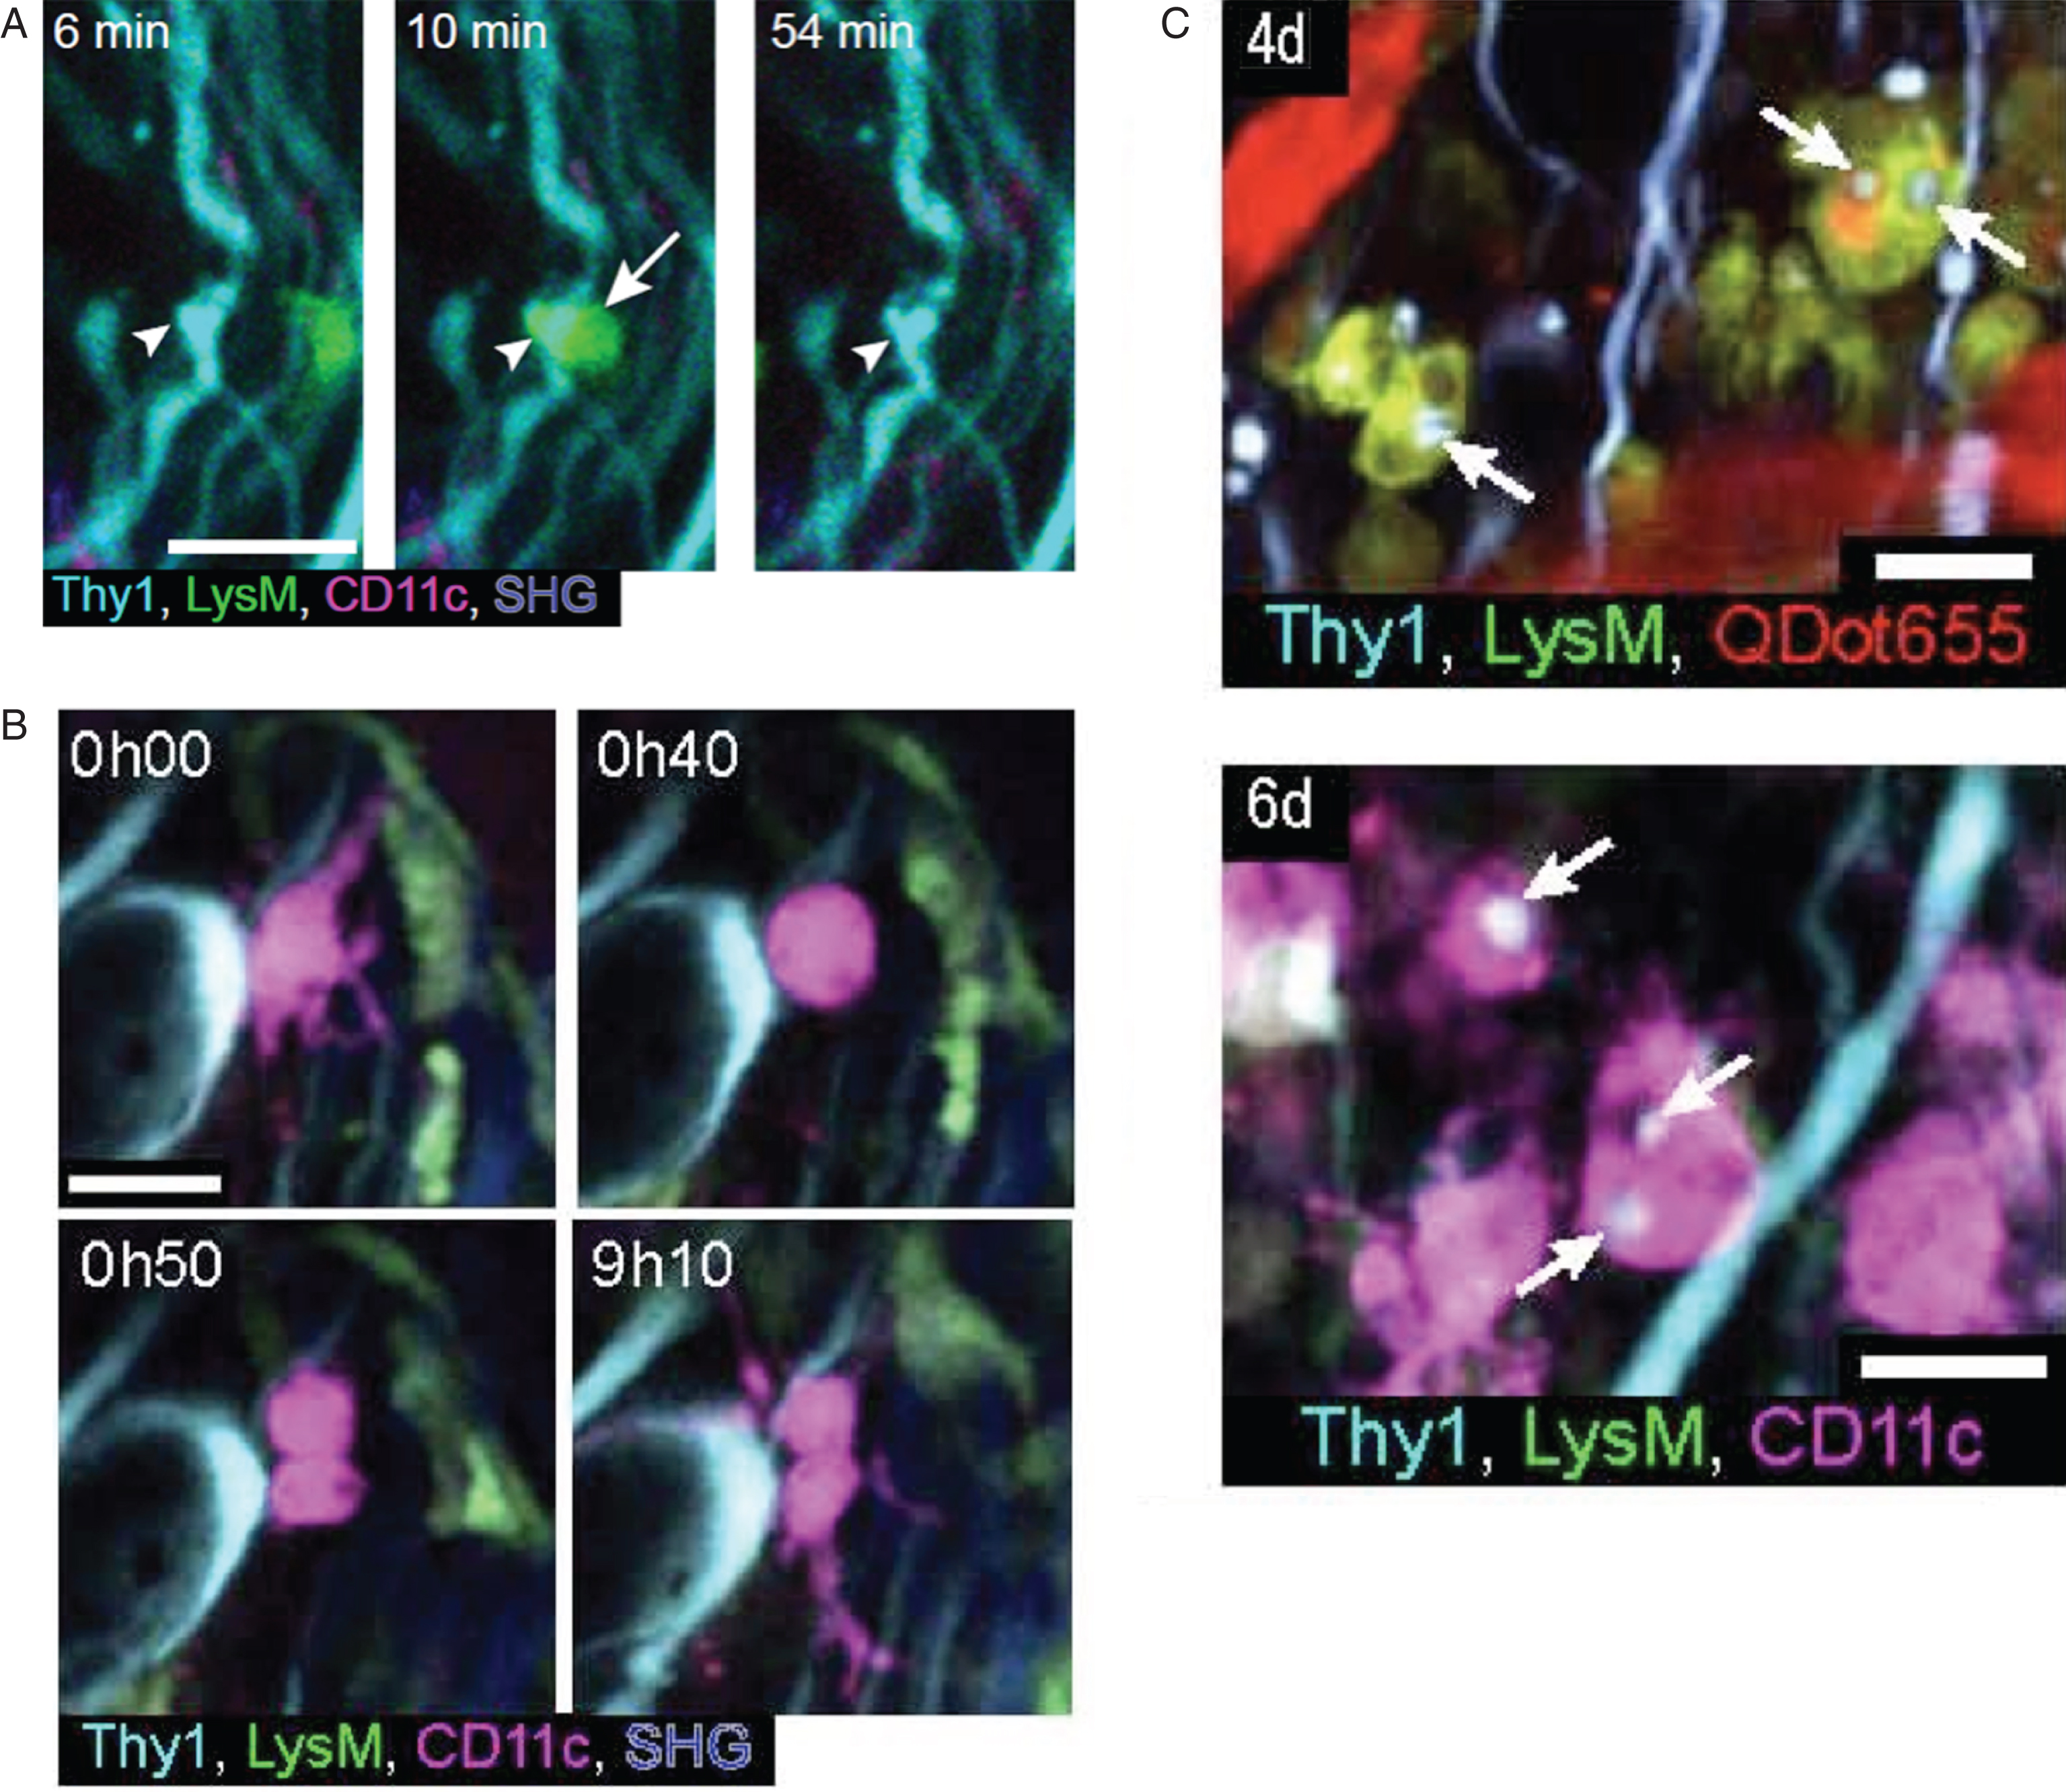
Fig.5
In vivo of Organelle Transport in neuroinflammatory lesions (A) In vivo two-photon image of the spinal cord of a control Thy1 -YFP-16 × Thy1-MitoCFP-P mouse (top) and a Thy1-YFP-16 × Thy1-MitoCFP-P mouse 2 days after onset of EAE (bottom; axons, white; nuclei labeled by in vivo application of Nuclear-ID Red, red; mitochondrial channel not shown). (B) Magnified views of axons from neuroinflammatory lesions illustrating different stages of axon morphology (N, axon from a control mouse; normal-appearing axon within an inflammatory lesion and swollen axon within an inflammatory lesion. (C and D) In vivo two-photon time-series images of control axons (top) and stage 0 axons imaged 2 days after onset of EAE (bottom) with moving mitochondria (C), in Thy1-YFP-16 × Thy1-MitoCFP-P mice, and peroxisomes (D), in Thy1-OFP-3 × Thy1-PeroxiYFP-376 mice, represented as pseudo-colored overlays (lines represent tracks during the indicated time period). Note that anterograde transport is more significantly affected than retrograde transport (adapted with requested permission from Ref. 58).
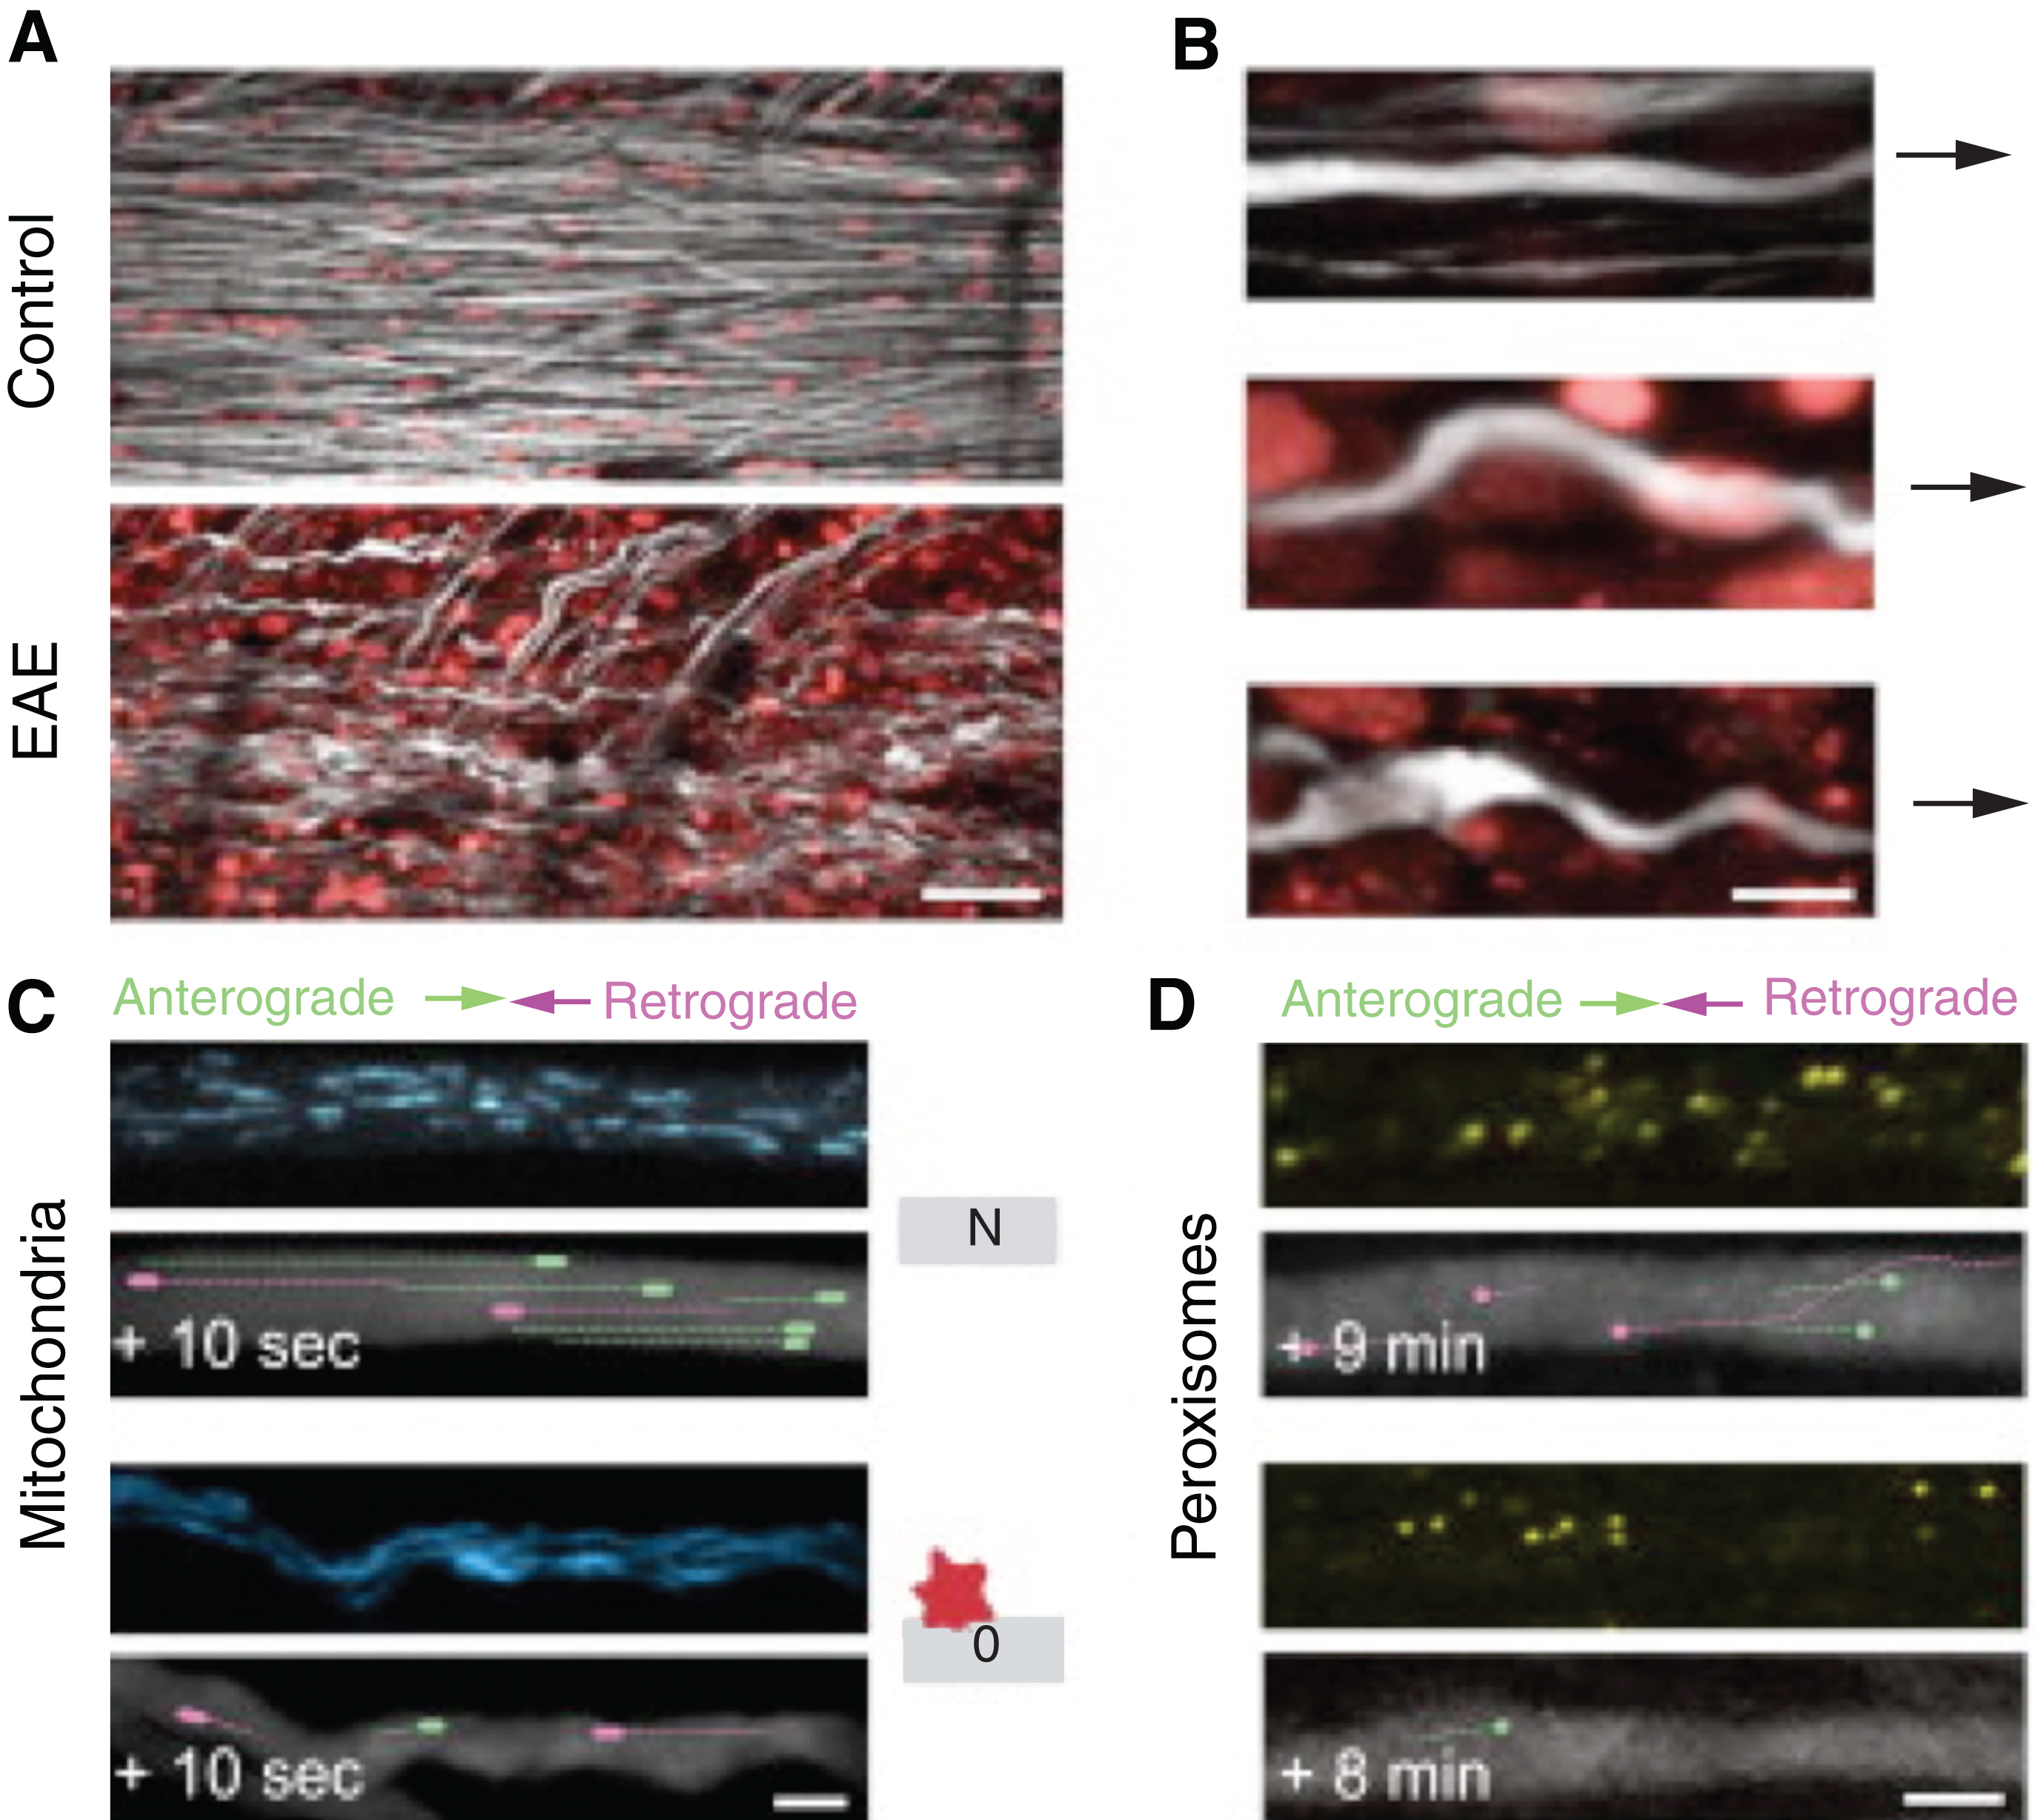
Fig.6
Simultaneous SHG and THG imaging-intact murine sciatic nerves ex vivo and in vivo. (A) Simultaneous SHG and THG imaging of ex vivo tissue. (Scale bar, 50 μm.) (B and C) Regions corresponding to the colored frames in A. The axons marked by asterisk (*) and double asterisks (**) are shown at higher magnification in D and E, respectively, focused at the level of the abaxonal membrane. Cajal bands (red arrowheads) and appositions (green arrows) are visible. The images of D and E are displayed on logarithmic intensity scales for easier identification. (G) Imaging of in vivo tissue. (Scale bar, 30 μm.) (Lower) High-magnification view containing a node (arrow). (adapted from Ref. 64 with requested permission.).
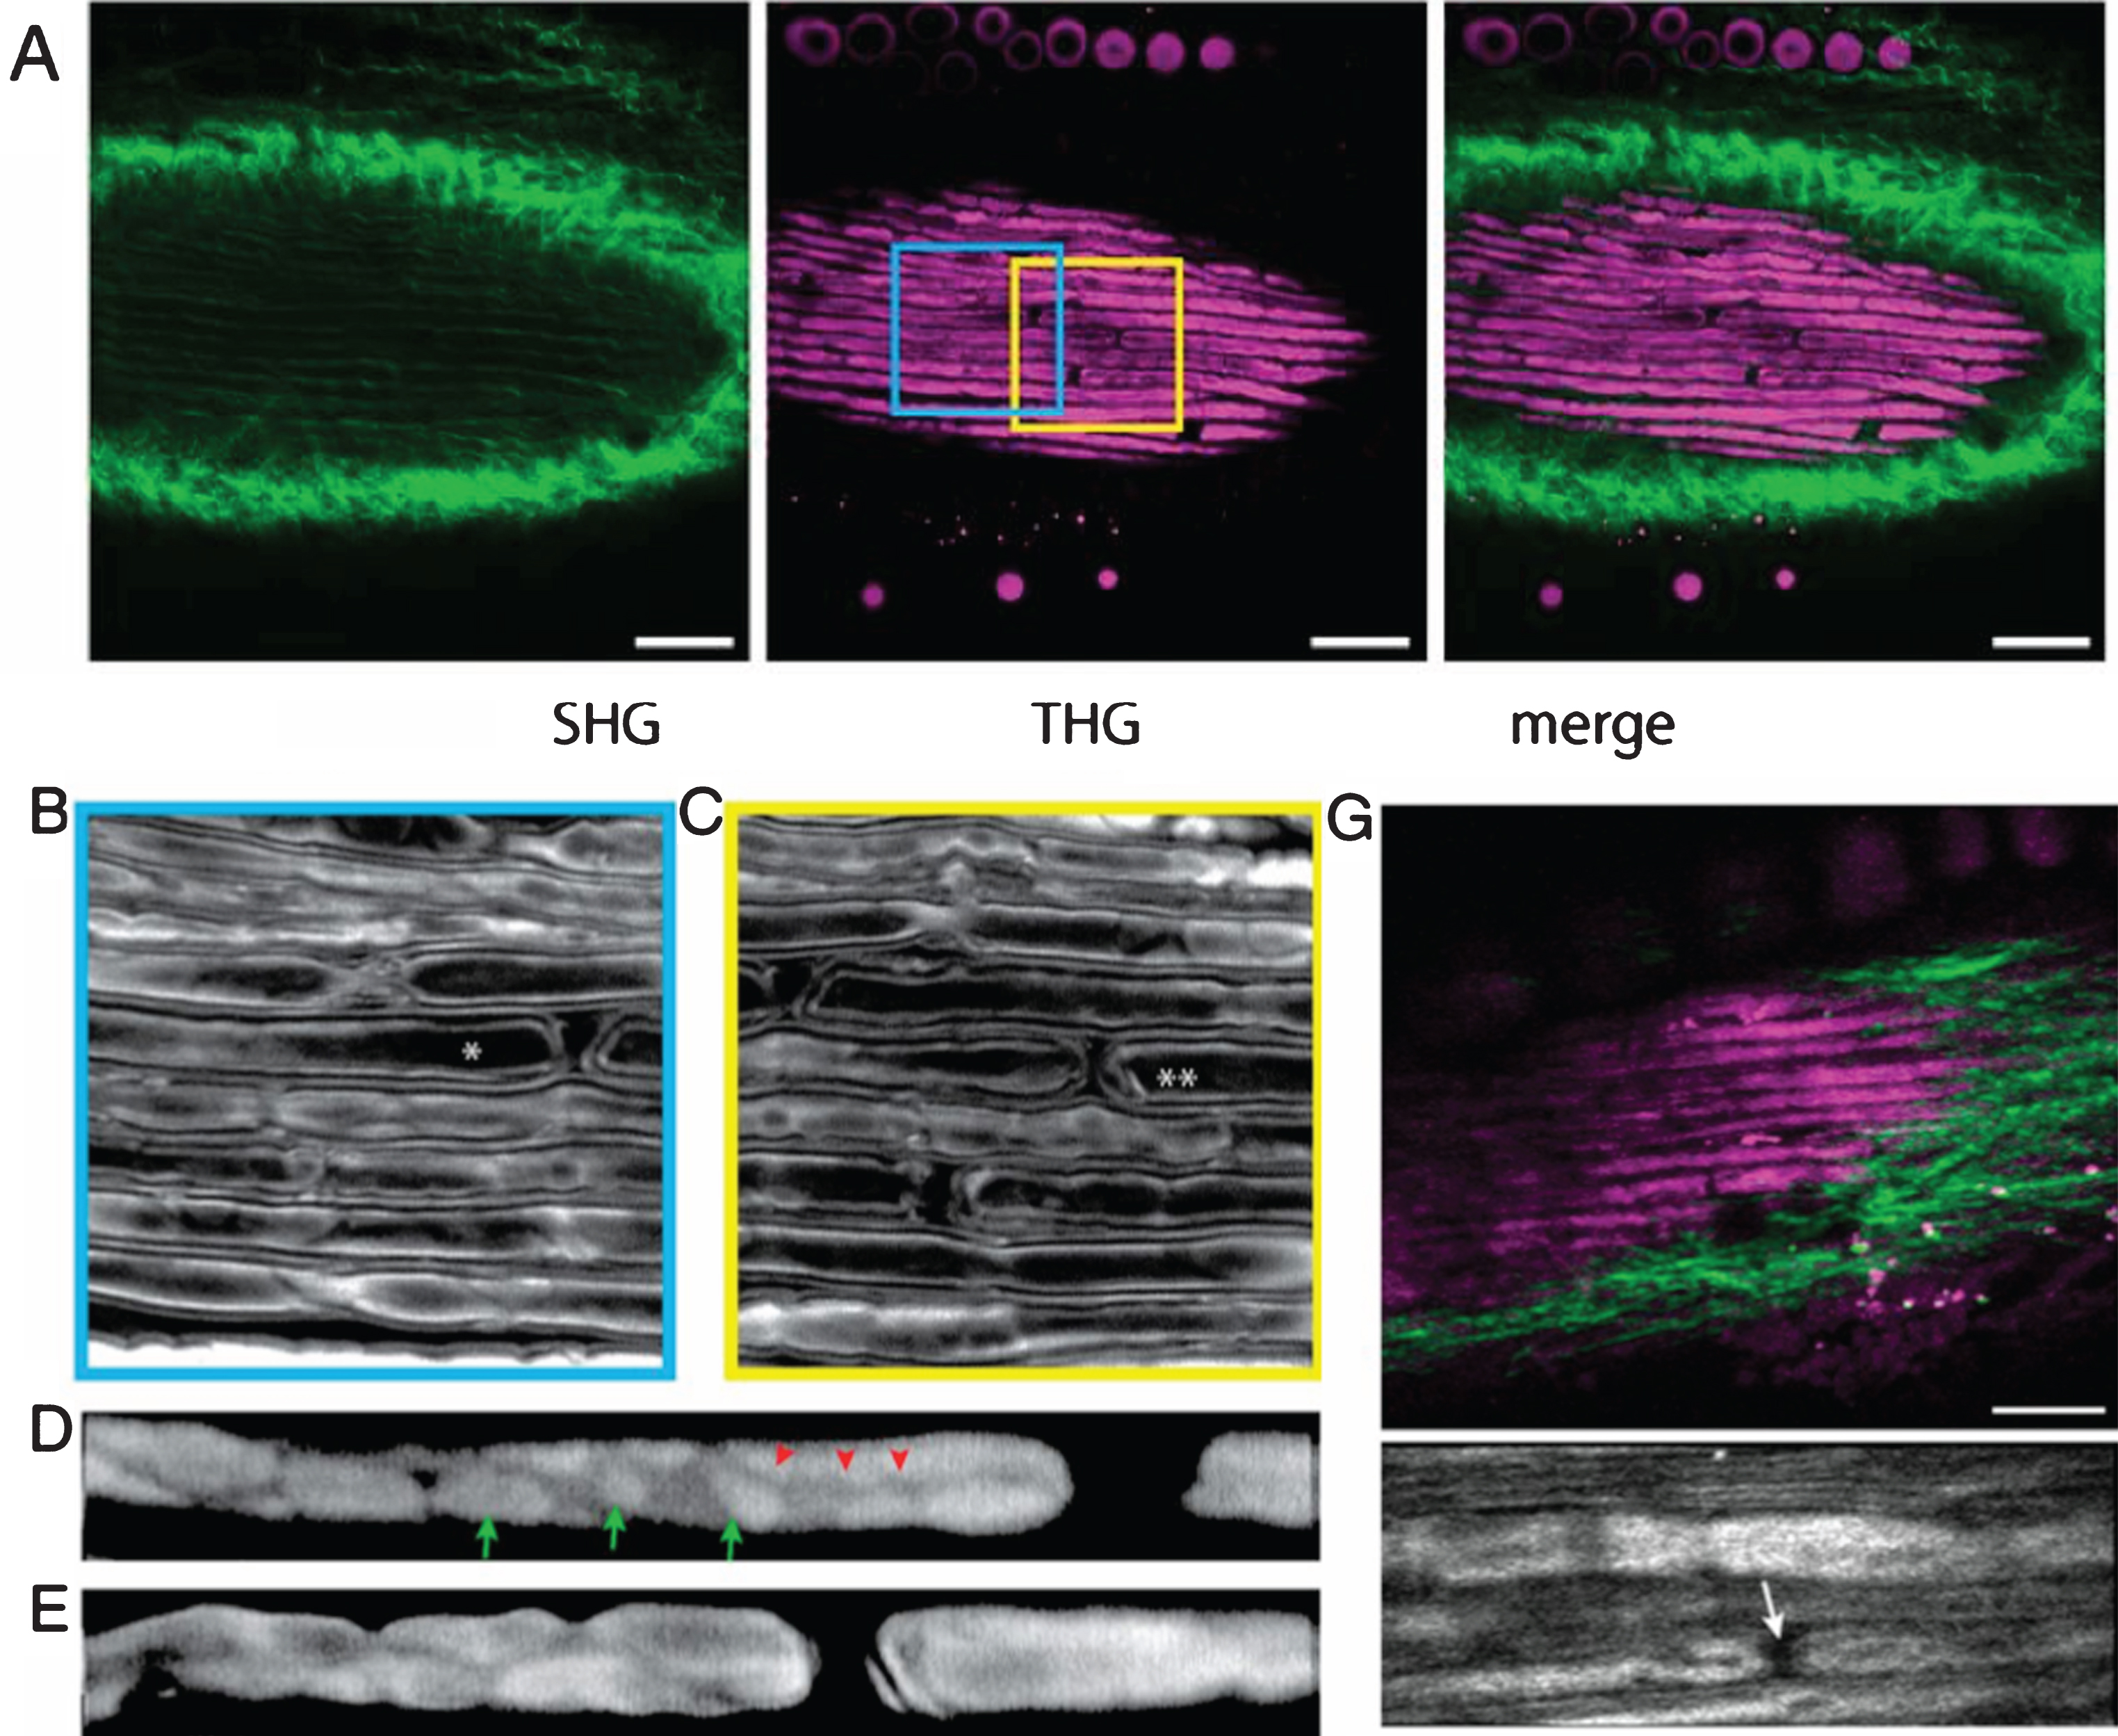
Table 1
Excitation and emission wavelengths of commonly used fluorescent dyes
| Visualization molecules | Abbreviation | 2 Photon excitation | Conventional excitation | Emission |
| Fluorescent proteins, jellyfish-derived | eBFP | 780 | 380 | 440 |
| eCFP | 860–920 | 433 | 475 | |
| eGFP | 880–930 | 488 | 509 | |
| eYFP | 960 | 513 | 527 | |
| Fluorescent proteins; coral-derived | Kaede (before conversion) | 730 | 508 | 518 |
| Kaede (after conversion) | 730 | 572 | 582 | |
| tdTomato | 900–1000 | 554 | 581 | |
| DsRed | 930–990 | 558 | 583 | |
| mCherry | 760 or 900–1000 | 587 | 610 | |
| Chemical dyes | CMF2HC | 780–800 | 371 | 464 |
| CFSE | 780–820 | 492 | 517 | |
| CMFDA | 800 | 492 | 517 | |
| FITC | 780–800 | 494 | 520 | |
| CMTMR | 780–820 | 541 | 565 | |
| SNARF | 700–810 | 563 | 639 | |
| CMTPX | 780–800 | 577 | 602 | |
| Texas Red | 780–920 | 595 | 615 | |
| Calcium indicator | Indo-1 | 700 | 346 | 475 |
| Fura-2 | 700–850 | 363 | 512 | |
| Fura-4F | 700–850 | 366 | 511 | |
| Fluo-5N | 800 | 520 | 475 | |
| Organelle visualization | Hoechst | 780 | 350 | 461 |
| DAPI | 700 | 358 | 461 | |
| FM 1–43 | 830 | 480 | 565 | |
| Rhodamine 123 | 780–860 | 507 | 529 | |
| Dil | 700 | 549 | 565 | |
| Sulforhodamine 101 | 840–890 | 586 | 605 | |
| DiD | 780 | 644 | 665 |

