
An Association Study of Germline Variants in Bladder Cancer-Related Genes with the Prognosis of Non-Muscle Invasive Bladder Cancer
Abstract
BACKGROUND:
Various germline genetic variants are associated with the prognosis of non-muscle invasive bladder cancer (NMIBC). Germline variants in genes frequently somatically mutated in bladder cancer have not been studied thoroughly in relation to risk of recurrence or progression in NMIBC.
OBJECTIVE:
To identify germline DNA variants in bladder carcinogenesis-related genes associated with recurrence or progression in NMIBC.
METHODS:
We analysed associations between single-nucleotide polymorphisms (SNPs) and NMIBC recurrence and progression using data from the Nijmegen Bladder Cancer Study (NBCS, 1,443 patients). We included 5,053 SNPs within 46 genes known to have mutation, overexpression or amplification in bladder cancer. We included all recurrences in the statistical analysis and performed both single variant analysis and gene-based analysis. SNPs and genes that showed significant or suggestive association (false discovery rate P value < 20%) were followed-up in independent cohorts for replication analysis, through eQTL analysis and tests for association of tumour expression levels with NMIBC recurrence and progression.
RESULTS:
Single variant analysis showed no statistically significant associations with recurrence or progression. In gene-based analysis, the aggregate effect of the 25 SNPs in the Cyclin D1 gene (CCND1) was statistically significantly associated with NMIBC recurrence (Punadj = 0.001, PFDR = 0.046), but not with progression (Punadj = 0.17, PFDR = 0.54). Validation analysis in independent cohorts did not confirm the association of CCND1 with NMIBC recurrence.
CONCLUSIONS:
We could not identify reproducible associations between common germline variants in bladder carcinogenesis-related genes and NMIBC recurrence or progression.
INTRODUCTION
Approximately 75% of bladder cancer patients are diagnosed with non-muscle invasive bladder cancer (NMIBC) [1], which has a favourable 5-year disease-specific survival of 85–90%, but is characterized by a high risk of multiple tumour recurrences and risk of progression to muscle-invasive bladder cancer (MIBC) [2]. As a consequence, patients need regular follow-up cystoscopies for surveillance and treatment of recurrences (transurethral resection of bladder tumour (TURBT)). The rate of recurrence amongst NMIBC patients varies widely, with some patients experiencing many and frequent recurrences, whilst others remain recurrence-free for the rest of their lives [2, 3].
Tumour multiplicity, size and prior recurrence have been reported to be the most important predictors for NMIBC recurrence [3], whereas stage, associated carcinoma in situ (CIS) and grade are the most important predictors for progression [4]. There are also suggestions that NMIBC prognosis can be affected by lifestyle choices [5].
The role of germline genetic variants in NMIBC prognosis has gained attention over the last years. Genetic variation in the sonic hedgehog pathway has been reproducibly linked to NMIBC recurrence risk [6]. A study by Grotenhuis et al. tested associations between germline genetic variants previously reported to be associated with NMIBC prognosis, however, none of the 114 evaluated variants could be replicated after adjustment for multiple testing [7]. More recently, we conducted a meta-analysis of genome-wide association studies (meta-GWAS) to detect germline DNA variants associated with risk of recurrence or progression in NMIBC [8]. We found variants in G2E3 and SCFD1 that were genome-wide significantly associated with recurrence-free survival (RFS) and twelve other SNPs showed suggestive association with RFS. We subsequently confirmed that expression of SCFD1 was associated with RFS in data from the UROMOL study [9].
In recent years, several studies have described the somatic mutation profile of NMIBC [9, 10]. FGFR3 and TERT are the most frequently mutated oncogenes for bladder cancer [10, 11]. Other genes that are frequently mutated in NMIBC are RAS-genes and PIK3CA [12, 13]. Note that germline SNPs in both FGFR3 and TERT have been associated with bladder cancer risk [14, 15]. With regard to NMIBC outcome, a common germline genetic variant in the TERT promotor, rs2853669, may modify the effects of somatic mutations in the TERT promotor region on RFS [16]. Somatic mutations in PIK3CA have been associated with reduced risk of recurrence and improved disease-specific survival [17, 18]. Ward et al. reported associations between mutations in RXRA, RHOB and TERT with recurrence-free survival [13]. Having a mutation in at least one of the genes FGFR3, TP53, PIK3CA, CKN2A, HRAS, KRAS, ERBB2, VHL, MLL or MET was associated with increased risk of progression [19], and gene expression levels of RXRA and FGFR3 were associated with recurrence-free survival [20]. Nevertheless, in our meta-GWAS for NMIBC prognosis, common germline variants in genes that often show somatic mutations in bladder cancer were not among the top signals. Also, these genes have not been thoroughly studied in germline candidate gene studies.
Here, we investigated the association of NMIBC recurrence and progression with common germline DNA variants in 46 genes that exhibit somatic mutation, amplification or overexpression in bladder cancer. We included all potential recurrences that a patient might experience in statistical analysis of recurrence risk, to increase power and avoid the bias of only including the initial recurrence (usually reported as recurrence-free survival (RFS)) [21].
MATERIALS AND METHODS
Study population
Patient data were retrieved from the Nijmegen Bladder Cancer Study (NBCS). In the NBCS, patients diagnosed with bladder cancer in seven hospitals in the mid-east of the Netherlands were identified through the National Cancer Registry held by the Netherlands Comprehensive Cancer Organisation (IKNL). In 2007, the NBCS started with the identification of urothelial bladder carcinoma (UBC) patients aged under 75 years and diagnosed between 1995–2006 and invited them to participate. Three additional cohorts of patients diagnosed later (2006–2008, 2008-2009 and 2009-2010) were invited in January 2009, November 2010 and February 2012 respectively. In total, 66% of the invitees participated. The date of diagnosis, stage, grade and focality of the primary tumour and all recurrent tumours were recorded. The study was approved by the research ethics committee (CMO Arnhem-Nijmegen, approval number 2005/315). All participants provided informed consent.
Genotyping and quality control
All patients were genotyped using Illumina OmniExpress-12 and -24 chips and imputed to higher SNP density using 1000 Genomes and Genome of the Netherlands [22] as reference panels. After imputation, we excluded SNPs with 1) a minor allele frequency (MAF) < 0.05, 2) Hardy-Weinberg Equilibrium P-value < 10-5, or 3) an IMPUTE2 imputation info score < 0.8. More details about the imputation and quality control pipeline are provided in supplement 1.
Candidate genes
We used three gene panels to select candidate bladder cancer genes: 1) the UROseek panel, which comprises 11 genes that include the most common genetic alterations in bladder cancer [19]; 2) a 29-gene panel with genes involved in bladder carcinogenesis because of activating mutations or overexpression, which is derived from the analysis of The Cancer Genome Atlas and recent literature [20]; and 3) a 23-gene panel to detect somatic mutations that are involved in UBC pathogenesis [13]. The three gene panels comprise 46 unique autosomal genes, four of which were included in all three gene panels (HRAS, ERBB2, FGFR3, PIK3CA) (see supplemental information for all genes). All SNPs located in the genes and its 10 kb surrounding region that met the inclusion criteria were extracted from the genetic data (gene locations based on NCBI build 37.p13), resulting in 5,053 SNPs (647 directly genotyped, 4,406 imputed). The median number of SNPs in the genes was 76 (range: 2–412).
Outcome definitions
The start of the follow-up is marked by the date of the primary TURBT. Recurrences are defined as a new, histologically confirmed bladder or prostatic urethra tumour following at least one tumour-negative urethrocystoscopy (UCS) or following two surgical resection attempts for the previous bladder tumour (usually a TURBT and radical re-TURBT). The date of progression was defined as the first date at which there was a transition from low-grade to high-grade disease, or an increase in T stage, N stage or M stage. Cystectomy for therapy-resistant or “uncontrollable” disease was also coded as progression. More details about definitions are included in the supplemental information.
Statistical analysis
Choice of statistical model
Progression-free survival was analysed using a Cox proportional hazards (CoxPH) model. We selected the Gap Time - Unrestricted (GT-UR) model for analysis of the associations of the SNPs with all NMIBC recurrences. The GT-UR model is an extension of the CoxPH model that is commonly used to study survival or prognostic outcomes. The difference between both models is that the GT-UR model can model all recurrences that a patient might experience, whereas the CoxPH model can only model the time to first recurrence and ignores all subsequent recurrences. A lognormal frailty term was included in the GT-UR model to account for the fact that the recurrences that occur within a patient are correlated.
The GT-UR model tests for associations between SNPs and recurrences using gap time as a time scale. This means that the time between the removal of the previous tumour and the subsequent recurrence is used as outcome, essentially ‘resetting’ the time to zero after every recurrence that a patient experiences.
The GT-UR model is based on the same assumptions as the CoxPH model. In addition, the GT-UR model assumes a constant effect of genetic variants on recurrence rate for all recurrences.
In the analysis of recurrences, the hazard ratio (HR) derived from a GT-UR model has a different interpretation compared to the HR from a CoxPH model. The HR from the GT-UR model denotes the modified recurrence risk for any recurrence from the previous recurrence/primary tumour onwards, whereas the HR from the CoxPH model denotes the modified recurrence risk for the first recurrence, from the diagnosis of the primary tumour onwards. The latter interpretation also holds for hazard ratios obtained from the CoxPH model in analyses of progression. Note that risk of progression can not be analyzed using the GT-UR model, since there can only be one event of progression.
The coxph function of the R package ‘survival’ v3.2-13 was used for analysis of progression, the coxme function of the R package ‘coxme’ v2.2-16 was used for analysis of recurrences. More information on model options in recurrent event analysis and our model selection procedure can be found in the supplemental information.
Single SNP analysis
We performed SNP analysis (i.e. test each SNP individually for association) based on the additive genotype model where the presence of an alternative allele is counted as 1, i.e. patients homozygous for the reference allele are classified as 0, heterozygous patients as 1, and patients homozygous for the alternative allele as 2. We also investigated the potential effect of clinical variables, namely age, sex, stage and grade of recurrences. The adjustment for these variables did not change the effect estimates of SNPs on NMIBC recurrence or progression, so we did not include these covariates in the final analysis. To adjust for multiple testing, a false discovery rate threshold (FDR) of 5% was used.
Gene-based analysis
We also performed gene-based analysis to test the aggregated association between all SNPs that are present within a single gene with recurrence and progression. First, we constructed - for every gene separately - the principal components based on all SNPs that are present in that gene and the 10kb surrounding region. Next, we selected the top principal components that explained > 99.9% of the genetic variation in the gene. These principal components summarize the information that is present in all the SNPs within a gene. These were then modelled together in the CoxPH model or GT-UR model for their effect on NMIBC progression or recurrences, respectively. For statistical significance testing, we used a likelihood ratio test (LRT) to assess the effect of genetic variation within the gene on tumour recurrence or progression. To adjust for multiple testing, again an FDR of 5% was used.
Validation analysis
SNPs and genes that were statistically significantly or suggestively associated with NMIBC recurrence or progression (FDR < 20%) were validated in independent cohorts. Only one gene, CCND1, fulfilled this condition in the analysis of recurrences. For this gene, we tested the association of gene expression in tumour tissue with recurrence-free survival in data from the UROMOL study [9], consisting of 535 NMIBC patients.
In addition, we investigated the associations of SNPs in CCND1 with tumour gene expression (eQTL analysis). The SNP data of CCND1 in the UROMOL cohort comprised 29 SNPs within the 10kb window of CCND1 in 320 NMIBC patients. In total, 19 SNPs were included in analysis after filtering out SNPs at a MAF less than 0.05, and 318 NMIBC patients remained eligible for analysis after removing patients with a missing genotype rate greater than 5%. The 19 SNPs in CCND1 were tested for association with CCND1 expression using a linear regression, and their statistical significance was assessed at an FDR adjusted P value smaller than 0.05. The aggregate effect of germline genetic variation in CCND1 on CCND1 expression was also tested using a linear principal component regression, which includes the top principal components that explain > 99.9 percent of the genetic variation in CCND1.
Finally, we validated the association of CCND1 with recurrence-free survival using summary statistics from our recently published meta-GWAS on NMIBC prognosis, which included data from the following cohorts: the Bladder Cancer Prognosis Programme (BCPP, Birmingham; N = 684), two cohorts from the Genito-Urinary BioBank (GUB-1, GUB-2, Toronto, Canada; N = 353 and 432, respectively), and biobanked case series from the University of Sheffield (Sheffield, UK; N = 244) and the Hospital Clínic of Barcelona (Barcelona, Spain; N = 238) [8]. We excluded results of the NBCS from the meta-GWAS results to achieve independent validation. The association between CCND1 and RFS was assessed using gene-based analysis performed in MAGMA software, as available in the web-based platform FUMA [23, 24]. The analysis in MAGMA included 9 SNPs in CCND1 in 1,271 individuals in total.
RESULTS
Patient characteristics
In total, 1,443 patients who experienced 1,864 recurrences and 167 progression events were included in the analysis. Patient and tumour characteristics at primary diagnosis, for progression and for the first to fourth recurrence are displayed in Table 1. Median follow-up time (i.e. time between TURBT of the primary tumour and end of follow-up) was 4.1 years (interquartile range: 2.6–6.7 years). In the NBCS, the 1-year Kaplan Meier (KM) risk of progression was 3%; the 5-year KM risk of progression was 14%. In total, 709 patients reported at least one recurrence before they reached the end of follow-up. Among them, 392 patients reported a total of 1,155 recurrences after the first recurrence, which are included in our analyses but would have been ignored in a traditional CoxPH model. The 1-year Kaplan Meier (KM) risk of first recurrence after primary TURBT was 24%; the 5-year Kaplan Meier risk of first recurrence was 53%. The second recurrence had a 1-year KM risk of 33% and a 5-year KM risk of 65%, the third recurrence had a 1-year KM risk of 39% and a 5-year KM risk of 78%. These recurrence risks are based on time from previous recurrence onwards and are based on the study population that had one resp. two recurrences. These populations are frailer to tumour recurrences, which leads to higher recurrence risks. An overview of recurrence patterns stratified into prognostic risk groups is displayed in Fig. 1. Note that patients in high-risk prognostic groups underwent more radical therapies (e.g. cystectomy) compared to the low-risk groups, which lead to shorter follow-up time and less recurrences.
Fig. 1
Recurrence patterns in individuals per prognostic group in the Nijmegen Bladder Cancer Study. Every layer away from the centre represents a new recurrence, the circle in the middle represents the characteristics of the primary tumour. Prognostic risk groups were assessed using a modified version of EAU prognostic risk categories, as not all clinical data were available [2]. Risk groups are defined in supplemental document 1.
![Recurrence patterns in individuals per prognostic group in the Nijmegen Bladder Cancer Study. Every layer away from the centre represents a new recurrence, the circle in the middle represents the characteristics of the primary tumour. Prognostic risk groups were assessed using a modified version of EAU prognostic risk categories, as not all clinical data were available [2]. Risk groups are defined in supplemental document 1.](https://content.iospress.com:443/media/blc/2023/9-1/blc-9-1-blc220076/blc-9-blc220076-g001.jpg)
Table 1
Patient and tumour characteristics of NMIBC patients in the Nijmegen Bladder Cancer Study for the total study population and for the subgroups of patients that experienced at least 1, 2, 3 or 4 recurrences
| Nijmegen Bladder Cancer Study | Primary | Progression | Rec 1 | Rec 2 | Rec 3 | Rec 4 | |
| (N = 1,443) | (N = 167) | (N = 709) | (N = 392) | (N = 242) | (N = 160) | ||
| Male Gender | 1191 (83) | 138 (83) | 589 (83) | 321 (82) | 197 (81) | 127 (80) | |
| Median Age1 (range in years) | 64 (25–91) | 64 (31–88) | 64 (29–85) | 62 (29–84) | 62 (29 –82) | 60 (29 –82) | |
| Smoking status1 | Never smoker | 245 (17) | 25 (15) | 103 (15) | 57 (15) | 38 (16) | 26 (16) |
| Ever smoker | 1091 (76) | 127 (76) | 518 (73) | 275 (70) | 166 (69) | 108 (68) | |
| Unknown | 107 (7) | 15 (9) | 88 (12) | 60 (15) | 38 (16) | 26 (16) | |
| Stage tumour2 | Ta | 1018 (71) | 81 (49) | 395 (56) | 229 (58) | 138 (57) | 86 (54) |
| T1 | 339 (23) | 66 (40) | 50 (7) | 22 (6) | 14 (6) | 12 (8) | |
| CIS | 54 (4) | 12 (7) | 71 (10) | 24 (6) | 11 (5) | 8 (5) | |
| Unknown | 32 (2) | 8 (5) | 193 (27) | 117 (30) | 79 (33) | 54 (34) | |
| Concomitant CIS | No | 1318 (91) | 132 (79) | 494 (70) | 264 (67) | 153 (63) | 102 (64) |
| Yes | 93 (6) | 27 (16) | 22 (3) | 11 (3) | 10 (4) | 4 (3) | |
| Unknown | 32 (2) | 8 (5) | 193 (27) | 117 (30) | 79 (33) | 54 (34) | |
| Grade tumour3 | Low grade | 940 (65) | 84 (50) | 337 (48) | 196 (50) | 113 (47) | 73 (46) |
| High grade | 465 (32) | 77 (46) | 172 (24) | 79 (20) | 49 (20) | 33 (21) | |
| Unknown | 38 (3) | 6 (4) | 200 (28) | 117 (30) | 80 (33) | 54 (34) | |
1Age and smoking status are based on age and smoking status at primary diagnosis. 2In case of Ta/T1 with concomitant CIS, only Ta/T1 is included in stage. 3Low grade denotes WHO 1973 differentiation grade 1 or 2, WHO/ISUP 2004 PUNLMP/low grade or Bergkvist grade 1/2a, high grade denotes WHO 1973 differentiation grade 3, WHO/ISUP 2004 high grade, or Bergkvist grade 2b/3.
Single SNP analysis
Both in recurrence and progression analyses, none of the SNPs reached the multiple testing adjusted threshold for statistical significance. The ten most strongly associated loci based on statistical significance, summarized by the strongest associated SNP in that region, are displayed in Tables 2 and 3. SNP rs114873844 in ELF3 showed the strongest association with NMIBC recurrences (HR = 0.68 (95% confidence interval [CI] 0.54,0.86), PFDR = 1.00, Punadj = 0.0013); SNP rs7586307 in NFE2L2 showed the strongest association with progression (HR = 1.72 (95% CI 1.25, 2.37), PFDR = 1.00, Punadj = 0.0007).
Table 2
Results of the ten SNPs with strongest association in single SNP analysis with NMIBC recurrences in the Nijmegen Bladder Cancer Study
| Chr | SNP ID | Position | A1 | A2 | MAF | Gene | Beta | HR | 95% CI | SE | PFDR | Punadj |
| 1 | rs114873844 | 201979370 | G | A | 0.06 | ELF3 | –0.39 | 0.68 | (0.54, 0.86) | 0.12 | 1.00 | 0.0013 |
| 2 | rs11889962 | 20645915 | A | G | 0.06 | RHOB | 0.35 | 1.41 | (1.14, 1.75) | 0.11 | 1.00 | 0.0014 |
| 10 | rs41282876 | 129899482 | T | A | 0.10 | MKi67 | 0.25 | 1.28 | (1.09, 1.50) | 0.08 | 1.00 | 0.0029 |
| 10 | rs77393382 | 129928636 | T | C | 0.11 | MKi67 | 0.22 | 1.25 | (1.07, 1.47) | 0.08 | 1.00 | 0.0062 |
| 19 | rs3916898 | 45854330 | A | C | 0.07 | ERCC2 | 0.26 | 1.30 | (1.07, 1.58) | 0.10 | 1.00 | 0.0071 |
| 12 | rs10876869 | 56467865 | C | G | 0.40 | ERBB3 | 0.14 | 1.15 | (1.04, 1.28) | 0.05 | 1.00 | 0.0084 |
| 3 | rs4135294 | 12466715 | G | A | 0.15 | PPARG | 0.18 | 1.20 | (1.05, 1.38) | 0.07 | 1.00 | 0.0092 |
| 5 | rs2736109 | 1296759 | C | T | 0.43 | TERT | 0.15 | 1.16 | (1.04, 1.29) | 0.06 | 1.00 | 0.0100 |
| 7 | rs6970262 | 55259763 | A | G | 0.64 | EGFR | 0.14 | 1.15 | (1.03, 1.29) | 0.06 | 1.00 | 0.0110 |
| 3 | rs9833097 | 12478817 | G | A | 0.10 | PPARG | 0.21 | 1.24 | (1.05, 1.46) | 0.08 | 1.00 | 0.0110 |
A1: Reference allele, A2: Alternative allele, MAF: Minor Allele Frequency, HR: Hazard ratio, CI: Confidence Interval, SE: Standard Error, PFDR: False Discovery Rate-corrected P value, Punadj: Unadjusted P value.
Table 3
Results of the ten SNPs with strongest association in single SNP analysis with NMIBC progression in the Nijmegen Bladder Cancer Study
| Chr | SNP ID | Position | A1 | A2 | MAF | Gene | Beta | HR | 95% CI | SE | PFDR | Punadj |
| 2 | rs7586307 | 178138926 | C | T | 0,10 | NFE2L2 | 0,54 | 1,72 | (1.25, 2.37) | 0,16 | 1.00 | 0.00079 |
| 10 | rs77393382 | 129928636 | T | C | 0,11 | MKi67 | 0,48 | 1,62 | (1.19, 2.21) | 0,16 | 1.00 | 0.002 |
| 3 | rs1642743 | 10190467 | T | C | 0,38 | VHL | 0,36 | 1,43 | (1.14, 1.80) | 0,12 | 1.00 | 0.002 |
| 6 | rs2376620 | 36649593 | A | G | 0,17 | CDKN1A | 0,41 | 1,51 | (1.16, 1.97) | 0,14 | 1.00 | 0.0024 |
| 12 | rs11171744 | 56503127 | G | C | 0,12 | ERBB3 | 0,51 | 1,67 | (1.20, 2.33) | 0,17 | 1.00 | 0.0024 |
| 11 | rs655089 | 69448575 | T | G | 0,46 | CCND1 | 0,33 | 1,38 | (1.11, 1.72) | 0,11 | 1.00 | 0.0035 |
| 17 | rs12951053 | 7577407 | A | C | 0,09 | TP53 | 0,46 | 1,59 | (1.16, 2.17) | 0,16 | 1.00 | 0.0042 |
| 17 | rs17883048 | 7570956 | G | A | 0,05 | TP53 | 0,58 | 1,79 | (1.18, 2.72) | 0,21 | 1.00 | 0.0062 |
| 10 | rs117040846 | 5827619 | G | A | 0,05 | GDI2 | 0,59 | 1,81 | (1.17, 2.78) | 0,22 | 1.00 | 0.0072 |
| 11 | rs11603541 | 69472373 | C | G | 0,11 | CCND1 | –0,60 | 0,55 | (0.35, 0.85) | 0,23 | 1.00 | 0.0073 |
A1: Reference allele, A2: Alternative allele, MAF: Minor Allele Frequency, HR: Hazard ratio, CI: Confidence Interval, SE: Standard Error, PFDR: False Discovery Rate-corrected P value, Punadj: Unadjusted P value.
Gene-based analysis
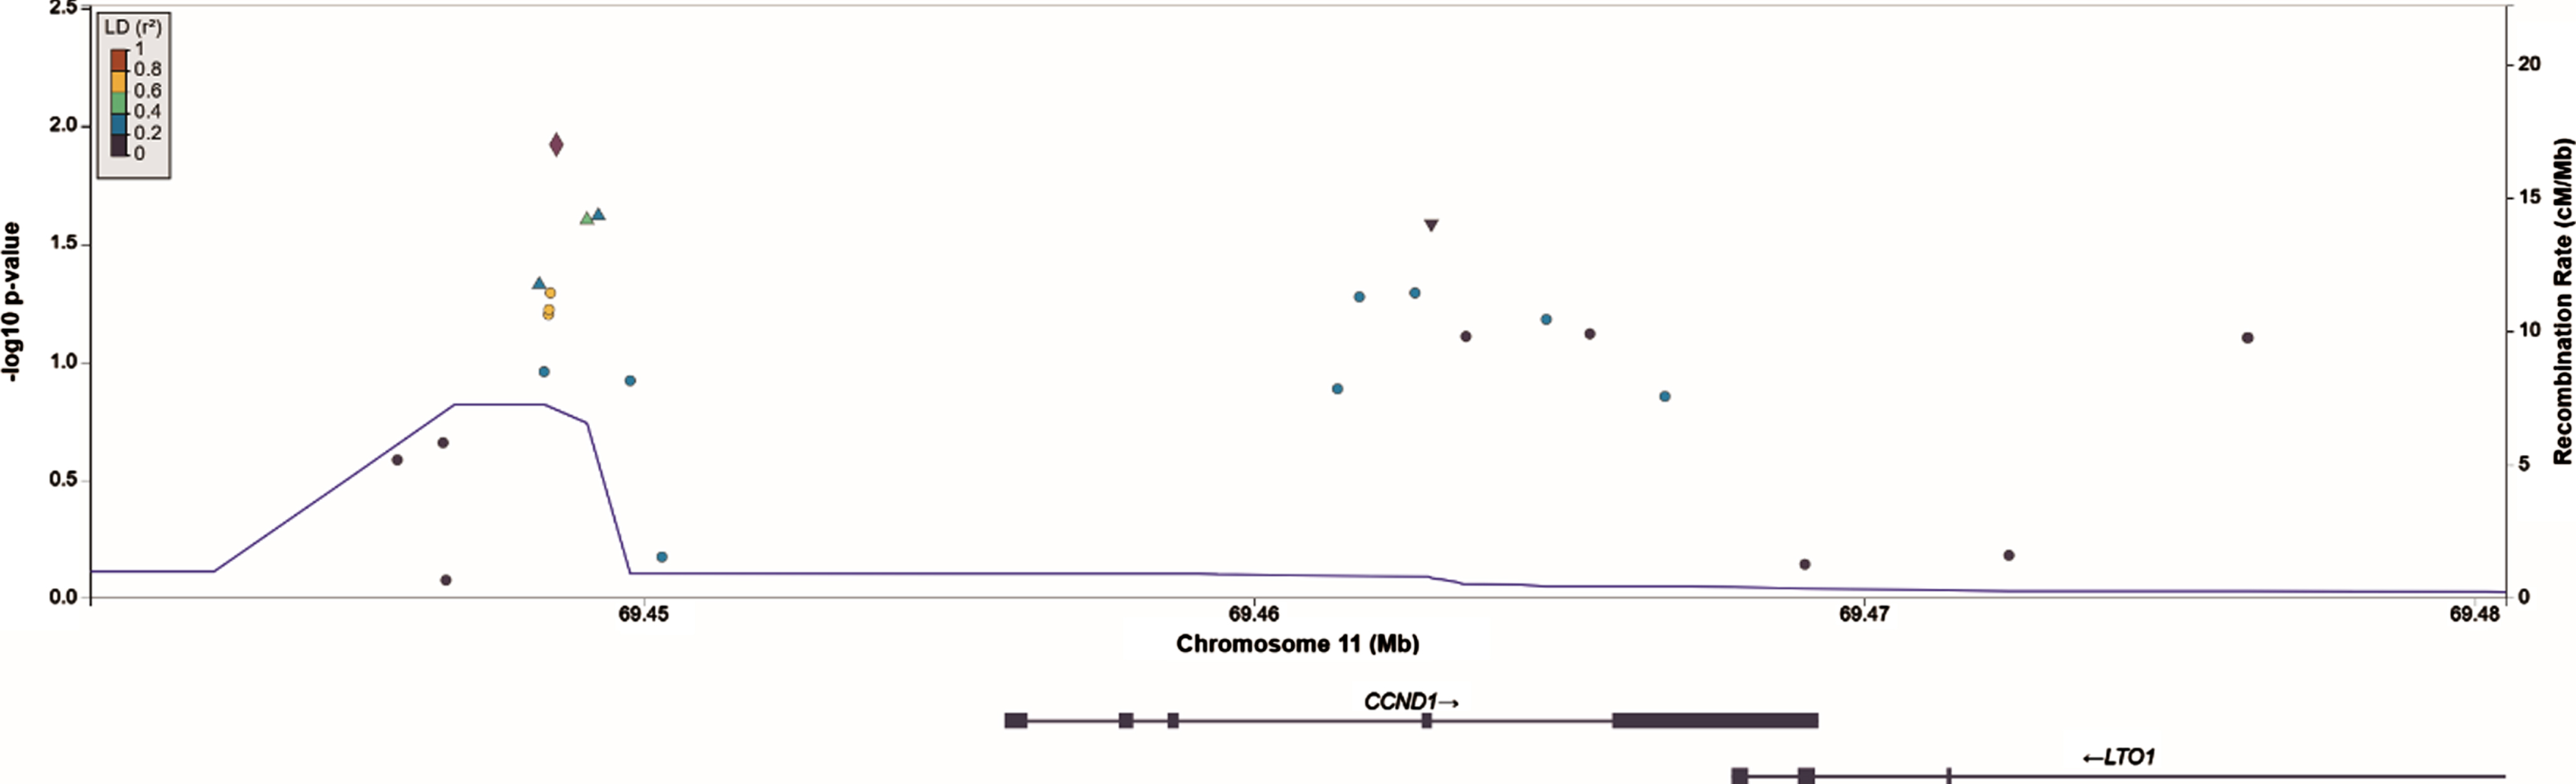
The ten genes with the lowest P values in recurrence and progression analysis are displayed in Tables 4 and 5, respectively. SNPs in the CCND1 locus collectively showed the strongest evidence for association and reached statistical significance for recurrence (LRT = 43.8, PFDR = 0.046), but not for progression (LRT = 24.7, PFDR = 0.54). ERBB3, FGFR3, CDKN2A, ERCC2 and KRAS had unadjusted P values < 0.05 in recurrence analysis, but when corrected for false discovery rate had P values > 0.2 and were thus not carried forward for validation. Similarly, PPARG and KRAS were no longer significant after correction for false discovery rate in progression analyses. Note that many genes have a similar false-discovery corrected P value as a result of the Benjamini-Hochberg procedure. A regional association plot of the CCND1 gene region is shown in Fig. 2.
Table 4
Results of the gene-based analysis in which germline genetic variation within a gene was tested for association with NMIBC recurrence in the Nijmegen Bladder Cancer Study
| Gene | Number of SNPs | DF | LRT | PFDR | Punadj |
| CCND1 | 25 | 19 | 43.82 | 0.046* | 0.001* |
| ERBB3 | 35 | 18 | 32.51 | 0.245 | 0.019 |
| FGFR3 | 20 | 17 | 30.25 | 0.245 | 0.025 |
| CDKN2A | 54 | 31 | 47.38 | 0.245 | 0.030 |
| ERCC2 | 73 | 40 | 58.32 | 0.245 | 0.031 |
| KRAS | 177 | 45 | 64.13 | 0.245 | 0.032 |
| MET | 126 | 49 | 64.16 | 0.459 | 0.072 |
| RHOB | 43 | 19 | 27.76 | 0.459 | 0.088 |
| RXRA | 237 | 79 | 95.57 | 0.459 | 0.099 |
| PRKCI | 106 | 34 | 44.47 | 0.459 | 0.108 |
DF: Degrees of Freedom (DF) in the likelihood ratio test, LRT: Likelihood Ratio Test (LRT) statistic. PFDR: False Discovery Rate-corrected P value, Punadj: Unadjusted P value. *P values in bold exceeded the threshold for statistical significance.
Table 5
Results of the gene-based analysis in which germline genetic variation within a gene was tested for association with NMIBC progression in the Nijmegen Bladder Cancer Study
| Gene | Number of SNPs | DF | LRT | PFDR | Punadj |
| PPARG | 290 | 73 | 98,15 | 0,539 | 0,027 |
| ERBB3 | 35 | 18 | 30,87 | 0,539 | 0,030 |
| KRAS | 177 | 45 | 63,29 | 0,539 | 0,037 |
| ZNF703 | 2 | 2 | 5,16 | 0,539 | 0,076 |
| MDM2 | 77 | 29 | 38,55 | 0,539 | 0,111 |
| FBXW7 | 82 | 33 | 42,46 | 0,539 | 0,125 |
| MKi67 | 179 | 64 | 76,76 | 0,539 | 0,132 |
| MDM4 | 217 | 52 | 62,80 | 0,539 | 0,145 |
| CDKN2A | 54 | 31 | 39,03 | 0,539 | 0,153 |
| PABPC1 | 65 | 20 | 26,09 | 0,539 | 0,163 |
DF: Degrees of Freedom (DF) in the likelihood ratio test, LRT: Likelihood Ratio Test (LRT) statistic. PFDR: False Discovery Rate-corrected P value, Punadj: Unadjusted P value.
The SNP with the strongest association in CCND1 in single SNP analysis was rs655089 (HR = 1.14 (95% CI 1.03, 1.26), PFDR = 1.00, Punadj = 0.012), which is located upstream of CCND1. SNP rs655089 was the main driver of the gene-based association for CCND1 with recurrence: no other SNP in CCND1 exceeded the nominal significance threshold (Punadj < 0.05) in single SNP analysis when rs655089 was included as a covariate.
Fig. 2
Regional association plot of SNPs in and nearby CCND1 constructed in LocusZoom. The SNP in CCND1 that shows the strongest association with NMIBC recurrences, rs655089, is marked by the purple diamond.
Validation analysis
CCND1 tumour expression was not statistically significantly associated with risk of recurrence in NMIBC patients from the UROMOL cohort (HR = 0.96 (95% CI 0.89,1.04), P = 0.35). The SNP with the strongest association in CCND1, rs655089, is located upstream of CCND1 and could act on CCND1 expression in tumour tissue through transcription factor binding. However, we did not reveal statistically significant associations between SNPs in CCND1 and tumour expression of CCND1 in eQTL analysis (Table 6). Also, the aggregate effect of all SNPs in CCND1 was not associated with CCND1 tumour expression in a likelihood-ratio test (P = 0.33). No statistically significant association was observed for the aggregated effect of germline genetic variants in CCND1 and recurrence-free survival in the meta-GWAS for NMIBC recurrence (P = 0.65).
Table 6
Result of eQTL analysis of 19 SNPs in CCND1 in the UROMOL study
| SNP ID | Position | A1 | A2 | MAF | Beta | SE | P value |
| rs11824610 | 69446331 | G | A | 0.06 | 0.43 | 0.22 | 0.05 |
| rs11826558 | 69446766 | C | T | 0.07 | 0.41 | 0.20 | 0.04 |
| rs653810 | 69448294 | G | A | 0.38 | 0.02 | 0.11 | 0.87 |
| rs654240 | 69448373 | C | T | 0.41 | –0.02 | 0.10 | 0.88 |
| rs654648 | 69448445 | G | A | 0.41 | 0.04 | 0.11 | 0.68 |
| rs655089 | 69448575 | T | G | 0.42 | 0.07 | 0.11 | 0.52 |
| rs2450254 | 69449784 | A | T | 0.38 | –0.03 | 0.11 | 0.81 |
| rs35654475 | 69452339 | – | CCAG | 0.50 | 0.06 | 0.10 | 0.58 |
| rs117459970 | 69452710 | C | G | 0.50 | 0.06 | 0.10 | 0.58 |
| rs77290390 | 69453506 | G | A | 0.11 | 0.01 | 0.15 | 0.94 |
| rs187210029 | 69457293 | C | T | 0.49 | 0.09 | 0.10 | 0.38 |
| rs1352075 | 69461182 | C | T | 0.13 | –0.08 | 0.16 | 0.62 |
| rs55816909 | 69463479 | G | C | 0.49 | –0.04 | 0.10 | 0.67 |
| rs3918297 | 69464793 | A | G | 0.46 | –0.09 | 0.10 | 0.35 |
| rs3212870 | 69465507 | A | C | 0.46 | –0.10 | 0.10 | 0.33 |
| rs3212877 | 69465681 | G | A | 0.43 | –0.10 | 0.10 | 0.33 |
| rs183501442 | 69466115 | A | C | 0.49 | –0.13 | 0.10 | 0.20 |
| rs34193475 | 69466737 | G | C | 0.35 | –0.10 | 0.10 | 0.33 |
A1: Reference allele, A2: Alternative allele, MAF: Minor Allele Frequency, Beta: Linear regression coefficient, SE: Standard Error.
DISCUSSION
Our study investigated the relationship between germline genetic variants in known bladder cancer predisposition genes with bladder cancer prognosis. While somatic alterations in these genes are known to contribute to the development of bladder cancer and some of them were found to play a role in bladder cancer prognosis, the effect of germline variation in these genes on recurrence or progression has not been investigated before in depth. We identified a statistically significant association between germline genetic variation in gene CCND1 and NMIBC recurrence in a recurrent event analysis, which includes all recurrences of NMIBC patients in statistical analysis. However, this association could not be confirmed using association analyses of germline CCND1 variants, CCND1 tumour gene expression, and recurrence-free survival in additional independent cohorts. We did not find statistically significant associations for germline variation in any of the other candidate genes with recurrence or progression.
It is possible that our validation analysis has resulted in a false-negative finding. First of all, it could be that our validation analyses were underpowered compared to our discovery analyses. The power of our discovery analyses was optimized by: 1) performing analyses in the NBCS cohort, the currently largest prognostic cohort on NMIBC outcome; 2) performing a recurrent event analysis instead of a time-to-first recurrence analysis, thereby including all potential recurrence a patient might experience [21]; and 3) including a gene-based analyses based on individual-level data [23]. The recurrent event analysis resulted in 80% power to identify SNPs with minor allele frequency (MAF) 0.3 and HR 1.37 using a Bonferroni corrected P value significance threshold of 0.05/5,053 = 9.9×10⁻⁶, whereas a time-to-first event analysis would have 80% power to identify SNPs with MAF 0.3 and HR 1.46. In addition, the validation cohorts that we used were of individually smaller sample size and did not register all recurrences a patient might experience, thus only enabling a time-to-first recurrence analysis. This caused a reduced power in our validation analyses and potentially false negative results. On the other hand, the association between CCND1 and total NMIBC recurrence risk was mainly driven by the effect on first recurrence: when we restricted our gene-based analysis to time until first recurrence only in a CoxPH model, SNP variation in CCND1 was associated with RFS at a Punadj = 0.0087 (PFDR = 0.15) using a likelihood-ratio test.
Secondly, a true association between tumour expression of CCND1 and RFS could have been masked by the presence of interaction effects between CCND1 and other genes. In data from UROMOL, we observed that CCND1 tumour expression differed in the four transcriptomic classes described in the UROMOL study (Fig. 3) [9], which were prognostic for RFS and progression-free survival in NMIBC: patients with primary tumours in transcriptomic classes 1 and 3 had low recurrence- and progression rates compared to patients in classes 2a and 2b. Thus, there might be epistasis between CCND1 and other genes included in the transcriptomic classes, which might have masked the association between CCND1 and RFS. In addition, we note that CCND1 was included in the gene panel by Le Goux et al. because of recurrent amplifications in bladder cancer. This amplification could affect CCND1 tumour expression, which makes it more difficult to compute direct associations between SNP variation and CCND1 expression in eQTL analysis.
Fig. 3
Expression levels of CCND1 in tumours from different transcriptomic classes in publicly available data from UROMOL [9]. The black horizontal lines mark the mean expression levels per class.
![Expression levels of CCND1 in tumours from different transcriptomic classes in publicly available data from UROMOL [9]. The black horizontal lines mark the mean expression levels per class.](https://content.iospress.com:443/media/blc/2023/9-1/blc-9-1-blc220076/blc-9-blc220076-g003.jpg)
Finally, the coverage of common genetic variation was not optimal for all candidate genes. The median number of SNPs per gene was 76, but for some genes our data contained few SNPs, e.g. ZNF703 and SOX4 contained < 10 SNPs. This might have led to lack of coverage of the genetic variation in these genes and potentially false-negative results.
We did not observe any statistically significant association for progression. Compared to recurrence, the gene panels that we used to select candidate genes also reported relatively few associations with PFS: only RXRA overexpression, and having a mutation in any UROseek gene were associated with PFS [13, 19, 20]. This could be due to the small number of progression cases in these panels: the UROseek panel only reported 21 cases of progression, whereas the studies by Le Goux and Ward only reported 10 and 25 cases of progression, respectively [13, 19, 20]. The candidate genes were also not amongst the top signals of our recent genome-wide association study on NMIBC prognosis [8]. However, our analyses may have missed associations for progression due to limited power: for MAF 0.3 and a multiple testing corrected significance threshold of 9.9×10⁻⁶, our progression analysis had 80% power to detect SNPs with HR 1.82, whereas we had a 80% power to detect SNPs with HR of 1.37 in our recurrence analysis. Finally, low coverage of common genetic variation could also have led to false-negative findings, like we described for recurrence.
Notably, recurrent event analysis gives more weight to patients who experienced more recurrences, because the analyses are performed at the level of the recurrence. It could be that this approach prioritizes effects in patients with frequently recurring low-risk tumours, which could diminish the generalizability of the results to the total NMIBC population. This is not the case in our study, as we observed that patients with frequently recurring tumours were not at lower risk of progression. First of all, the patient characteristics in Table 1 show a similar distribution of stage and grade for the first to fourth recurrence, which suggests a similar risk profile for patients who experienced multiple recurrences vs. patients with no recurrence. In addition to this, we tested the correlation between individual risk of recurrences and progression following the methodology by Balan et al. [25]. Patients who experienced more recurrences had a slightly increased risk of progression to MIBC (p = 0.03), which suggests that the analysis of all recurrences does not prioritize low-risk disease.
Our study has some strengths and limitations. A main strength of our work is the analysis of all NMIBC recurrences, instead of analysing only recurrence-free survival. Another strength is our study population: the NBCS is a population-based cohort with a large sample size, clinical data were carefully cleaned in consultation with urologists and experts in bladder cancer, and our genotype data had a high SNP density due to imputation. We acknowledge some limitations: our study did not cover low-frequency or rare genetic variation and might also have missed some common SNPs that were not measured and/or imputed with low precision; and our study population is at risk of prevalent case bias due to the delay between NMIBC diagnosis and invitation to the NBCS.
In conclusion, we identified a statistically significant association between germline DNA variation in CCND1 and NMIBC recurrences, however, this association was not validated in additional independent cohorts. None of the other genes related to bladder-carcinogenesis were statistically significantly associated with NMIBC recurrence or progression. We recommend to repeat this work once larger sample sizes are available.
ACKNOWLEDGMENTS
We thank prof. Ton Coolen for sharing his insight in statistical models and technical support.
FUNDING
Jasper Hof was funded by a junior researcher grant from the Radboud Institute for Health Sciences, Radboud University Medical Center, Nijmegen, The Netherlands.
AUTHOR CONTRIBUTIONS
Conception: Jasper P. Hof, Sita H. Vermeulen, Lambertus A.L.M. Kiemeney and Tessel E. Galesloot.
Performance of work: Jasper P. Hof
Interpretation of data: Jasper P. Hof, Sita H. Vermeulen, Antoine G van der Heijden, Gerald W. Verhaegh, Lars Dyrskjøt, James W.F. Catto, Lourdes Mengual, Richard T Bryan, Neil E. Fleshner, Lambertus A.L.M. Kiemeney and Tessel E. Galesloot.
Writing the article: Jasper P. Hof
Access to data: Jasper P. Hof
All authors have read, revised and approved the manuscript.
CONFLICT OF INTEREST
Jasper P. Hof
J. Hof has no conflict of interest to report.
Sita H. Vermeulen
S. Vermeulen has no conflict of interest to report.
Antoine G. van der Heijden
Consultant: MSD, Astellas, MerckPfizer, MML
Honoraria: MerckPfizer, Astellas
Gerald W. Verhaegh
G. Verhaegh has no conflict of interest to report.
Lars Dyrskjøt
Grants: C2i genomics, Natera, Photocure, Ferring
Consultant: Ferring
Honoraria: Roche
L. Dyrskjøt is an Editorial Board member of this journal, but was not involved in the peer-review process nor had access to any information regarding its peer-review.
James W.F. Catto
Grants: Roche
Consultant or advisory board: Astra Zeneca, BMS, Gilead, QED Therapeutics, Roche, Ferring, Steba biotech, UroGen, Janssen, Photocure
Honoraria: BMS, Astra Zeneca, Roche
Board member: Fight Bladder Cancer UK
J. Catto is an Editorial Board member of this journal, but was not involved in the peer-review process nor had access to any information regarding its peer-review.
Lourdes Mengual
Honoraria: Fundación Investigación Urología (AEU)
Receipt of material or service: Nucleix
Richard T. Bryan
Funding: Cancer Research UK
Grants: Urogen Pharma, QED Therapeutics, Janssen
Royalties: Nonacus Limited
Board member: The Lichfield Science and Engineering Society
Trustee: Action Bladder Cancer UK
Neil E. Fleshner
Grants: Janssen, Astellas, Bayer, Sanofi, Nucleix, Progenix, SpectraCure AB, Bavarian Nordic
Consultant: Amgen, Janssen, Astellas, Bayer, Sanofi, Abbvie, Ferring
Board member: Verity Pharmaceuticals, POINT Biopharma
Stock: POINT Biopharma, Verity Pharamceuticals
Lambertus A.L.M. Kiemeney
L.A.L.M. Kiemeney is an Editorial Board member of this journal, but was not involved in the peer-review process nor had access to any information regarding its peer-review.
Tessel E. Galesloot
Tessel E. Galesloot has no conflict of interest to report.
SUPPLEMENTARY MATERIAL
[1] The supplementary material is available in the electronic version of this article: https://dx.doi.org/10.3233/BLC-220076.
REFERENCES
[1] | Burger M , Catto JW , Dalbagni G , Grossman HB , Herr H , Karakiewicz P , Kassouf W , Kiemeney LA , La Vecchia C , Shariat S , Lotan Y Epidemiology and risk factors of urothelial bladder cancer, Eur Urol (2013) ;63: (2):234–41. |
[2] | Sylvester RJ , Rodriguez O , Hernandez V , Turturica D , Bauerova L , Bruins HM , Brundl J , van der Kwast TH , Brisuda A , Rubio-Briones J , Seles M , Hentschel AE , Kusuma VRM , Huebner N , Cotte J , Mertens LS , Volanis D , Cussenot O , Subiela Henriquez JD , de la Pena E , Pisano F , Pesl M , van der Heijden AG , Herdegen S , Zlotta AR , Hacek J , Calatrava A , Mannweiler S , Bosschieter J , Ashabere D , Haitel A , Cote JF , El Sheikh S , Lunelli L , Algaba F , Alemany I , Soria F , Runneboom W , Breyer J , Nieuwenhuijzen JA , Llorente C , Molinaro L , Hulsbergen-van de Kaa CA , Evert M , Kiemeney L , N’Dow J , Plass K , Capoun O , Soukup V , Dominguez-Escrig JL , Cohen D , Palou J , Gontero P , Burger M , Zigeuner R , Mostafid AH , Shariat SF , Roupret M , Comperat EM , Babjuk M , van Rhijn BWG European Association of Urology (EAU) Prognostic Factor Risk Groups for Non-muscle-invasive Bladder Cancer (NMIBC) Incorporating the WHO /and WHO Classification Systems for Grade: An Update from the EAU NMIBC Guidelines Panel, Eur Urol (2021) ;79: (4):480–8. |
[3] | Sylvester RJ , van der Meijden AP , Oosterlinck W , Witjes JA , Bouffioux C , Denis L , Newling DW , Kurth K Predicting recurrence and progression in individual patients with stage Ta T1 bladder cancer using EORTC risk tables: a combined analysis of 2596 patients from seven EORTC trials. Eur Urol(2006) ;49: (3):75–7. |
[4] | Fujii Y Prediction models for progression of non-muscle-invasive bladder cancer: A review, Int J Urol (2018) ;25: (3):212–8. |
[5] | Zuniga KB , Graff RE , Feiger DB , Meng MV , Porten SP , Kenfield SA Lifestyle and Non-muscle Invasive Bladder Cancer Recurrence, Progression, and Mortality: Available Research and Future Directions, Bladder Cancer (2020) ;6: (1):9–23. |
[6] | Chen M , Hildebrandt MA , Clague J , Kamat AM , Picornell A , Chang J , Zhang X , Izzo J , Yang H , Lin J , Gu J , Chanock S , Kogevinas M , Rothman N , Silverman DT , Garcia-Closas M , Grossman HB , Dinney CP , Malats N , Wu X Genetic variations in the sonic hedgehog pathway affect clinical outcomes in non-muscle-invasive bladder cancer, Cancer Prev Res (Phila) (2010) ;3: (10):1235–45. |
[7] | Grotenhuis AJ , Dudek AM , Verhaegh GW , Aben KK , Witjes JA , Kiemeney LA , Vermeulen SH Independent Replication of Published Germline Polymorphisms Associated with Urinary Bladder Cancer Prognosis and Treatment Response, Bladder Cancer (2016) ;2: (1):77–89. |
[8] | Galesloot TE , Grotenhuis AJ , Kolev D , Aben KK , Bryan RT , Catto JWF , Cheng KK , Conroy S , Dyrskjot L , Fleshner NE , James ND , Lamy P , Lindskrog SV , Malats N , Mengual L , Verhaegh G , Zeegers MP , Kiemeney L , Vermeulen SH Genome-wide Meta-analysis Identifies Novel Genes Associated with Recurrence and Progression in Nonmuscle-invasive Bladder Cancer. Eur Urol Oncol. 2021. |
[9] | Lindskrog SV , Prip F , Lamy P , Taber A , Groeneveld CS , Birkenkamp-Demtroder K , Jensen JB , Strandgaard T , Nordentoft I , Christensen E , Sokac M , Birkbak NJ , Maretty L , Hermann GG , Petersen AC , Weyerer V , Grimm MO , Horstmann M , Sjodahl G , Hoglund M , Steiniche T , Mogensen K , de Reynies A , Nawroth R , Jordan B , Lin X , Dragicevic D , Ward DG , Goel A , Hurst CD , Raman JD , Warrick JI , Segersten U , Sikic D , van Kessel KEM , Maurer T , Meeks JJ , DeGraff DJ , Bryan RT , Knowles MA , Simic T , Hartmann A , Zwarthoff EC , Malmstrom PU , Malats N , Real FX , Dyrskjot L An integrated multi-omics analysis identifies prognostic molecular subtypes of non-muscle-invasive bladder cancer, Nat Commun (2021) ;12: (1):2301. |
[10] | Pietzak EJ , Bagrodia A , Cha EK , Drill EN , Iyer G , Isharwal S , Ostrovnaya I , Baez P , Li Q , Berger MF , Zehir A , Schultz N , Rosenberg JE , Bajorin DF , Dalbagni G , Al-Ahmadie H , Solit DB , Bochner BH Next-generation Sequencing of Nonmuscle Invasive Bladder Cancer Reveals Potential Biomarkers and Rational Therapeutic Targets, Eur Urol (2017) ;72: (6):952–9. |
[11] | Zhang X , Zhang Y Bladder Cancer and Genetic Mutations, Cell Biochem Biophys (2015) ;73: (1):65–9. |
[12] | Kompier LC , Lurkin I , van der Aa MN , van Rhijn BW , van der Kwast TH , Zwarthoff EC FGFR3, HRAS, KRAS, NRAS and PIK3CA mutations in bladder cancer and their potential as biomarkers for surveillance and therapy, PloS one (2010) ;5: (11):e13821. |
[13] | Ward DG , Gordon NS , Boucher RH , Pirrie SJ , Baxter L , Ott S , Silcock L , Whalley CM , Stockton JD , Beggs AD , Griffiths M , Abbotts B , Ijakipour H , Latheef FN , Robinson RA , White AJ , James ND , Zeegers MP , Cheng KK , Bryan RT Targeted deep sequencing of urothelial bladder cancers and associated urinary DNA: a 23-gene panel with utility for non-invasive diagnosis and risk stratification, BJU Int (2019) ;124: (3):532–44. |
[14] | Kiemeney LA , Sulem P , Besenbacher S , Vermeulen SH , Sigurdsson A , Thorleifsson G , Gudbjartsson DF , Stacey SN , Gudmundsson J , Zanon C , Kostic J , Masson G , Bjarnason H , Palsson ST , Skarphedinsson OB , Gudjonsson SA , Witjes JA , Grotenhuis AJ , Verhaegh GW , Bishop DT , Sak SC , Choudhury A , Elliott F , Barrett JH , Hurst CD , de Verdier PJ , Ryk C , Rudnai P , Gurzau E , Koppova K , Vineis P , Polidoro S , Guarrera S , Sacerdote C , Campagna M , Placidi D , Arici C , Zeegers MP , Kellen E , Gutierrez BS , Sanz-Velez JI , Sanchez-Zalabardo M , Valdivia G , Garcia-Prats MD , Hengstler JG , Blaszkewicz M , Dietrich H , Ophoff RA , van den Berg LH , Alexiusdottir K , Kristjansson K , Geirsson G , Nikulasson S , Petursdottir V , Kong A , Thorgeirsson T , Mungan NA , Lindblom A , van Es MA , Porru S , Buntinx F , Golka K , Mayordomo JI , Kumar R , Matullo G , Steineck G , Kiltie AE , Aben KK , Jonsson E , Thorsteinsdottir U , Knowles MA , Rafnar T , Stefansson K A sequence variant at 4p163 confers susceptibility to urinary bladder cancer, Nat Genet (2010) ;42: (5):415–9. |
[15] | Rafnar T , Sulem P , Stacey SN , Geller F , Gudmundsson J , Sigurdsson A , Jakobsdottir M , Helgadottir H , Thorlacius S , Aben KK , Blondal T , Thorgeirsson TE , Thorleifsson G , Kristjansson K , Thorisdottir K , Ragnarsson R , Sigurgeirsson B , Skuladottir H , Gudbjartsson T , Isaksson HJ , Einarsson GV , Benediktsdottir KR , Agnarsson BA , Olafsson K , Salvarsdottir A , Bjarnason H , Asgeirsdottir M , Kristinsson KT , Matthiasdottir S , Sveinsdottir SG , Polidoro S , Hoiom V , Botella-Estrada R , Hemminki K , Rudnai P , Bishop DT , Campagna M , Kellen E , Zeegers MP , de Verdier P , Ferrer A , Isla D , Vidal MJ , Andres R , Saez B , Juberias P , Banzo J , Navarrete S , Tres A , Kan D , Lindblom A , Gurzau E , Koppova K , de Vegt F , Schalken JA , van der Heijden HF , Smit HJ , Termeer RA , Oosterwijk E , van Hooij O , Nagore E , Porru S , Steineck G , Hansson J , Buntinx F , Catalona WJ , Matullo G , Vineis P , Kiltie AE , Mayordomo JI , Kumar R , Kiemeney LA , Frigge ML , Jonsson T , Saemundsson H , Barkardottir RB , Jonsson E , Jonsson S , Olafsson JH , Gulcher JR , Masson G , Gudbjartsson DF , Kong A , Thorsteinsdottir U , Stefansson K Sequence variants at the TERT-CLPTM1L locus associate with many cancer types, Nat Genet (2009) ;41: (2):221–7. |
[16] | Rachakonda PS , Hosen I , de Verdier PJ , Fallah M , Heidenreich B , Ryk C , Wiklund NP , Steineck G , Schadendorf D , Hemminki K , Kumar R TERT promoter mutations in bladder cancer affect patient survival and disease recurrence through modification by a common polymorphism, Proc Natl Acad Sci U S A (2013) ;110: (43):17426–31. |
[17] | Duenas M , Martinez-Fernandez M , Garcia-Escudero R , Villacampa F , Marques M , Saiz-Ladera C , Duarte J , Martinez V , Gomez MJ , Martin ML , Fernandez M , Castellano D , Real FX , Rodriguez-Peralto JL , De La Rosa F , Paramio JM PIK3CA gene alterations in bladder cancer are frequent and associate with reduced recurrence in non-muscle invasive tumors, Mol Carcinog (2015) ;54: (7):566–76. |
[18] | Kim PH , Cha EK , Sfakianos JP , Iyer G , Zabor EC , Scott SN , Ostrovnaya I , Ramirez R , Sun A , Shah R , Yee AM , Reuter VE , Bajorin DF , Rosenberg JE , Schultz N , Berger MF , Al-Ahmadie HA , Solit DB , Bochner BH Genomic predictors of survival in patients with high-grade urothelial carcinoma of the bladder, Eur Urol (2015) ;67: (2):198–201. |
[19] | Eich ML , Rodriguez Pena MDC , Springer SU , Taheri D , Tregnago AC , Salles DC , Bezerra SM , Cunha IW , Fujita K , Ertoy D , Bivalacqua TJ , Tomasetti C , Papadopoulos N , Kinzler KW , Vogelstein B , Netto GJ Incidence and distribution of UroSEEK gene panel in a multi-institutional cohort of bladder urothelial carcinoma, Mod Pathol (2019) ;32: (10):1544–50. |
[20] | Le Goux C , Vacher S , Schnitzler A , Barry Delongchamps N , Zerbib M , Peyromaure M , Sibony M , Allory Y , Bieche I , Damotte D , Pignot G Assessment of prognostic implication of a panel of oncogenes in bladder cancer and identification of a 3-gene signature associated with recurrence and progression risk in non-muscle-invasive bladder cancer, Sci Rep (2020) ;10: (1):16641. |
[21] | Rauch G , Kieser M , Binder H , Bayes-Genis A , Jahn-Eimermacher A Time-to-first-event versus recurrent-event analysis: points to consider for selecting a meaningful analysis strategy in clinical trials with composite endpoints, Clin Res Cardiol (2018) ;107: (5):437–43. |
[22] | Boomsma DI , Wijmenga C , Slagboom EP , Swertz MA , Karssen LC , Abdellaoui A , Ye K , Guryev V , Vermaat M , van Dijk F , Francioli LC , Hottenga JJ , Laros JF , Li Q , Li Y , Cao H , Chen R , Du Y , Li N , Cao S , van Setten J , Menelaou A , Pulit SL , Hehir-Kwa JY , Beekman M , Elbers CC , Byelas H , de Craen AJ , Deelen P , Dijkstra M , den Dunnen JT , deKnijff P , Houwing-Duistermaat J , Koval V , Estrada K , Hofman A , Kanterakis A , Enckevort D , Mai H , Kattenberg M , van Leeuwen EM , Neerincx PB , Oostra B , Rivadeneira F , Suchiman EH , Uitterlinden AG , Willemsen G , Wolffenbuttel BH , Wang J , deBakker PI , van Ommen GJ , van Duijn CM The Genome of theNetherlands: design, and project goals, Eur J Hum Genet (2014) ;22: (2):221–7. |
[23] | de Leeuw CA , Mooij JM , Heskes T , Posthuma D MAGMA: generalized gene-set analysis of GWAS data, PLoS Comput Biol (2015) ;11: (4):e1004219. |
[24] | Watanabe K , Taskesen E , van Bochoven A , Posthuma D Functional mapping and annotation of genetic associations with FUMA, Nat Commun (2017) ;8: (1):1826. |
[25] | Balan TA , Boonk SE , Vermeer MH , Putter H Score test for association between recurrent events and a terminal event, Stat Med (2016) ;35: (18):3037–48. |

