
Impact of Neoadjuvant Chemotherapy for Upper Tract Urothelial Carcinoma: A Population Based Analysis
Abstract
BACKGROUND AND OBJECTIVES:
We examined pathologic complete response (pCR) and pathologic downstaging (pDS) rates after neoadjuvant chemotherapy (NAC) in high-risk upper tract urothelial carcinoma, as well as their predictors. We further sought to determine their effects on overall survival and examine prognosticators of survival after NAC.
METHODS:
The National Cancer Database was used to identify all patients from 2004 to 2016 with nonmetastatic high grade upper tract urothelial carcinoma who received NAC followed by nephroureterectomy. pCR and pDS rates were examined, and univariate and multivariate logistic regression was performed to identify clinical predictors. Kaplan-Meier and Cox proportional hazard methods were used to estimate overall survival.
RESULTS:
309 patients met inclusion criteria. 27 patients (8.74%) had pCR, and 92 (29.77%) had pDS. pCR and pDS rates for N+ subgroup were 6.82% and 47.73% respectively, and for N0 subgroup, 9.50% and 22.62%. Female sex (OR 2.94, p = 0.010) was the only predictor of pCR. Node-positive disease (cN1 vs. cN0: OR 6.40, p < 0.001; cN2 vs. cN0: OR 7.46, p < 0.001) was a positive predictor of pDS, and the presence of lymphovascular invasion (LVI) (OR 0.14, p < 0.001) was a negative predictor of pDS. The median OS for all patients was 45.5 months. pCR and pDS were both associated with improved OS, (p < 0.001 for both); median was 99.1 months for both. LVI was the strongest negative prognostic factor for OS (HR 2.85, p < 0.001).
CONCLUSIONS:
Overall pathological complete response and downstaging rates were 8.74% and 29.77% respectively after multi-agent neoadjuvant chemotherapy. Node-negative and node-positive disease had equivalent rates of complete response, but node-positive disease had a significantly higher rate of downstaging. The presence of LVI was associated with worse overall survival.
INTRODUCTION AND BACKGROUND
Upper tract urothelial carcinoma (UTUC) is an uncommon urologic malignancy, with an incidence of approximately 2 cases per 100,000 person-years. However, it is also a highly aggressive disease, with 60% of UTUC found to be invasive at diagnosis compared to 15– 25% of bladder tumors [1]. Survival is poor with invasive disease, with 5-year survival rates of 43– 75%, 16– 33%, 0– 5%, and 0– 4% for T2, T3, T4, and N+ disease respectively [2].
Currently, the gold standard treatment for invasive UTUC is radical nephroureterectomy (RNU) with excision of a bladder cuff. However, overall survival remains poor even with this intervention [3] and the need for improved treatment modalities is significant. Neoadjuvant chemotherapy (NAC) has, of yet, not achieved widespread adoption in UTUC, partly due to a lack of prospective, high-quality evidence. NAC is now being increasingly adopted in urothelial bladder cancer [4, 5], with improved survival demonstrated in prospective randomized controlled trials [6] and meta-analyses [7], yielding an absolute survival benefit of around 5% with platinum-based combination chemotherapy at 5 years [7].
Recently, a prospective multicenter trial published data showing improved disease-free survival in UTUC with adjuvant gemcitabine-platinum combination chemotherapy [8]. Patients staged as either pT2-T4 pN0-N3 M0 or pTany N1-3 M0 were randomized to either adjuvant chemotherapy (AC) or surveillance, and the AC group was found to have significant improvement in disease-free survival. However, a significant proportion of UTUC patients will not be candidates for AC after RNU due to renal insufficiency and intolerance; therefore, the concept of offering NAC prior to RNU remains attractive.
Retrospective multicenter trials and meta-analyses have shown encouraging preliminary results for NAC prior to RNU [9– 12]. Recently, prospective data has further demonstrated the safety of NAC and its association with increased pathologic complete response rates [13]. However, the data sets involved are small, and widespread use of NAC remains limited. Here, we sought to extend these findings to a large, nationally representative cancer cohort, and examine pathologic complete response (pCR) rates (pT0 N0) and pathologic downstaging (pDS) rates (pathological stage less than clinical stage) at radical nephroureterectomy (RNU), as well as predictors of pCR and pDS. We further sought to determine the effects of pCR and pDS on overall survival (OS) and examine prognosticators of OS after NAC for high risk UTUC.
MATERIALS AND METHODS
The National Cancer Database (NCDB) is a hospital registry-based cancer database, sponsored by the American College of Surgeons and American Cancer Society. Data is collected from over 1500 Commission on Cancer (CoC)-accredited facilities. The de-identified data represents more than 70 percent of newly diagnosed cancer cases in the United States and Puerto Rico.
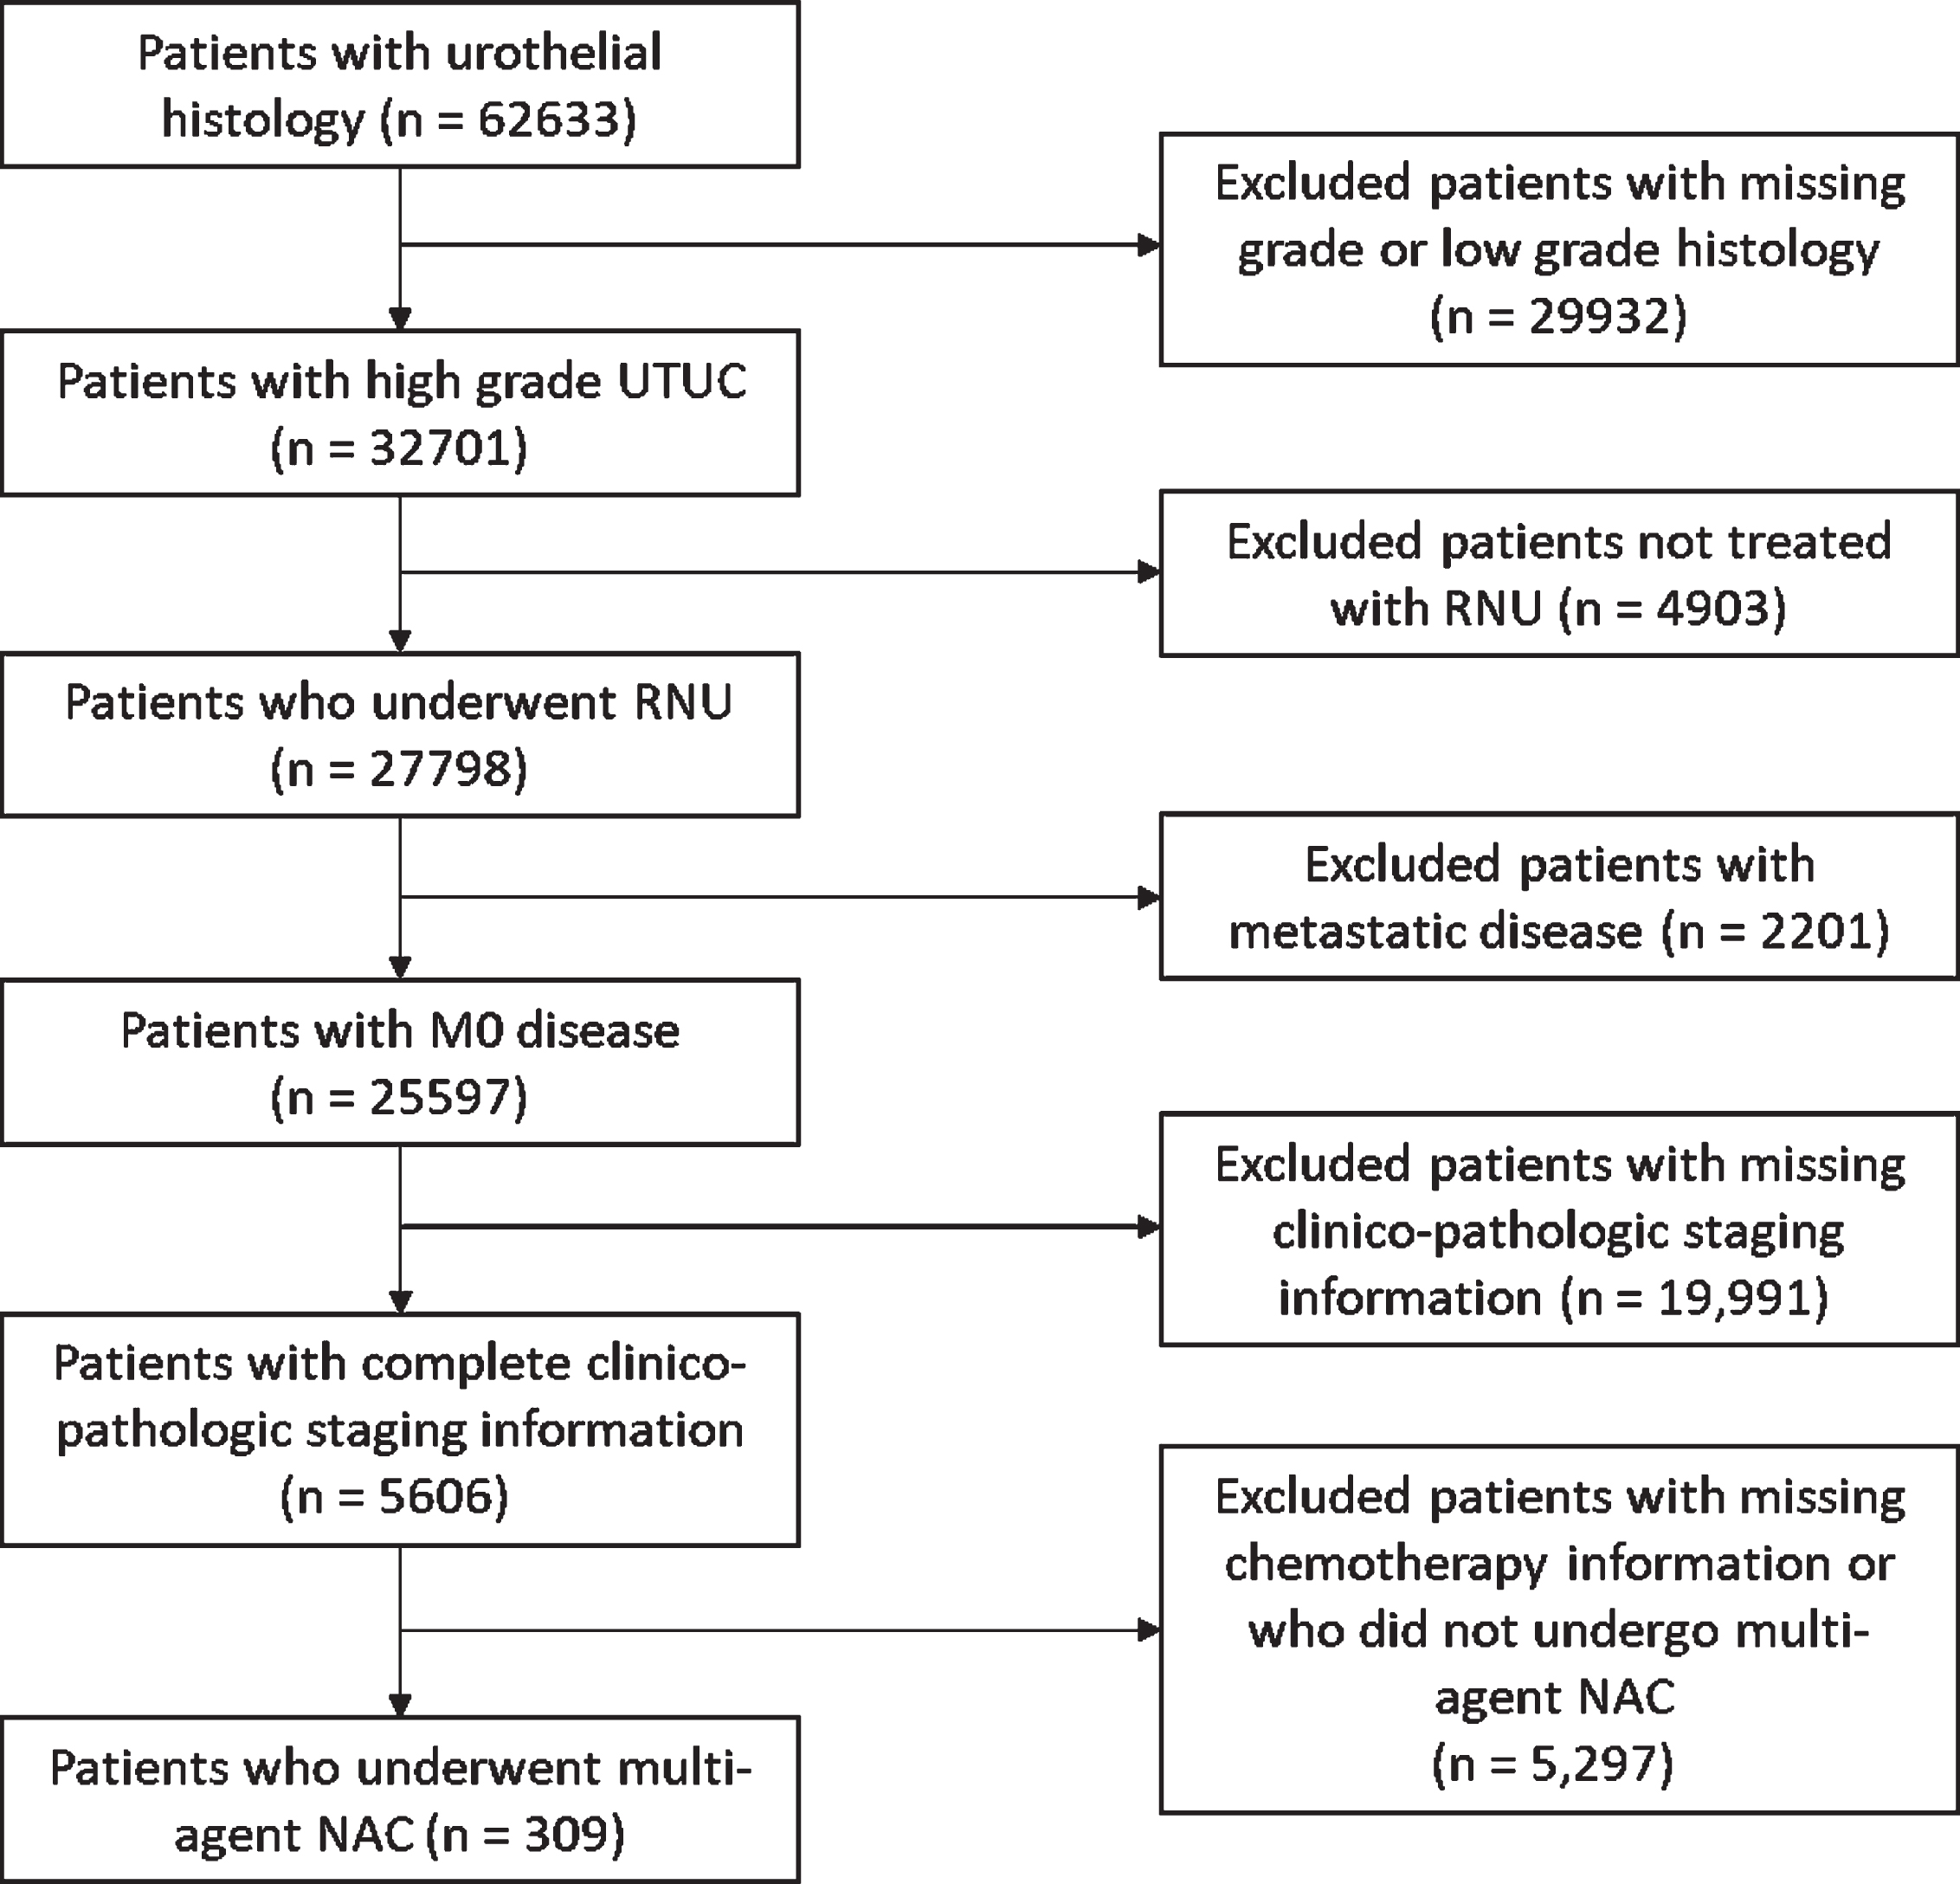
We identified all patients from 2004 to 2016 with non-metastatic high grade UTUC who received multi-agent NAC followed by RNU. To do this, all patients with disease in the kidney, renal pelvis, and ureter were combined into one data set, using the International Classification of Diseases for Oncology, Third Edition (ICD-O-3) classification codes C64.9, C65.9, and C66.9. Data from the renal pelvis and ureter were then isolated, and urothelial histology only cases defined (ICD-O-3 codes≥8120 and≤8139) followed by high grade on pathology. Patients who underwent RNU were then isolated (ICD-O-3 codes≥30 and≤90), and patients with non-metastatic disease were then selected. Patients with incomplete clinical or pathologic staging information were excluded. Patients who underwent multi-agent NAC were then identified, using the systemic surgery sequence field value code 2 or 4, and chemo sequence code 3 (Fig. 1).
Fig. 1
Inclusion and exclusion criteria for cohort selection. UTUC: upper tract urothelial carcinoma; RNU: radical nephroureterectomy; M0: non-metastatic disease; NAC: neoadjuvant chemotherapy.
pCR rates and pDS rates were examined, with subgroup analysis performed for node-positive (N+) disease and N0 disease. pCR was defined as pT0 N0 disease at RNU, and pDS was defined as pT stage less than cT stage and/or pN stage less than cN stage, at RNU.
Statistical analysis
Univariate and multivariate logistic regression was performed to identify clinical variables that predicted complete response and pathological downstaging. Kaplan-Meier methods and log-rank testing were used for survival analysis for patients with complete response and downstaging. Cox proportional hazard methods were used to estimate overall survival. Patients who were diagnosed in 2016 were excluded from survival analysis, as survival data was not present. Multicollinearity was evaluated by examining the variance inflation factor (VIF) for our multivariate models, with the VIF for all individual predictor variables being less than 1.5. Statistical analysis was performed using R® software, with all tests 2-sided and p < 0.05 considered statistically significant.
RESULTS
Complete response and downstaging rates
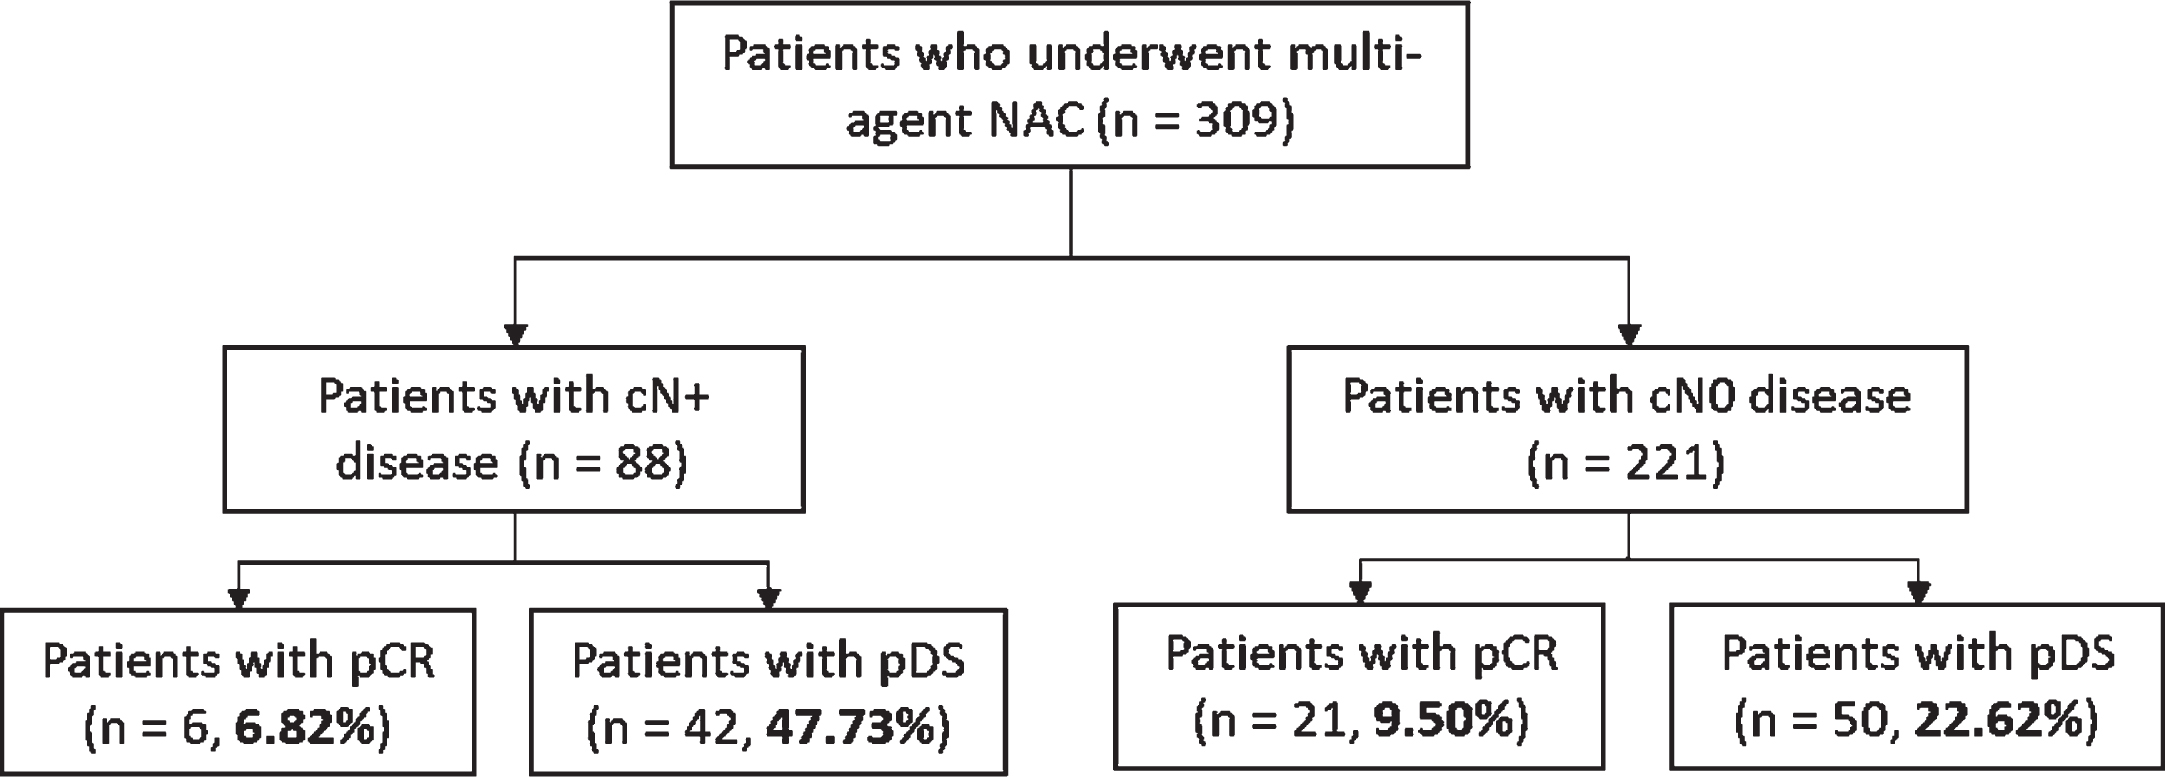
Overall, 32,701 patients with high grade UTUC were identified from 2004 to 2016. Out of 5,606 patients with complete clinical and pathologic staging information, 309 patients (5.51%) received multi-agent NAC followed by RNU (Table 1). The exact NAC chemotherapy regimen administered was not captured in the NCDB data set. Overall, 27 patients (8.74%) had pCR, and 92 (29.77%) had pDS (Fig. 2). In subgroup analysis, pCR and pDS rates for cN+ disease were 6.82% and 47.73% respectively, and for the cN0 subgroup, 9.50% and 22.62% respectively. (Fig. 3).
Table 1
Demographics of all patients with complete clinicopathologic staging information (n = 5606)
| No NAC (n = 5297) | Received NAC (n = 309) | P-value | |
| Age | 73.0 (65.0 – 80.0) | 67.0 (61.0 – 73.0) | <0.0001 |
| Female Sex | 2,156 (40.9%) | 113 (36.6%) | 0.14 |
| Race | 0.071 | ||
| White | 4,816 (91.5%) | 272 (88.0%) | |
| Black | 221 (4.2%) | 21 (6.8%) | |
| Other | 229 (4.3%) | 16 (5.2%) | |
| Hispanic | 173 (3.4%) | 9 (3.0%) | 0.87 |
| Insurance | 0.0001 | ||
| Private Insurance | 1,381 (26.9%) | 116 (38.9%) | |
| Medicare | 3,550 (69.1%) | 170 (57.0%) | |
| Medicaid | 144 (2.8%) | 8 (2.7%) | |
| Uninsured | 63 (1.2%) | 4 (1.3%) | |
| Charlson Comorbidity Score | 0.008 | ||
| 0 | 3,569 (67.8%) | 237 (76.7%) | |
| 1 | 1,136 (21.6%) | 53 (17.2%) | |
| 2 | 382 (7.3%) | 13 (4.2%) | |
| > = 3 | 179 (3.4%) | 6 (1.9%) | |
| Facility Type | <0.0001 | ||
| Academic | 2,313 (44.1%) | 207 (67.2%) | |
| Community | 2,234 (42.6%) | 73 (23.7%) | |
| Other | 701 (13.4%) | 28 (9.1%) | |
| cT Stage | <0.0001 | ||
| cT0 | 29 (0.6%) | 2 (0.6%) | |
| cTa | 1,263 (24.0%) | 34 (11.0%) | |
| cTis | 254 (4.8%) | 9 (2.9%) | |
| cT1 | 1,614 (30.6%) | 93 (30.1%) | |
| cT2 | 693 (13.2%) | 61 (19.7%) | |
| cT3 | 1,186 (22.5%) | 92 (29.8%) | |
| cT4 | 227 (4.3%) | 18 (5.8%) | |
| cN Stage | <0.0001 | ||
| cN0 | 4,843 (92.0%) | 221 (71.5%) | |
| cN1 | 219 (4.2%) | 42 (13.6%) | |
| cN2 | 185 (3.5%) | 46 (14.9%) | |
| cN3 | 19 (0.4%) | 0 (0.0%) | |
| pT Stage | <0.0001 | ||
| pT0 | 22 (0.4%) | 28 (9.1%) | |
| pTa | 971 (18.4%) | 38 (12.3%) | |
| pTis | 162 (3.1%) | 18 (5.8%) | |
| pT1 | 1,078 (20.5%) | 40 (12.9%) | |
| pT2 | 809 (15.4%) | 52 (16.8%) | |
| pT3 | 1,861 (35.3%) | 111 (35.9%) | |
| pT4 | 353 (6.7%) | 22 (7.1%) | |
| pTX | 10 (0.2%) | 0 (0.0%) | |
| pN Stage | <0.0001 | ||
| pN0 | 4,603 (87.4%) | 228 (73.8%) | |
| pN1 | 317 (6.0%) | 30 (9.7%) | |
| pN2 | 323 (6.1%) | 51 (16.5%) | |
| pN3 | 23 (0.4%) | 0 (0.0%) | |
| pM+ | 58 (1.1%) | 3 (1.0%) | 1.00 |
| Positive Margins | 617 (12.0%) | 29 (9.6%) | 0.23 |
| Primary Site: Ureter | 2,232 (42.4%) | 122 (39.5%) | 0.34 |
| Surgical Approach | <0.0001 | ||
| Robotic | 1,095 (30.0%) | 109 (42.7%) | |
| Laparoscopic | 1,282 (35.2%) | 58 (22.7%) | |
| Open | 1,270 (34.8%) | 88 (34.5%) | |
| LVI present | 842 (26.4%) | 54 (26.6%) | 0.93 |
| XRT given | 165 (3.1%) | 13 (4.2%) | 0.31 |
Fig. 2
Overall pathological complete response and pathological downstaging rates. NAC: neoadjuvant chemotherapy; pCR: pathologic complete response; pDS: pathologic downstaging.
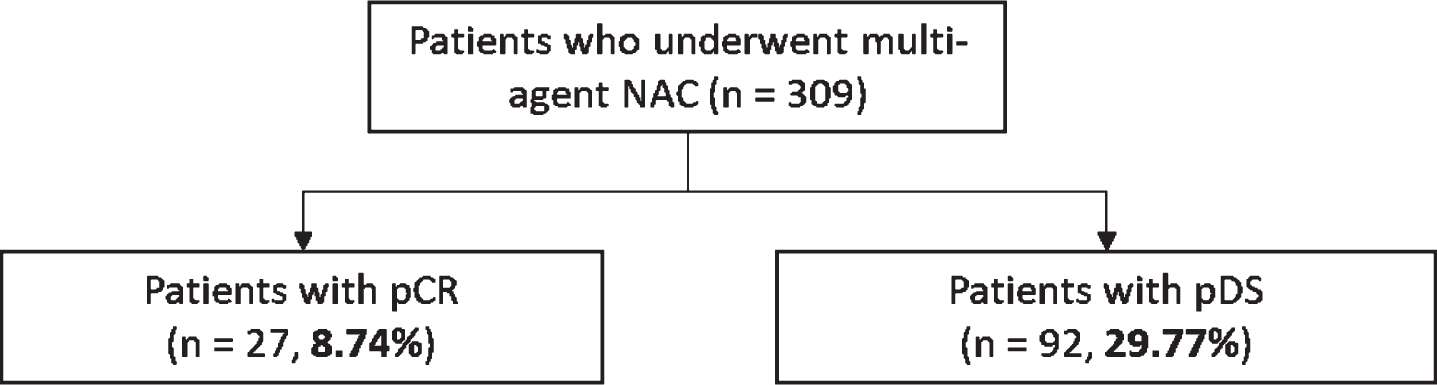
Fig. 3
Pathological complete response and pathological downstaging rates for node-positive and node-negative subgroups. NAC: neoadjuvant chemotherapy; cN+: clinical node-positive; cN0: clinical node-negative; pCR: pathologic complete response; pDS: pathologic downstaging.
Predictors of complete response and downstaging
In multivariate analysis, the only predictor of pCR was female sex (OR 2.94, 95% CI 1.30 – 6.88, p = 0.010) (Table 2). A primary disease site located in the ureter approached but did not pass the threshold for statistical significance for predicting pCR (OR 2.07, 95% CI 0.90 – 4.82, p = 0.087).
Table 2
Univariate and multivariate analysis of variables predicting pathological complete response in patients who received multi-agent NAC (n = 309)
| Univariate Analysis | Logistic Multivariate Analysis | |||
| OR (95% CI) | p Value | OR (95% CI) | p Value | |
| Age | 0.99 (0.99 – 1.01) | 0.81 | ||
| Year of Diagnosis | 1.01 (0.99 – 1.01) | 0.85 | ||
| Sex | ||||
| Male | Reference | Reference | ||
| Female | 2.77 (1.24 – 6.37) | 0.013 | 2.94 (1.30 – 6.88) | 0.010 |
| Race | ||||
| White | Reference | Reference | ||
| Black | 0.57 (0.03 – 2.93) | 0.590 | 0.52 (0.03 – 2.80) | 0.543 |
| Other | 3.79 (1.00 – 11.95) | 0.031 | 2.92 (0.73 – 9.84) | 0.099 |
| Hispanic | ||||
| Not Hispanic | Reference | |||
| Hispanic | 0.91 (0.76 – 1.10) | 0.352 | ||
| Insurance | ||||
| Private Insurance | Reference | |||
| Medicare | 1.02 (0.95 – 1.09) | 0.512 | ||
| Medicaid | 0.93 (0.75 – 1.13) | 0.454 | ||
| Uninsured | 0.93 (0.70 – 1.23) | 0.590 | ||
| Charlson Comorbidity Index | ||||
| CCI 0 | Reference | |||
| CCI 1 | 1.07 (0.34 – 2.78) | 0.895 | ||
| CCI 2 | 0.86 (0.05 – 4.69) | 0.885 | ||
| CCI> = 3 | 0.01 (0.01 – 9.99) | 0.998 | ||
| Facility Type | ||||
| Academic | Reference | |||
| Community | 0.54 (0.15 – 1.49) | 0.279 | ||
| Other | 1.12 (0.25 – 3.58) | 0.860 | ||
| Clinical T Stage | ||||
| cT0 | Reference | |||
| cTa | 1.06 (0.71 – 1.59) | 0.776 | ||
| cTis | 1.00 (0.65 – 1.54) | 1.000 | ||
| cT1 | 1.14 (0.7 6 – 1.69) | 0.525 | ||
| cT2 | 1.09 (0.72 – 1.61) | 0.688 | ||
| cT3 | 1.08 (0.72 – 1.60) | 0.708 | ||
| cT4 | 1.06 (0.70 – 1.60) | 0.793 | ||
| Clinical N Stage | ||||
| cN0 | Reference | |||
| cN1 | 0.48 (0.07 – 1.71) | 0.329 | ||
| cN2 | 0.91 (0.25 – 2.53) | 0.864 | ||
| Primary Site | ||||
| Renal Pelvis | Reference | Reference | ||
| Ureter | 2.04 (0.92 – 4.61) | 0.048 | 2.07 (0.90 – 4.82) | 0.087 |
| LVI | ||||
| LVI not present | Reference | |||
| LVI present | 0.92 (0.86 – 1.02) | 0.091 | ||
Predictors of pDS were clinical N1 and N2 disease (cN1 vs. cN0: OR 6.40, p < 0.001; cN2 vs. cN0: OR 7.46, p < 0.001). An adverse predictor of pDS was the presence of LVI (OR 0.14, 95% CI 0.05 – 0.37, p < 0.001). (Table 3).
Table 3
Univariate and multivariate analysis of variables predicting pathological downstaging in patients who received multi-agent NAC (n = 309)
| Univariate Analysis | Logistic Multivariate Analysis | |||
| OR (95% CI) | p Value | OR (95% CI) | p Value | |
| Age | 0.99 (0.99 – 1.01) | 0.439 | ||
| Year of Diagnosis | 1.01 (0.99 – 1.01) | 0.527 | ||
| Sex | ||||
| Male | Reference | Reference | ||
| Female | 1.73 (1.05 – 2.85) | 0.032 | 1.58 (0.78 – 3.18) | 0.203 |
| Race | ||||
| White | Reference | |||
| Black | 0.94 (0.33 – 2.41) | 0.907 | ||
| Other | 1.07 (0.33 – 3.05) | 0.901 | ||
| Hispanic | ||||
| Not Hispanic | Reference | |||
| Hispanic | 0.73 (0.54 – 1.35) | 0.102 | ||
| Insurance | ||||
| Private Insurance | Reference | |||
| Medicare | 1.05 (0.63 – 1.76) | 0.857 | ||
| Medicaid | 0.77 (0.11 – 3.54) | 0.758 | ||
| Uninsured | 0.77 (0.04 – 6.26) | 0.825 | ||
| Charlson Comorbidity Index | ||||
| CCI 0 | Reference | |||
| CCI 1 | 0.64 (0.31 – 1.26) | 0.219 | ||
| CCI 2 | 0.98 (0.26 – 3.11) | 0.973 | ||
| CCI> = 3 | 1.10 (0.15 – 5.77) | 0.912 | ||
| Facility Type | ||||
| Academic | Reference | |||
| Community | 0.70 (0.37 – 1.30) | 0.278 | ||
| Other | 1.75 (0.77 – 3.91) | 0.171 | ||
| Clinical T Stage | ||||
| cT0 | Reference | |||
| cTa | 1.06 (0.56 – 2.01) | 0.857 | ||
| cTis | 1.11 (0.56 – 2.23) | 0.752 | ||
| cT1 | 1.44 (0.77 – 2.71) | 0.256 | ||
| cT2 | 1.27 (0.68 – 2.41) | 0.447 | ||
| cT3 | 1.43 (0.76 – 2.68) | 0.265 | ||
| cT4 | 1.48 (0.76 – 2.85) | 0.247 | ||
| Clinical N Stage | ||||
| cN0 | Reference | Reference | ||
| cN1 | 2.82 (1.42 – 5.61) | 0.003 | 6.40 (2.49 – 17.29) | <0.001 |
| cN2 | 3.42 (1.77 – 6.64) | <0.001 | 7.46 (2.63 – 23.08) | <0.001 |
| Primary Site | ||||
| Renal Pelvis | Reference | |||
| Ureter | 0.80 (0.48 – 1.33) | 0.398 | ||
| LVI | ||||
| LVI not present | Reference | Reference | ||
| LVI present | 0.33 (0.13 – 0.75) | 0.013 | 0.14 (0.05 – 0.37) | <0.001 |
Age, time from diagnosis to treatment, race, Hispanic status, insurance status, Charlson comorbidity index, facility type (academic/community), tumor location, and clinical T stage were not predictive of pCR/pDS.
Survival analysis
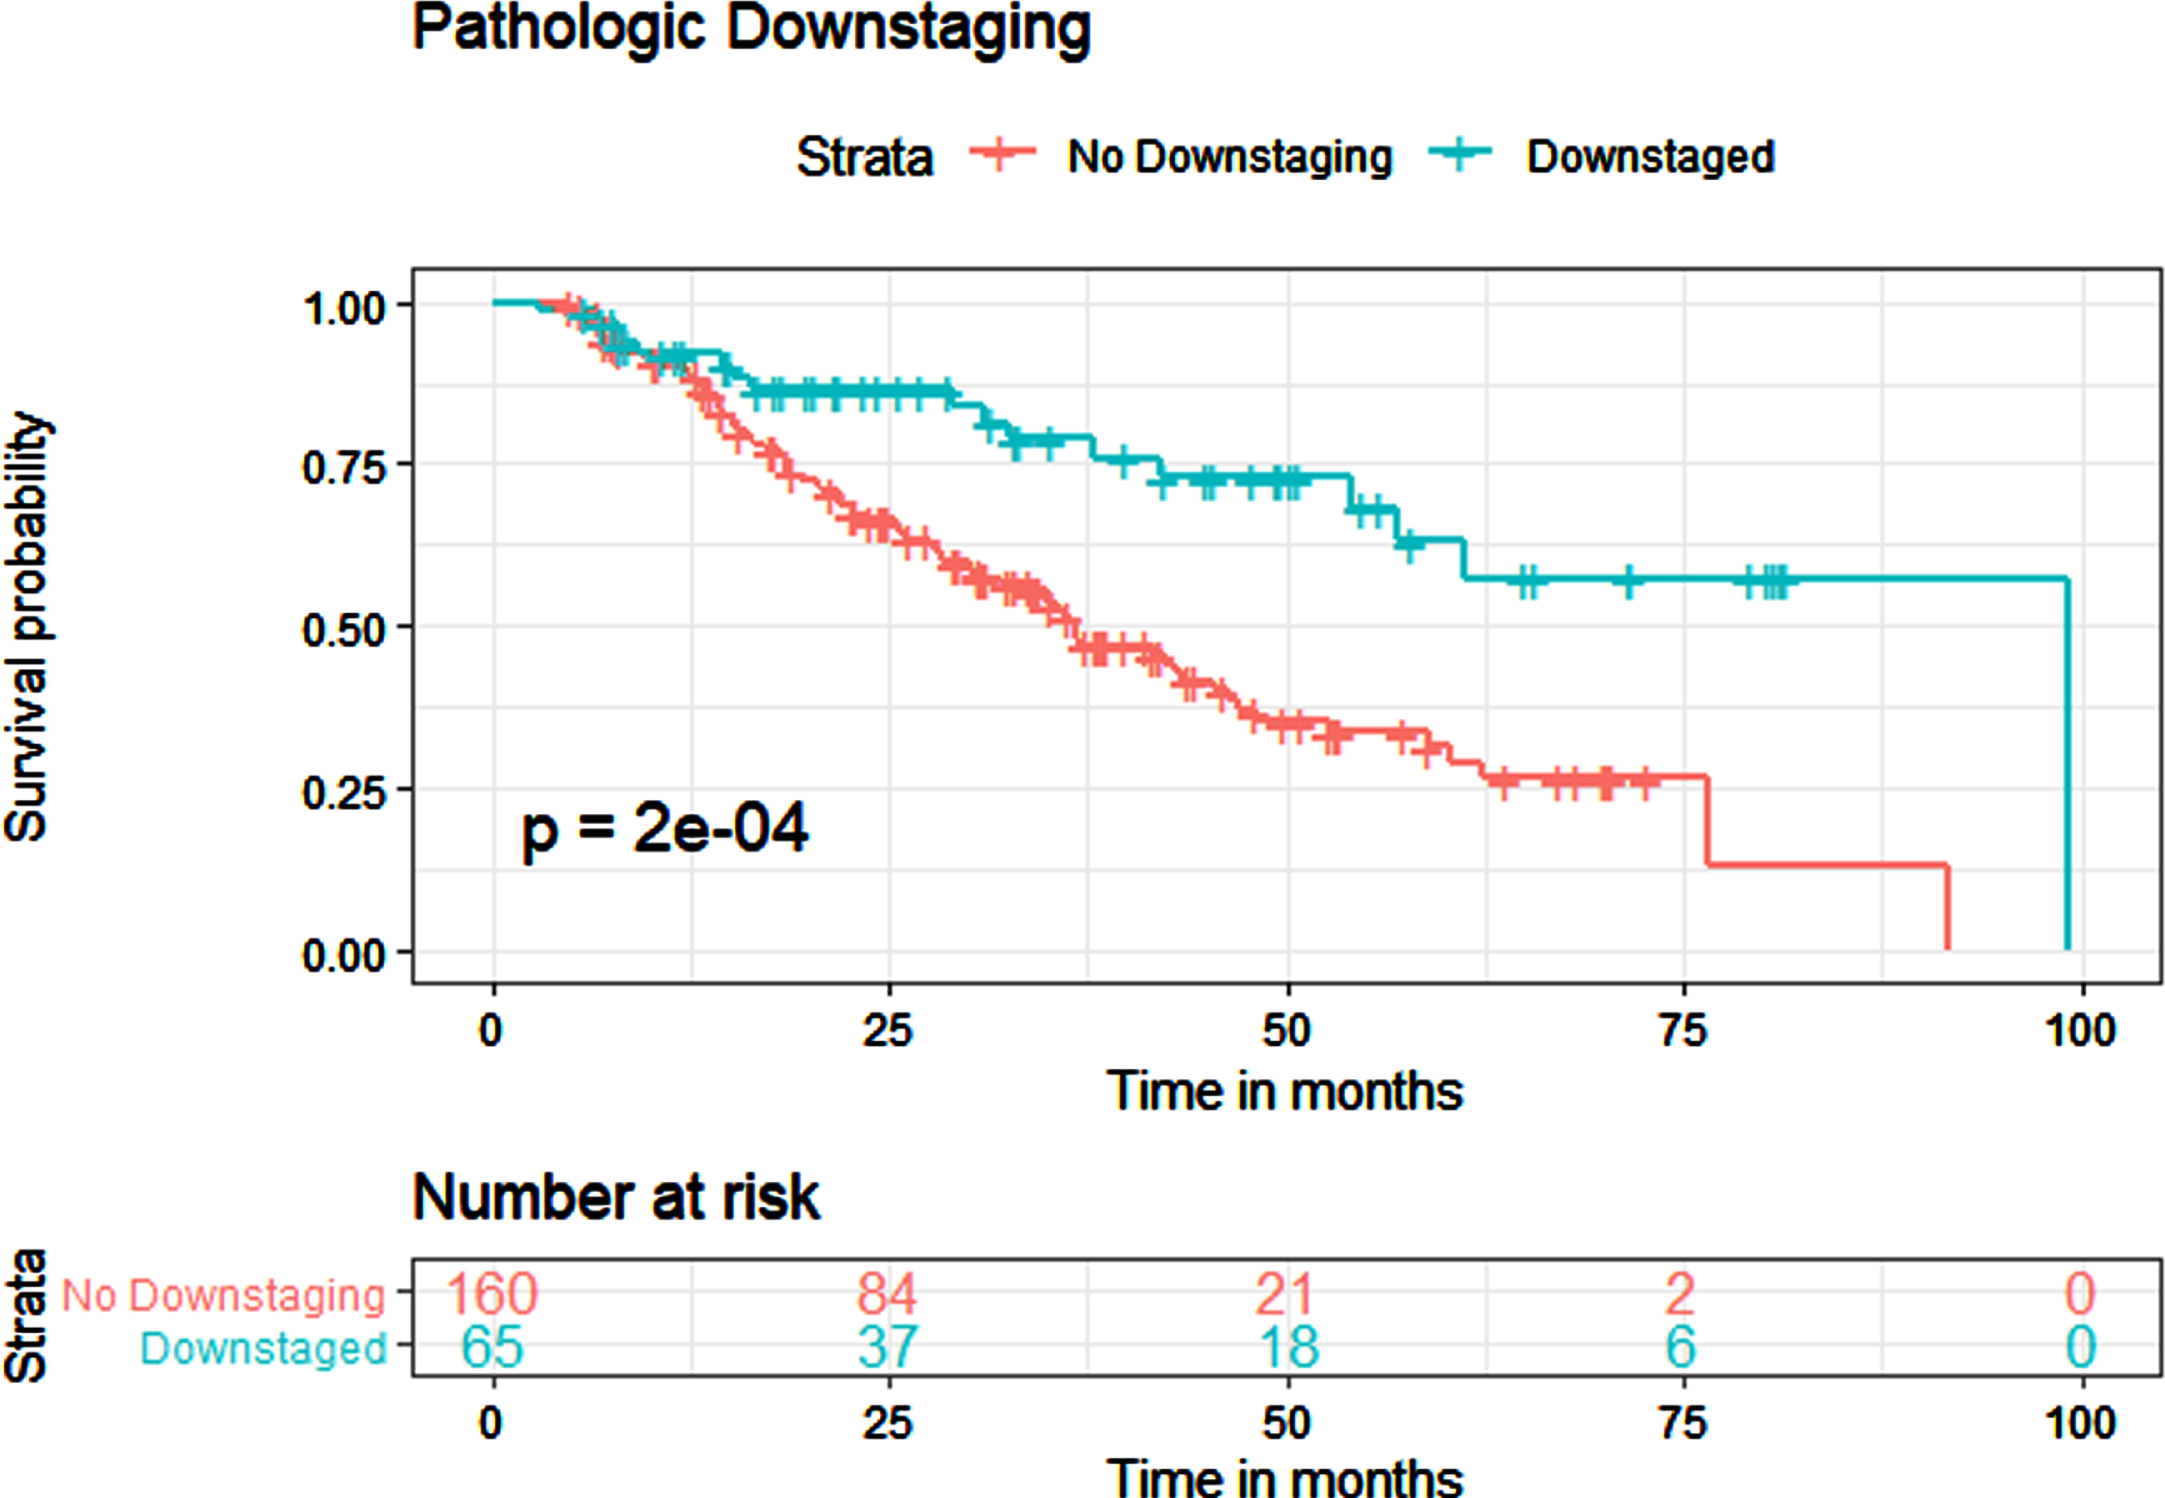
The median OS for all patients who received NAC was 45.5 months. In Kaplan-Meier estimates, pCR was associated with improved OS (p < 0.001) with a median survival of 99.1 months for patients with pCR and 42.1 months for patients without pCR (Fig. 4). pDS was also associated with improved OS (p < 0.001), with a median survival of 99.1 months for patients with pDS and 36.7 months for patients without pDS (Fig. 5).
Fig. 4
Kaplan-Meier estimates for overall survival in patients who received NAC, with and without pathological complete response. CR: complete response.
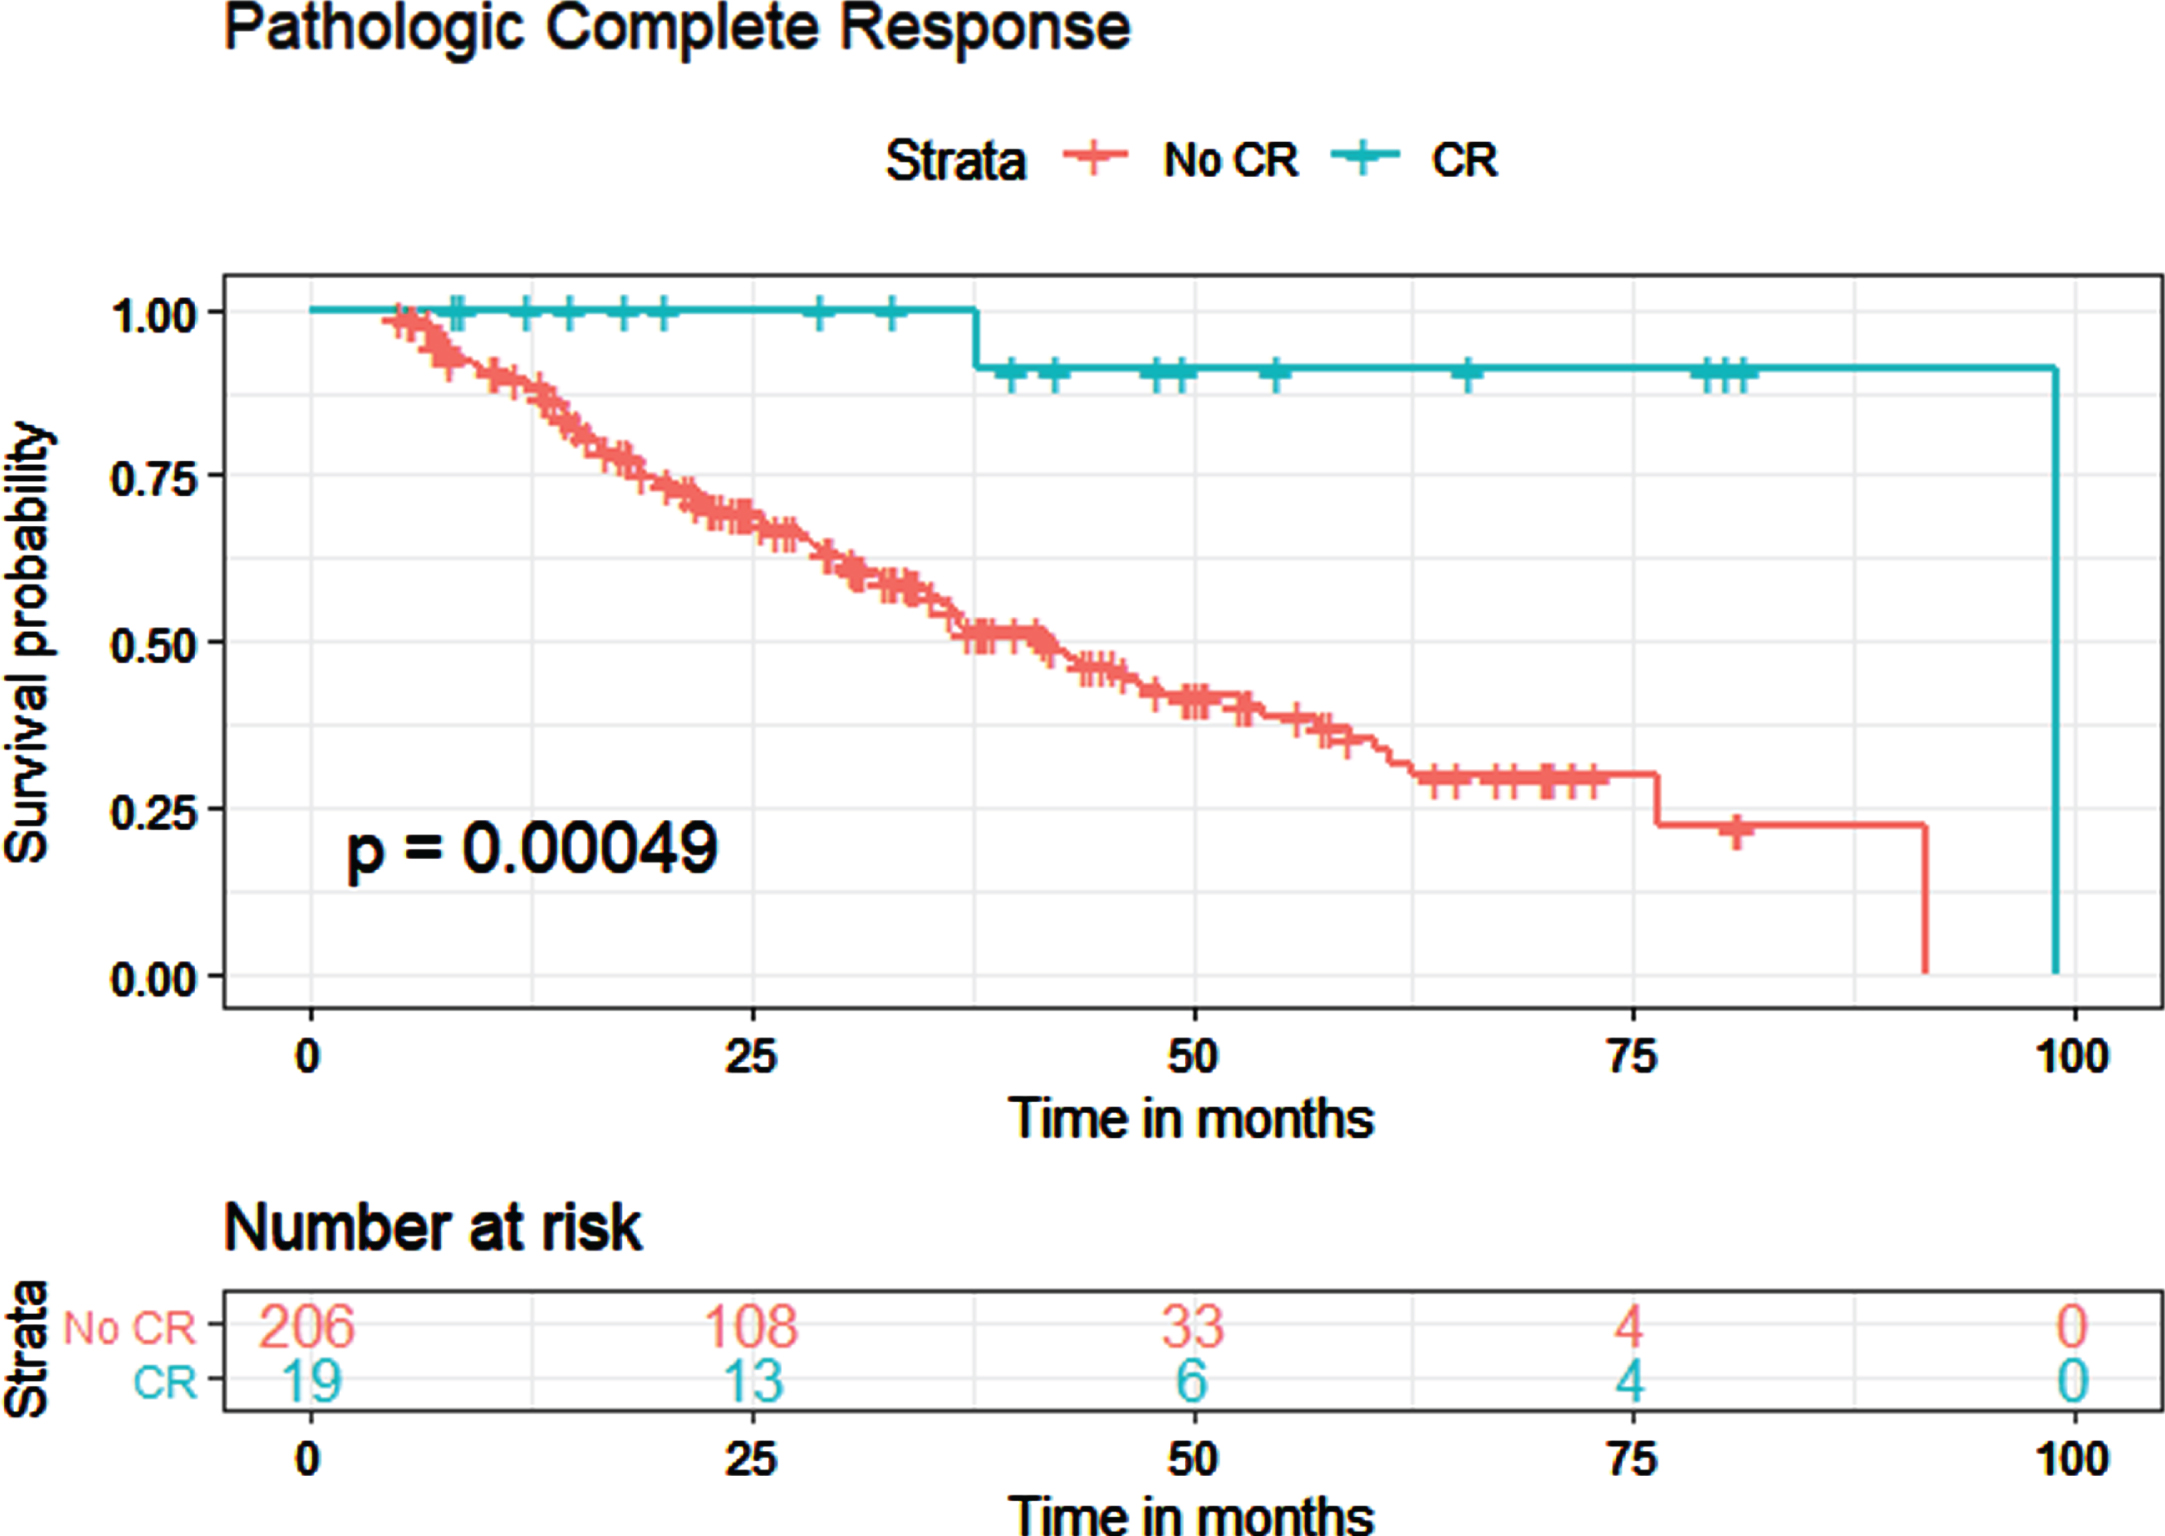
Fig. 5
Kaplan-Meier estimates for overall survival in patients who received NAC, with and without pathological downstaging.
On multivariate Cox Proportional Hazards modeling, LVI was the only prognostic factor for OS after NAC (HR 2.85, 95% CI 1.70 – 4.76, p < 0.001) (Table 3), showing a significantly worsened chance of overall survival if LVI was present. The presence of pCR and pDS were associated with improved survival on univariate analysis, but not on multivariate analysis. Year of diagnosis, sex, race, Hispanic status, insurance status, Charlson comorbidity index, facility type (academic/community), tumor location, and clinical T stage were not statistically significant predictors of OS.
Table 4
Univariate and multivariate Cox Proportional Hazard model for overall survival in patients who received multi-agent NAC (n = 309)
| Cox Proportional Hazard | Cox Proportional Hazard | |||
| Univariate Analysis | Multivariate Analysis | |||
| HR (95% CI) | p Value | OR (95% CI) | p Value | |
| Age | 1.02 (0.99 – 1.04) | 0.165 | ||
| Year of Diagnosis | 0.91 (0.83 – 0.99) | 0.047 | 0.98 (0.83 – 1.15) | 0.779 |
| Sex | ||||
| Male | Reference | |||
| Female | 0.78 (0.51 – 1.18) | 0.236 | ||
| Race | ||||
| White | Reference | |||
| Black | 0.67 (0.27 – 1.65) | 0.387 | ||
| Other | 0.31 (0.07 – 1.27) | 0.103 | ||
| Hispanic | ||||
| Not Hispanic | Reference | |||
| Hispanic | 1.92 (0.61 – 6.08) | 0.268 | ||
| Insurance | ||||
| Private Insurance | Reference | |||
| Medicare | 0.86 (0.57 – 1.31) | 0.483 | ||
| Medicaid | 0.41 (0.06 – 2.98) | 0.376 | ||
| Uninsured | 1.31 (0.31 – 5.42) | 0.714 | ||
| Charlson Comorbidity Index | ||||
| CCI 0 | Reference | |||
| CCI 1 | 1.29 (0.80 – 2.06) | 0.294 | ||
| CCI 2 | 1.11 (0.27 – 4.55) | 0.882 | ||
| CCI> = 3 | 2.19 (0.69 – 6.96) | 0.186 | ||
| Facility Type | ||||
| Academic | Reference | |||
| Community | 1.23 (0.77 – 1.95) | 0.383 | ||
| Other | 1.25 (0.54 – 2.90) | 0.604 | ||
| Clinical T Stage | ||||
| cT0 | Reference | |||
| cTa | 0.43 (0.05 – 3.90) | 0.457 | ||
| cTis | 0.32 (0.02 – 5.13) | 0.421 | ||
| cT1 | 0.63 (0.09 – 4.73) | 0.658 | ||
| cT2 | 1.02 (0.13 – 7.71) | 0.985 | ||
| cT3 | 1.76 (0.24 – 12.81) | 0.576 | ||
| cT4 | 2.12 (0.27 – 16.40) | 0.472 | ||
| Clinical N Stage | ||||
| cN0 | Reference | |||
| cN1 | 1.63 (0.95 – 2.81) | 0.074 | ||
| cN2 | 1.59 (0.99 – 2.57) | 0.056 | ||
| Primary Site | ||||
| Renal Pelvis | Reference | |||
| Ureter | 0.77 (0.51 – 1.15) | 0.201 | ||
| LVI | ||||
| LVI not present | Reference | |||
| LVI present | 3.10 (1.87 – 5.14) | <0.001 | 2.85 (1.70 – 4.76) | <0.001 |
| Pathologic Complete Response | ||||
| No Complete Response | Reference | |||
| Complete Response | 0.07 (0.01 – 0.50) | 0.008 | 0.27 (0.04 – 2.12) | 0.215 |
| Pathologic Downstaging | ||||
| No Downstaging | Reference | |||
| Downstaging | 0.37 (0.22 – 0.64) | <0.001 | 0.94 (0.49 – 1.80) | 0.856 |
DISCUSSION
In one of the largest cohorts examined so far, we found that the overall rate of neoadjuvant chemotherapy in UTUC was low, at 5.51%. This is expected, given the lack of high-quality prospective data in support of NAC, and likely represents extrapolation from bladder cancer data. NAC is being increasingly adopted in urothelial bladder cancer [4, 5], with improved survival demonstrated in prospective randomized controlled trials [6] and meta-analyses, yielding an absolute survival benefit of around 5% with platinum-based combination chemotherapy at 5 years [7]. While data in support of NAC for UTUC is accumulating, it is not considered standard-of-care [9– 13].
Overall pCR and pDS rates in our cohort were 8.74% and 29.77%. The NCDB data does not capture the exact chemotherapy regimen administered so we could not assess the impact of individual chemotherapeutics, number of cycles, or whether a full course was completed, and could only select for multi-agent chemotherapy. Margulis et al. [13] recently published some of the first prospective data on pCR rates after NAC; 4 out of 29 (13.8%) patients achieved pCR in this small prospective cohort. A smaller multi-center UTUC retrospective series found a pCR rate of 10.1% and pDS rate of 34.8% [11], and retrospective analysis of a smaller NCDB cohort found a pCR rate of 6.1% and pDS rate of 25.2% [12] after NAC. Finally, a recent pooled meta-analysis across 14 studies had a pCR rate of 11% and a partial response rate (defined as< = pT1N0M0) of 43% [9]. Our pCR and pDS rates do appear to be slightly lower than these series, and differences may be due to patient characteristics, the exact NAC regimen administered, and accuracy of clinical staging. Data from the bladder cancer literature show pCR rates ranging from 15– 40% and pDS rates ranging from 30– 50% [6, 14– 16]. pCR and pDS rates for UTUC in the literature so far, including our results, do appear to be significantly lower than rates for bladder cancer. This may be explained by the fact that the majority of bladder cancers receive transurethral resection prior to cystoprostatectomy, which may increase the complete response and downstaging rates. In addition, NAC has been utilized in bladder cancer for some time, with established effective regimens; this may not be the case for UTUC with widely varying regimens. Further, UTUC is notoriously difficult to clinically stage compared to bladder cancer, so many clinical cases may be erroneously staged, which would affect the pCR and pDS rates. Finally, the dwell time of urine in the kidney is much shorter than its dwell time in the bladder, which may potentially have an effect with the excretion of chemotherapy in the urine, although this has not been formally studied.
A distinction between chemotherapy given for clinically node-negative and node-positive disease needs to be considered, and hence we performed subgroup analysis based on node-positivity. Our subgroup analysis showed that for clinical N+ disease, pCR and pDS rates were 6.82% and 47.73%, and for clinical N0 disease, pCR and pDS rates were 9.50% and 22.62%. Interestingly, there was a similar rate of pCR between cN+ and cN0 patients, but our pDS rate was significantly higher for clinical N+ disease. Foerster et al. looked at similar outcomes, and reported a pCR and pDS rate of 9.9% and 28.2% for cN+ disease and a pCR and pDS rate of of 10.2% and 51.0% for cN0/NX disease [11]. However, they defined pDS as pT1 N0/X or less at RNU, rather than comparing clinical and pathological stages, which may explain this disparity. As mentioned in the Methods, our analysis defined pDS as pT stage less than cT stage and/or pN stage less than cN stage, at RNU, which is the commonly accepted definition. Our definition eliminates those cases where patients with cT1 disease may have received NAC and have pT1 disease after RNU, and therefore should not be classified as pDS. Apart from this, there is limited literature looking at pDS rates in N+ patients. While our results should be interpreted with caution, this could indicate that node-positive disease may be an ideal target for neoadjuvant chemotherapy, leading to opportunities for downstaging. Particularly in clinical cases where patients are thought to be node-positive, this may strengthen the case for NAC prior to RNU, given the high pDS rate seen here. However, the specific regimen and cycles of chemotherapy used, patient characteristics, challenges with clinical staging, and sample size may all be confounding factors that affect this result. Further, more prospective data needs to be accumulated examining the effect of NAC for UTUC.
In multivariate analysis, the only predictor of pCR was female sex. A primary disease site located in the ureter approached but did not pass the threshold for statistical significance for predicting pCR. Clinical N1 and N2 disease were strong predictors of pDS. The only adverse predictor of pDS was the presence of LVI. Age, time from diagnosis to treatment, race, Hispanic status, insurance status, Charlson comorbidity index, facility type (academic/community), tumor location, and clinical T stage were not predictive of pCR/pDS. Previous data on chemotherapy regimens and number of administered cycles have not been shown to predict pCR/pDS, but have demonstrated a trend towards increased chemotherapy being associated with increased response [11]. Notably, they did find that ureteric tumor location was predictive of pCR compared to pelvicaliceal location, and that invasion on CT urography predicted pDS. Almassi et al. also found ureteric location to be predictive of pCR [12]. Our data adds to this by showing that female sex may further be predictive of a complete response and cN+ disease predictive of downstaging, while LVI adversely affects downstaging. This may represent differences in tumor biology between males and females and different stages of presentation and treatment, although this needs to be studied further. Node-positive disease may further present a unique opportunity to deliver NAC and potentially have disease downstaged, although prospective trials are required to confirm this.
In Kaplan-Meier analysis, we found that pCR and pDS were both associated with improved OS. Median survival was 99.1 months for pCR patients compared to 42.1 months for patients without pCR and 99.1 months for pDS patients compared to 36.7 months for patients without pDS. With overall pCR and pDS rates of 8.74% and 29.77% in our cohort, this translates to a meaningful OS benefit with the addition of NAC when pCR or pDS is present. This effect is amplified even more in the N+ subgroup, which had even higher pDS rates. An increasing amount of recent data has shown an association with NAC and improved survival. A meta-analysis of several small cohorts found the pooled HR was 0.47 for OS, 0.50 for RFS, and 0.37 for CSS, with NAC associated with a significant OS improvement [17]. Khan et al. [18] found NAC had a statistically significant association with improved OS (p = 0.017), with subgroup analysis of patients with non-organ confined tumors also showing improved OS with NAC administration. Finally, another retrospective review of 112 patients by Porten et al. found that NAC was associated with improved OS and disease-specific survival [19]. Adding to this, our data further shows a direct survival benefit to pCR and pDS after NAC in UTUC.
On multivariate Cox Proportional Hazards modeling, the presence of LVI was the only prognostic factor for OS with a HR of 2.85, showing a significantly worsened chance of overall survival in patients who received NAC if LVI was present. The presence of pCR and pDS were associated with improved survival on univariate analysis, but not on multivariate analysis. Year of diagnosis, sex, race, Hispanic status, insurance status, Charlson comorbidity index, facility type (academic/community), tumor location, and clinical T stage were not statistically significant predictors of OS. LVI has been shown to be an adverse prognostic factor in UTUC in multiple studies; it has been additionally associated with higher pathological tumor stage, grade, and lymph node metastasis [20– 22]. Further, two recent meta-analyses, with 17 trials (4,896 patients) and 31 trials (14,653 patients) each [21, 22], have confirmed a significant correlation with LVI and poorer recurrence-free survival, cancer-specific survival, and overall survival. However, these studies do not specifically look at the patient population who receive NAC. Foerster et al. also observed that pDS was a prognostic factor for recurrence-free survival, cancer-specific survival, and overall survival in patients who received NAC, but did not include LVI as one of their variables [11]. The fact that pCR and pDS did not achieve statistical significance in predicting an OS improvement in multivariate analysis of our cohort may be due to the small numbers of patients involved who had pCR and pDS, as well as highlighting the strong effect of LVI as a prognostic factor when included in multivariate analysis, even after evaluating for multicollinearity. Our study further adds to the limited literature in illustrating the negative impact of LVI on survival in the patient population who receive NAC.
Our study has important limitations. Being a national registry-based study, selection bias and confounders are inherent, and results from the American population may not necessarily be representative of an international population. As patients and clinicians were not blinded, detection bias may be present. Exact chemotherapy regimens are not captured in the NCDB, and the choice of NAC and cycles could certainly affect outcomes. Coding errors may exist in the NCDB database, and there was no central pathology review. Surgical approaches of RNU and lymph node dissection templates used are unknown, given the retrospective nature. Finally, given the challenges with clinically staging UTUC, cases may be erroneously staged, which would affect the pCR and pDS rates; this challenge is not unique to this study, but must be mentioned. However, this is the largest study so far examining the effects of NAC on pCR/pDS and survival, and is a nationally representative, multi-institutional cohort which is broadly generalizable. It adds to the limited literature with respect to pCR/pDS rates and highlights predictors of pCR/pDS; it is further the most sizable cohort so far to show that LVI impacts OS and highlight the survival benefit to pCR and pDS after NAC in UTUC.
CONCLUSION
In the largest series examined to date, overall pathological complete response and downstaging rates for non-metastatic high risk upper tract urothelial carcinoma were 8.74% and 29.77% respectively after neoadjuvant chemotherapy. Node-negative and node-positive disease had equivalent rates of complete response, but node-positive disease had a significantly higher rate of downstaging compared to node-negative disease.
Pathologic complete response and downstaging were both associated with improved overall survival after neoadjuvant chemotherapy, and lymphovascular invasion was the strongest negative prognostic factor for overall survival.
Although neoadjuvant chemotherapy appears to be effective, prospective studies are further needed to evaluate.
ACKNOWLEDGMENTS
The authors have no acknowledgements.
FUNDING
This manuscript has been supported by The Frederick J. and Theresa Dow Wallace Fund of the New York Community Trust (Siv Venkat, Douglas Scherr) and by the Ferdinand C. Valentine Fellowship Award from the New York Academy of Medicine (Siv Venkat).
AUTHOR CONTRIBUTIONS
S Venkat: conception, performance of work, interpretation of data, writing the article; P Lewicki: performance of work, interpretation of data, writing the article; S Basourakos: performance of work, writing the article; D Scherr: conception, performance of work, interpretation of data, writing the article.
ETHICAL CONSIDERATIONS
Exempt from IRB approval, as NCDB is de-identified data.
CONFLICT OF INTEREST
S Venkat: No conflicts of interest.
P Lewicki: No conflicts of interest.
S Basourakos: No conflicts of interest.
D Scherr: No conflicts of interest.
REFERENCES
[1] | Roupret M , Babjuk M , Comperat E et al. European Association of Urology guidelines on upper urinary tract urothelial carcinoma: 2017 update. Eur Urol. (2018) ;73: :111–22. |
[2] | Campbell MF , Wein AJ , Kavoussi LR , et al. Campbell-Walsh Urology. Philadelphia: Elsevier; (2016) . |
[3] | Margulis V , Shariat SF , Matin SF , et al. Outcomes of radical nephroureterectomy: a series from the Upper Tract Urothelial Carcinoma Collaboration. Cancer. (2009) ;115: (6):1224–33. |
[4] | Zaid HB , Patel SG , Stimson CJ , et al. Trends in the utilization of neoadjuvant chemotherapy in muscle-invasive bladder cancer: results from the National Cancer Database. Urology. (2014) ;83: (1):75–80. |
[5] | McFerrin C , Davaro F , May A , Raza S , Siddiqui S , Hamilton Z . Trends in utilization of neoadjuvant and adjuvant chemotherapy for muscle invasive bladder cancer. Investig Clin Urol. (2020) ;61: (6):565–72. |
[6] | Grossman HB , Natale RB , Tangen CM et al. Neoadjuvant chemotherapy plus cystectomy compared with cystectomy alone for locally advanced bladder cancer. N Engl J Med. (2003) ;349: :859. |
[7] | Advanced Bladder Cancer Meta-analysis Collaboration. Neoadjuvant chemotherapy in invasive bladder cancer: a systematic review and meta-analysis. Lancet. (2003) ;361: (9373):1927–34. |
[8] | Birtle A , Johnson M , Chester J , et al. Adjuvant chemotherapy in upper tract urothelial carcinoma (the POUT trial): a phase 3, open-label, randomised controlled trial. Lancet. (2020) ;395: (10232):1268–77. |
[9] | Leow JJ , Martin-Doyle W , Fay AP , et al. A systematic review and meta-analysis of adjuvant and neoadjuvant chemotherapy for upper tract urothelial carcinoma. Eur Urol. (2014) ;66: :529. |
[10] | Yang X , Li P , Deng X , et al. Perioperative treatments for resected upper tract urothelial carcinoma: a network meta-analysis. Oncotarget. (2017) ;8: :3568. |
[11] | Foerster B , Abufaraj M , Petros F , et al. Efficacy of Preoperative Chemotherapy for High Risk Upper Tract Urothelial Carcinoma. J Urol. (2020) ;203: (6):1101–8. |
[12] | Almassi N , Gao T , Lee B , et al. Impact of Neoadjuvant Chemotherapy on Pathologic Response in Patients With Upper Tract Urothelial Carcinoma Undergoing Extirpative Surgery. Clin Genitourin Cancer. (2018) ;16: (6):e1237–e1242. |
[13] | Margulis V , Puligandla M , Trabulsi EJ , et al. Phase II Trial of Neoadjuvant Systemic Chemotherapy Followed by Extirpative Surgery in Patients with High Grade Upper Tract Urothelial Carcinoma. J Urol. (2020) ;203: (4):690–8. |
[14] | Zargar-Shoshtari K , Zargar H , Lotan Y , et al. A multi-institutional analysis of outcomes of patients with clinically node positive urothelial bladder cancer treated with induction chemotherapy and radical cystectomy. J Urol. (2016) ;195: :53. |
[15] | Zargar H , Espiritu PN , Fairey AS , et al. Multicenter assessment of neoadjuvant chemotherapy for muscle-invasive bladder cancer. Eur Urol. (2015) ;67: :241. |
[16] | Goel S , Sinha RJ , Bhaskar V , Aeron R , Sharma A , Singh V . Role of gemcitabine and cisplatin as neoadjuvant chemotherapy in muscle invasive bladder cancer: Experience over the last decade. Asian J Urol. (2019) ;6: :222–9. |
[17] | Li K , Xie W , Gao L , et al. Impact of neoadjuvant chemotherapy on survival prognosis and pathological downstaging in patients presenting with high-risk upper tract urothelial carcinoma: A protocol for systematic review and meta analysis. Medicine (Baltimore). (2020) ;99: (18):e20184. |
[18] | Khan AI , Taylor BL , Al Hussein Al Awamlh B , et al. Survival Outcomes in Neoadjuvant Chemotherapy for High-grade Upper Tract Urothelial Carcinoma: A Nationally Representative Analysis. Urology. (2020) ;146: :158–67. |
[19] | Porten S , Siefker-Radtke AO , Xiao L , et al. Neoadjuvant chemotherapy improves survival of patients with upper tract urothelial carcinoma. Cancer. (2014) ;120: (12):1794–9. |
[20] | Liu W , Zhou Z , Dong D , Sun L , Zhang G . Prognostic Value of Lymphovascular Invasion in Node-Negative Upper Urinary Tract Urothelial Carcinoma Patients Undergoing Radical Nephroureterectomy. Yonsei Med J. (2019) ;60: (2):174–81. |
[21] | Lee HY , Li CC , Huang CN , et al. Prognostic significance of lymphovascular invasion in upper urinary tract urothelial carcinoma is influenced by tumor location. Ann Surg Oncol. (2015) ;22: (4):1392–400. |
[22] | Zhang L , Wu B , Zha Z , Zhao H , Yuan J , Feng Y . The Prognostic Value of Lymphovascular Invasion in Patients With Upper Tract Urinary Carcinoma After Surgery: An Updated Systematic Review and Meta-Analysis. Front Oncol. (2020) ;10: :487. |
[23] | Ku JH , Byun SS , Jeong H , Kwak C , Kim HH , Lee SE . Lymphovascular invasion as a prognostic factor in the upper urinary tract urothelial carcinoma: a systematic review and meta-analysis. Eur J Cancer. (2013) ;49: (12):2665–80. |


