
Bladder Cancer Incidence and Survival in the United States and Texas Non-Latino Whites and Latinos
Abstract
BACKGROUND:
Bladder cancer (BC) poses an enormous burden on health care systems. Latinos in Texas (TX) were underrepresented in previous studies on racial/ethnic disparity of BC in the US.
OBJECTIVE:
To examine whether BC incidence and survival rates differ among Latinos compared to non-Latino whites (NLW) in South TX, TX, and the US SEER.
METHODS:
Data was collected from the US SEER Program and the Texas Cancer Registry. Annual age-specific and age-adjusted BC incidence rates and annual 5-year relative survival were calculated.
RESULTS:
South TX and TX had significantly lower BC incidence rates than SEER for both Latinos and NLW regardless of gender (Ps < 0.05). South TX women had worse BC survival rates than SEER women for both Latinos and NLW (Ps < 0.05). TX NLW had worse BC survival rates than SEER NLW for both genders together and men only (Ps < 0.05). All Latino groups had lower incidence but worse survival rates than NLW groups for both men and women in each geographic area (all Ps < 0.05). Women had significantly lower BC incidence but worse survival rates than men regardless of race/ethnicity in each geographic area (all Ps < 0.05).
CONCLUSIONS:
South TX women had lower BC incidence but worse survival rates than US SEER women for both Latinos and NLW. Latinos had worse survival but lower incidence rates than NLW. Women had lower BC incidence but worse survival rates than men. The study identifies the BC distribution and high-risk population, racial/ethnic disparities, and geographic differences. It facilitates health care services planning.
ABBREVIATIONS
APCs | Annual incidence percent changes |
BC | Bladder cancer |
CI | Confidence intervals |
ICD-O | International Classification of Disease for Oncology |
NAACCR | North American Association of Central Cancer Registries |
NCI | National Cancer Institute |
NLW | Non-Latino Whites |
SEER | Surveillance, Epidemiology, and End Results |
TCR | Texas Cancer Registry |
TX | Texas |
US | United States |
WHO | World Health Organization |
INTRODUCTION
Bladder cancer (BC) is the fourth most common cancer in men and the twelfth most common cancer in women in the United States (US) [1, 2]. It is predicted that more than 81,400 people will be diagnosed with BC in 2020, and more than 179,800 deaths are expected [1]. BC is the fourth most common cancer among men and the fourteenth among women in Texas (TX) [3].
BC has a high rate of recurrence and progression despite effective local therapy [4] which contributes to a large burden on health care systems [5]. However, BC racial/ethnic disparity in the US was not well studied because available data were based on data from the Surveillance, Epidemiology, and End Results (SEER) Program [6]. Since 20% of the US Latino population is in TX, generalization about ethnicity based on SEER data are limited. Overall, TX as the second most populous state in the US [7] includes 45.3% NLW and 37.6% Latinos [8] with 69% of the Latinos living in South TX [9]. The residents in South TX have lower per capita personal incomes; higher rates of unemployment, poverty, and lack of insurance; lower educational attainment; less access to health care services; and higher obesity prevalence than the state as a whole, which may uniquely impact both incidence and survival rates for cancer patients [9]. Prior studies have reported that Latino Whites have lower BC incidence rates but worse survival than Non-Latino Whites (NLW) based on the SEER data [6, 10]. Not included in SEER Program, TX Latinos make up one-fifth of the U.S. Latino population.
In order to identify the BC distribution and high-risk population, BC racial/ethnic disparities for health care service planning and further prevention, and control of BC, this study examines differences in BC incidence and survival rates among NLW and Latinos in South TX, TX, and the US based on data from SEER registries and the TX Cancer Registry (TCR).
MATERIALS AND METHODS
A retrospective cohort study was conducted after approval by the IRB (HSC20190410N).
BC incidence and survival data
BC incidence and survival data were obtained from two sources: 1) US SEER Registries [11] and 2) TCR [12]. The SEER program is an authoritative source of information on cancer incidence in the US. SEER currently collects and publishes cancer incidence data from population-based cancer registries covering approximately 34.6% of the US population [11]. To compare with all available data from the TCR, this study used the SEER 13 grouping, which includes Alaska, Connecticut, Detroit, Atlanta, Rural Georgia, San Francisco-Oakland, San Jose-Monterey, Hawaii, Iowa, Los Angeles, New Mexico, Seattle-Puget Sound, and Utah [11]. The TCR is an identically-organized, population-based registry of all 254 TX counties and follows all standards and coding criteria of the SEER dataset, including possession of the North American Association of Central Cancer Registries (NAACCR) Gold Certification [12].
Population denominators used for all rate calculations for SEER (TCR) rates were those available from the NCI SEER program (TCR data), adjusted for Hurricane Katrina but not for delay in case reporting [11]. BC incident cases for all ages, survival months, vital status (alive or dead), and cause of death were selected for Latino and Non-Latino White male and female residents of the 13 SEER registries: the TCR and the TCR (for the 38 counties comprising South TX).
The classification of malignancies
Patients were identified according to the Site Recode International Classification of Disease for Oncology (ICD-O-3)/WHO 2008 Definition “Urinary Bladder” [13] and tumor behavior code “malignant” were referred to identify BC cases in those population.
The identification of bladder cancer-specific and relative survival
BC-specific survival was defined as the time from initial diagnosis to the time of death attributed to BC. SEER [14] and the TCR [15] collected information on underlying cause of death from state death certificates. Five-year relative survival of BC was calculated by dividing the overall five-year survival after BC diagnosis by the five-year survival, as observed in a similar population not diagnosed with BC.
The classification of ethnicity and urban/rural residence
For all groups compared, ethnicity was defined using the NAACCR Latino/Latino Identification Algorithm, version 2.2.1 [16]. In addition, urban/rural residence was identified using the US Department of Agriculture 2003 Urban/Rural Continuum criteria [17]. Metropolitan counties with continuum codes 1– 3 was designated urban, and non-metropolitan counties with codes 4– 9 rural.
Statistical analysis and expected outcomes
SEER*Stat software v 8.3.6 (SEER*Stat, NCI) generated 1995– 2015 average annual age-specific and age-adjusted BC incidence rates, incidence rate ratios, annual incidence percent changes (APCs) and 95% confidence intervals (CIs), and age-adjusted BC incidence rates, and five-year relative survival rates for Latinos and NLW in the US SEER, TX and South TX datasets. The age-adjusted rates were standardized to the 2000 US standard population (19 age groups). The age groups include <40, 40– 49,50– 59, 60– 69, 70– 79, 80– 84 and 85+ years. APCs were derived using weighted least squares point-estimation; trends were tested for statistical significance using SEER*Stat [18]. The 5-year relative survival was available from 1995 to 2010. Stata’s ir program was used to calculate incidence rate ratios. Differences were assessed at P < 0.05 if confidence levels did not overlap. Chi-square tests were used to compare differences among categorical variables.
RESULTS
From 1995 through 2015, Latinos accounted for 12% of incident BC cases in TX and 33% of incident BC cases in South TX. Corresponding incident BC cases in SEER data for the same period was 6% (Table 1). These higher proportions of Latino BC cases in TX and South TX are commensurate with higher proportions of Latinos in the general population of these areas. More than 75% of BC incident cases in Latinos occurred in men, with the highest percentage observed in SEER (76.4%) (P < 0.05) and similar percentages (P = 0.8) observed in TX (74.9%) and South TX (75.6%) groups. South Texas Latinos were diagnosed with BC at older ages than SEER Latinos (P < 0.05). The median ages at diagnosis were 69, 69 and 70 years for SEER, TX, and South TX respectively. A larger proportion of BC incident cases occurred among rural South TX (16.2%) and TX Latinos (14.0%) compared to SEER Latinos (6.9%) (P < 0.0001). NLW accounted for 81% of BC incident cases in TX and 64% of all BC incident cases in South TX, lower proportions than in SEER (82%) (Table 1). More than 76% of BC incident cases in NLW occurred in men, with highest in South TX and lowest in US SEER NLW (P < 0.0001). South TX NLW were significantly diagnosed with BC at older ages than SEER NLW. The median ages at diagnosis were 71.7, 70.9, and 72.4 years for SEER, TX, and South TX respectively. A higher proportion of BC incident cases occurred in rural TX NLW (20.5%) (P < 0.0001) compared to SEER NLW (12.5%) who had similar cases in rural South TX NLW (13%) (P = 0.25).
Table 1
Incident case characteristics of bladder cancer in Latinos and non-Latino whites (NLW) from US SEER, Texas and South Texas, 1995–2015
| US SEER | Texas | South Texas | P value | ||||
| n | % Total | n | % Total | n | % Total | ||
| Bladder Cancer Cases | 155,701 | 68,415 | 11,027 | <0.0001 | |||
| Person-years | 841,483,434 | 484,020,213 | 85,915,793 | ||||
| Latino Cases | 8,854 | 7,961 | 3,619 | <0.0001 | |||
| Latino Person-years | 179,256,845 | 169,483,405 | 57,257,371 | ||||
| Age at Diagnosis (years) | |||||||
| <40 | 268 | 3.03 | 256 | 3.22 | 79 | 2.18 | <0.0001 |
| 40– 49 | 530 | 5.99 | 464 | 5.83 | 170 | 4.70 | |
| 50– 59 | 1,262 | 14.25 | 1,123 | 14.11 | 451 | 12.46 | |
| 60– 69 | 2,207 | 24.93 | 1,960 | 24.62 | 861 | 23.79 | |
| 70– 79 | 2,589 | 29.24 | 2,391 | 30.03 | 1,139 | 31.47 | |
| 80– 84 | 1,075 | 12.14 | 908 | 11.41 | 480 | 13.26 | |
| 85+ | 923 | 10.42 | 859 | 10.79 | 439 | 12.13 | |
| Age/Diagnosis (years) | 68.67 | 68.67 | 70.32 | <0.0001 | |||
| Sex | |||||||
| Male | 6,524 | 76.41 | 5,966 | 74.94 | 2,734 | 75.55 | 0.02 |
| Female | 2,330 | 23.59 | 1,955 | 24.56 | 885 | 24.45 | |
| Residence | |||||||
| Urban | 8,219a | 92.83 | 6,845 | 85.98 | 3,032 | 83.78 | <0.0001 |
| Rural | 609 | 6.88 | 1,116 | 14.02 | 587 | 16.22 | |
| NLW Cases | 128,387 | 55,362 | 7,027 | <0.0001 | |||
| NLW Person-years | 295,546,874,000 | 238,430,288 | 24,144,480 | ||||
| Age at Diagnosis (years) | |||||||
| <40 | 1,379 | 1.07 | 666 | 1.20 | 52 | 0.74 | <0.0001 |
| 40– 49 | 4,662 | 3.63 | 2,135 | 3.86 | 213 | 3.03 | |
| 50– 59 | 15,234 | 11.87 | 6,913 | 12.49 | 698 | 9.93 | |
| 60– 69 | 30,370 | 23.66 | 13,775 | 24.88 | 1,595 | 22.70 | |
| 70– 79 | 41,004 | 31.94 | 18,162 | 32.81 | 2,535 | 36.08 | |
| 80– 84 | 18,357 | 14.30 | 7,420 | 13.40 | 1,042 | 14.83 | |
| 85+ | 17,381 | 13.54 | 6,291 | 11.36 | 892 | 12.69 | |
| Age/Diagnosis (years) | 71.68 | 70.91 | 72.44 | <0.0001 | |||
| Sex | <0.0001 | ||||||
| Male | 97,205 | 75.71 | 42,691 | 77.11 | 5,580 | 79.41 | |
| Female | 31,182 | 24.29 | 12,671 | 22.89 | 1,447 | 20.59 | |
| Residence | |||||||
| Urban | 112,067b | 87.29 | 44,034c | 79.54 | 6,116 | 87.04 | <0.0001 |
| Rural | 16,006 | 12.47 | 11,323 | 20.45 | 911 | 12.96 | |
aThe residence status for 26 cases is missing. bThe residence status for 314 cases is missing. cThe residence status for 5 cases is missing.
The BC incidence rate of SEER Latinos was 10.5/100,000 (10.3– 10.7), the rate among TX Latinos was 9.63/100,000 (9.4– 9.9), and the rate among South Texas Latinos was 9.6/100,000 (9.3– 9.9) (Table 2). BC incidence was significantly highest in SEER Latino men and women (18.5/100,000 and 4.8/100,000), more than 6% and 15% higher than in respective South TX subjects (all Ps < 0.0001). Latinos in TX and South TX had a significantly lower relative risk of BC than SEER Latinos (Table 2). Compared to the SEER population, the rate ratios of age-adjusted BC incidence rates for Latinos were 0.92 (0.89– 0.94) in TX and 0.91 (0.88– 0.95) in South TX respectively. BC incidence rates between TX and STX Latinos were not statistically significant for men, women, and both genders together (Ps > 0.05). SEER NLW had significantly highest overall BC incidence rates regardless of gender and ethnicity. The BC incidence rate of SEER NLW was 23.0/100,000 (22.9– 23.2), and the rate among South TX NLW was 20.2/100,000 (19.8– 20.7). BC incidence was significantly highest in SEER NLW men and women (40.3/100,000 and 9.9/100,000), more than 24% and 12% higher than in respective South TX subjects (Ps < 0.05). NLW in South TX had a significantly lower relative risk of BC than SEER NLW (P < 0.0001) but similar risk to NLW in TX (P = 0.13) (Table 2). Compared to the SEER population, the rate ratios of age-adjusted BC incidence rates for NLW were 0.86 (0.85– 0.87) in TX and 0.88 (0.86– 0.90) in South TX respectively. STX NLW had similar BC incidence rates to TX NLW for men (P = 0.38) but significantly lower rates than TX NLW for women (P = 0.004). Latinos had lower BC incidence rates than NLW regardless of gender and geography (all Ps < 0.05). Men had significantly higher BC incidence rates for both Latinos and NLW in each geographic area (all Ps < 0.05).
Table 2
Incidence Ratesa and Rate Ratios (RR) of bladder cancer in Latinos and non-Latino whites from USSEER, Texas and South Texas, 1995–2015
| US SEER | Texas | South Texas | ||||||||
| Gender | N | Rate (95% CI) | RR | N | Rate (95% CI) | RR (95% CI) | N | Rate (95% CI) | RR (95% CI) | |
| Latinos | Male | 6,524 | 18.50 | 1.00 | 5,966 | 16.96 | 0.92 | 2,734 | 17.41 | 0.94 |
| (18.02– 18.99) | (16.50– 17.43) | (0.88– 0.95) | (16.73– 18.09) | (0.90– 0.98) | ||||||
| Female | 2,330 | 4.84 | 1.00 | 1,995 | 4.27 | 0.88 | 885 | 4.09 | 0.85 | |
| (4.64– 5.05) | (4.08– 4.46) | (0.83– 0.94) | (3.82– 4.37) | (0.78– 0.91) | ||||||
| Total | 8,854 | 10.51 | 1.00 | 7,961 | 9.63 | 0.92 | 3,619 | 9.60 | 0.91 | |
| (10.28– 10.74) | (9.41– 9.85) | (0.89– 0.94) | (9.29– 9.93) | (0.88– 0.95) | ||||||
| NLWb | Male | 97,205 | 40.33 | 1.00 | 42,691 | 35.24 | 0.87 | 5,580 | 35.68 | 0.88 |
| (40.07– 40.59) | (34.90– 35.58) | (0.86– 0.88) | (34.74– 36.64) | (0.86– 0.91) | ||||||
| Female | 31,182 | 9.92 | 1.00 | 12,671 | 8.13 | 0.82 | 1,447 | 7.55 | 0.76 | |
| (9.81– 10.03) | (7.99– 8.28) | (0.80– 0.84) | (7.16– 7.96) | (0.72– 0.80) | ||||||
| Total | 128,387 | 23.02 | 1.00 | 55,362 | 19.84 | 0.86 | 7,027 | 20.22 | 0.88 | |
| (22.90– 23.15) | (19.68– 20.01) | (0.85– 0.87) | (19.75– 20.71) | (0.86– 0.90) | ||||||
aRates per 100,000 and age-adjusted to the 2000 US Standard Population (19 age groups). P values <0.05 for below comparisons: Texas vs. US SEER and South Texas vs US SEER for male, female, and total NLW and Latinos, respectively; Latinos vs. NLW and male vs. female for the three geographic areas, respectively. bData for non-Latino whites (NLW) is included for general comparison.
From 1995 to 2015, annual age-adjusted BC incidence rates were generally lower among South TX than SEER NLW but higher than TX NLW. Annual age-adjusted BC incidence rates were generally lower among South TX and TX Latinos than SEER Latinos (Fig. 1). Over the study period, age-specific BC incidence among all groups became greater with increasing age from 40 to 79 years (Supplemental Figure 1), and age-specific rates peaked at 75– 79 years for both NLW and Latinos. SEER NLW had the highest age-specific rates, significantly higher than South TX and TX Latinos for those aged 60– 69 years and older. South TX NLW had similar rates to TX NLW under age 69 years but higher rates than TX NLW for those aged 69 and older. SEER Latinos had the highest age-specific rates, significantly higher than South TX and TX Latinos for those aged 60 and older (Supplemental Figure 1). BC incidence significantly decreased over time (APCs <0) among NLW and Latinos in all three geographic groups (Table 3). Of interest, age groups from 50– 59 years in South TX and 40– 49 years TX experienced higher percent changes in BC incidence than older age groups for Latinos. All age groups from 60– 69 years in South TX NLW and those from 50– 59 years in TX NLW experienced higher percent changes in BC incidence than older age groups.
Fig. 1
Annual age-adjusted incidence rates of bladder cancer by race/ethnicity, 1995– 2015. NLW: non-Latino whites; STX: South Texas; TX: Texas; US SEER: United States Surveillance, Epidemiology, and End Results Program.
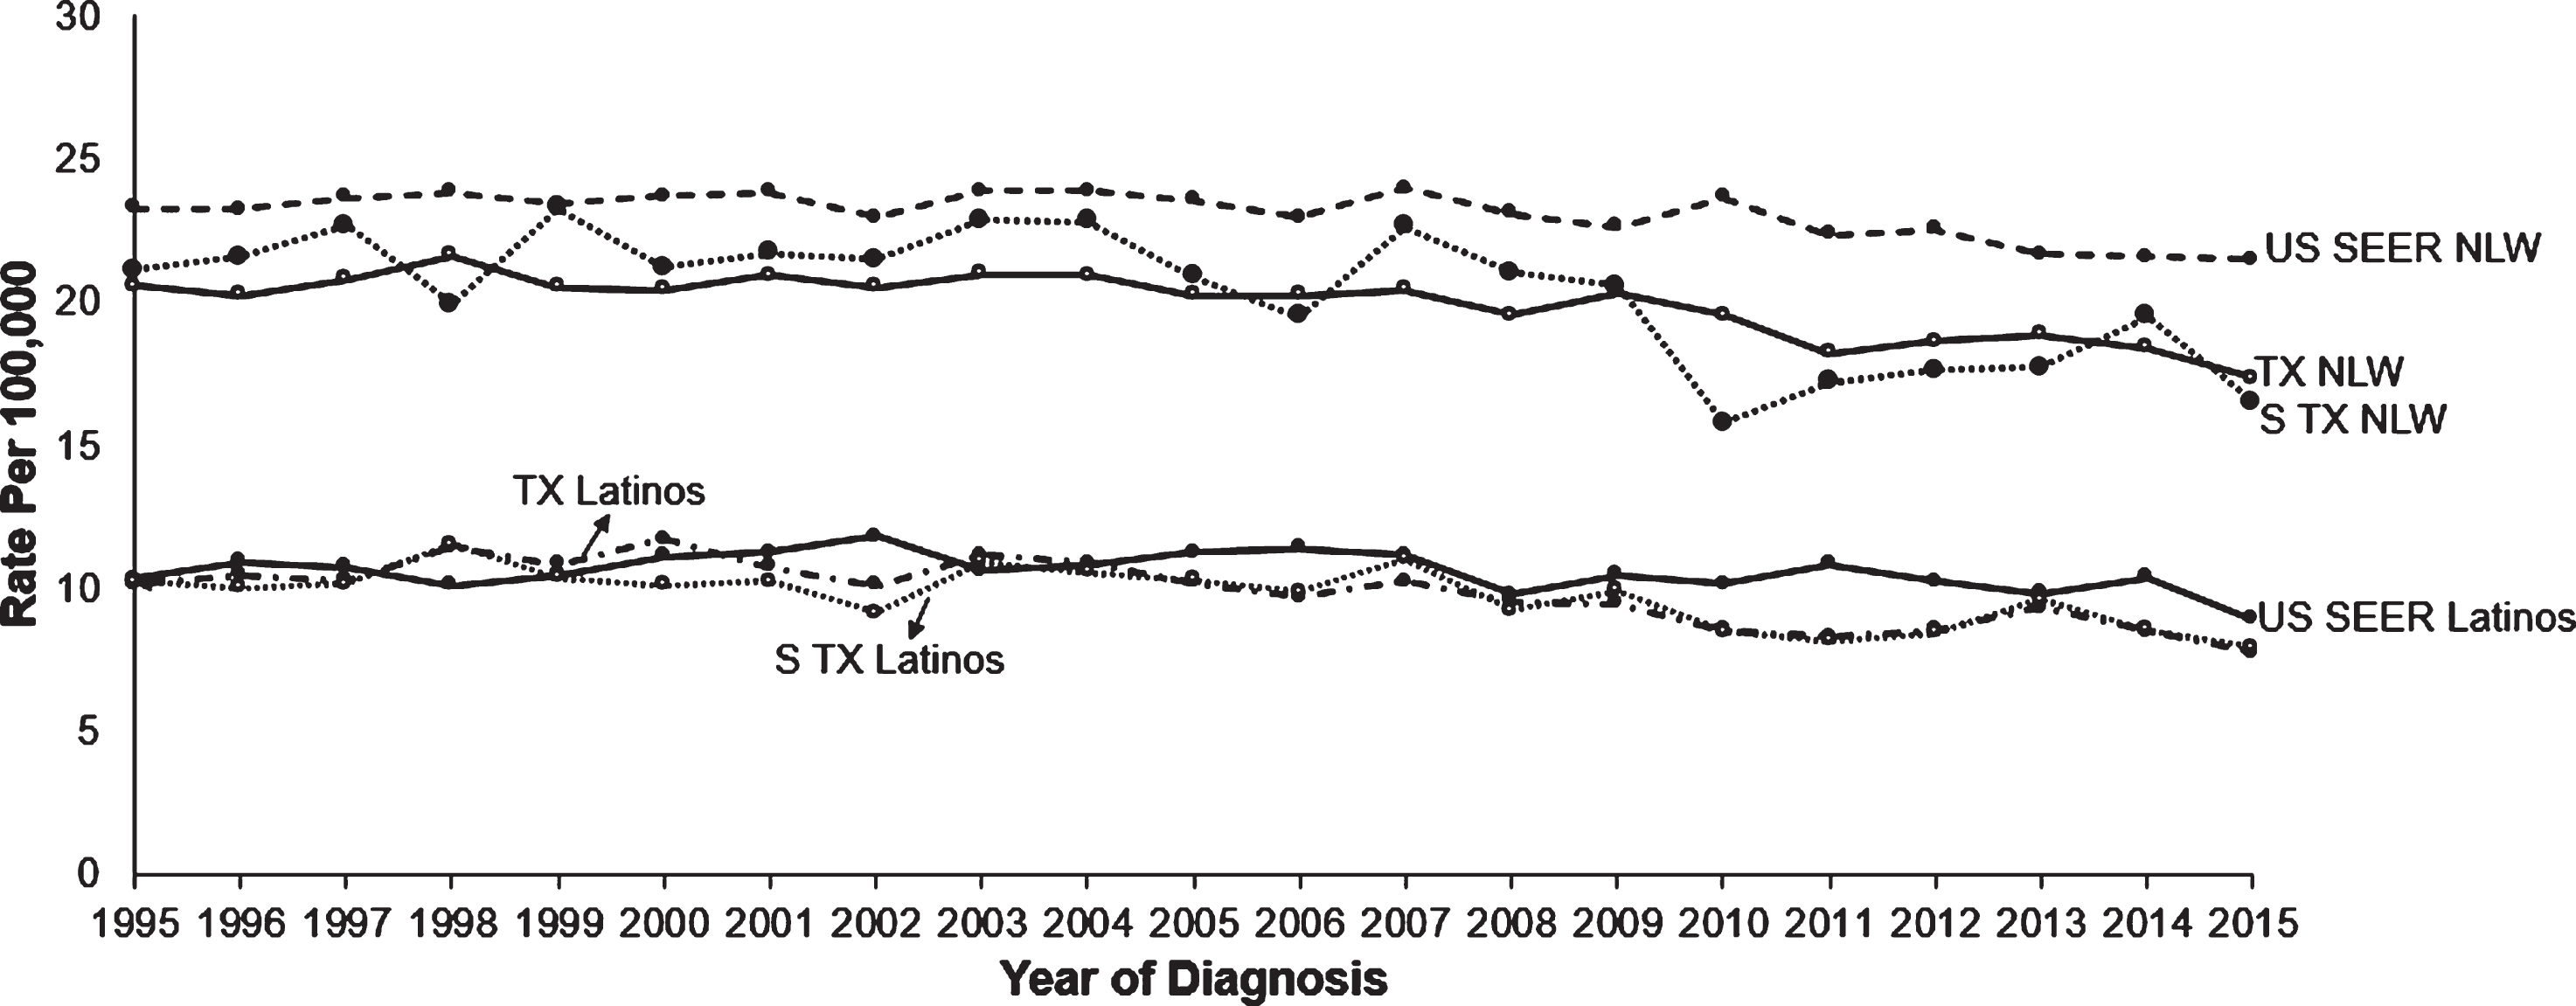
Table 3
Annual percent change (APC) of bladder cancer incidencea from 1995 to 2015 by age for US SEER, Texas and South Texas.
| US SEER | Texas | South Texas | ||
| AGE (years) | APC | APC | APC | |
| Latinos | All ages | – 0.58* | – 1.63* | – 1.25* |
| <40 | 0.16 | – 1.45 | 0.92 | |
| 40– 49 | – 0.33 | – 2.93* | – 2.07 | |
| 50– 59 | – 1.11* | – 2.78* | – 2.02* | |
| 60– 69 | – 1.19* | – 1.96* | – 1.74* | |
| 70– 79 | – 0.61 | – 1.62* | – 1.44* | |
| 80– 84 | – 0.96 | – 0.98 | – 0.49 | |
| 85+ | – 0.22 | – 0.92* | – 0.32 | |
| NLW | All ages | – 0.40* | – 0.75* | – 1.27* |
| <40 | – 1.74* | – 1.82* | ∧ | |
| 40– 49 | – 1.84* | – 1.89* | – 1.57 | |
| 50– 59 | – 1.59* | – 2.12* | – 2.22* | |
| 60– 69 | – 1.39* | – 1.72* | – 2.41* | |
| 70– 79 | – 0.15 | – 0.56* | – 0.75 | |
| 80– 84 | 0.79* | 0.54* | – 0.67 | |
| 85+ | 0.995* | 0.81* | – 0.12 |
aIncidence rates are age-adjusted for all ages and unadjusted for specific age groups. *Significantly decreasing or increasing trend (P < 0.05). APC = Annual Percent Change. CI = Confidence Interval. ∧Statistic could not be calculated.
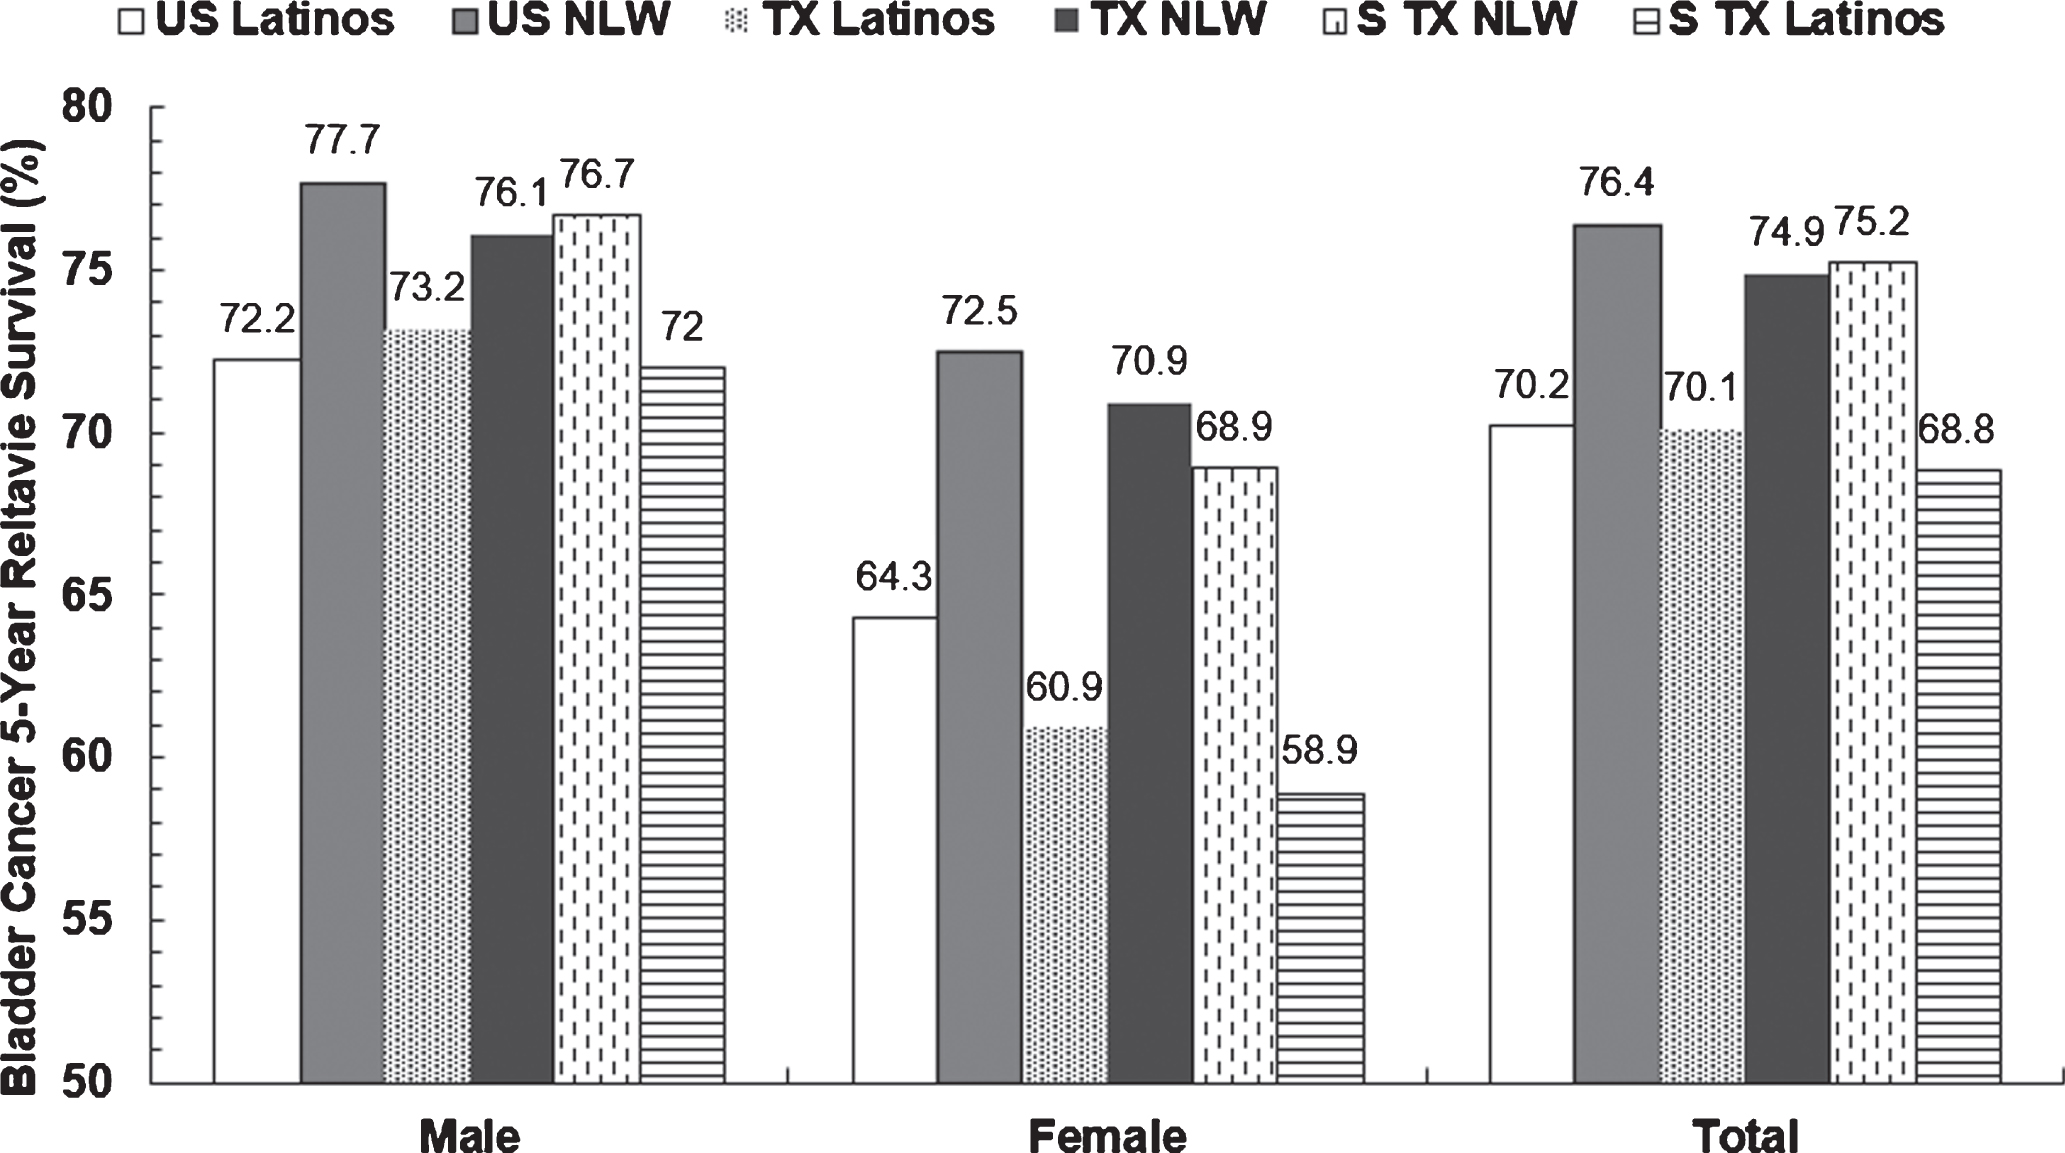
All Latino groups had significantly lower 5-year relative survival rates than NLW groups regardless of gender and geography (Fig. 2). The difference of survival rates between NLW and Latino was 6.2% for SEER, 4.8% for TX, and 8.4% for South TX. Women had lower BC survival rates than men for both Latinos and NLW in each geographic area (all Ps < 0.05). Of the three Latino female groups, the BC 5-year relative survival rate in South TX Latinos (58.9%) was significantly lower than in SEER Latinos (64.3%) (P = 0.01) and similar to that for TX Latinos (60.9%) (P = 0.43). Of the three NLW groups, the BC 5-year relative survival rate was significantly lower in TX NLW men (76.1%) and men and women together (74.9%) than in respective SEER NLW subjects (Ps < 0.0001) and similar to that for respective South TX NLW subjects (P s > 0.05). Of the three NLW female groups, the BC 5-year relative survival rate was significantly lower in South TX NLW (68.9%) than in SEER NLW (P = 0.01) and similar to that for TX NLW (P = 0.19) (Fig. 2). The differences were not statistically significant for other comparisons.
Fig. 2
5-Year relative survival rates of bladder cancer in Latinos and non-Latino whites from US SEER and Texas and South Texas, 1995– 2015a. aP values <0.05 for the below comparisons: all NLW vs. Latino groups regardless of gender and race/ethnicity, all men vs. women regardless of race/ethnicity and geography, TX vs. US SEER NLW men, TX vs. US SEER NLW women, TX vs. US SEER NLW men and women, STX vs. US SEER NLW women, STX vs. US SEER Latino women; P values >0.05 for the below comparisons: STX vs. US SEER NLW men, STX vs. US SEER NLW men and women, TX vs. US SEER Latino men, TX vs. US SEER Latino women, TX vs. US SEER Latino men and women, STX vs. US SEER Latino men, and STX vs. US SEER Latino men and women. NLW: non-Latino whites; STX: South Texas; TX: Texas; US SEER: United States Surveillance, Epidemiology, and End Results Program.
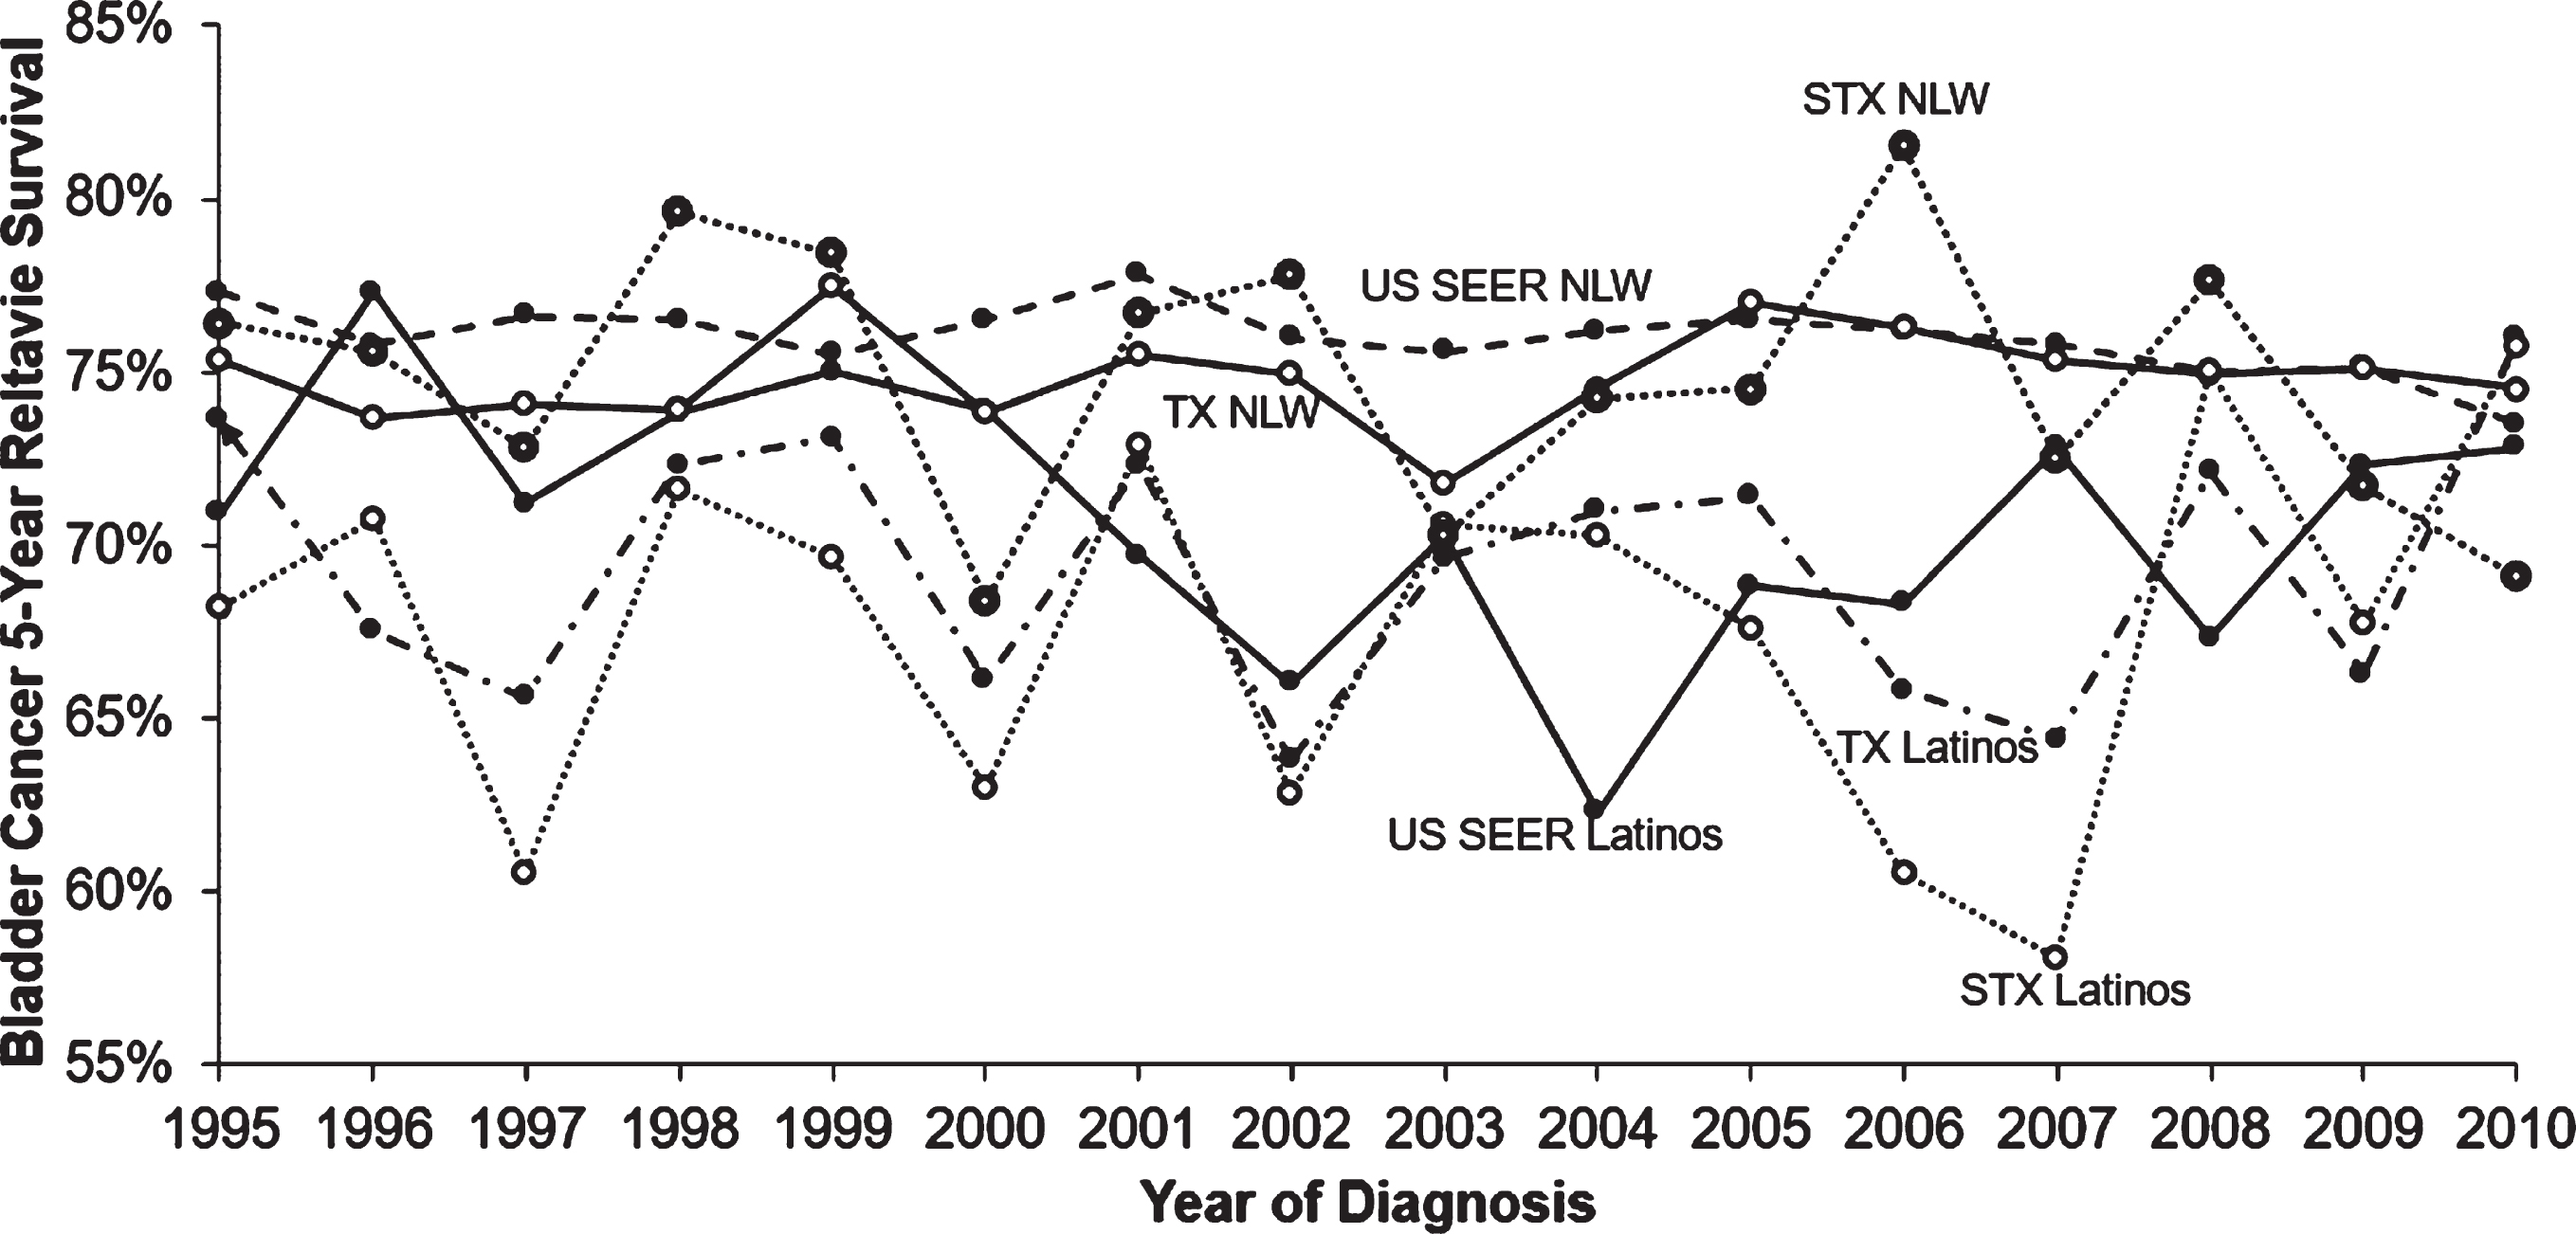
From 1995 to 2010, annual BC 5-year relative survival rates were generally lower among South TX Latinos than TX Latinos and SEER Latinos, and among South TX NLW than TX NLW and SEER NLW, although South TX NLW had relatively large fluctuation rates (Fig. 3). Over the study period, age-specific BC 5-year relative survival rates among all groups became worse with increasing age from 40 years except for slightly better rates in age 60– 60 years for South TX Latinos, who had the lowest rates (Supplemental Figure 2). SEER NLW had the best age-specific survival rates, better than South TX and TX NLW for those aged 80 and under. South TX NLW had slightly better rates than TX NLW under age 80 years but had similar rates to TX NLW and SEER NLW for those aged 80 and older. SEER Latinos had the highest age-specific survival rates, better than South TX and TX Latinos for those aged 70 and older; they had similar survival rates to the other two groups after 70 years (Supplemental Figure 2). South TX Latinos had the lowest survival rates for those aged 70 and under in the three Latino groups.
Fig. 3
Annual 5-year relative survival rates of bladder cancer by race/ethnicity, 1995– 2010. NLW: non-Latino whites; STX: South Texas; TX: Texas; US SEER: United States Surveillance, Epidemiology, and End Results Program.
DISCUSSION
Our study found that South TX women had lower BC incidence but worse survival rates than US SEER for both Latinos and NLW. TX NLW had lower BC incidence but worse BC survival rates than SEER NLW. Latinos had lower BC incidence but worse survival rates than NLW regardless of gender and geography. Women had significantly lower BC incidence but worse survival rates than men regardless of race/ethnicity and geography. The study identifies the BC distribution and high-risk population, racial/ethnic disparities, and geographic differences. It facilitates health care services planning; health care services planners could allocate medical resources like hospitals, doctors, equipment, and bed numbers based on the bladder cancer geographic and racial disparity to avoid the waste or lack of resources. The study informs future population-based studies aimed at prevention and control, as well as enhances survival of BC in a cost-effective and timely way.
To our knowledge, this is the first study showing incidence and survival of BC in TX and South TX among Latinos and NLW, who are the dominated populations in this area. Given that 20% of U.S. Latinos reside in TX (two-thirds of the population of South TX is Latino, of mainly Mexican origin, and almost half of the BC incident cases in TX occur in South TX), it is necessary and important to find factors leading to worse survival rates in South TX Latinos and NLW, although their incidence rates are lower than the US groups, to improve BC survival rates in South TX. Furthermore, socioeconomic and environments such as air pollutions [19, 20] and water arsenic concentrations [21] in different geographic areas such as California and TX were different and might be associated with BC outcomes. The decreasing trends of BC incidence, especially large changes in some age groups, indicate that future research could identify the factors related to the decreasing trends; this may provide valuable information to prevent and control BC, especially for age groups with less significantly decreasing trends. Because BC is often a chronic disease, some risk factors associated with the development of the initial tumor may also influence outcomes [22]. However, little research has been performed in this area [22]. Genetic effects can explain 7% and environmental factors as important modifiers can explain 93% of the variation in BC incidence [23]. Risk factors such as cigarette smoking are positively associated with BC risk, and protective factors such as healthy lifestyles may relate to BC prevention, based on limited available evidence [4, 24]. The combined probability of causation due to total fruit and vegetable consumption, processed meat consumption, smoking, and physical activity showed that up to 81.8% of the BC cases, among those with non-optimal lifestyle behaviors, could be prevented through lifestyle modifications [24]. A systematic review reported that modifiable factors such as cigarette smoking, arsenic contamination, and occupational exposure to tobacco were associated with BC. Obesity, diet, and physical activity may relate to the BC prevention based on limited available evidence [24]. However, the effect of these factors on BC survival has been relatively unexplored [25, 26] and data on these factors are not available from Cancer Registries. Further research may focus on finding factors related to BC incidence and survival in South TX. Those factors might be related to the worse survival and helpful to be intervened and adjusted to enhance BC survival rate and improve BC survival.
Our study found a difference of BC incidence and survival rates between Latinos and NLW in South TX, TX, and the US. Prior studies suggested that multiple factors including smoking and occupational exposures may have contributions to racial differences in BC incidence and survival [6, 27, 28]. Mendez et al. reported that water arsenic concentrations were positively associated with BC incidence using the US county-level data [21], but they neither compared the associations between Latinos and NLW nor included TX. Prior studies reported that environmental and socioeconomic factors may affect BC mortality, and effects appear to vary in whites and blacks [20]. Higher grade and stage in blacks may relate to the worse BC survival compared with Caucasians [29]. However, Cole et al reported that differences in survival for black and white patients with BC are best explained by disparities in access and treatment, not tumor characteristics [30]. Prout and coauthors suggested that genetic differences might contribute to the differences between blacks and whites in heterogeneity of cell type, tumor grade, and tumor stage at diagnosis [31], but epigenetic factors such as occupational exposure to carcinogens and tobacco smoke may influence genetic expression and should also be considered [31]. As described previously, environment and lifestyle factors may also affect sex, race/ethnicity, and geographic BC disparities. Residents in South TX have lower per capita personal incomes; higher rates of unemployment, poverty, and lack of insurance; lower educational attainment; less access to health care services; and higher prevalences of inadequate physical activity, inadequate fruit and vegetable consumption, and obesity than the nation [9, 32, 33], which may uniquely impact for BC incidence and survival, and BC disparity and may partly be related to the worse survival in South TX. Furthermore, the Hispanic share of the U.S. population rose from 14% in 1995 to 18% in 2015 [34]. Latinos are vulnerable to poverty-related health conditions and may lack health insurance or financial means to pay for quality health care and use fewer preventive care services than other ethnic groups [35, 36], which may be related to worse survival rates in Latinos. Latino women are likely to lack access to health care, spend more time looking after children, have language barriers and lower education and income levels [37], tend to be more vulnerable to abuse and mistreatment, and suffer from lower self-esteem and higher intimate partner violence [35]. These may partly explain why Latino females have worse survival than males. However, ethnic- and gender-specific data and research are limited, leading to many gaps and higher health-care disparities. Increased awareness and further research are needed to address the health-care needs of this specific population. Besides these factors, whether treatments (such as cystectomy, lymph node dissection, neoadjuvant chemotherapy), immigrant patterns, health care changes, and racial/ethnic categories have effects on BC survival disparities, it will be explored in future studies as Cancer Registries did not provide these data. Further research to explore the factors affecting sex and race/ethnicity differences of BC incidence and survival rates in South TX and TX, and the incidence and survival disparities for other cancer types is warranted.
In conclusion, this study documents that South TX women had lower BC incidence but worse survival rates than US SEER women for both Latinos and NLW; TX NLW had lower BC incidence but worse survival rates than US SEER NLW; Latinos had lower BC incidence but worse survival rates than NLW regardless of gender and geography; women had significantly lower BC incidence but worse survival rates than men. The findings identify the BC distribution and high-risk populations, racial/ethnic disparities, and geographic differences. The study facilitates health care services planning and indicates a need for further research to explore factors affecting BC survival rates and factors responsible for racial/ethnicity differences in BC survival to inform tailored prevention efforts directed at these risks among Latinos and NLW.
ACKNOWLEDGMENTS
The authors have no acknowledgments.
FUNDING
The authors report no funding.
CONFLICTS OF INTEREST
The authors have no conflict of interest to report.
AUTHOR CONTRIBUTIONS
Shenghui Wu: conception; performance of work; interpretation or analysis of data; writing the article; Edgar Munoz: performance of work; interpretation or analysis of data; Yanning Liu: interpretation or analysis of data; writing the article; Robert Svatek: interpretation or analysis of data; writing the article; Ahmed M. Mansour: writing the article; Amelie G. Ramirez: writing the article; Tomplinson Gail: writing the article; Ruben A. Mesa: writing the article; Ronald Rodriguez: writing the article; Joel E. Michalek: writing the article.
SUPPLEMENTARY MATERIAL
[1] The supplementary material is available in the electronic version of this article: http://dx.doi.org/10.3233/BLC-200352.
REFERENCES
[1] | Siegel RL , Miller KD , Jemal A . Cancer statistics, 2018. CA Cancer J Clin. (2018) ;68: (1):7–30. |
[2] | Siegel RL , Miller KD , Jemal A . Cancer statistics, 2019. CA Cancer J Clin. (2019) ;69: (1):7–34. |
[3] | Texas AT A GLANCE [cited 2020 Jun 1]. Available from: https://cancerstatisticscenter.cancer.org/#!/state/Texas. |
[4] | Burger M , Catto JW , Dalbagni G , Grossman HB , Herr H , Karakiewicz P , et al. Epidemiology and risk factors of urothelial bladder cancer. Eur Urol. (2013) ;63: (2):234–41. |
[5] | Sievert KD , Amend B , Nagele U , Schilling D , Bedke J , Horstmann M , et al. Economic aspects of bladder cancer: what are the benefits and costs? World J Urol. (2009) ;27: (3):295–300. |
[6] | Wang Y , Chang Q , Li Y . Racial differences in Urinary Bladder Cancer in the United States. Sci Rep. (2018) ;8: (1):12521. |
[7] | World Population Review. Texas Population [cited 2019 Feb 5]. Available from: https://worldpopulationreview.com/states/texas/. |
[8] | Texas Demographic Center. Texas population projections 2010 to 2050 [cited 2019 Feb 5]. Available from: https://txsdc.utsa.edu/. |
[9] | Ramirez A , Thompson I , Vela L . The South Texas Health Status Review: A Health Disparities Roadmap. Springer Cham Heidelberg New York Dordrecht London; (2013) . |
[10] | Yee DS , Ishill NM , Lowrance WT , Herr HW , Elkin EB . Ethnic differences in bladder cancer survival. Urology. (2011) ;78: (3):544–9. |
[11] | Turner MC , Krewski D , Diver WR , Pope CA III , Burnett RT , Jerrett M , et al. Ambient air pollution and cancer mortality in the Cancer Prevention Study II. Environ Health Perspect. (2017) ;125: (8):087013. |
[12] | Smith ND , Prasad SM , Patel AR , Weiner AB , Pariser JJ , Razmaria A , et al. Bladder cancer mortality in the United States: a geographic and temporal analysis of socioeconomic and environmental factors. J Urol. (2016) ;195: (2):290–6. |
[13] | Mendez WM Jr , Eftim S , Cohen J , Warren I , Cowden J , Lee JS . et al Relationships between arsenic concentrations in drinking water and lung and bladder cancer incidence in U.S. counties. J Expo Sci Environ Epidemiol. (2017) ;27: (3):235–43. |
[14] | Surveillance, Epidemiology, and End Results (SEER) Program (www.seer.cancer.gov). SEER*Stat Database: Incidence – SEER 13 Regs Research Data, Nov 2017 Sub (1992-2015) <Katrina/Rita Population Adjustment>- Linked to County Attributes – Total U.S., 1969-2016 Counties, National Cancer Institute, DCCPS, Surveillance Research Program, released April 2018, based on the November 2017 submission. |
[15] | Texas Department of State Health Services. Texas Cancer Registry (www.dshs.state.tx.us/tcr) SEER*Stat Database, Limited-Use 1995-2015 Incidence, Texas statewide, Texas Department of State Health Services, created January 2018, based on NPCR-CSS Submission, cut-off 11/13/17.2018. |
[16] | Surveillance, Epidemiology, and End Results Program. Site Recode ICD-O-3/WHO 2008 Definition. National Cancer Institute [cited 2019 Feb 2]. Available from: https://seer.cancer.gov/siterecode/icdo3_dwhoheme/index.html. |
[17] | Ries LAG , Melbert D , Krapcho M . SEER Cancer Statistics Review, 1975-2005. 2008. |
[18] | Wyatt SW , Maynard WR , Miller EA , Garcia R , Foxhall LE . Cancer Incidence and Mortality in Texas and the United States: An Overview. Texas Medicine.e. (2011) ;107: (10):1. |
[19] | NAACCR Race and Ethnicity Work Group. NAACCR Guideline for Enhancing Hispanic/Latino Identification: Revised NAACCR Hispanic/Latino Identification Algorithm [NHIA v2.2.1]. 2011. |
[20] | United Statues Department of Agriculture. Measuring rurality: Rural-urban continuum codes [cited 2018 Nov 5]. Available from: https://www.ers.usda.gov/data-products/rural-urban-continuum-codes/. |
[21] | Surveillance Research Program and Healthcare Delivery Research Program NCI. National Cancer Institute SEER*Stat software. 2019. |
[22] | Malats N , Real FX . Epidemiology of bladder cancer. Hematol Oncol Clin North Am.177-89, vii. (2015) ;29: (2). |
[23] | Czene K , Lichtenstein P , Hemminki K . Environmental and heritable causes of cancer among 9. 6 million individuals in the Swedish Family-Cancer Database. Int J Cancer. (2002) ;99: (2):260–6. |
[24] | Al-Zalabani AH , Stewart KF , Wesselius A , Schols AM , Zeegers MP . Modifiable risk factors for the prevention of bladder cancer: a systematic review of meta-analyses. Eur J Epidemiol. (2016) ;31: (9):811–51. |
[25] | Kwan ML , Garren B , Nielsen ME , Tang L . Lifestyle and nutritional modifiable factors in the prevention and treatment of bladder cancer. Urol Oncol. 2018. |
[26] | Gopalakrishna A , Longo TA , Fantony JJ , Van NM , Inman BA . Lifestyle factors and health-related quality of life in bladder cancer survivors: a systematic review. J Cancer Surviv. (2016) ;10: (5):874–82. |
[27] | Burns PB , Swanson GM . Risk of urinary bladder cancer among blacks and whites: the role of cigarette use and occupation. Cancer Causes Control. (1991) ;2: (6):371–9. |
[28] | Kantor AF , Hartge P , Hoover RN , Fraumeni JF Jr. . Epidemiological characteristics of squamous cell carcinoma and adenocarcinoma of the bladder. Cancer Res. (1988) ;48: (13):3853–5. |
[29] | Underwood W III , Dunn RL , Williams C , Lee CT . Gender and geographic influence on the racial disparity in bladder cancer mortality in the US. J Am Coll Surg. (2006) ;202: (2):284–90. |
[30] | Cole AP , Fletcher SA , Berg S , Nabi J , Mahal BA , Sonpavde GP , et al. Impact of tumor, treatment, and access on outcomes in bladder cancer: Can equal access overcome race-based differences in survival? Cancer. (2019) ;125: (8):1319–29. |
[31] | Prout GR Jr , Wesley MN , Greenberg RS , Chen VW , Brown CC , Miller AW . et al Bladder cancer: race differences in extent of disease at diagnosis. Cancer. (2000) ;89: (6):1349–58. |
[32] | Su D , Richardson C , Wen M , Pagan JA . Cross-border utilization of health care: evidence from a population-based study in south Texas. Health Serv Res. (2011) ;46: (3):859–76. |
[33] | U.S. Census Bureau. QuickFacts Texas; United States [cited 2020 Jul 27]. Available from: https://www.census.gov/quickfacts/fact/table/TX, US. |
[34] | Pew Research Center. Modern Immigration Wave Brings 59 Million to U.S., Driving Population Growth and Change Through 2065 [cited 2020Aug 28].Available from: https://www.pewresearch.org/hispanic/2015/09/28/modern-immigration-wave-brings-59-million-to-u-s-driving-population-growth-and-change-through-2065/. |
[35] | Velasco-Mondragon E , Jimenez A , Palladino-Davis AG , Davis D , Escamilla-Cejudo JA . Hispanic health in the USA: a scoping review of the literature. Public Health Rev. (2016) ;37: :31. |
[36] | Ramos BM , Jurkowski J , Gonzalez BA , Lawrence C . Latina women: health and healthcare disparities. Soc Work Public Health. (2010) ;25: (3):258–71. |
[37] | Paz K , Massey KP . Health Disparity among Latina Women: Comparison with Non-Latina Women. Clin Med Insights Womens Health. (2016) ;9: (Suppl 1):71–4. |


