
Survival of Patients with Muscle-Invasive Urothelial Cancer of the Bladder with Residual Disease at Time of Cystectomy: A Comparative Survival Analysis of Treatment Modalities in the National Cancer Database
Abstract
PURPOSE:
Data have indicated that residual disease after neoadjuvant chemotherapy (NAC) for muscle-invasive bladder cancer (MIBC) may be associated with poor outcomes.
OBJECTIVE:
Analyze differences in overall survival (OS) of patients with residual MIBC treated with NAC + Radical cystectomy (RC), RC alone, or RC + Adjuvant Chemotherapy(AC).
MATERIALS AND METHODS:
The National Cancer Database was queried for patients who underwent RC alone, NAC + RC, or RC + AC for MIBC stage cT2-4aN0M0 from 2004-2015. Covariates were balanced using propensity score (PS) weighting. Time to death was evaluated from diagnosis. Weighted cox proportional hazards models and Kaplan-Meier survival curves were created to analyze differences in OS.
RESULTS:
8,288 patients were included for analysis, 1,899 (23%) received NAC + RC, 5,529 (67%) received RC alone, and 860 (10%) received RC + AC. Patients were sub-stratified based on pathological staging (≤pT2 or >pT2) and compared against treatment with RC alone. In the ≤pT2 cohort, NAC + RC was associated with a decreased risk of death (HR:0.85, 95% CI:0.79–0.91) and RC + AC was associated with an increased risk of death (HR:1.46, 95% CI:1.34–1.60, both p < 0.001) compared to RC alone. In the >pT2 cohort, these associations reversed, with an increased risk of death seen in the NAC + RC group (HR:1.11, 95% CI:1.05–1.18) and a decreased risk of death in the RC + AC group (HR:0.74, 95% CI:0.7–0.77, both p < 0.001).
CONCLUSIONS:
Patients with >ypT2 disease after NAC experienced a significant increased risk of death when compared to pathological stage-matched patients who underwent RC alone or RC + AC. Biomarkers predictive of NAC resistance may be important to optimize NAC usage and establish treatment algorithms.
ABBREVIATION KEY
NAC | Neoadjuvant Chemotherapy |
AC | Adjuvant Chemotherapy |
RC | Radical Cystectomy |
CDCC | Charlson-Deyo comorbidity classification |
PS | Propensity Score |
MIBC | Muscle Invasive Bladder Cancer |
OS | Overall Survival |
INTRODUCTION
Bladder cancer is the 5th most commonly diagnosed malignancy in the USA with an expected 81,400 new cases and 17,980 deaths in 2020 [1]. Approximately 25% of patients are diagnosed with muscle invasive bladder cancer (MIBC) at the time of presentation and progression to MIBC occurs in 20–40% of patients with non-invasive disease [2, 3]. Radical cystectomy (RC) with neoadjuvant chemotherapy (NAC) is standard of care treatment for MIBC patients [4]. Two large randomized clinical trials, and meta-analyses, have demonstrated a significant improvement in overall survival with the use of neoadjuvant cisplatin-based chemotherapy prior to cystectomy versus cystectomy alone [5, 6].
Despite the high level of evidence, the adoption of NAC has been suboptimal [7]. The potential reasons for the relatively poor uptake of NAC have been well described [8, 9]. A commonly cited concern is the difficulty in identifying which patients are most likely to benefit from treatment. The development of predictive biomarkers for NAC has been a major priority of translational research in an attempt to apply NAC in a more precise manner.
Recent analysis has shown that patients with residual cancer after NAC and surgery have worse outcomes compared to patients undergoing surgery alone [10]. Furthermore, Bandini et al. queried the Retrospective International Study of Invasive/Advanced Cancer of the Urothelium (RISC) database and analyzed 950 patients with cT2-4N0 MIBC undergoing RC. Their study demonstrated that 1-yr recurrence-free survival rates after NAC were lower in patients with residual disease (>pT0N0) compared with results for RC alone or RC + AC [11]. Our objective was to evaluate differences in overall survival of patients with residual MIBC who were treated with NAC + RC, RC alone, or RC + Adjuvant chemotherapy (AC).
PATIENTS AND METHODS
The study was exempt by the institutional review board of Mount Sinai Hospital as the data are publicly available and deidentified. The requirement for informed consent was waived in view of the retrospective design of the study.
Data source: National Cancer Data Base
The National Cancer Data Base (NCDB) is a national cancer registry that contains information on over 25 million cancer patients who have been diagnosed and treated in cancer centers throughout the USA since 1985 [12]. The NCDB combines patient data from more than 1,500 institutions across the USA and includes roughly 70% of all newly diagnosed cancer cases [13].
Cohort selection and primary outcome
Inclusion criteria
The National Cancer Data Base was queried for patients with urothelial carcinoma of the bladder based on International Classification of Disease for Oncology, 3rd Edition (ICD-O-3) histology site codes 8120 and 8130.Data comprising patient, tumor, treatment, and facility factors were extracted. The American Joint Commission on Cancer staging system was used to further select for patients with cT2-4aN0M0 disease who had underwent radical cystectomy. Recipients of at least 2 chemotherapy agents administered within 180 days prior to radical cystectomy were identified as those who received neoadjuvant systemic therapy. Likewise, patients who received at least 2 chemotherapy agents within 90 days following radical cystectomy were identified as patients who received adjuvant systemic therapy. Data regarding specific chemotherapy regimens, including agents used and number of treatment cycles was unavailable from this dataset.
Exclusion criteria
Patients with any other histology and positive surgical margins were excluded from this cohort. Additionally, patients who received radiation therapy were also excluded.
Primary outcome
The primary outcome measure for this study was to evaluate differences in overall survival of patients with residual MIBC who were treated with NAC + RC, RC alone, or RC + AC.
Covariates
Supplemental variables regarding patient, disease, and facility characteristics were supplied from the NCDB and used to further evaluate our study cohort. Patient characteristics that were extracted included age, gender, race, insurance status, median household yearly income (Low (< $48,000) vs. High (≥$48,000)), Charlson-Deyo comorbidity classification(CDCC), education (Low (≥13% of adults did not graduate high school from patient’s zip code) vs. High (<13% of adults did not graduate high school from patient’s zip code)), distance to treatment facility from patient’s residence, and county setting (Metro (≥250,000 people) vs. Urban (2,500–250,000 people) vs. Rural (<2,500 people)). Variables extracted regarding disease characteristics included AJCC Staging system codes and histological grade. Facility characteristics included facility location and type (Academic vs. Nonacademic).
Statistical analysis
To account for selection bias, differences in baseline characteristics between NAC + RC, RC alone, and RC + AC were controlled for using propensity score (PS)–adjusted analyses [14]. Pretreatment covariates including age, sex, race, insurance, income, education, county, facility type, CDCC, and clinical size (cT) were balanced using PS-weighting. Balance in covariates between the groups was evaluated using the standardized mean differences (SMD) approach, with a SMD < 0.1 defined as adequate balance. To evaluate differences in OS, PS-adjusted Kaplan-Meier curves were calculated and stratified based on pathologic stage and pathologic response to NAC (pT < cT). A Cox proportional hazards model was then used to assess hazard ratios in the fully weighted cohort. To assess the impact of guaranteed-time bias, we repeated our survival analyses using a conditional landmark at 6 months after time of diagnosis [15]. A multi variable analysis using logistic regression was performed in order to determine preoperative clinical factors correlated to <ypT2 following NAC. All analyses were performed using R software (version 3.4.3).
RESULTS
Patient characteristics
A total of 8,288 patients met our inclusion criteria, 1,899 (23%) underwent NAC + RC, 5,529 (67%) received RC alone, and 860 (10%) underwent RC + AC (Fig. 1). Patients who received NAC + RC were younger (median age 66, IQR 59–72) than those who underwent RC alone or RC + AC (median age 72, IQR 64–78; median age 66, IQR 59–73, respectively), had higher income (63.8% vs 57.6% vs 62.8%) and education (64.9% vs 58.2% vs 63.7%), and were treated at an academic center (63.9% vs 53.5% vs 47.2%). Patients who received NAC were also healthier than those who received RC alone or RC + AC (CDCC 0–1 : 94.4% vs 89.0% vs 92%, respectively) and had a more advanced clinical tumor stage (≥cT3 : 21.9% vs 14.3% vs 19.4%) (Table 1).
Fig. 1
Schematic illustration of cohort inclusion and exclusion criteria.
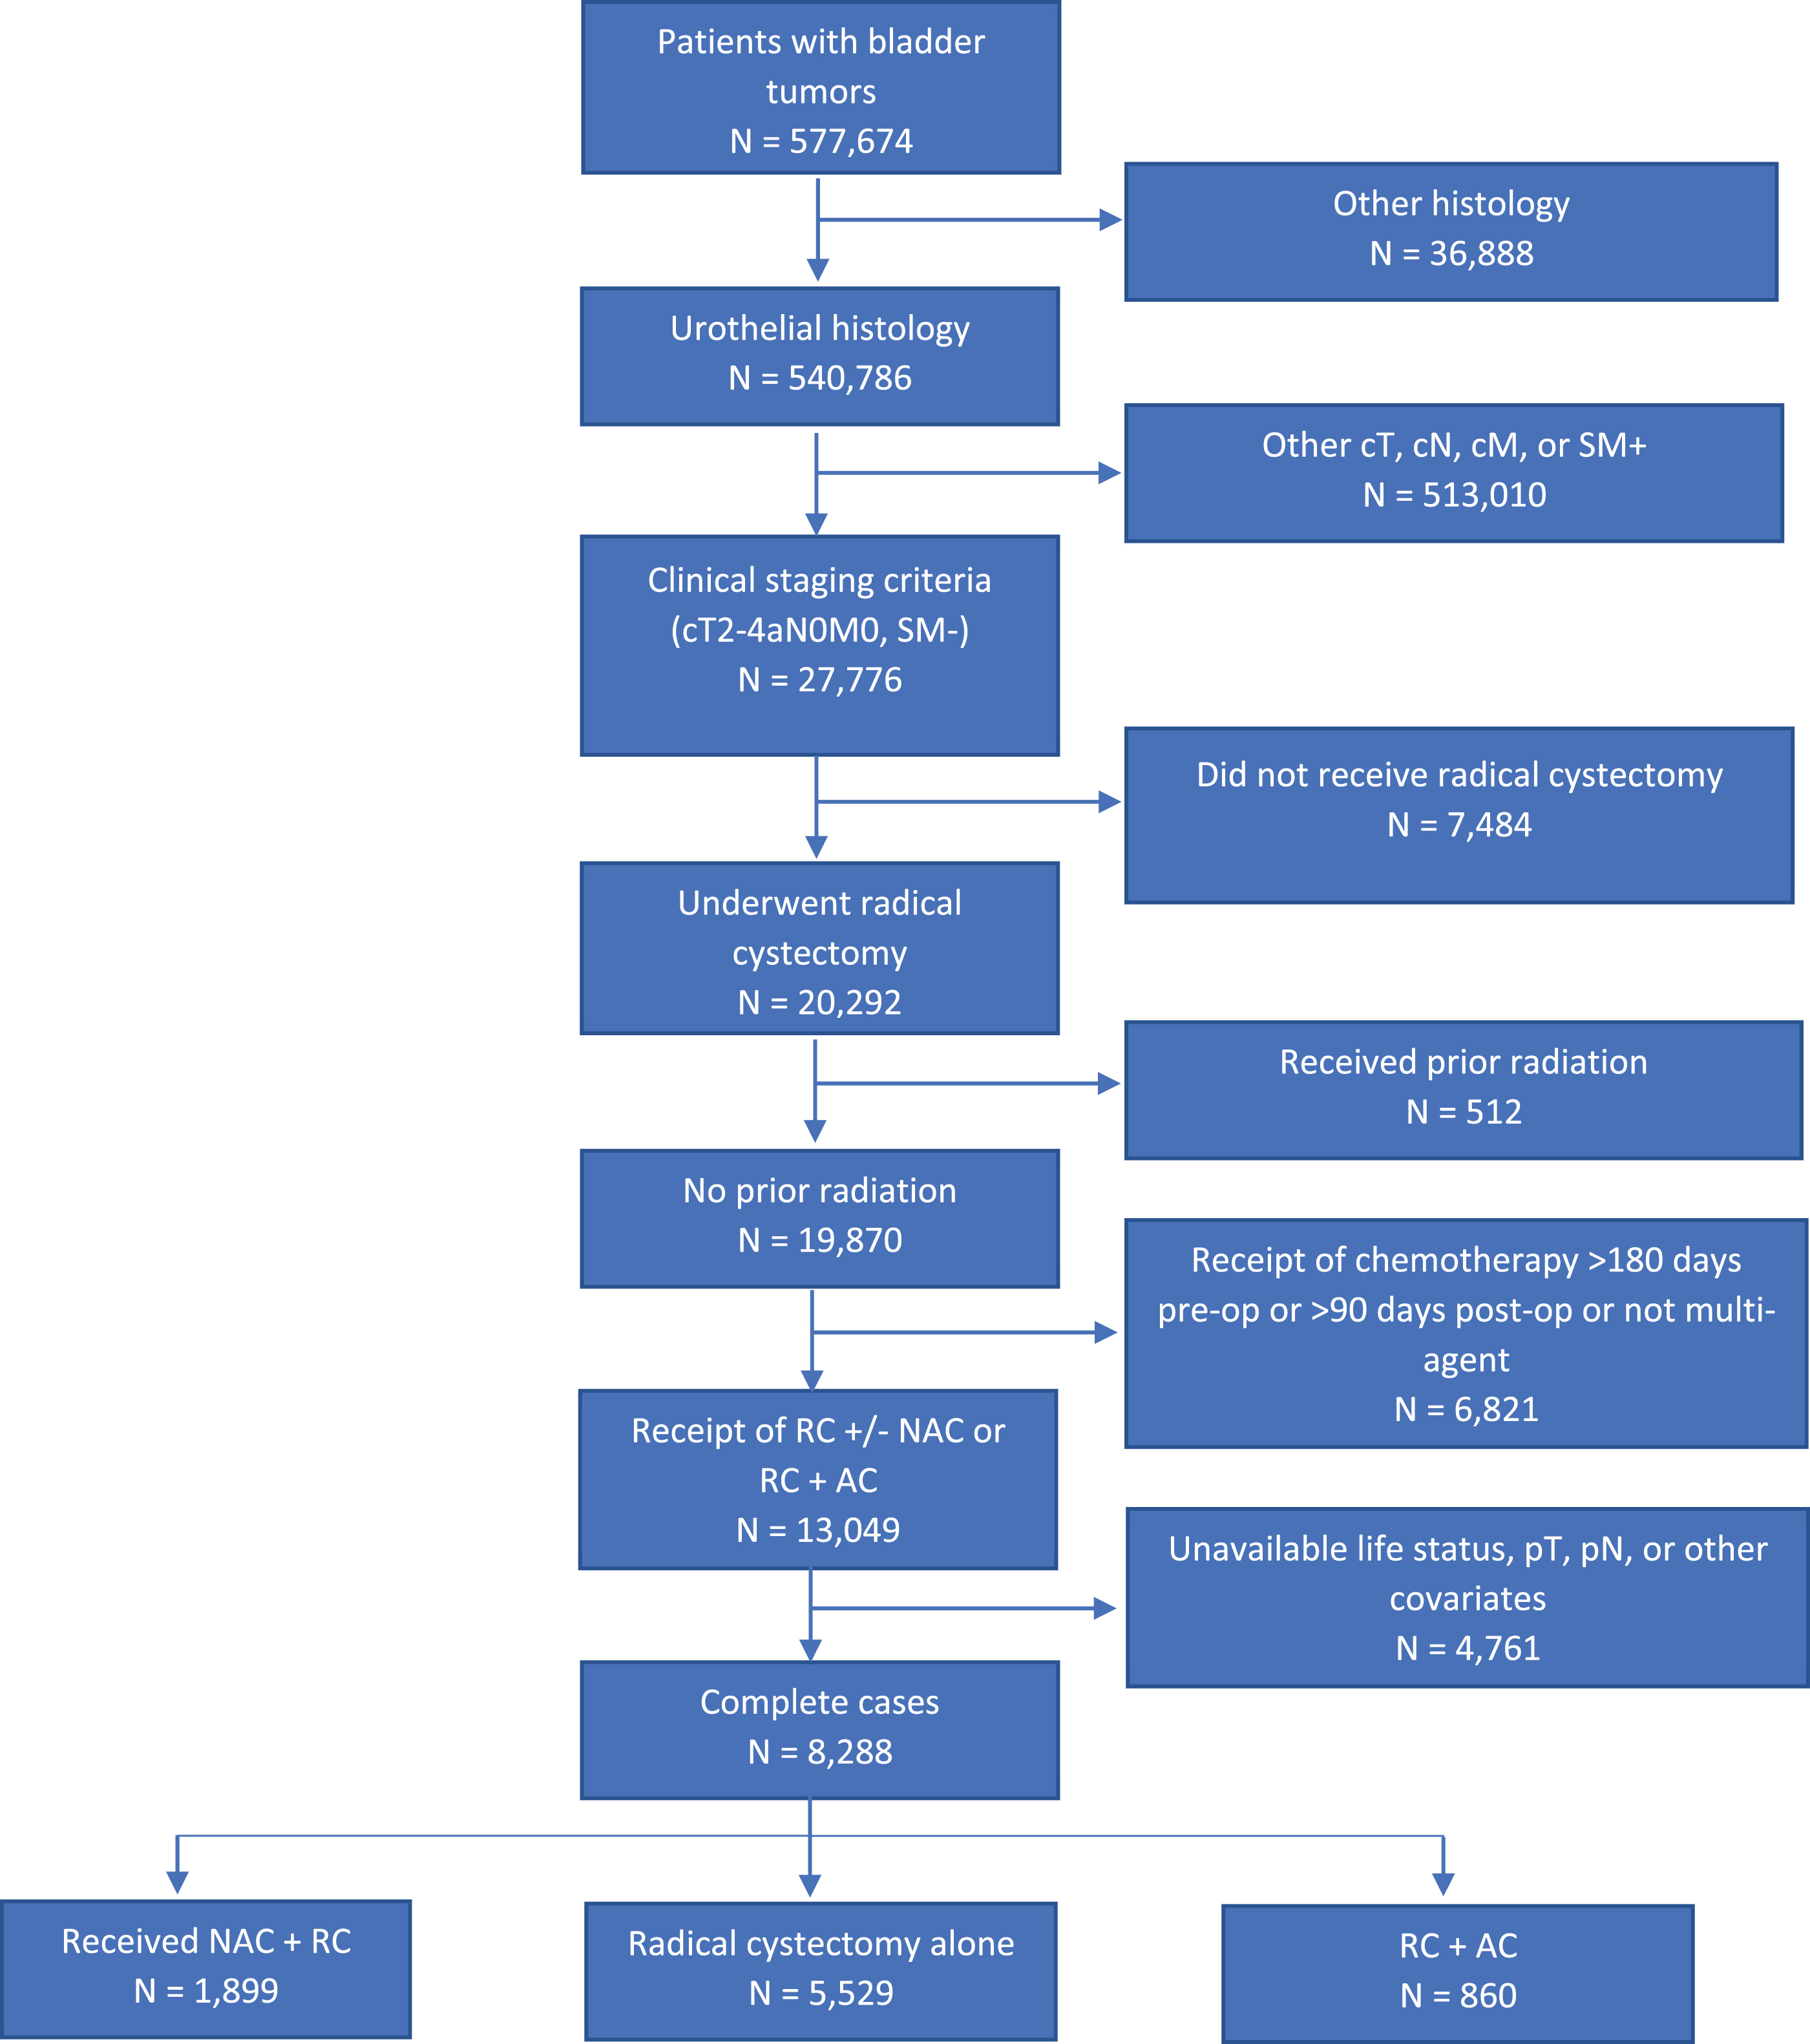
Table 1
Demographic, Clinical, and Tumor characteristics between patients treated with radical cystectomy alone vs neoadjuvant chemotherapy prior to radical cystectomy vs radical cystectomy followed by adjuvant chemotherapy
| Unweighted | Weighted | ||||||
| Group | RC Alone | NAC+RC | RC+AC | RC Alone | NAC+RC | RC+AC | SMD |
| n | 5529 | 1899 | 860 | 8198.4 | 7746.72 | 7722.35 | |
| Age (median (IQR)) | 72 (64–78) | 66 (59–72) | 66 (59–73) | 70 (62–77) | 70 (62–76) | 70 (62–76) | 0.018 |
| Sex (%) | |||||||
| Female | 1330 (24.1) | 457 (24.1) | 197 (22.9) | 1952.8 (23.8) | 1832.3 (23.7) | 1712.0 (22.2) | 0.026 |
| Male | 4199 (75.9) | 1442 (75.9) | 663 (77.1) | 6245.6 (76.2) | 5914.4 (76.3) | 6010.3 (77.8) | |
| Race (%) | |||||||
| White | 5017 (90.7) | 1715 (90.3) | 793 (92.2) | 7453.0 (90.9) | 7071.4 (91.3) | 7056.5 (91.4) | 0.012 |
| Black | 302 (5.5) | 103 (5.4) | 37 (4.3) | 432.6 (5.3) | 385.1 (5.0) | 379.3 (4.9) | |
| Other | 210 (3.8) | 81 (4.3) | 30 (3.5) | 312.9 (3.8) | 290.2 (3.7) | 286.6 (3.7) | |
| Insurance (%) | |||||||
| Medicaid/Other | 240 (4.3) | 111 (5.8) | 50 (5.8) | 385.8 (4.7) | 322.1 (4.2) | 319.0 (4.1) | 0.023 |
| Government | |||||||
| Medicare | 3757 (68.0) | 987 (52.0) | 443 (51.5) | 5162.5 (63.0) | 4889.8 (63.1) | 4872.2 (63.1) | |
| No insurance | 121 (2.2) | 43 (2.3) | 18 (2.1) | 176.2 (2.1) | 148.0 (1.9) | 149.7 (1.9) | |
| Private | 1411 (25.5) | 758 (39.9) | 349 (40.6) | 2473.9 (30.2) | 2386.8 (30.8) | 2381.5 (30.8) | |
| Income (%) | |||||||
| High | 3185 (57.6) | 1212 (63.8) | 540 (62.8) | 4880.5 (59.5) | 4672.0 (60.3) | 4753.7 (61.6) | 0.028 |
| Low | 2344 (42.4) | 687 (36.2) | 320 (37.2) | 3317.9 (40.5) | 3074.7 (39.7) | 2968.6 (38.4) | |
| Education (%) | |||||||
| High | 3219 (58.2) | 1233 (64.9) | 548 (63.7) | 4951.0 (60.4) | 4774.3 (61.6) | 4785.6 (62.0) | 0.022 |
| Low | 2310 (41.8) | 666 (35.1) | 312 (36.3) | 3247.4 (39.6) | 2972.4 (38.4) | 2936.8 (38.0) | |
| County (%) | |||||||
| Metro | 4390 (79.4) | 1529 (80.5) | 725 (84.3) | 6580.7 (80.3) | 6259.3 (80.8) | 6249.8 (80.9) | 0.021 |
| Rural | 161 (2.9) | 35 (1.8) | 16 (1.9) | 208.4 (2.5) | 163.4 (2.1) | 161.4 (2.1) | |
| Urban | 978 (17.7) | 335 (17.6) | 119 (13.8) | 1409.3 (17.2) | 1324.0 (17.1) | 1311.1 (17.0) | |
| Distance | 17.2 (6.6–50.5) | 20.2 (8.5–49.0) | 13.4 (5.4–31.0) | 17.4 (6.8–50.7) | 17.4 (7.2–45.6) | 15 (5.7–37.8) | 0.042 |
| to facility | |||||||
| (median (IQR)) | |||||||
| Facility Type (%) | |||||||
| Academic | 2957 (53.5) | 1213 (63.9) | 406 (47.2) | 4509.9 (55.0) | 4323.2 (55.8) | 4165.8 (53.9) | 0.025 |
| Nonacademic | 2572 (46.5) | 686 (36.1) | 454 (52.8) | 3688.5 (45.0) | 3423.6 (44.2) | 3556.6 (46.1) | |
| cT (%) | |||||||
| cT2 | 4738 (85.7) | 1483 (78.1) | 693 (80.6) | 6875.3 (83.9) | 6494.9 (83.8) | 6493.8 (84.1) | 0.006 |
| cT3 | 551 (10.0) | 269 (14.2) | 101 (11.7) | 894.1 (10.9) | 853.3 (11.0) | 831.2 (10.8) | |
| cT4a | 240 (4.3) | 147 (7.7) | 66 (7.7) | 428.9 (5.2) | 398.6 (5.1) | 397.4 (5.1) | |
| pT (%) | |||||||
| pT0 | 127 (2.3) | 369 (19.4) | 10 (1.2) | 192.7 (2.3) | 1434.7 (18.5) | 89.6 (1.2) | 0.829 |
| pT1 | 327 (5.9) | 319 (16.8) | 14 (1.6) | 516.1 (6.3) | 1238.4 (16.0) | 140.7 (1.8) | |
| pT2 | 2300 (41.6) | 484 (25.5) | 122 (14.2) | 3417.0 (41.7) | 2013.8 (26.0) | 1167.1 (15.1) | |
| pT3 | 2190 (39.6) | 538 (28.3) | 546 (63.5) | 3185.5 (38.9) | 2367.5 (30.6) | 4938.9 (64.0) | |
| pT4 | 585 (10.6) | 189 (10.0) | 168 (19.5) | 887.2 (10.8) | 692.3 (8.9) | 1386.0 (17.9) | |
| pN (%) | |||||||
| pN0 | 4733 (85.6) | 1589 (83.7) | 365 (42.4) | 7057.5 (86.1) | 6449.4 (83.3) | 3159.8 (40.9) | 0.704 |
| pN+ | 796 (14.4) | 310 (16.3) | 495 (57.6) | 1140.9 (13.9) | 1297.3 (16.7) | 4562.5 (59.1) | |
| Margins (%) | |||||||
| Negative | 5529 (100.0) | 1899 (100.0) | 860 (100.0) | 8198.4 (100.0) | 7746.7 (100.0) | 7722.3 (100.0) | <0.001 |
| Charlson (%) | |||||||
| 0–1 | 4920 (89.0) | 1793 (94.4) | 791 (92.0) | 7419.0 (90.5) | 7063.4 (91.2) | 7047.6 (91.3) | 0.018 |
| 2–3 | 609 (11.0) | 106 (5.6) | 69 (8.0) | 779.4 (9.5) | 683.4 (8.8) | 674.8 (8.7) | |
| Overall Survival | 28.1 (11.6–56.0) | 27.8 (15.5–49.8) | 27.8 (14.6–55.3) | 29.2 (12.1–57.2) | 26.3 (14.7–45.8) | 27.0 (14.3–52.7) | 0.106 |
| in Months | |||||||
| (median (IQR)) | |||||||
In the NAC + RC group, 786 patients (41%) experienced pathological down staging. Of these, 369 (19%) had complete response (ypT0). Additionally, a total of 525 patients (28%) in the NAC + RC group experienced pathological up staging (Table 2a). In comparison, the RC + AC group experienced a much lower percentage of patients with pathological down staging (36 patients (4%)) and a much higher percentage of patients with pathological upstaging (562 patients (65%)) (Table 2b). Table 2c shows the pathological upstaging (2,121 patients (38%)) and down staging (535 patients (10%)) data for those treated with RC alone.
Table 2
Comparison of preoperative clinical stages and postoperative pathological stages for those treated with (a) NAC + RC, (b) RC followed by AC, and (c) RC alone
| a) | Preoperative clinical stage | Postoperative pathological stage | ||||
| ypT0 (N = 369) | ypT1 (N = 319) | ypT2 (N = 484) | ypT3 (N = 538) | ypT4 (N = 189) | ||
| cT2 (N = 1,483) | 318 | 256 | 409 | 403 | 97 | |
| cT3 (N = 269) | 34 | 42 | 56 | 112 | 25 | |
| cT4a (N = 147) | 17 | 21 | 19 | 23 | 67 | |
| b) | Preoperative clinical stage | Postoperative pathological stage | ||||
| pT0 (N = 10) | pT1 (N = 14) | pT2 (N = 122) | pT3 (N = 546) | pT4 (N = 168) | ||
| cT2 (N = 693) | 10 | 12 | 117 | 452 | 102 | |
| cT3 (N = 101) | 0 | 2 | 4 | 87 | 8 | |
| cT4a (N = 66) | 0 | 0 | 1 | 7 | 58 | |
| c) | Preoperative clinical stage | Postoperative pathological stage | ||||
| pT0 (N = 127) | pT1 (N = 327) | pT2 (N = 2,300) | pT3 (N = 2,190) | pT4 (N = 585) | ||
| cT2 (N = 4,738) | 116 | 308 | 2234 | 1728 | 352 | |
| cT3 (N = 551) | 3 | 12 | 48 | 447 | 41 | |
| cT4a (N = 240) | 8 | 7 | 18 | 15 | 192 | |
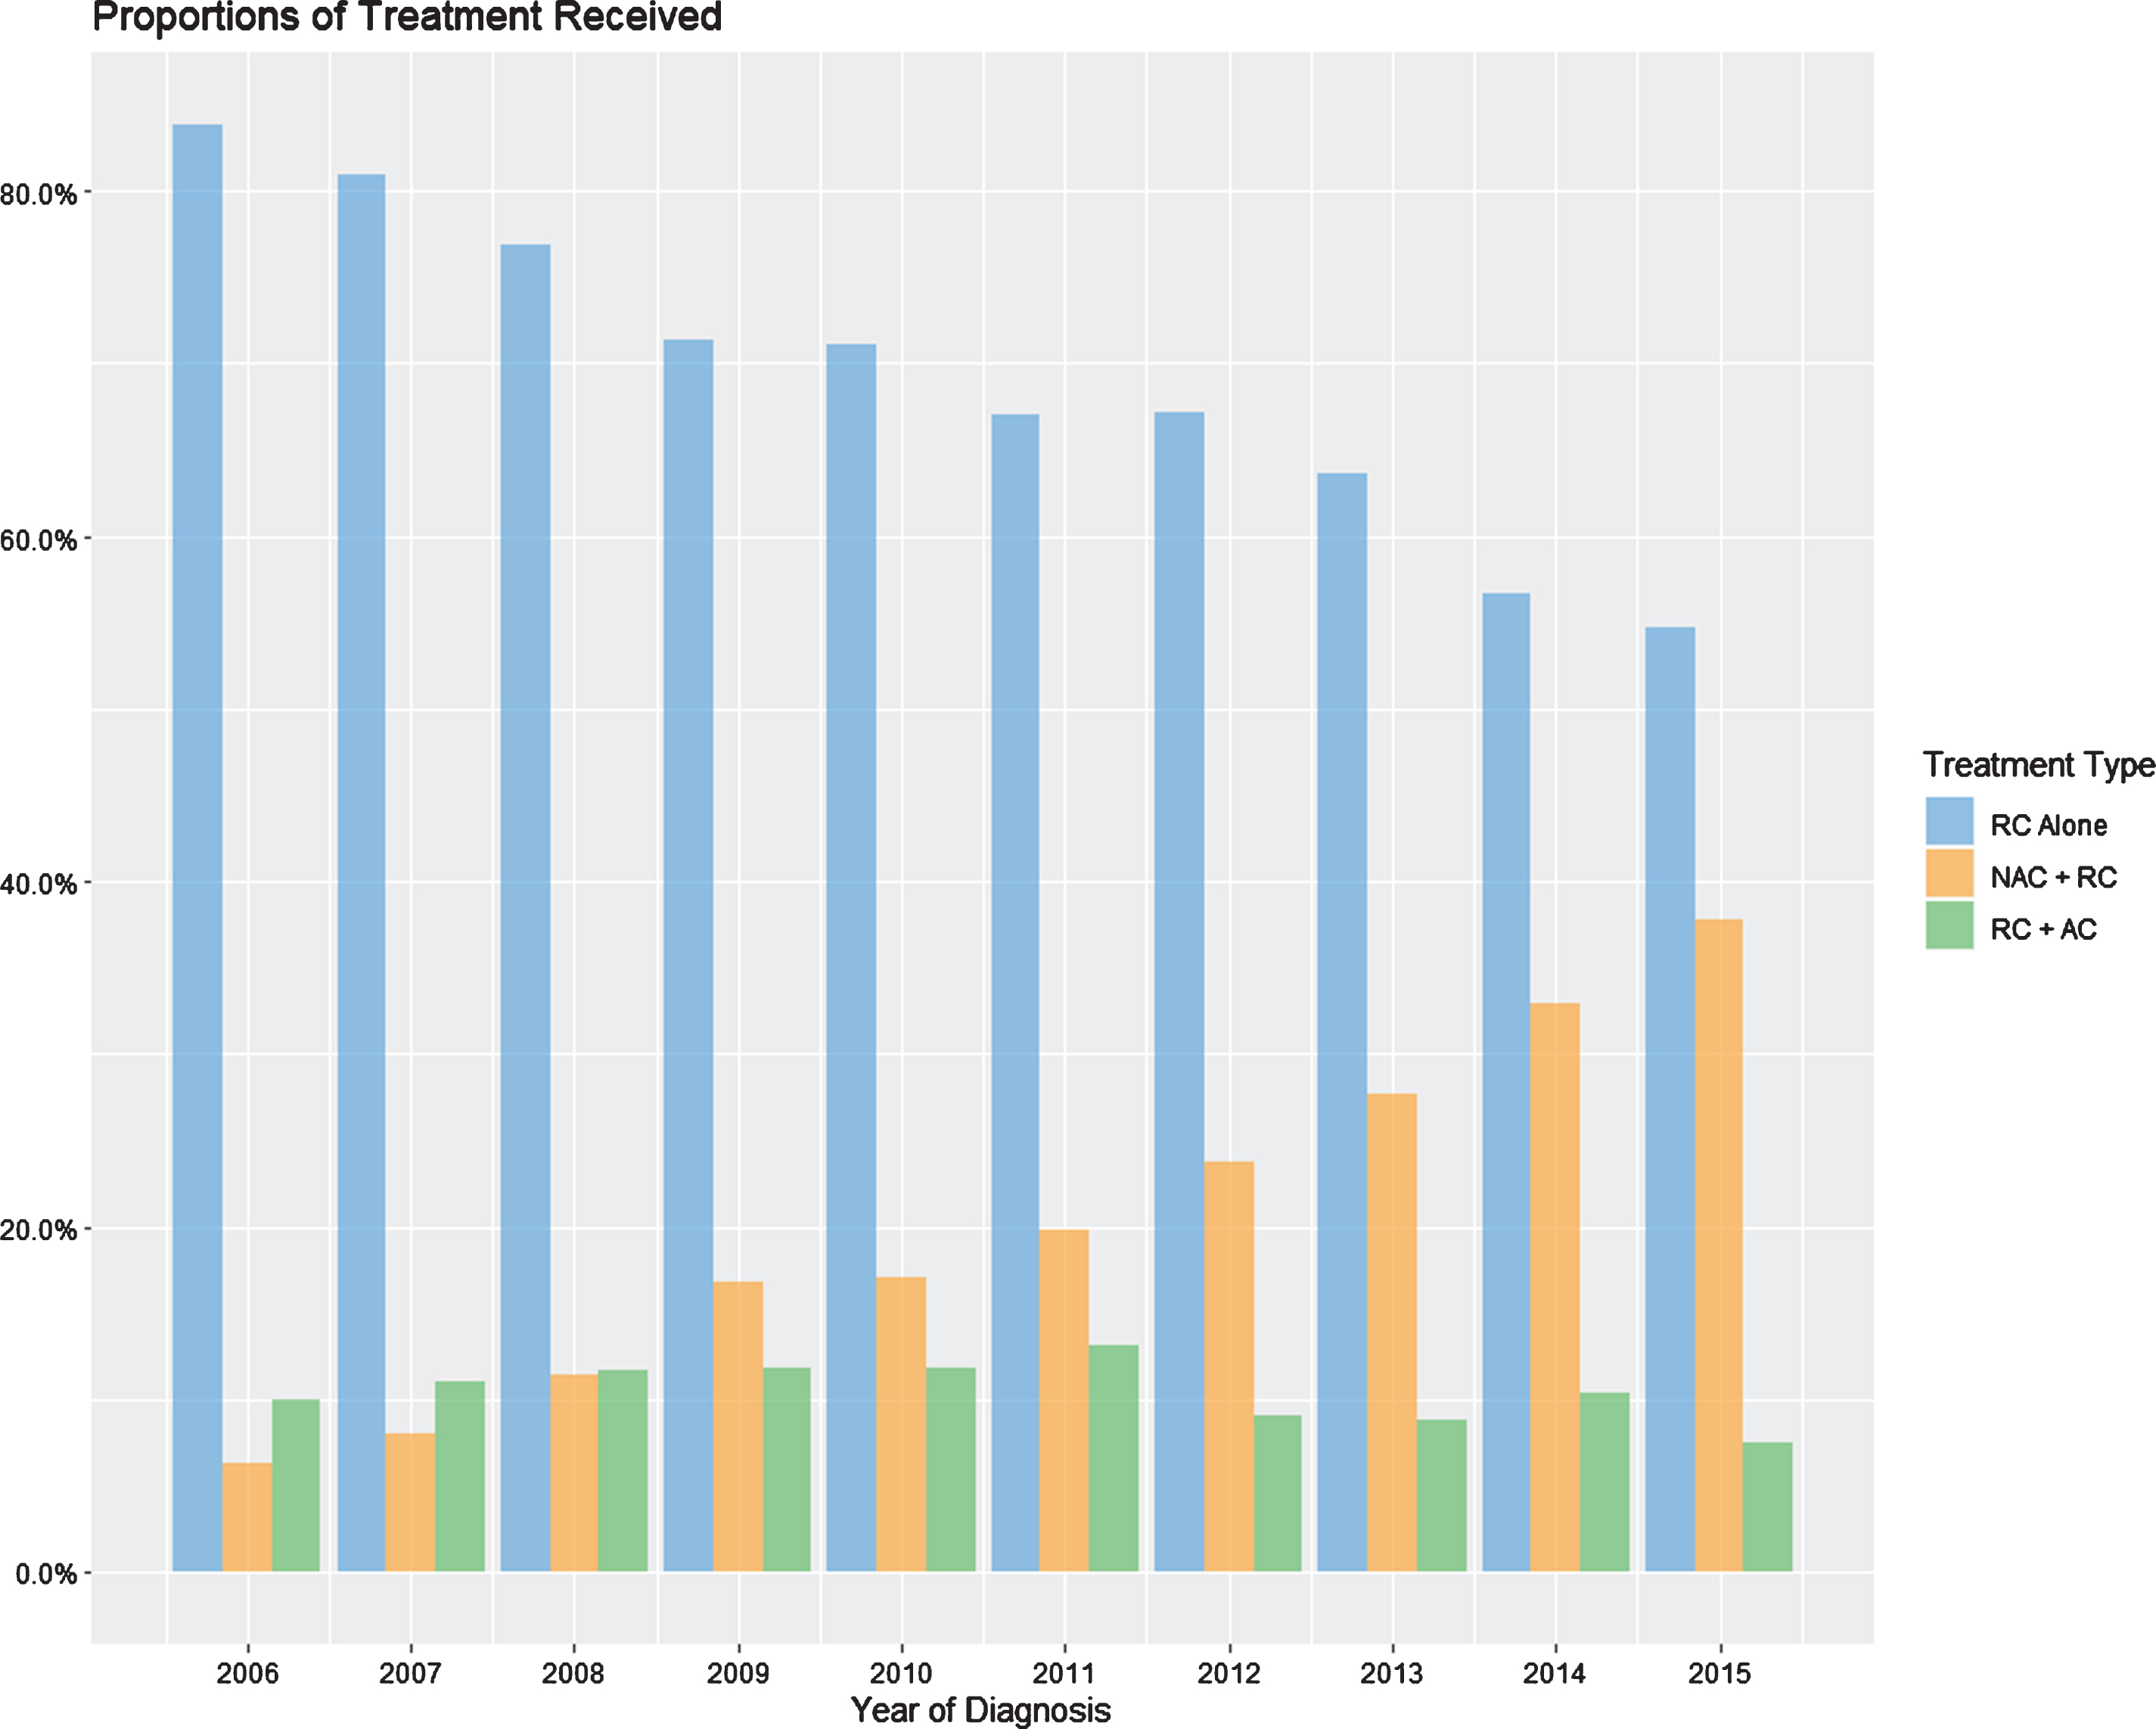
The proportion of patients in our cohort receiving each treatment type was tracked per year (Fig. 2). Throughout the period of 2006-2015, the percentage of patients receiving RC alone has decreased from 85% to 55%, while patients receiving NAC + RC has steadily increased from 7% to 38%, and those receiving RC + AC has remained around 10%.
Fig. 2
Yearly percentages of treatment with NAC + RC, RC alone, or RC + AC.
Overall survival analysis
In the weighted cohort, the median follow-up times were 52.7 months for NAC + RC, 49.1 months for RC alone, and 33.8 months for RC + AC. The 5-year PS-adjusted OS rates were 47.7% (95% CI: 46.3–49.1%) vs. 45.7% (95% CI: 44.5–46.9%) vs. 38.5% (95% CI: 37.2–39.7%), respectively. Additionally, the 5-year PS-adjusted OS rates based on pathological stage were 73.9% (95% CI: 71.0–76.8%), 71.4% (95% CI: 69.0–74.0%), 55.3% (95% CI: 53.9–56.7%), 33.6% (95% CI: 32.6–34.6%), and 23.8% (95% CI: 22.0–25.6%) for all patients with pT0, pTis/Ta/T1, pT2, pT3, and pT4 disease, respectively.
PS-adjusted survival analysis stratified by treatment regimen revealed a decreased median OS for those treated with RC + AC relative to NAC+RC or RC alone (Median OS (95% CI): 33.8 (33.3–36.2) months vs 52.7 (48.6–56.1) months vs 49.1 (46.4–52.6) months, respectively; p < 0.001) (Fig. 3a and Table 3). Further stratification by pathological staging (Fig. 3b and Table 3) showed a survival benefit associated with NAC + RC when compared to patients receiving either RC alone or RC + AC in patients found to have ≤pT2 disease (Median OS (95% CI) 103.4 (96.7–110.1) months vs. 89.0 (84.4–94.6) months vs. 54.7 (53.7–58.7) months, respectively, p < 0.001). However, the median OS for those with >pT2 disease showed a higher median OS in those treated with RC + AC (30.3 (29.9–32.5) months) and RC alone (23.1 (21.6–24.5) months) with the NAC+RC group (21.1 (19.9–22.2) months, p < 0.001) having the lowest median OS (Table 3).Furthermore, patients treated with NAC + RC without pathological response experienced a decreased OS relative to those treated with NAC + RC with response, RC alone, or RC + AC (Fig. 3c). Repeat analysis with the implementation of a 6-month conditional landmark revealed similar results (Table 3).
Fig. 3
PS-adjusted Kaplan Meier analysis of overall survival for patients treated with NAC + RC vs RC alone vs RC + AC stratified by (a) treatment type, (b) pathological stage (≤pT2 vs. >pT2), and (c) treatment type and response to NAC.
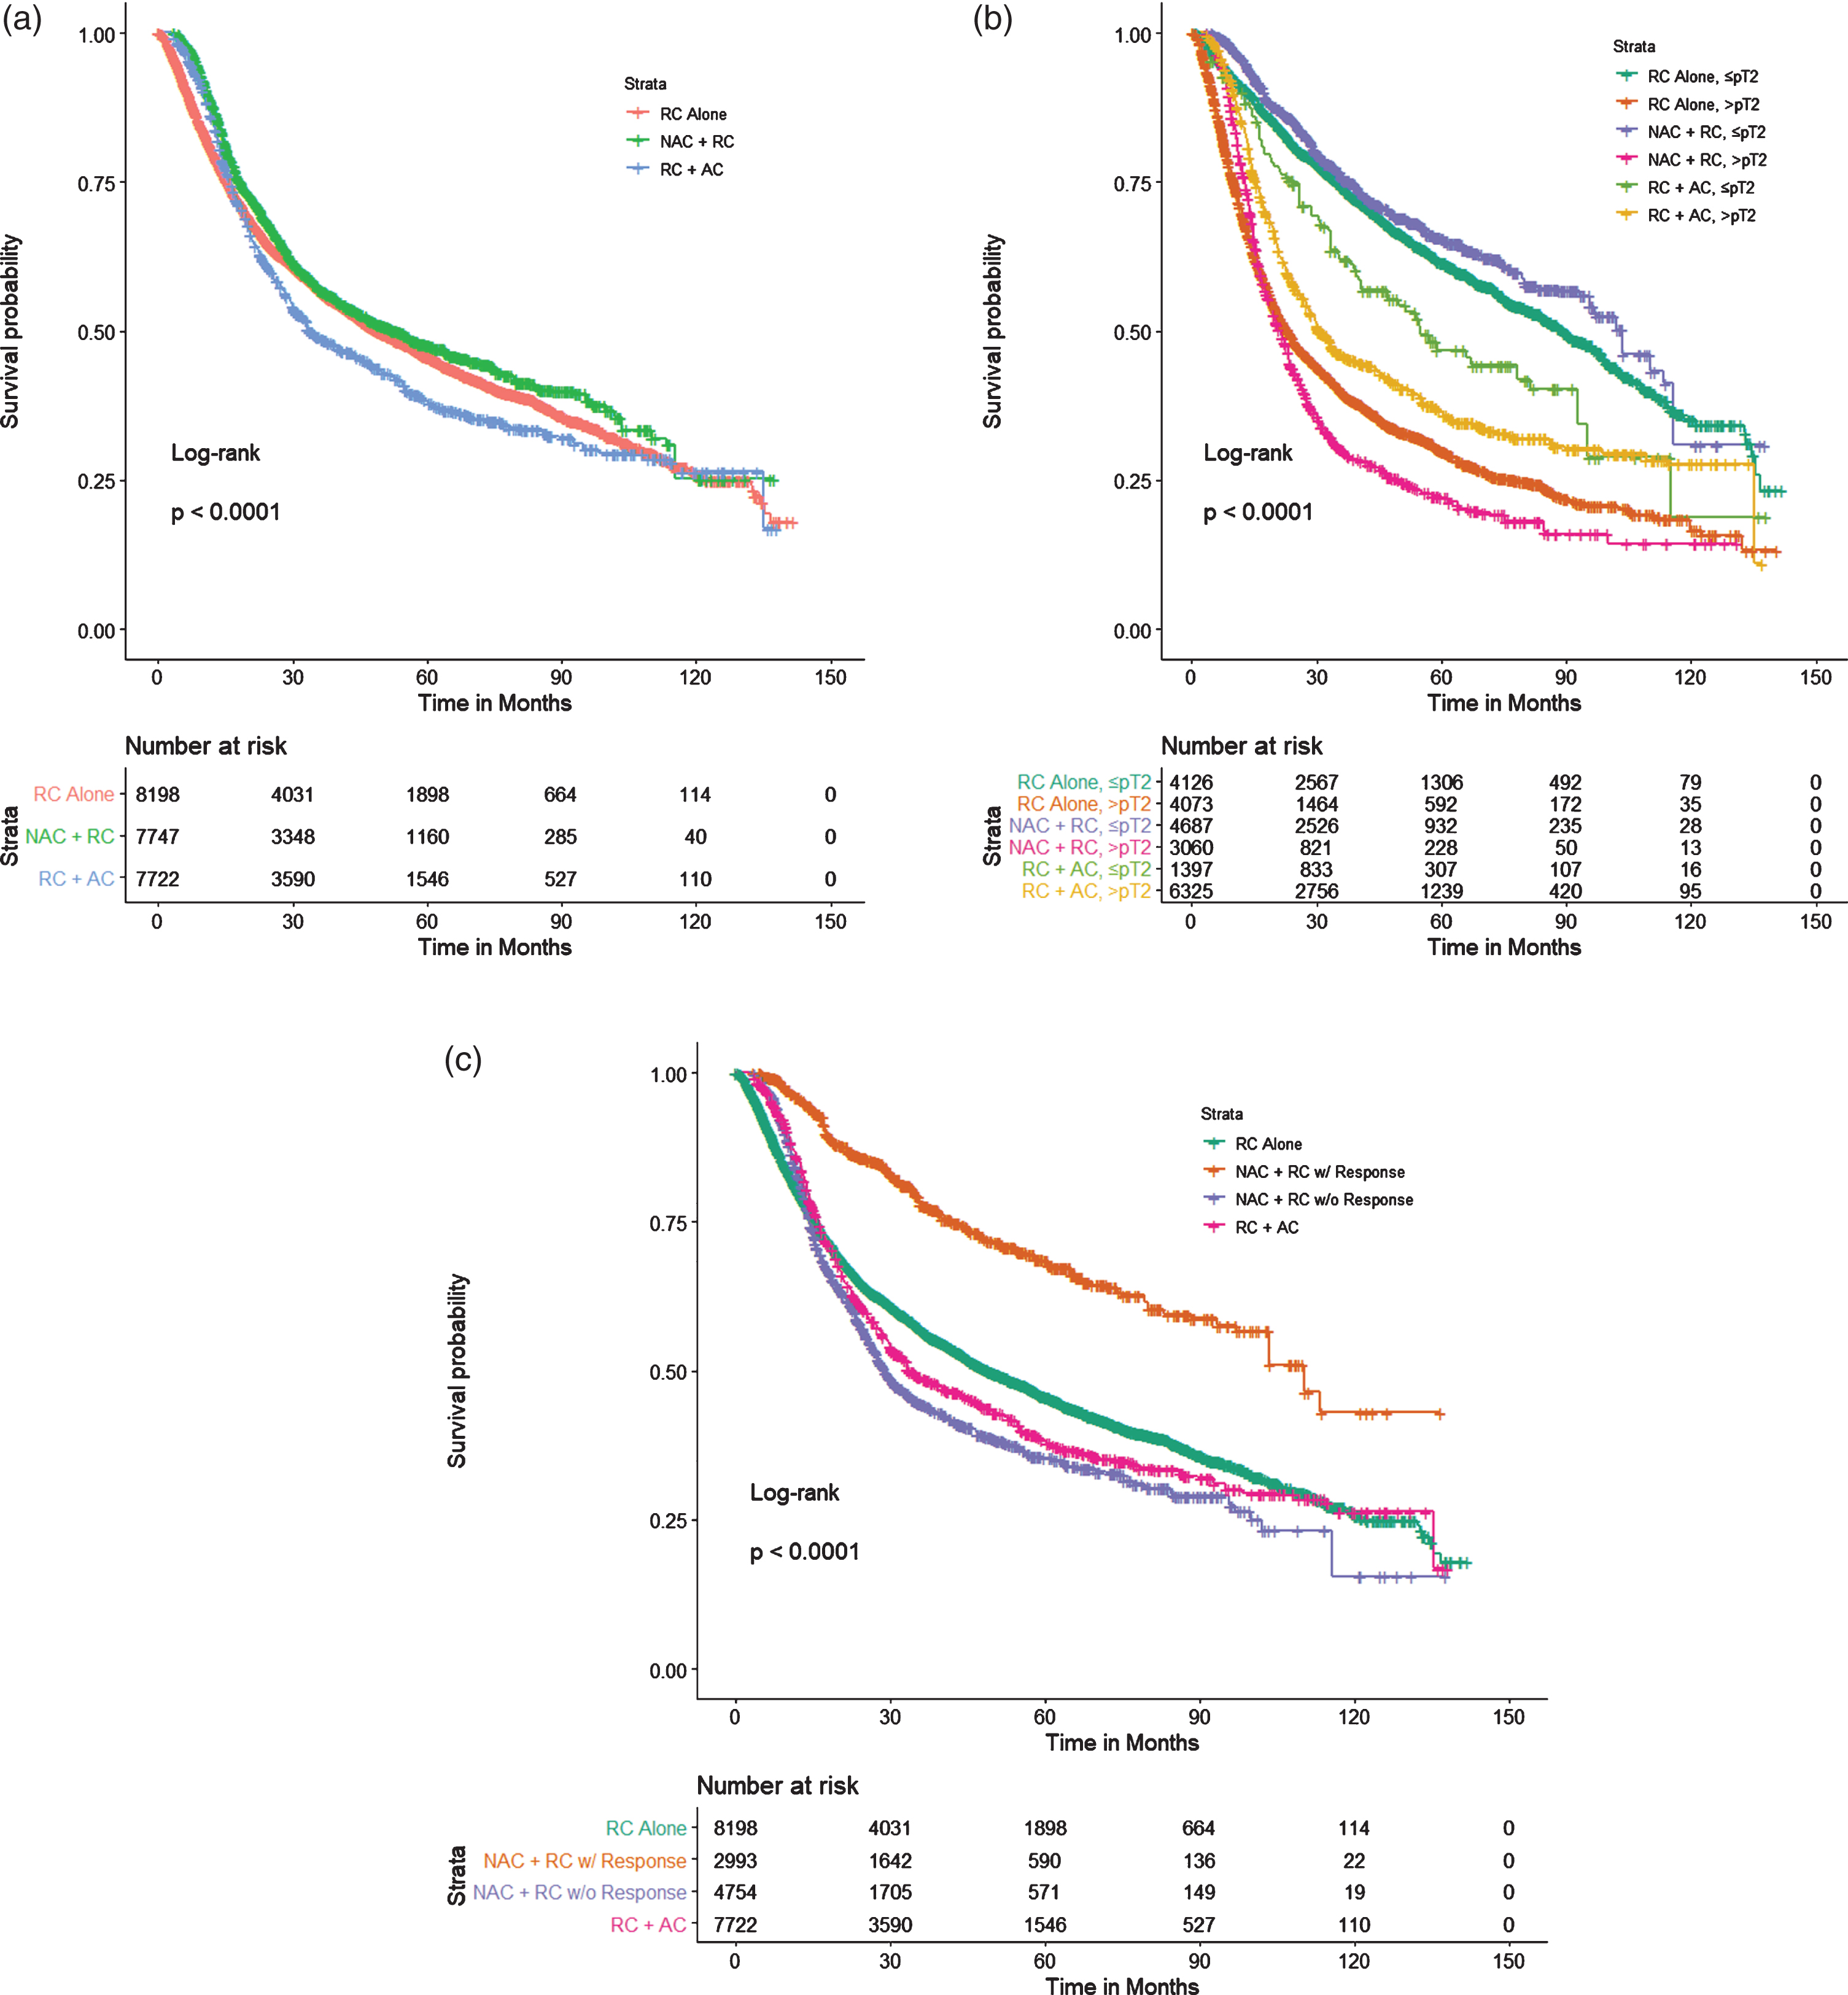
Table 3
Median survival analyses comparing overall survival of different treatment types stratified by pathological stage with an additional 6-month conditional landmark analysis
| Median OS, months (95% CI) | ||||
| NAC + RC | RC Alone | RC + AC | p-value | |
| No Conditional Landmark: | ||||
| No Stratification | 52.7 (48.6–56.1) | 49.1 (46.4–52.6) | 33.8 (33.3–36.2) | <0.001 |
| ≤pT2 | 103.4 (96.7–110.1) | 89.0 (84.4–94.6) | 54.7 (53.7–58.7) | <0.001 |
| >pT2 | 21.1 (19.9–22.2) | 23.1 (21.6–24.5) | 30.3 (29.9–32.5) | <0.001 |
| Stratification by pT stage: | ||||
| <pT2 | 110.0 (103.4–NA) | 103.0 (99.4–NA) | NA | 0.05 |
| pT2 | 79.9 (75.3–96.7) | 83.9 (77.5–89.0) | 51.4 (47.0–54.6) | 0.116 |
| pT3 | 22.3 (21.1–23.2) | 24.9 (23.5–27.1) | 33.2 (32.2–33.8) | <0.001 |
| pT4 | 18.0 (16.7–18.8) | 17.4 (15.6–19.5) | 24.1 (21.3–25.0) | 0.002 |
| 6-mo. Conditional Landmark: | ||||
| No Stratification | 56.1 (51.9–60.6) | 60.4 (57.7–63.2) | 37.0 (34.7–39.6) | <0.001 |
| ≤pT2 | 103.4 (97.1–110.1) | 94.6 (89.1–98.9) | 58.7 (54.7–67.1) | <0.001 |
| >pT2 | 22.2 (21.1–23.2) | 30.9 (28.9–33.3) | 32.5 (30.3–33.3) | <0.001 |
| Stratification by pT stage: | ||||
| <pT2 | 110 (103.4–NA) | 106 (99.4–NA) | NA | 0.17 |
| pT2 | 95.6 (76.9–96.7) | 89.0 (83.9–96.0) | 54.6 (51.4–56.9) | 0.391 |
| pT3 | 23.2 (22.2–23.6) | 32.1 (29.8–34.6) | 33.6 (33.0–35.8) | <0.001 |
| pT4 | 18.6 (17.5–19.2) | 25.0 (22.0–30.9) | 24.7 (22.5–27.2) | 0.087 |
PS-adjusted Cox regression analysis stratified by treatment regimen revealed a decreased risk of death in NAC+RC relative to RC alone (Hazard ratio [HR]: 0.889, 95% CI: 0.85–0.93; p < 0.001) and an increased risk of death in RC+AC relative to RC alone (HR: 1.11, 95% CR: 1.064–1.158; p < 0.001) (Table 4). Further stratification confirmed that NAC is associated with a survival benefit among those who had ≤ypT2 disease. These patients exhibited a 15% reduction in risk of death relative to those receiving RC alone (0.85, 95% CI: 0.79–0.91; p < 0.001). Additionally, those with ≤pT2 disease treated with RC + AC experienced an increased risk of death when compared to those treated with RC alone (HR: 1.46, 95% CI: 1.34–1.60; p < 0.001). These trends reversed in those with >pT2 disease, showing a decreased risk of death with RC + AC (HR: 0.74, 95% CI: 0.70–0.77; p < 0.001) and an increased risk of death with NAC + RC (HR: 1.11, 95% CI: 1.05–1.18; p < 0.001), both relative to RC alone (Table 4). The application of a 6-month conditional landmark returned similar results (Table 4).
Table 4
PS-adjusted Cox regression analyses comparing overall survival of different treatment types stratified by pathological stage with an additional 6-month conditional landmark analyses
| No Landmark | 6-month Landmark | |||||
| HR (Ref. RC Alone) | 95% CI | p-value | HR (Ref. RC Alone) | 95% CI | p-value | |
| No Stratification: | ||||||
| NAC + RC | 0.889 | 0.850–0.930 | <0.001 | 1.033 | 0.985–1.084 | 0.18 |
| RC + AC | 1.11 | 1.064–1.158 | <0.001 | 1.274 | 1.274–1.333 | <0.001 |
| Stratification by ≤pT2 vs. >pT2: | ||||||
| ≤pT2: | ||||||
| NAC + RC | 0.848 | 0.787–0.914 | <0.001 | 0.951 | 0.880–1.027 | 0.2 |
| RC + AC | 1.462 | 1.336–1.599 | <0.001 | 1.508 | 1.372–1.658 | <0.001 |
| >pT2: | ||||||
| NAC + RC | 1.113 | 1.051–1.178 | <0.001 | 1.336 | 1.256–1.42 | <0.001 |
| RC + AC | 0.737 | 0.701–0.774 | <0.001 | 0.872 | 0.827–0.92 | <0.001 |
| Stratification by pT stage: | ||||||
| pT0: | ||||||
| NAC + RC | 0.743 | 0.549–1.007 | 0.056 | 0.759 | 0.556–1.036 | 0.082 |
| RC + AC | 1.773 | 1.102–2.854 | 0.018 | 1.914 | 1.184–3.04 | 0.008 |
| pTa/Tis: | ||||||
| NAC + RC | 1.012 | 0.747–1.370 | 0.941 | 1.182 | 0.852–1.64 | 0.316 |
| RC + AC | 0.416 | 0.165–1.046 | 0.062 | 0.509 | 0.201–1.29 | 0.155 |
| pT1: | ||||||
| NAC + RC | 1.800 | 1.359–2.385 | <0.001 | 2.044 | 1.527–2.737 | <0.001 |
| RC + AC | 0.965 | 0.588–1.583 | 0.888 | 1.087 | 0.659–1.794 | 0.745 |
| pT2: | ||||||
| NAC + RC | 1.034 | 0.944–1.133 | 0.472 | 1.166 | 1.062–1.281 | 0.001 |
| RC + AC | 1.485 | 1.352–1.631 | <0.001 | 1.517 | 1.374–1.676 | <0.001 |
| pT3: | ||||||
| NAC + RC | 1.134 | 1.062–1.211 | <0.001 | 1.315 | 1.226–1.410 | <0.001 |
| RC + AC | 0.731 | 0.690–0.774 | <0.001 | 0.84 | 0.791–0.893 | <0.001 |
| pT4: | ||||||
| NAC + RC | 1.022 | 0.909–1.149 | 0.718 | 1.383 | 1.215–1.573 | <0.001 |
| RC + AC | 0.746 | 0.674–0.826 | <0.001 | 0.983 | 0.876–1.102 | 0.767 |
Multivariable logistic regression analysis
A multivariable logistic regression model was constructed using the raw dataset to determine potential preoperative predictors of <ypT2 following NAC. It was determined that cT3 (Odds Ratio [OR]: 0.64, 95% CI: 0.48–0.85, p = 0.002) and cT4a (OR: 0.54, 95% CI: 0.36–0.79, p = 0.002), treatment at a non-academic facility (OR: 0.82, 95% CI: 0.67–0.99, p = 0.048), and a CDCC of 2–3 (OR: 0.62, 95% CI: 0.39–0.96, p = 0.033) were correlated with decreased odds of <ypT2 following NAC. Additionally, those with private insurance (OR: 1.84, 95% CI: 1.18–2.86, p = 0.007) experienced an increased odds of <ypT2 following NAC (Table 5).
Table 5
Multivariable logistic regression model analyzing the effect of preoperative clinical factors on likelihood of <ypT2 following NAC treatment
| Variable | OR (95% CI) | p-value |
| Age | 0.990 (0.977–1.004) | 0.609 |
| Sex | ||
| Female | Ref. | |
| Male | 1.198 (0.952–1.508) | 0.168 |
| Race | ||
| White | Ref. | |
| Black | 0.912 (0.583–1.426) | 0.685 |
| Other | 1.154 (0.719–1.854) | 0.553 |
| Insurance | ||
| Medicaid/Other Govt. | Ref. | |
| Medicare | 1.354 (0.844–2.171) | 0.208 |
| No Insurance | 0.984 (0.445–2.178) | 0.969 |
| Private | 1.840 (1.183–2.861) | 0.007 |
| Income | ||
| High | Ref. | |
| Low | 0.890 (0.693–1.141) | 0.356 |
| Education | ||
| High | Ref. | |
| Low | 0.955 (0.754–1.209) | 0.703 |
| County | ||
| Metro | Ref. | |
| Rural | 0.731 (0.333–1.602) | 0.433 |
| Urban | 1.241 (0.951–1.618) | 0.112 |
| Facility Type | ||
| Academic | Ref. | |
| Non-academic | 0.817 (0.668–0.998) | 0.048 |
| cT | ||
| cT2 | Ref. | |
| cT3 | 0.638 (0.477–0.852) | 0.002 |
| cT4a | 0.536 (0.363–0.790) | 0.002 |
| Charlson | ||
| 0–1 | Ref. | |
| 2–3 | 0.615 (0.393–0.962) | 0.033 |
DISCUSSION
It is well-established that pathological down-staging with NAC at the time of radical cystectomy is associated with improved survival [5, 16]. In recent studies, patients treated with NAC+RC experienced a 11–23% increase in frequency of complete response when compared to patients treated with RC alone [17, 18]. A previous single institutional analysis has argued that delay in cystectomy might compromise the outcome in patients with chemotherapy resistant >ypT2 disease [10]. Our study shows that NAC + RC in patients found to have ≤pT2 disease does improve survival compared to other treatments (Table 4). However, those patients who harbor >ypT2 disease following NAC have the worst outcomes when compared to RC alone or RC + AC (Fig. 3b and Tables 3 and 4).
The therapeutic effects seen in patients treated with NAC + RC have been shown to be associated with a 5–8% improvement in overall survival when compared to patients who underwent RC alone [6, 19]. The greatest survival benefit is primarily attributed to patients who achieve a complete response (ypT0N0) following NAC, which is approximately 20–38% of patients [20–22]. The survival difference in this study between those treated with NAC + RC with or without pathological response can be seen in Fig. 3c.This, of course, raises the question of whether patients with no pathologic response experience any benefit from receipt of NAC, or whether they would be better served by RC alone or with enrollment in clinical trials.
In attempting to answer this question we demonstrated that patients with >ypT2 disease at time of RC who underwent NAC had worse overall survival when compared to >pT2 patients who underwent either RC alone or RC + AC. Specifically, patients who were treated with NAC and found to have >ypT2 disease experienced a significant decrease in median OS by 2 months and 9.2 months when compared to RC alone and RC + AC, respectively. Additionally, these patients who were treated with NAC + RC experienced a 11.3% increased risk of death when compared to patients with >pT2 disease who underwent RC alone(Table 4). As demonstrated in Table 2a, a large portion of patients with ypT3 or ypT4 disease were upstaged at time of RC depicting some evidence of resistance to NAC. The RC + AC group will also likely have a group of patients with chemo resistant tumors. Given the sequence of therapeutic events: RC first, recovery, adjuvant chemotherapy (time to resistance), we feel that those patients have a delay in treatment as well as a delay in second like therapy.
Within the limitation of clinical staging, but what is currently the best available and used to make clinical decisions, these numbers show that a subset of patients may already have or develop a clonally more aggressive phenotype secondary to chemotherapy pressures. Recent genomic analyses suggest that selective pressure from platinum-based chemotherapy shapes the evolution and clonal architecture of urothelial cancer [23, 24]. In our cohort, it was found that the median time from diagnosis to RC for those who received NAC was 21.7 weeks compared to a median of 7.3 weeks for those who received RC alone and 6.1 weeks for those treated with RC + AC. With a relatively short median time from diagnosis to RC, those treated with RC alone should have similar clinical and pathological stages. However, this was the case in only 52% of these patients. This large discrepancy exemplifies how current staging techniques are suboptimal and more accurate solutions are needed since tumor staging is widely used to assess which patients should receive NAC.
With the implementation of reliant biomarkers for resistance to NAC, patients unlikely to benefit from NAC would be spared from the potential toxicities of chemotherapy and the delay in proceeding with potentially curative surgery. Indeed, several groups have developed genetic or genomic biomarkers predictive of a pathologic complete response with NAC, an intermediate endpoint associated with improved OS [25–28]. Multiple efforts are being made to identify markers for chemotherapy sensitivity. Several studies have identified potential markers such as ERCC2 and DNA damage repair genes (DDR) [29, 30]. As our data shows, NAC + RC does have an overall survival benefit in all comers when compared to RC alone or RC + AC. Unfortunately, a subset of patients will be resistant to NAC and harbor the worst outcomes.These data make the argument for markers that are optimized for identifying resistance, which may be needed to refine NAC treatment algorithms and allow for selection of these patients to possibly be enrolled into trials of novel therapeutic regimens with or without surgical intervention.
Throughout this study, multiple efforts were made to both reduce bias and strengthen our results. Our study and subsequent analyses are prone to selection-bias, which we attempted to correct for by balancing known confounders between both groups using a PS-adjusted analysis. The retrospective nature of this study brings along several limitations that must be addressed. Furthermore, additional survival outcome measurements, such as cancer-specific mortality and disease-free survival, are missing from this data set which limit further analysis, and only allow overall survival to be analyzed. Data regarding specific chemotherapy regimens is also limited, including agents used and number of treatment cycles, all of which may impact our findings. We limited this bias by only including patients who received at least 2 agents and within a specific time period from surgery. One potential future study is to restage patients after 2 cycles of neoadjuvant chemotherapy, if response is identified to proceed with completion of NAC prior to RC, if residual cT3 or cT4 proceed to RC or switch to immunotherapy.
CONCLUSIONS
We found that patients with residual extra vesical disease after NAC treatment have a worse survival after RC than patients treated with RC alone or RC followed by AC. Several factors may contribute to these findings, including selective pressures of aggressive tumor clones. These data emphasize the importance of continued investigation to identify biomarkers of resistance to NAC in order to optimize the individualized treatment of patients with MIBC.
ACKNOWLEDGMENTS
The authors have no acknowledgments.
FUNDING
The authors report no funding.
AUTHOR CONTRIBUTIONS
JLP: Conception, data collection, data analysis, data interpretation, manuscript writing. FA: Conception, data collection, data analysis, data interpretation, manuscript writing. AM: Conception, data analysis, data interpretation, manuscript writing. NT: Data analysis, manuscript writing. IP: Manuscript writing. JD: Data interpretation, manuscript writing. KA: Manuscript writing. NW: Conception, data interpretation, manuscript writing. RM: Conception, data interpretation, manuscript writing. PW: Conception, data interpretation, manuscript writing. MDG: Conception, data interpretation, manuscript writing. JPS: Conception, data interpretation, manuscript writing.
CONFLICT OF INTEREST
NW - Astellas Pharma Inc. (Industry sponsored lecture).
MDG –Stock and other ownership interests: Rappta Therapeutics; Consulting or Advisory Role: BioMotiv, Janssen, Dendreon, Merck, GlaxoSmithKline, Lilly, Astellas Pharma, Genentech, Bristol-Myers Squibb, Novartis, Pfizer, EMD Serono, AstraZeneca, Seattle Genetics, Incyte, Aileron Therapeutics, Dracen, Inovio Pharmaceuticals, NuMab, Dragonfly Therapeutics;Research Funding: Janssen Oncology, Dendreon, Novartis, Bristol-Myers Squibb, Merck, AstraZeneca, Genentech/Roche;Patents, Royalties, Other Intellectual Property: METHODS AND COMPOSITIONS FOR TREATING CANCER AND RELATED METHODS. MOUNT SINAI SCHOOL OF MEDICINE July 2012 Application number: 20120322792.
JPS - Pfizer Inc. (Industry sponsored lecture).
The other authors have no conflicts of interest to report.
REFERENCES
[1] | Siegel RL , Miller KD , Jemal A . Cancer statistics, 2020. CA Cancer J Clin. (2020) ;70: (1):7–30. |
[2] | Nielsen ME , Smith AB , Meyer AM , Kuo TM , Tyree S , Kim WY , et al. Trends in stage-specific incidence rates for urothelial carcinoma of the bladder in the United States: 1988 to 2006. Cancer. (2014) ;120: (1):86–95 . |
[3] | Sylvester RJ , van der Meijden AP , Oosterlinck W , Witjes JA , Bouffioux C , Denis L , et al. Predicting recurrence and progression in individual patients with stage Ta T1 bladder cancer using EORTC risk tables: a combined analysis of 2596 patients from seven EORTC trials. Eur Urol. (2006) ;49: (3):75–7. |
[4] | Stein JP , Lieskovsky G , Cote R , Groshen S , Feng AC , Boyd S , et al. Radical cystectomy in the treatment of invasive bladder cancer: long-term results in 1,054 patients. J Clin Oncol. (2001) ;19: (3):666–75. |
[5] | Grossman HB , Natale RB , Tangen CM , Speights VO , Vogelzang NJ , Trump DL , et al. Neoadjuvant chemotherapy plus cystectomy compared with cystectomy alone for locally advanced bladder cancer. N Engl J Med. (2003) ;349: (9):859–66. |
[6] | Advanced Bladder Cancer Meta-analysis C. Neoadjuvant chemotherapy in invasive bladder cancer: update of a systematic review and meta-analysis of individual patient data advanced bladder cancer (ABC) meta-analysis collaboration. Eur Urol. (2005) ;48: (2):202–5; discussion 5-6. |
[7] | Reardon ZD , Patel SG , Zaid HB , Stimson CJ , Resnick MJ , Keegan KA , et al. Trends in the use of perioperative chemotherapy for localized and locally advanced muscle-invasive bladder cancer: a sign of changing tides. Eur Urol. (2015) ;67: (1):165–70. |
[8] | Zaid HB , Patel SG , Stimson CJ , Resnick MJ , Cookson MS , Barocas DA , et al. Trends in the utilization of neoadjuvant chemotherapy in muscle-invasive bladder cancer: results from the National Cancer Database. Urology. (2014) ;83: (1):75–80. |
[9] | Liew MS , Azad A , Tafreshi A , Eapen R , Bolton D , Davis ID , et al. USANZ: Time-trends in use and impact on outcomes of perioperative chemotherapy in patients treated with radical cystectomy for urothelial bladder cancer. BJU Int. (2013) ;112: (2):74–82. |
[10] | Bhindi B , Frank I , Mason RJ , Tarrell RF , Thapa P , Cheville JC , et al. Oncologic Outcomes for Patients with Residual Cancer at Cystectomy Following Neoadjuvant Chemotherapy: A Pathologic Stage-matched Analysis. Eur Urol. (2017) ;72: (5):660–4. |
[11] | Bandini M , Briganti A , Plimack ER , Niegisch G , Yu EY , Bamias A , et al. Modeling 1-year Relapse-free Survival After Neoadjuvant Chemotherapy and Radical Cystectomy in Patients with Clinical T2-4N0M0 Urothelial Bladder Carcinoma: Endpoints for Phase 2 Trials. Eur Urol Oncol. (2019) ;2: (3):248–56. |
[12] | Winchester DP , Stewart AK , Phillips JL , Ward EE . The national cancer data base: past, present, and future. Ann Surg Oncol. (2010) ;17: (1):4–7. |
[13] | Winchester DP , Stewart AK , Bura C , Jones RS . The National Cancer Data Base: a clinical surveillance and quality improvement tool. J Surg Oncol. (2004) ;85: (1):1–3. |
[14] | Austin PC . An introduction to propensity score methods for reducing the effects of confounding in observational studies. Multivariate Behav Res. (2011) ;46: (3):399–424. |
[15] | Giobbie-Hurder A , Gelber RD , Regan MM . Challenges of guarantee-time bias. J Clin Oncol. (2013) ;31: (23):2963–9. |
[16] | Martini A , Jia R , Ferket BS , Waingankar N , Plimack ER , Crabb SJ , et al. Tumor downstaging as an intermediate endpoint to assess the activity of neoadjuvant systemic therapy in patients with muscle-invasive bladder cancer. Cancer. (2019) ;125: (18):3155–63. |
[17] | Dash A , Pettus JAt , Herr HW , Bochner BH , Dalbagni G , Donat SM , et al. A role for neoadjuvant gemcitabine plus cisplatin in muscle-invasive urothelial carcinoma of the bladder: a retrospective experience. Cancer. (2008) ;113: (9):2471–7. |
[18] | Rosenblatt R , Sherif A , Rintala E , Wahlqvist R , Ullen A , Nilsson S , et al. Pathologic downstaging is a surrogate marker for efficacy and increased survival following neoadjuvant chemotherapy and radical cystectomy for muscle-invasive urothelial bladder cancer. Eur Urol. (2012) ;61: (6):1229–38. |
[19] | International Collaboration of T, Medical Research Council Advanced Bladder Cancer Working P, European Organisation for R, Treatment of Cancer Genito-Urinary Tract Cancer G, Australian Bladder Cancer Study G, National Cancer Institute of Canada Clinical Trials G, et al. International phase III trial assessing neoadjuvant cisplatin, methotrexate, and vinblastine chemotherapy for muscle-invasive bladder cancer: long-term results of the BA06 30894 trial. J Clin Oncol. (2011) ;29: (16):2171–7. |
[20] | Lavery HJ , Stensland KD , Niegisch G , Albers P , Droller MJ . Pathological T0 following radical cystectomy with or without neoadjuvant chemotherapy: a useful surrogate. J Urol. (2014) ;191: (4):898–906. |
[21] | Petrelli F , Coinu A , Cabiddu M , Ghilardi M , Vavassori I , Barni S . Correlation of pathologic complete response with survival after neoadjuvant chemotherapy in bladder cancer treated with cystectomy: a meta-analysis. Eur Urol. (2014) ;65: (2):350–7. |
[22] | Zargar H , Espiritu PN , Fairey AS , Mertens LS , Dinney CP , Mir MC , et al. Multicenter assessment of neoadjuvant chemotherapy for muscle-invasive bladder cancer. Eur Urol. (2015) ;67: (2):241–9. |
[23] | Liu D , Abbosh P , Keliher D , Reardon B , Miao D , Mouw K , et al. Mutational patterns in chemotherapy resistant muscle-invasive bladder cancer. Nat Commun. (2017) ;8: (1):2193. |
[24] | Faltas BM , Prandi D , Tagawa ST , Molina AM , Nanus DM , Sternberg C , et al. Clonal evolution of chemotherapy-resistant urothelial carcinoma. Nat Genet. (2016) ;48: (12):1490–9. |
[25] | Van Allen EM , Mouw KW , Kim P , Iyer G , Wagle N , Al-Ahmadie H , et al. Somatic ERCC2 mutations correlate with cisplatin sensitivity in muscle-invasive urothelial carcinoma. Cancer Discov. (2014) ;4: (10):1140–53. |
[26] | Iyer G , Balar AV , Milowsky MI , Bochner BH , Dalbagni G , Donat SM , et al. Multicenter Prospective Phase II Trial of Neoadjuvant Dose-Dense Gemcitabine Plus Cisplatin in Patients With Muscle-Invasive Bladder Cancer. J Clin Oncol. (2018) ;36: (19):1949–56. |
[27] | Pietzak EJ , Bagrodia A , Cha EK , Drill EN , Iyer G , Isharwal S , et al. Next-generation Sequencing of Nonmuscle Invasive Bladder Cancer Reveals Potential Biomarkers and Rational Therapeutic Targets. Eur Urol. (2017) ;72: (6):952–9. |
[28] | Plimack ER , Dunbrack RL , Brennan TA , Andrake MD , Zhou Y , Serebriiskii IG , et al. Defects in DNA Repair Genes Predict Response to Neoadjuvant Cisplatin-based Chemotherapy in Muscle-invasive Bladder Cancer. Eur Urol. (2015) ;68: (6):959–67. |
[29] | Kim J , Mouw KW , Polak P , Braunstein LZ , Kamburov A , Kwiatkowski DJ , et al. Somatic ERCC2 mutations are associated with a distinct genomic signature in urothelial tumors. Nat Genet. (2016) ;48: (6):600–6. |
[30] | Desai NB , Scott SN , Zabor EC , Cha EK , Hreiki J , Sfakianos JP , et al. Genomic characterization of response to chemoradiation in urothelial bladder cancer. Cancer. (2016) ;122: (23):3715–23. |


